Article

Are We Putting the Money in the Right Pocket? Ascertaining the Eventual Relationship between Silvoagricultural Subsidies, Ecosystem Threats, and Ecosystem Services in Chile

by
Cristian Pérez
1,2,*,
Patricio Pliscoff
3,4,5,6 and
Javier A. Simonetti
1
1
Departamento de Ciencias Ecológicas, Facultad de Ciencias, Universidad de Chile, Las Palmeras 3425, Santiago 7800003, Chile
2
Programa de Doctorado en Ciencias Silvoagropecuarias y Veterinarias, Campus Sur Universidad de Chile, Santa Rosa 11315, La Pintana 8820808, Chile
3
Facultad de Historia, Geografía y Ciencia Política, Instituto de Geografía, Pontificia Universidad Católica de Chile, Avenida Vicuña Mackenna 4860, Santiago 7820436, Chile
4
Departamento de Ecología, Facultad de Ciencias Biológicas, Pontificia Universidad Católica de Chile, Alameda 340, Santiago 8331150, Chile
5
Center of Applied Ecology and Sustainability (CAPES), Pontificia Universidad Católica de Chile, Santiago 8331150, Chile
6
Institute of Ecology and Biodiversity (IEB), Las Palmeras 3425, Ñuñoa, Santiago 7800003, Chile
*
Author to whom correspondence should be addressed.
Sustainability 2023, 15(1), 744; https://doi.org/10.3390/su15010744
Submission received: 8 November 2022 / Revised: 23 December 2022 / Accepted: 28 December 2022 / Published: 31 December 2022
(This article belongs to the Section Sustainable Agriculture)

Abstract

:
Due to the Aichi targets, the international community committed to the sustainable management of silvoagricultural activities and to the elimination or reform of detrimental subsidies relative to biodiversity conservation. In this context, countries should have implemented specific actions to address these commitments. In Chile, the Instruments of Productive Promotion to Finance Field Work (IPP-FFW) framework was used to fund activities related to silvoagricultural systems, including, irrigation, plantations with exotic species, and the recovery of soils. However, concerns have been raised that are associated with the need for evaluating their effectiveness, including whether impact assessments should be carried out systematically. Considering that these subsidized activities may negatively impact nature, whether IPP-FFWs had been allocated is analyzed regardless of the threat degree of terrestrial ecosystems at the commune level in Chile using the International Union for Conservation of Nature (IUCN) ecosystem risk assessment methodology; moreover, the eventual relationship between changes in land use and ecosystem service provisions in case study for the Biobio region in Chile is also examined, for which the monetary consequences of the loss of ecosystem services—via the analysis of benefit transfers—are calculated. Evidence reveals that higher amounts of IPP-FFWs are allocated in communes with higher levels of threats and that a decrease in ecosystem service provision is associated with IPP-FFW’s allocation.

1. Introduction

Global public spending in agricultural subsidies has been a constant feature of governmental policies. Subsidies are granted in order to influence the use of resources in the pursuit of different policy goals [1]. Agricultural subsidies are economic interventions and policies oriented toward protecting the agricultural sector, assuming that subsidies might release farms from constraints due to rural market imperfections and enhancing their agricultural productivity [2].
Agricultural subsidies have been pervasive in developed countries, and they are becoming increasingly pervasive in emerging economies [1]. Although negative environmental and social impacts have been widely described [3,4,5], subsidies continue to be granted globally. During 2018–2020, USD 720 billion was allocated per year by OECD and EU countries and 12 emerging economies [6]. In that context, it has been argued that until the need for removing perverse subsidies is accepted, the problem of excessive global land-use change, which is behind the continuing loss of terrestrial ecological capital, will not be addressed [7].
In Chile, from 2013 to 2021, the contribution of forestry and agricultural activities to the gross domestic product (GDP) averaged 3.3% [8], and in terms of occupation, it reaches 9.2% [9], which evidence the importance of the sector in the Chilean economy. In that context, during the period 2018–2020, it was evidenced that half of the public expenditures relative to the agricultural sector in Chile were used to finance off-farm irrigation infrastructure, inspection and control, land access and restructuring, agricultural knowledge, and innovation systems. Moreover, those payments target mostly small-scale agriculture and indigenous farmers; despite the fact that these payments aim to improve productivity, competitiveness, the recovery of degraded soils, and on-farm irrigation systems, our focus should be aimed at their effectiveness, and impact assessments should be carried out systematically, as these payments account for about half of public outlays directed at the sector [6].
In the last two decades, the Instruments of Productive Promotion used to finance direct silvoagricultural activities have more than quintupled in Chile, reaching USD ca. 3.25 billion only for the 15 IPPs allocated for financing field work activities (IPP-FFWs). The main activities funded are related to land-use change, irrigation promotion, and forestry plantations with exotic species [10]. These same activities have been associated with the main anthropic factors that have caused the degradation of natural terrestrial ecosystems in Chile [11,12].
It must be noted that according to an evaluation conducted by the Economic Commission for Latin America and the Caribbean and the Organisation for Economic Co-operation and Development (Cepal/OECD) in 2016, the effects that irrigation subsidies exert on both sustainability and groundwater recharge have not been evaluated. Moreover, irrigation subsidies do not incorporate any environmental criteria for its allocation, allowing the drainage of wetlands or the installation of watering systems on pronounced slopes, which are activities harmful to biodiversity; moreover, they were identified as detrimental subsidies for biological diversity [13]. Furthermore, the impacts of forestry plantations on natural ecosystems in Chile and its role as a driver of land-use change are well documented [14,15]. In fact, because of land-use changes, 50% of the total terrestrial ecosystems of Chile are threatened, and these are mostly located in the central–south part of the country [16].
Changes in land use can critically affect the provision of ecosystem services [17]. However, the impacts of land-use change on ecosystem services is poorly understood [18]. Understanding and quantifying the linkages between incentives on land-use change and of land-use change on ecosystem services is essential in order to analyze and subsequently develop incentives schemes that are synergistic and avoid tensions [19]. At the international level, the possible detrimental effects of subsidy policies that support the conversion of natural landforms into agricultural lands are documented [20]. Therefore, considering ecosystem services in land use and management must be linked to incentives that accurately reflect social and environmental returns [21]. In this regard, to avoid the depletion of natural capital, both reactive and proactive strategies should be implemented [22].
In Chile, the loss of provision of ecosystems services has been linked to the loss of diversity with respect to native forest habitats, and this was the most important reduction on erosion control, which was followed by organic matter accumulation and water supply [23]. In the same line, a bibliographic review of land-use changes and their impacts on ecosystem services in central Chile showed that most sensitive services were water supply, atmospheric regulation, the provision of fuel material, nutrients regulation, and shelter provision [24].
Within this context, we aim to elucidate if IPP-FFWs are being allocated according to the degree of threat they could pose to terrestrial ecosystems at the commune level in Chile; also, the eventual relationship between changes in land use and ecosystem service provisions in a case study at the Biobio region in Chile will be examined. In this regard, it was hypothesized that given the Chilean commitments to the CDB, IPP-FFWs should not be allocated in threatened ecosystems because of the decapitalization effects that this situation could imply; moreover, IPP-FFW allocations convey a reduction in ecosystem service provision that is higher than the money granted for financing silvoagricultural activities via IPP-FFWs.
We expect to assess IPP-FFWs allocation patterns and the eventual links with biodiversity and ecosystem services in order to generate information for supporting the creation of public policies on silvoagricultural matters in Chile.

2. Materials and Methods

Information about allocations at the communal level of the Instruments of Productive Promotion used to Finance Field Work (IPP-FFWs) in the silvoagricultural sector in Chile was obtained via requests for information from the Chilean authorities in charge of granting IPP-FFWs, as described in Pérez and Simonetti [10]. All IPP-FFWs analyzed can potentially and negatively impact biodiversity via silvoagricultural intensification that subsequently can lead to changes in land use (LUC), including forestation, irrigation and drainage promotion, and the use of fertilizers or soil amendment among others. The results of the information received from governmental sources were calculated for each commune of the country when available. In order to harmonize information at the commune level, a unique territorial code (CUT) was used. Given the fact that the amounts of each IPP-FFW granted by Chilean agencies were received in Chilean pesos (CLP), they were converted to USD firstly by using the Consumers Price Index (IPC in Spanish) to adjust the value of the currency for the period within which the information was received and later by using an exchange rate of USD 1 = CLP 738 Chilean pesos to convert it into USD.
For the purposes of this analysis, it is important to highlight that the allocation of one of the single most important IPP-FFWs in Chile (Conaf LD 701), both in terms of allocated amounts and on the impacts on ecosystems, was not included given the fact that the National Forestry Corporation (Conaf) did not provide information at the communal level of this instrument used to promote forestation with exotic species. Moreover, information for other two IPP-FFWs (Fund for the Improvement of Health Heritage, SAG, used among other purposes to equipment acquisition in order to improve agricultural projects; and Adaptation to Climate Change through Sustainable Agriculture, FIA, used to fund, among others, projects associated with animal production, agroforestry models, and irrigation practices) was not used in the analysis for the same reason. Therefore, the total IPP-FFW allocation in some communes might be underrepresented. The details of the IPP-FFWs used in this analysis can be observed in Table 1.
The conservation status of terrestrial ecosystems is based on Pliscoff [16], who assessed the conservation status of Chilean ecosystems at the regional level using the International Union for Conservation of Nature (IUCN) risk assessment methodology [25,26]. Results from that analysis were adapted from the regional level at the commune level, which is the smaller administrative unit in the country and where, in practice, subsidies are received. In this context, the criteria for the definition of the risk level by ecosystem are based on three criteria: historic loss and recent loss of habitat, ecosystem size, and degradation of the abiotic environment. The ecosystem’s status considered four levels of ordinal threats, including Not Endangered, Vulnerable, Endangered, and Critically Endangered. For this analysis, in the case of a commune-supporting ecosystem with different threat levels, a higher threat level was assumed as a precautionary consideration.
The data obtained for IPP-FFW’s allocation and conservation status at the commune level were subsequently analyzed using Spearman’s correlation coefficient. In order to corroborate whether the medians of amounts allocated were different, they were analyzed using the Kruskal–Wallis test.
In addition, landscape transformations are associated with silvoagricultural activities, and these are among other factors that are associated with the allocation of IPP-FFWs. Moreover, this transformation exhibits an expression of the provision of ecosystem services. A case study of the eventual relationship between the IPP-FFW’s allocation and land-use change patterns was performed by using the results of a study carried out by Vergara et al. [27] that analyzed both the temporal and spatial land-use change between 1998 and 2008 for the Biobio region in Chile, for which the monetary consequences of the loss of ecosystem services, via the calculation of benefit transfers using both methodology and values described by De Groot [28]; and Crespin and Simonetti [22], were examined. Those results were analyzed using Spearman’s correlation coefficient. The results also correlated with the gross domestic product (GDP) for the period 1998–2008 obtained from different governmental sources, including the Central Bank and the Office for Agricultural Studies and Policies (Odepa). This analysis was made in order to attempt quantifying the relationship between IPP-FFW allocation and the amount of money lost as ecosystem services in economic terms.

3. Results

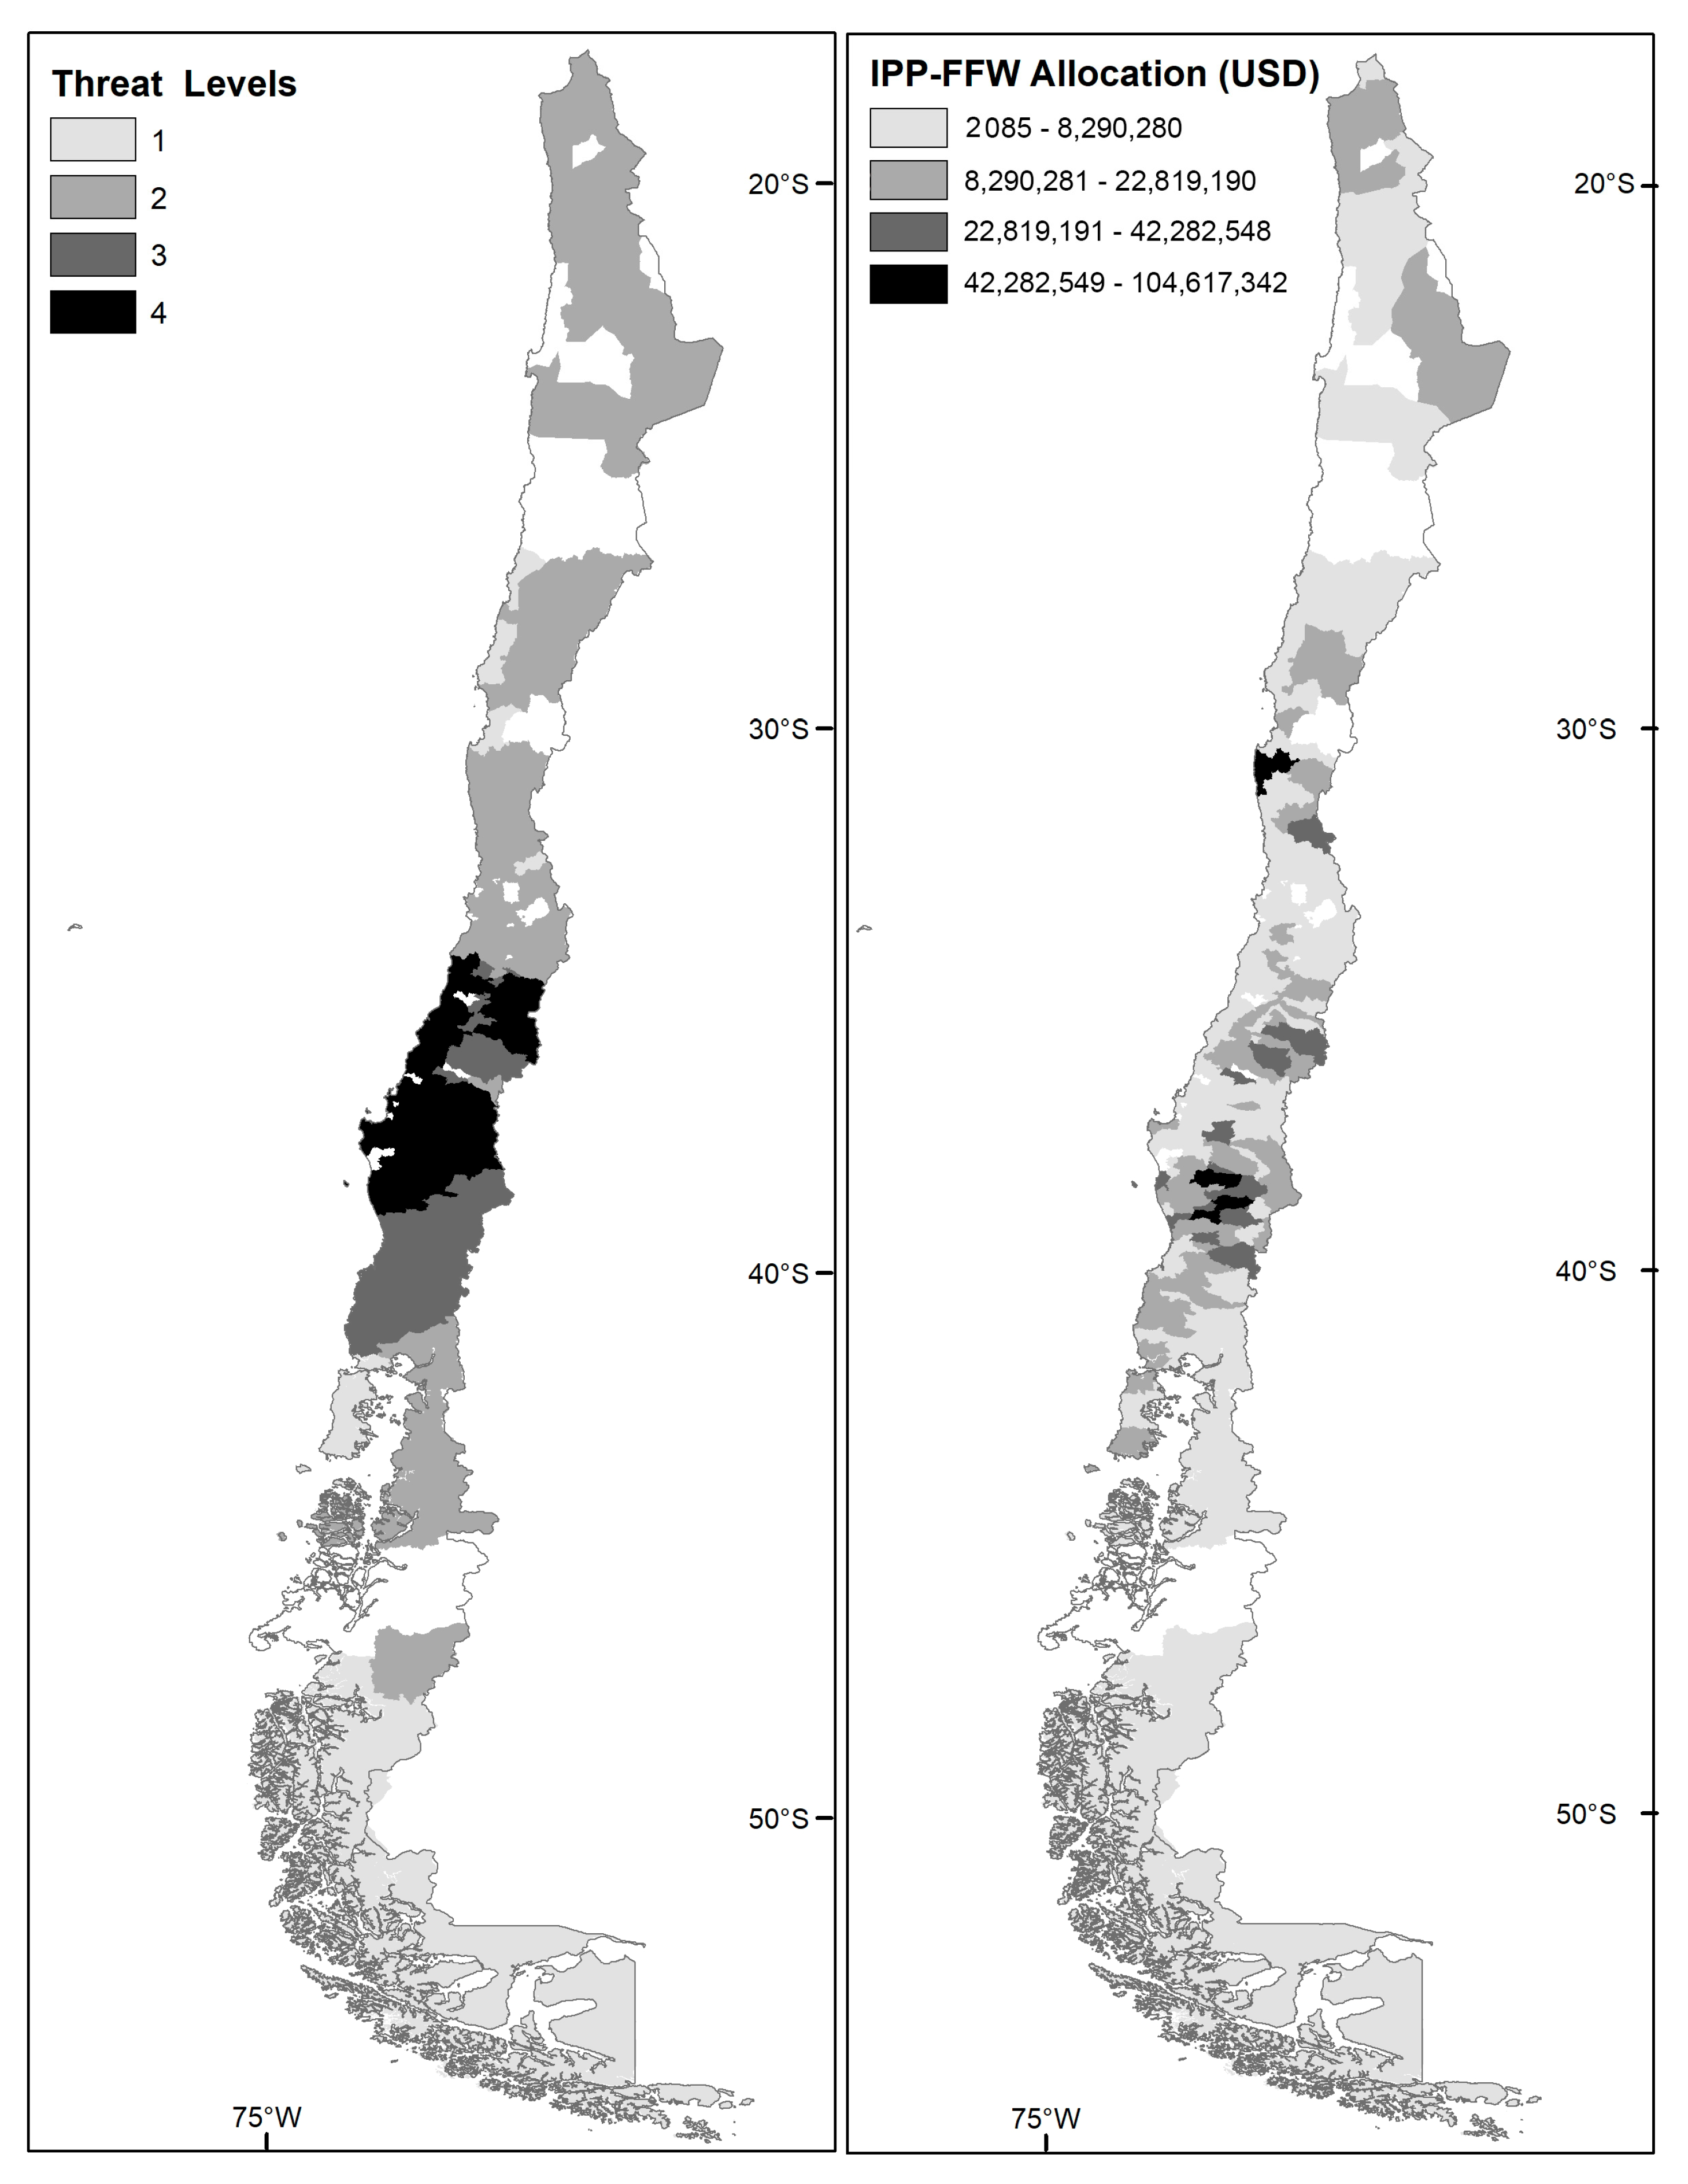
3.1. IPP-FFWs Allocation at the Commune Level in Chile

Governmental agencies provided information at the commune level for eight IPP-FFWs. The allocation of IPP-FFWs for those eight instruments reached ca. USD 2.5 billion for the period ranging from 1994 to 2019. The detail of the allocation calculated per each commune can be observed in Table S1.
In geographical terms, the allocation of IPP-FFWs associated with irrigation (CNR Law of Irrigation promotion, Conadi 20 C, and Indap PROM) has a wide distribution along the country, although it mostly concentrates in communes at the central–south zone (30–42° S), with some important amounts allocated in communes located in the northern part of the country (18°–27° S). The IPP-FFWs associated with land purchase for aboriginal communities (Conadi 20 A and 20 B) are concentrated both in terms of the number of communes and the amount in the central–south part of the country (36°–42° S).
Instruments associated with grassland management (PPSFR) concentrate in central–south Chile (30°–42° S), while the one related to agricultural soils (SIRSD-S) also has a wide distribution in the country, although it is concentrated in the central–south zone (30°–42° S), with some high amounts allocated in communes located in the north part of the country (18°–27° S).
IPP-FFWs associated with forest management (CONAF Law 20.283) is concentrated both in terms of the number of communes and the amount granted in the central–south of Chile (33°–42° S). (Figure 1).

3.2. Threats at the Commune Level

Chile currently has 346 communes. Of these, a total of 301 (87%) provide available data with respect to IPP-FFW allocation at the commune level. In that scenario, in relation to threat levels from communes providing information, 269 (89%) were classified as being in some sort of risk level, including 39.5% that are classified as Vulnerable, 19.6% as Endangered, and 30.2% as Critically Endangered (Figure 2).
The distribution of communes with some sort of threat level is allocated all along the country with a substantial concentration in central Chile in an area that ranges from 30° to 41° S. Communes that are Critically Endangered (91 out of 301) are concentrated in an area from 34° to 39° S. This encompasses five regions of the country, including O’Higgins, Maule, Ñuble, Biobio, and La Araucanía, where the Biobio region alone comprises 32% of the Critically Endangered communes (Figure 3a). The representation of the added allocated amounts of IPP-FFWs per commune can be observed at Figure 3b.
In terms of allocated funds, the aggregated highest total amount granted during a period that spans from 1994 to 2019 corresponds to communes categorized as Critically Endangered (n = 91), followed by Endangered (n = 59), Vulnerable (119), and Not Endangered (32). The average amount allocated is higher in Endangered communes, followed by Critically Endangered and then Vulnerable and Not Endangered (Table 2).
The median of the amount allocated is higher for communes classified as Endangered followed by communes classified as Critically Endangered, while communes categorized as Vulnerable and Not Endangered are similar (Kruskal–Wallis H = 64.34, p = 6.621 × 10⁻¹⁴) (Figure 4).
Level of threat of ecosystems is positively correlated to the amount of IPP-FFWs allocated for the 301 communes (rs = 0.29; p = 0.2 × 10⁻⁷). The highest correlation occurs for 20 A, a subsidy oriented toward land purchase to solve land problems for indigenous communities granted by Conadi; then, this was followed by SIRSD-S, which is an incentive for agri-environmentally sustainable agricultural soils granted by Indap; 20 B, a subsidy for the acquisition of land for indigenous granted by Conadi; and PPSRF, which is an incentive for supplementing grasslands as forage resources granted by Indap. The status was unrelated to investments under the Law of Irrigation Promotion (CNR), 20 C (Conadi), PROM (Indap), and Law 20283 (Conaf) (Table 3).
In addition, the total amount of IPP-FFWs allocated and the total communal surface are not correlated (r = −0.03; p = 0.64), while the conservation status and the total amount of IPP-FFWs allocation per square km is positively correlated (rs = 0.36; p = 1 × 10⁻¹⁰).

3.3. Land-Use Change in the Biobio Region

Based on Vergara et al. [27], in terms of surface, most notorious changes in land covers in the Chilean Biobio region, during the period from 1998 to 2008, were associated with forest plantations that increased their surfaces on 28%. On the other hand, agricultural lands decreased their surfaces by 14%, bushes and grasslands decreased by 22%, native forest decreased by 1%, and wetlands decreased by 3.5% (Table 4).
The estimated difference in the provision of ecosystem services, corresponding to land-use changes between 1998 and 2008 in the Biobio region and associated with natural types of land use including native forest, wetlands, and bushes and grasslands, evidenced a total decrease of ca. USD 433 million. The highest decrease in ecosystem service provisions was associated with bushes and grasslands, followed by native forests, and finally wetlands. Assuming a linear decay rate with respect to ecosystem service provisions and knowing only two points of the land cover changes for the Biobio region between 1998 and 2008, the calculated annual decrease corresponds to ca. USD 43 million (Table 5).
Ecosystem service provisions are negatively correlated with IPP-FFW allocations for the period 1998–2008 (rs = −0.85,; p = 0.001). On the contrary, the silvoagricultural gross domestic product is positively correlated with IPP-FFW’s allocation (rs = 0.71; p = 0.016). In addition, the correlation between ecosystem services provision and silvoagricultural gross domestic products for the Biobio region evidences a negative correlation (rs = − 0.73; p = 0.013) (Table 6).

4. Discussion

Despite the well-documented environmental impacts of agricultural subsidies, including biodiversity, they are a common practice all over the world. In addition, and notwithstanding commitments made by countries at the international level to eliminate or reform incentives that harm biodiversity, few governments have even identified them [29]. Chile is not an exception. There are no advances toward identifying detrimental subsidies relative to biodiversity [12]; moreover, there is also a lack of coordination of the instruments offered [30].
Current evidence reveals that there is a relationship between the level of threat of terrestrial ecosystems and the amount of IPP-FFWs allocated by the Chilean government at the communal level. In practical terms, this implies that public funds are invested in ecosystems that are already at risk. This is relevant considering that the identified drivers of biodiversity loss in Chile are related to silvoagricultural activities, including land-use change and cutting forests and plantations with exotic species [12]; therefore, the allocation of IPP-FFWs could be a factor that contributes to biodiversity loss in the country.
IPP-FFWs positively correlating with commune threat levels include instruments targeting both small-scale farmers and indigenous communities. Thus, this situation could be evidencing that the allocation of public funds for less-favored groups is materializing in areas facing higher levels of threat, and attention should be focused on their effectiveness [6]. In that context, the results of an analysis performed in 2010 of the IPP-FFW Conadi 20B allocation (Land Purchase to Solve Land Problems for Indigenous People) provided evidence that the policy did not effectively improve the communities’ standards of living and the levels of economic productivity [31].
IPP-FFW allocations in some communes are underrepresented because the amount granted for instrument LD 701 was not included in the analysis given the fact that Conaf, the agency in charge of its allocation, only provided information at the regional level. This is of particular importance since this instrument was used to promote forest plantations in Chile for almost 40 years and has been a cause of concern due to its environmental effects [32], the socio-environmental conflicts it generated during the years [33,34], and the lack of comprehensive evaluations relative to its use [35]. In the latter context, recent findings [36] demonstrate that the forest policy in Chile, via the implementation of DL 701, increased the poverty rate and a decrease in population in areas where it materialized, including the Biobio region, highlighting the need to consider the diversity of forest functions and services when developing incentive policies and the need to take into account these findings as a starting point in order to mitigate the negative effects of its application in any new forest policies that are in place.
In addition, the quantification of the monetary consequences of the ecosystem service provision, which was analyzed in the Biobio region, based on the work performed by Vergara et al. [27], evidenced a decrease of 9.6% during the 1998–2008 decade, and this was associated primarily with changes in the land coverage of bushes and grasslands, followed by native forest and wetlands, that coexist with increased forest plantations. In this context, it is worth observing that, during the period under analysis, the reduction in ecosystem service provisions was greater than the sum of the subsidies of IPP-FFWs allocated in the region.
Moreover, ecosystem service provisions are negatively correlated with the amounts of IPP-FFWs allocated in the Biobio region, and they positively correlated with the regional silvoagricultural gross domestic product. This is important considering that the Biobio region comprises most Critically Endangered ecosystems, which is measured by the IUCN risk assessment methodology, with 32% of the total communes concentrated under that condition at the national level.
Hence, in terms of the Chilean policy of subsidies for silvoagricultural activities, evidence suggests that IPP-FFWs are invested in ecosystems that are at risk and do not conduct proper assessments; therefore, they could be a factor for the decapitalization of natural ecosystems in the country, negatively impinging upon people as they are receiving decreasing amounts of natural benefits of ecosystem services. This is relevant considering that evidence indicates that services required by silvoagricultural activities are those that are particularly affected [24].
These are issues that must be considered at the policy level given the increasing number of support programs provided by regional governments that target rural populations, where improved co-ordination, communication, and accountability are needed between regional and national governments in order to avoid overlapping efforts and supports [37].
In relation to the first hypothesis posed for this research study, given the Chilean commitments to the CBD, IPP-FFWs should not be allocated in threatened ecosystems because of the decapitalization effects that this situation could cause, the data evidence that there is an allocation of some IPP-FFWs in threatened ecosystems; therefore, this hypothesis is disproved. Regarding the second hypothesis, data indicate that the reduction in ecosystem services during the period is higher than the money granted for financing silvoagricultural activities via IPP-FFWs; therefore, the second hypothesis is confirmed. These two conditions could be the decapitalizing factors of nature that indicate that money is going into the wrong pockets.

Supplementary Materials

The following supporting information can be downloaded at https://www.mdpi.com/article/10.3390/su15010744/s1, Table S1: IPP-FFWs allocation and conservation status by commune.

Author Contributions

C.P.: Conceptualization; methodology; formal analysis; investigation; data curation; writing—original draft preparation; writing—review and editing. P.P.: Methodology; formal analysis; writing—review. J.A.S.: Conceptualization; methodology; formal analysis; writing—review and editing. All authors have read and agreed to the published version of the manuscript.

Funding

This research received no external funding.

Data Availability Statement

Not applicable.

Acknowledgments

We thank Adriana Oñate for her help with data management. Additionally, we appreciate the comments from Cristian Estades, Miguel Castillo, and Guillermo Donoso for an earlier version of this manuscript.

Conflicts of Interest

The authors declare no conflict of interest.

References

  1. Bellmann, C. Subsidies and Sustainable Agriculture: Mapping the Policy Landscape; Chatham House: London, UK, 2019. [Google Scholar]
  2. Garrone, M.; Emmers, D.; Lee, H.; Olper, A.; Swinnen, J. Subsidies and agricultural productivity in the EU. Agric. Econ. 2019, 50, 803–817. [Google Scholar] [CrossRef]
  3. Atanasov, D.; Lubeniqi, G. Subsidies in agriculture and their influence on sustainability. Theory and methodology. Agric. Sci./Agrar. Nauk. 2019, 11, 29–34. [Google Scholar]
  4. Kaur, R.; Sharma, M. Agricultural Subsidies in India Boon or Curse. IOSR J. Humanit. Soc. Sci. 2012, 2, 40–46. [Google Scholar] [CrossRef]
  5. Merckx, T.; Pereira, H.M. Reshaping agri-environmental subsidies: From marginal farming to large-scale rewilding. Basic Appl. Ecol. 2015, 16, 95–103. [Google Scholar] [CrossRef] [Green Version]
  6. Organization for Economic Cooperation and Development, OECD. Agricultural Policy Monitoring and Evaluation 2021: Addressing the Challenges Facing Food Systems; OECD Publishing: Paris, France, 2021. [Google Scholar] [CrossRef]
  7. Barbier, E.B. The Policy Implications of the Dasgupta Review: Land Use Change and Biodiversity. Environ. Resour. Econ. 2022, 83, 911–935. [Google Scholar] [CrossRef]
  8. Oficina de Estudios y Políticas Agrarias, Odepa. Estadísticas Económicas; Oficina de Estudios y Políticas Agrarias: Santiago, Chile, 2022; Available online: https://www.odepa.gob.cl/estadisticas-del-sector/estadisticas-economicas (accessed on 10 January 2022).
  9. Oficina de Estudios y Políticas Agrarias, Odepa. Panorama de la Agricultura Chilena, Ministerio de Agricultura, Chile. 2019. Available online: https://www.odepa.gob.cl/wp-content/uploads/2019/09/panorama2019Final.pdf (accessed on 10 January 2022).
  10. Pérez, C.; Simonetti, J. Subsidy Accountability and Biodiversity Loss Drivers: Following the Money in the Chilean Silvoagricultural sector. Sustainability 2022, 14, 15411. [Google Scholar] [CrossRef]
  11. Ministerio del Medio Ambiente. Quinto Informe Nacional de Biodiversidad de Chile ante el Convenio sobre la Diversidad Biológica (CBD); Ministerio del Medio Ambiente: Santiago, Chile, 2014; 140p. [Google Scholar]
  12. Ministerio del Medio Ambiente. Sexto Informe Nacional de Biodiversidad de Chile ante el Convenio sobre la Diversidad Biológica (CDB); Ministerio del Medio Ambiente: Santiago, Chile, 2019; 220p. [Google Scholar]
  13. Comisión Económica para América Latina y el Caribe. Cepal/Organización para la Cooperación y el Desarrollo Económicos–OCDE. Evaluaciones del desempeño ambiental; Comisión Económica para América Latina y el Caribe: Santiago, Chile, 2016. [Google Scholar]
  14. Hermosilla-Palma, K.; Pliscoff, P.; Folchi, M. Sixty years of land-use and land-cover change dynamics in a global biodiversity hotspot under threat from global change. J. Land Use Sci. 2021, 16, 467–478. [Google Scholar] [CrossRef]
  15. Armesto, J.J.; Manuschevich, D.; Mora, A.; Smith-Ramirez, C.; Rozzi, R.; Abarzúa, A.M.; Marquet, P.A. From the Holocene to the Anthropocene: A historical framework for land cover change in southwestern South America in the past 15,000 years. Land Use Policy 2010, 27, 148–160. [Google Scholar] [CrossRef]
  16. Pliscoff, P. Aplicación de los criterios de la Unión Internacional para la Conservación de la Naturaleza (IUCN) para la evaluación de riesgo de los ecosistemas terrestres de Chile. Informe Técnico; Ministerio del Medio Ambiente: Santiago, Chile, 2015; 63p. [Google Scholar]
  17. Hasan, S.S.; Zhen, L.; Miah, M.G.; Ahamed, T.; Samie, A. Impact of land use change on ecosystem services: A review. Environ. Dev. 2020, 34, 100527. [Google Scholar] [CrossRef]
  18. Zheng, H.; Peng, J.; Qiu, S.; Xu, Z.; Zhou, F.; Xia, P.; Adalibieke, W. Distinguishing the impacts of land use change in intensity and type on ecosystem services trade-offs. J. Environ. Manag. 2022, 316, 115206. [Google Scholar] [CrossRef]
  19. Bryan, B.A. Incentives, land use, and ecosystem services: Synthesizing complex linkages. Environ. Sci. Policy 2013, 27, 124–134. [Google Scholar] [CrossRef] [Green Version]
  20. Shelef, O.; Stavi, I.; Zdruli, P.; Rachmilevitch, S. Land use change, a case study from southern Italy: General implications for agricultural subsidy policies. Land Degrad. Dev. 2016, 27, 868–870. [Google Scholar] [CrossRef]
  21. Polasky, S.; Nelson, E.; Pennington, D.; Johnson, K.A. The impact of land-use change on ecosystem services, biodiversity and returns to landowners: A case study in the state of Minnesota. Environ. Resour. Econ. 2011, 48, 219–242. [Google Scholar] [CrossRef]
  22. Crespin, S.; Simonetti, J.A. Loss of ecosystem services and the decapitalization of nature in El Salvador. Ecosyst. Serv. 2016, 17, 5–13. [Google Scholar] [CrossRef]
  23. Rodríguez-Echeverry, J.; Echeverría, C.; Oyarzún, C.; Morales, L. Impact of land-use change on biodiversity and ecosystem services in the Chilean temperate forests. Landsc. Ecol. 2018, 33, 439–453. [Google Scholar] [CrossRef]
  24. Paz, M. Efectos de los cambios de uso de suelo en la provisión de servicios ecosistémicos en Chile central. Seminario de Título entregado a la Universidad de Chile en cumplimiento parcial de los requisitos para optar al Título de Bióloga con mención en Medio Ambiente; Universidad de Chile. Facultad de Ciencias.Escuela de Pregrado: Santiago, Chile, 2021. [Google Scholar]
  25. Keith, D.A.; Rodríguez, J.P.; Rodríguez-Clark, K.M.; Nicholson, E.; Aapala, K.; Alonso, A.; Asmussen, M.; Bachman, S.; Basset, A.; Barrow, E.G.; et al. Scientific foundations for an IUCN Red List of Ecosystems. PLoS ONE 2013, 8, e62111. [Google Scholar] [CrossRef] [Green Version]
  26. Bland, L.M.; Keith, D.A.; Miller, R.M.; Murray, N.J.; Rodríguez, J.P. Guidelines for the Application of IUCN Red List of Ecosystems Categories and Criteria, version 1.1; IUCN International Union for Conservation of Nature: Gland, Switzerland, 2017. [Google Scholar] [CrossRef]
  27. Vergara Díaz, G.; Vázquez, V.S.; Herrera Machuca, M.Á. Análisis del Cambio Temporal y Espacial del Uso del Suelo en la Región Centro Sur de Chile. Ciência Florestal 2018, 28, 1831–1844. [Google Scholar] [CrossRef] [Green Version]
  28. De Groot, R.; Brander, L.; Van Der Ploeg, S.; Costanza, R.; Bernard, F.; Braat, L.; Christie, M.; Crossman, N.; Ghermandi, A.; Hein, L.; et al. Global estimates of the value of ecosystems and their services in monetary units. Ecosyst. Serv. 2012, 1, 50–61. [Google Scholar] [CrossRef]
  29. Dempsey, J.; Martin, T.; Sumaila, R. Subsidizing extinction? Conserv. Lett. 2020, 13, el2705. [Google Scholar] [CrossRef]
  30. Silva, I.; Sandoval, C. Desarrollo económico local/regional y fomento productivo: La experiencia chilena. Latin American and Caribbean Institute for Economic and Social Planning. Office of Development and Local Management. Economic Commission for Latin America and the Caribbean. Naciones Unidas, Santiago, Chile. 2005. Available online: https://digitallibrary.un.org/record/562558?ln=en (accessed on 10 January 2022).
  31. Bauer, K. Land versus Territory: Evaluating Indigenous Land Policy for the Mapuche in Chile. J. Agrar. Change 2016, 16, 627–645. [Google Scholar] [CrossRef]
  32. Uribe, S.; Estades, C.; Radeloff, V. Pine plantations and five decades of land use change in central Chile. PLoS ONE 2020, 15, e0230193. [Google Scholar] [CrossRef] [PubMed] [Green Version]
  33. Reyes, R.; Nelson, H. A Tale of Two Forests: Why Forests and Forest Conflicts are Both Growing in Chile. Int. For. Rev. 2014, 16, 379–388. [Google Scholar] [CrossRef] [Green Version]
  34. Salas, C.; Donoso, P.J.; Vargas, R.; Arriagada, C.A.; Pedraza, R.; Soto, D.P. The Forest Sector in Chile: An Overview and Current Challenges. J. For. 2016, 114, 562–571. [Google Scholar] [CrossRef] [Green Version]
  35. Heilmayr, R.; Echeverría, C.; Lambin, E.F. Impacts of Chilean forest subsidies on forest cover, carbon, and biodiversity. Nat. Sustain. 2020, 3, 701–709. [Google Scholar] [CrossRef]
  36. Cerda, R.; Gallardo-Cobos, R.; Sánchez-Zamora, P. An Analysis of the Impact of Forest Policy on Rural Areas of Chile. Forests 2020, 11, 1105. [Google Scholar] [CrossRef]
  37. Organization for Economic Cooperation and Development, OECD. Agricultural Policy Monitoring and Evaluation 2022: Reforming Agricultural Policies for Climate Change Mitigation; OECD Publishing: Paris, France, 2022. [Google Scholar] [CrossRef]
Figure 1. Territorial distribution of IPP-FFWs allocation at the commune level in Chile disaggregated by instruments. Dots represent individual communes. Gradation of the color indicates increasing levels of funding, as indicated at the upper left side of the figure.
Sustainability 15 00744 g001
Figure 2. Number of communes by threat level.
Sustainability 15 00744 g002
Figure 3. (a) Threat levels of Chilean ecosystems (1 Not Endangered; 2 Vulnerable; 3 Endangered, 4 Critically Endangered) and (b) IPP-FFW allocation at the commune level in Chile. Gradation of colors indicate increasing threat levels and increasing levels of funding as indicated in the boxes on the top-left part of each map in the figure (the total amount allocated in each commune was divided in four quartiles from minimum to maximum range). Spaces without color correspond to communes without information for the purposes of this analysis.
Sustainability 15 00744 g003
Figure 4. Median of total amounts by IPP-FFW in MM USD and level of threat (1—Not Endangered; 2—Vulnerable; 3—Endangered; 4—Critically Endangered). Diamonds are outliers.
Sustainability 15 00744 g004
Table 1. Details of IPP-FFWs granted by Chilean Agencies.
AgencyDetailed IPP-FFW
Institute for Agricultural Development (Indap)System of Incentives to the Agro-environmental Sustainability of Agricultural Soils (SIRSD-S)
Program of Minor Irrigation Works (PROM)
Program of Supplementary Grasslands as Forage Resource (PPSRF)
National Forestry Corporation (Conaf)Law 20.283 on Recuperation of Native Forest and Forest Promotion
National Irrigation Commission (CNR)Law of Irrigation Promotion
National Corporation for Indigenous Development (Conadi)Subsidy to the Acquisition of Land for Indigenous (20 A)
Land Purchase to Solve Land Problems (20 B)
Constitution, Regularization or Purchase of Water Rights or to Finance Works Oriented to Obtain that Resource (20 C)
Table 2. Level of threat, commune numbers, and amounts allocated from 1994 to 2019.
Level of ThreatN° of CommunesTotal Amount USDAverage Amount USD
132118,314,9353,697,342
2119494,890,9654,158,748
359858,493,59414,550,739
491917,823,32310,085,971
Table 3. Correlations between the amount of IPP-FFWs allocated and the conservation status of terrestrial ecosystems at the commune level in Chile.
IPP-FFWN° Communesrs p-Value
All added3010.290.2 × 10−7
20 A (Conadi)1110.190.04
20 B (Conadi)620.380.2 × 10−2
20 C (Conadi)1170.110.25
Law of Irrigation Promotion (CNR)2600.020.70
Ley 20,283 (CONAF)1800.130.07
PPSRF (INDAP)2220.180.8 × 10−2
PROM (INDAP)211<0.010.96
SIRSD-S (INDAP)2870.250.2 × 10−4
Table 4. Land covers change for the Biobio region during 1998–2008. Source: Adapted from Vergara et al. [27].
Types of Land UseSurface 1998
(ha)
Surface 2008
(ha)
Difference from 2008 to 1998
(ha)
Agricultural Land965,145829,508−135,637
Bushes and Grasslands637,163498,496−138,667
Forest Plantations958,6971,227,788269,091
Native Forest776,436768,552−7884
Wetlands12,02711,595−432
Areas without Vegetation133,976132,518−1458
Snow and Glaciers90,69290,468−224
Water Bodies52,55854,7422184
Table 5. Difference in environmental services (ES) provision Biobio region in 1998–2008. Source: Elaborated based on De Groot et al. [28]; Crespín and Simonetti [22].
Types of Land UseEcosystem Services (ES)
USD/ha/Year
Surface 1998
(ha)
Value ES 1998
(USD/Year)
Surface 2008
(ha)
Value ES 2008
(USD/Year)
Difference ES Provision 1998–2008 (USD)
Bushes and Grasslands2871637,1631,829,294,973498,4961,431,182,016398,112,957
Native Forest3013776,4362,339,401,668768,5522,315,647,17623,754,492
Wetlands25,68212,027308,877,41411,595297,782,79011,094,624
Total ES Provision4,477,574,0554,044,611,982−432,962,073
Table 6. IPP-FFWs, ecosystem services´ provision, and silvoagricultural gross domestic product (GDP) in the Biobio region 1997–2008.
Year xIPP-FFWs Year x (USD)ES Provision Year x + 1 (USD)GDP Year x + 1 (USD)
19973,418,3204,477,574,055390,880,759
19981,946,7644,434,277,848379,430,894
19996,032,4924,390,981,640406,029,810
20004,303,7414,347,685,433421,355,014
20012,885,3044,304,389,226434,214,092
20025,300,1214,261,093,019378,475,610
20035,651,6024,217,796,811405,589,431
20049,381,0774,174,500,604444,986,450
200510,914,7864,131,204,397491,956,640
200612,471,9794,087,908,189467,471,545
200713,779,7954,044,611,982452,005,420
Disclaimer/Publisher’s Note: The statements, opinions and data contained in all publications are solely those of the individual author(s) and contributor(s) and not of MDPI and/or the editor(s). MDPI and/or the editor(s) disclaim responsibility for any injury to people or property resulting from any ideas, methods, instructions or products referred to in the content.

