Article

“The Big One” Earthquake Preparedness Assessment among Younger Filipinos Using a Random Forest Classifier and an Artificial Neural Network

by
Ardvin Kester S. Ong
1,*,
Ferani Eva Zulvia
1 and
Yogi Tri Prasetyo
1,2,3
1
School of Industrial Engineering and Engineering Management, Mapua University, 658 Muralla Street, Intramuros, Manila 1002, Philippines
2
International Program in Engineering for Bachelor, Yuan Ze University, 135 Yuan-Tung Road, Taoyuan City 32003, Taiwan
3
Department of Industrial Engineering and Management, Yuan Ze University, 135 Yuan-Tung Road, Taoyuan City 32003, Taiwan
*
Author to whom correspondence should be addressed.
Sustainability 2023, 15(1), 679; https://doi.org/10.3390/su15010679
Submission received: 30 November 2022 / Revised: 24 December 2022 / Accepted: 26 December 2022 / Published: 30 December 2022

Abstract

:
Exploring the intention to prepare for mitigation among Filipinos should be considered as the Philippines is a country prone to natural calamities. With frequent earthquakes occurring in the country, “The Big One” has been predicted to damage the livelihood and infrastructure of the capital and surrounding cities. This study aimed to predict the intention to prepare for mitigation (IP) of “The Big One” based on several features using a machine learning algorithm ensemble. This study applied a decision tree, a random forest classifier, and artificial neural network algorithms to classify affecting factors. Data were collected using convenience sampling through a self-administered questionnaire with 683 valid responses. The results of this study and the proposed machine learning-based prediction model could be applied to predict the intention of younger Filipinos to prepare. The experimental results also revealed that the decision tree and the decision tree with random forest classifier showed understanding, perceived vulnerability, and perceived severity as factors highly affecting the IP of “The Big One”. The results of this study could be considered by the government to promote policies and guidelines to enhance the people’s IP for natural disasters. The algorithm could also be utilized and applied to determine factors affecting IP for other natural disasters, even in other countries.

1. Introduction

Natural disasters, such as earthquakes, are evident in the Philippines. Recently, a 6.7 magnitude hit to the south of the capital, which was followed by a 5.1 magnitude aftershock [1]. Different high-magnitude earthquakes have been recorded in the Philippines. The 1976 Moro Gulf earthquake was the largest with a 7.9 magnitude, which resulted in 17,000 casualties [2,3]. In 1990, the Luzon earthquake measured a 7.9 magnitude causing 4390 injuries and 1283 deaths. In addition, the 2019 Davao del Sur earthquake measured a 6.9 magnitude, while the 2021 Davao Occidental earthquake measured a 7.1 magnitude. The Philippine Institute of Volcanology and Seismology [4] reported that the country experiences 20 earthquakes per day. These are only some of the devastating earthquakes that the country has experienced.
The Philippines, as a developing country, has been safety planning and designing strategies to address the complex challenges brought about by earthquakes [5]. Yariyan et al. [5] noted that about 2 million casualties worldwide have been reported due to earthquake disasters. From these casualties, 6158 deaths were reported in the Philippines from 1599–2020 [6]. This is because the Philippines is surrounded by numerous active faults, such as the Western Philippine Fault, the South of Mindanao Fault, the Marikina/Valley Fault, the Central Philippine Fault, and the Eastern Philippine Fault.
Due to the five active faults that surround the Philippines, an anticipated massive earthquake has been detected—a movement that has been ongoing for 400 years. This massive earthquake has been called “The Big One”, and is anticipated to have a 7.2 magnitude. According to the PHILVOCS [4], it will start at the West Valley Fault and will hit the capital of the Philippines, including seven other cities and nearby provinces [2,7,8,9]. The anticipated damage that “The Big One” will cause and the numerous devastating earthquakes that have occurred in the Philippines have led to efforts to determine the preparedness and mitigation of Filipinos for this natural disaster.
Different studies have focused on natural calamities around the world. However, the mitigation and preparedness measurement of people and their behavior has been underexplored. Specifically, human factors that affect the intention to prepare, especially for “The Big One” utilizing machine learning algorithms, have not yet been considered. Williams et al. [10] stated that decades of research has focused more on the perception of risks in determining the recognition of hazards among people. Natural calamity preparedness for events such as earthquakes has not been studied [11]. Moreover, studies have been more frequently conducted on geophysical disasters, rather than on human behavior. The unexpected occurrence of “The Big One” should be considered as the predicted damage will be massive. Therefore, the need to analyze factors affecting mitigation to prepare for “The Big One” should be explored. Following different studies, constructs under the Protective Motivation Theory (PMT) and integrating the Theory of Planned Behavior (TPB) may be utilized to holistically measure people’s intention to prepare for a natural disaster [11,12,13].
In the Philippines, different studies have been conducted regarding natural disasters. Ong et al. [11] measured the intention to prepare for “The Big One”. The study utilized structural equation modeling (SEM) and found that knowledge, media, attitude, and subjective norms played an important role in the intention to prepare among Filipinos. However, some of the factors considered were indirectly significant factors. The study showed that perceived vulnerability and severity were indirect factors that also affected the intention to prepare. Due to the covariance measurement, there is still a need to extend the study to distinctly measure these factors. As explained by Fan et al. [14], SEM has a considerable number of limitations and disadvantages. It was indicated that the presence of mediating factors would affect the significance level of different latent variables involved in the framework. Since the study utilized the integration of PMT and TPB, mediating factors from both models were present; thereby causing indirect effects comparable to the direct effects. In accordance, the study by Woody [15] emphasized the low to no significance effect of factors that are far from the target output variable. The study of Ong et al. [11] further highlighted that the indirect effects were significant, and a machine learning algorithm, as suggested by German et al. [16], could uniformly analyze nonlinear relationships among factors under classification. Distinct affecting variables can be determined with the use of MLAs, such as a random forest classifier and an artificial neural network.
In another study, Kurata et al. [13] focused on the Taal volcano eruption in terms of response through action among Filipinos. It was highlighted in the study that the lack of preparedness in line with natural disasters has brought significant and continuous damage to the country. In addition, Gaillard [17] focused on Mt. Pinatubo, a volcanic risk perception study. A vague correlation was found concerning natural disasters that had occurred in the Philippines. Bolletino et al. [18] separately considered the perception of Filipinos regarding climate change and preparedness towards disaster. A clear representation of perception was not generalized in their study as a holistic measurement was not made. Moreover, Venable et al. [19] dealt with the risk perception of typhoons. The study highlighted the need to continuously measure people’s perceptions, which frequently change, and to focus on preparedness in countries like the Philippines, which constantly suffer from the aftermath of natural disasters [16]. From these studies, it could be seen that the Philippines is an area prone to natural disasters. As indicated by German et al. [16], Filipino’s adaptation to frequent natural disasters has impacted their low risk perceptions, which is relatively dangerous if locations are prone to damage in the aftermath. Therefore, predicting people’s awareness of natural disasters is important.
Other studies have utilized machine learning algorithms (MLA) focusing on natural disasters. MLA, such as the decision tree (DT) algorithm and an artificial neural network (ANN), have been utilized to predict factors in human decision-making. Yang and Zhou [20] stated that DTs have been widely used in data mining as a tool to predict dependent variables from a set of independent variables. This was determined by creating a tree-based classification for decision analysis. Milani et al. [21] utilized a decision tree algorithm to evaluate familiar risk protocols and protective factors among professional child removal. The results showed that DTs could be utilized to predict services affecting human behaviors. Kim et al. [22] utilized decision trees and the Random Forest Classifier (RFC) to classify seismic facies. The application of RFC increased the accuracy of the DT created. The results of their study helped to determine how reservoirs could be characterized and classified. In addition, Snehil and Goel [23] utilized DTs for flood damage analysis. They [23] also utilized the RFC to determine the best split among the different DTs created. With the utilization of the RFC, the accuracy of the results also increased. Lastly, Chen et al. [24] utilized DTRFC and ANN for the risk evaluation of a flood disaster in China.
In other studies, Zagajerski et al. [25] utilized three different MLAs to classify post-disaster forest species. For their study, a support vector machine presented the best results compared to the RFC and ANN. Their study focused on mapping and processing image datasets. Similar to the mapping study, Chen et al. [24] classified regional flood disasters with an RFC to screen import attributes, which were then further processed with a radial basis neural network. Both studies focused on image classification and provided high accuracies with the described MLAs. Moreover, Benemaran et al. [26] utilized a gradient boost for the prediction of a resilient modulus for the pavement foundation used in experimental and semi-empirical approaches. Their study suggested utilizing a metaheuristics approach with MLAs, such as a particle swarm optimization with a gradient boost. Results were still promising among MLAs when independently implemented. However, German et al. [16] justified that classification modeling, such as the RFC and ANN, may be used to assess behavioral studies in relation to natural disasters. However, their study focused more on preparedness for volcanic eruptions. Relative studies on the preparedness for and awareness of earthquakes have not yet been classified using MLAs.
An Artificial Neural Network (ANN) is a tool that has been utilized for pattern recognition to predict a target output. Moustra et al. [27] utilized ANN to predict earthquakes, and results showed that prediction could be more accurate if training was conducted with appropriate datasets. Kimes et al. [28] also utilized ANN for vegetation variables and stated that ANN could be utilized for generalized output to determine variables. Moreover, the ANN model could be utilized to predict even complex relationships. Oktarina et al. [29] utilized ANN for predicting earthquake damages and casualties in Indonesia. Their results showed that ANN could be utilized to predict the amount of damage to buildings and casualties to highlight preparedness among people in Indonesia. The lack of studies regarding the mitigation and preparedness among Filipinos, specifically regarding “The Big One”, by applying MLAs should be highlighted. As German et al. [16] were successful in predicting factors affecting preparedness for volcanic eruptions in the Philippines, a similar methodology was applied with the addition of justifying the limitations of DT compared to RFC—comparing the results with the ANN.
Specifically, this study applied a MLA to predict the intentions of young Filipinos to prepare for the mitigation of “The Big One”. The prediction was made based on several factors, such as understanding (U), perceived vulnerability (PV), perceived severity (PS), subjective norm (SN), perceived behavioral control (PBC), attitude (A), and media (M), adopted from Ong et al. [11]. Compared to this study, the present study simultaneously analyzed latent variables with higher calculation complexity for nonlinearly-related factors using a MLA. In the attempt to answer the limitations of SEM, this study specifically applied decision trees (DT), random forest classifiers (RFC), and artificial neural networks (ANN), which underwent optimization processes to measure the intention of young Filipinos to prepare for anticipated earthquakes such as “The Big One”. The results of this study could pave the way for utilizing the framework as a tool for measuring other natural disasters. Moreover, the MLA could also be considered to measure human factors and human behavior in terms of perceived intentions to prepare for other natural disasters.
For the clarity of the study, several research questions were created in line with the objectives as follows:
  • Will the random forest classifier surpass the accuracy rate of the basic decision tree as claimed by related studies in line with earthquake preparedness?
  • Will the results of the different MLAs be similar for factors affecting earthquake preparedness?
  • Can nonlinear relationship frameworks be effectively assessed by MLAs?
  • Are the results different from SEMs and MLAs?
  • How can the results be practically applied by the Philippines for disaster preparedness?
Focusing on these questions, the research was aligned to obtain specific answers using the methodology and results obtained from this study. The different sections of the paper are as follows: (1) introduction; (2) theoretical framework; (3) methodology; (4) results; (5) discussion; and (6) conclusion.

2. Theoretical Framework
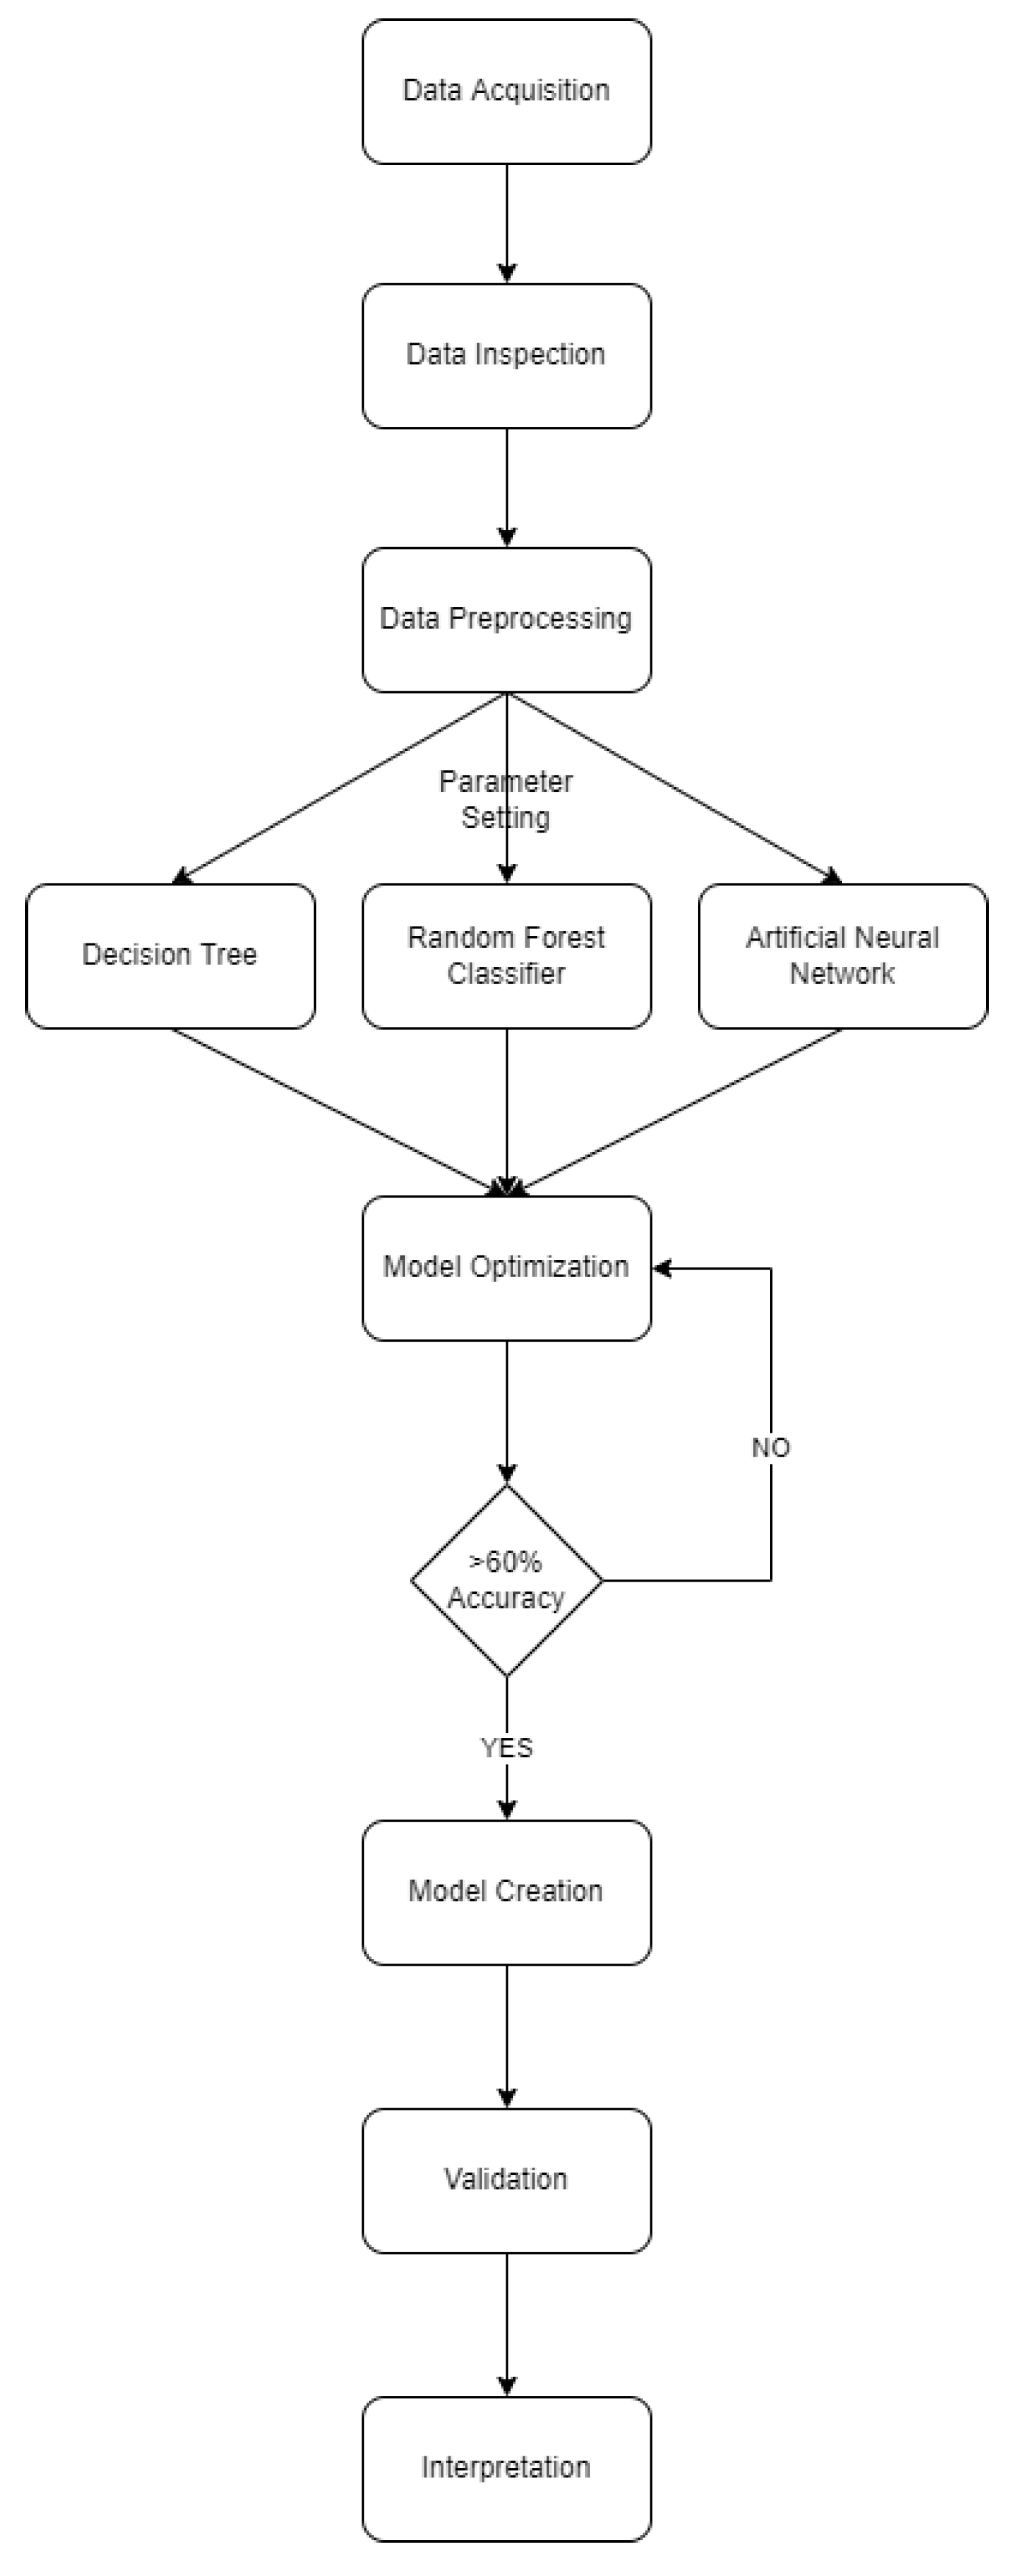
Theories such as the Planned Behavior and Protection Motivation Theory have been widely utilized in different studies to measure people’s intentions to prepare before and during a natural disaster. Protection Motivation Theory (PMT) considers the fear appeal and appraisal for coping, and was designed to measure health-related behaviors and protection behaviors in disasters [12,13,30,31]. Vinnell et al. [32] and Becker et al. [33] utilized PMT to measure preparation intentions for earthquakes. Their study focused on the necessary information people have regarding natural disasters. The risk perception and adaptation behaviors of farmers were also considered using PMT [34]. Therefore, perceived severity and perceived vulnerability were considered in the framework of the study. Moreover, the understanding of an individual towards a certain concept—in this study, “The Big One” earthquake, its aftermath, and impact—was included as part of the PMT model. As indicated by German et al. [16], a significant impact on the behavioral characteristics of protection motivation is people’s understanding of the devastation a natural disaster may incur. In addition, PMT was utilized together with TPB by Kurata et al. [13], Prasetyo et al. [31], and Ong et al. [11] in evaluating Filipinos’ perception of risk and preparedness for natural disasters and calamities.
TPB is a theory focused on predicting the behavior of individuals in different situations [35]. The constructs in TPB aim to decipher how people can control their behavior, such as attitude, influence from subjective norms, beliefs, and perceived behavioral control. TPB has been widely utilized for health-related studies and has recently been used to evaluate individual behavior toward natural calamities. The difficulties in performing an action, or the ease with which an action can be taken, is addressed using the perceived behavioral control latent variable under TPB. As indicated by Ataei et al. [35], an individual’s action towards a behavior is affected by their own perception of the action—especially when people around them are doing the same. In relation, the subjective norm latent variable is considered since individuals’ behaviors are directly influenced by those that surround them. In this case, their actions are similar if they are certain that it addresses the same concern [36]. Lastly, regarding the individual’s attitude, Aboelmaged [37] explained that this latent variable measures an individual’s (un)favorable response to action regarding a subjective matter. These three domains of the TPB have been assessed to measure the behavioral characteristics of people. However, when evaluated, their protective behaviors were not sufficiently measured with TPB alone [13,16,38]. Thus, coping and threat appraisals under PMT are considered. The integration of both theories was utilized in this study to create the theoretical framework, similar to the study by Ong et al. [11]. Adopting the study from Ong et al. [11], the latent variables were evaluated to measure the intention of people to prepare for “The Big One” earthquake mitigation in the Philippines.

3. Methodology

The flowchart for the applied methodology of this study is presented in Figure 1. The process included data acquisition incorporating the younger generation from the Philippines (Section 3.1). After data inspection, a total of 683 valid responses were considered. The valid responses underwent data pre-processing (Section 3.2) and prediction from the parameter settings of DT, RFC, and ANN (Section 3.3). The resulting optimum parameters underwent further optimization and created the classification models, from which model validation was conducted with the use of the Taylor Diagram and results were interpreted.

3.1. Data Collection

This study employed an online survey among younger Filipinos who knew about “The Big One” earthquake. The non-probability sampling method was utilized to gather data from an online self-administered questionnaire. Specifically, convenience sampling was used, with the incorporation of snowball sampling, to reach a higher number of respondents following the suggestion of Memon et al. [39]. They [39] indicated that this method is considered effective when a study aims to measure human factors. Moreover, no quota samples were indicated for data gathering. Following the suggestion of Hair [40], a set of 500 samples and above is effective in measuring latent variables, with more than eight factors considered. The questionnaire was similar to the study by Ong et al. [11].
A total of 683 valid responses were considered in this study. The valid responses were based on the knowledge that participants had regarding “The Big One”. A descriptive statistic of the participant gender demographic showed 40% male and 60% female, and 92.7% were 15–24 years old. The responses were from younger individuals because of the online distribution method due to the COVID-19 pandemic. Most active people online pertain to the lower age group [41]. The respondents were in senior high school (47.6%) and college (38.2%), with a monthly allowance of less than 15,000 PhP (85.1%). Lastly, the majority of the respondents were not enrolled in any insurance policy (67%).
Focusing on younger generation respondents, this study aimed to highlight the measurement of preparedness for individuals who have studied mitigation and disaster risk reduction management, as taught at high school level. Significant variables under PMT and TPB may be deciphered as a corresponding adoption of the theoretical knowledge gained. In addition, as explored in the study of Ong et al. [11], media was one of the main contributing factors, followed by attitude, perceptions of severity, and subjective norms, with an understanding variable as the highest indirect effect. Therefore, an extended analysis was conducted. Following the Yamane Taro formula, as seen in Equation (1), 400 respondents represent the general public of the Philippines, considering a 95% accuracy of the 62.6 million total population [16].
n = N 1 + N e 2
With the collected 683 respondents, it could be implied that enough respondents were collected to represent the target of the study.

3.2. Data Cleaning and Aggregation

Before running the different machine learning algorithms, data pre-processing was conducted by removing non-significant factors. Correlation analysis of the 55 different constructs was conducted regarding the IP factor. Non-significant constructs with a p-value > 0.05 were removed. In addition, those with a low correlation value < 0.20 were also removed. There were 41 constructs considered from the 683 responses considered after data cleaning. Aggregation was carried out for the final constructs. The 41 constructs were then averaged to reduce the objects considered, focusing on seven factors to determine the intention to prepare for mitigation of “The Big One”. Before running the MLA, data normalization was carried out.

3.3. Prediction Using Machine Learning Algorithms

Machine learning algorithms are the current advanced technology used to measure human factors relating to natural disasters. This study utilized a decision tree, a random forest classifier, and an artificial neural network. The following subsections describe how the process of the different MLA algorithms was carried out with the use of Python with Spyder 5.1. The input dataset was considered in the data cleaning process. A total of 683 × 7 features were considered, giving a total of 4781 cleaned datasets for analysis.

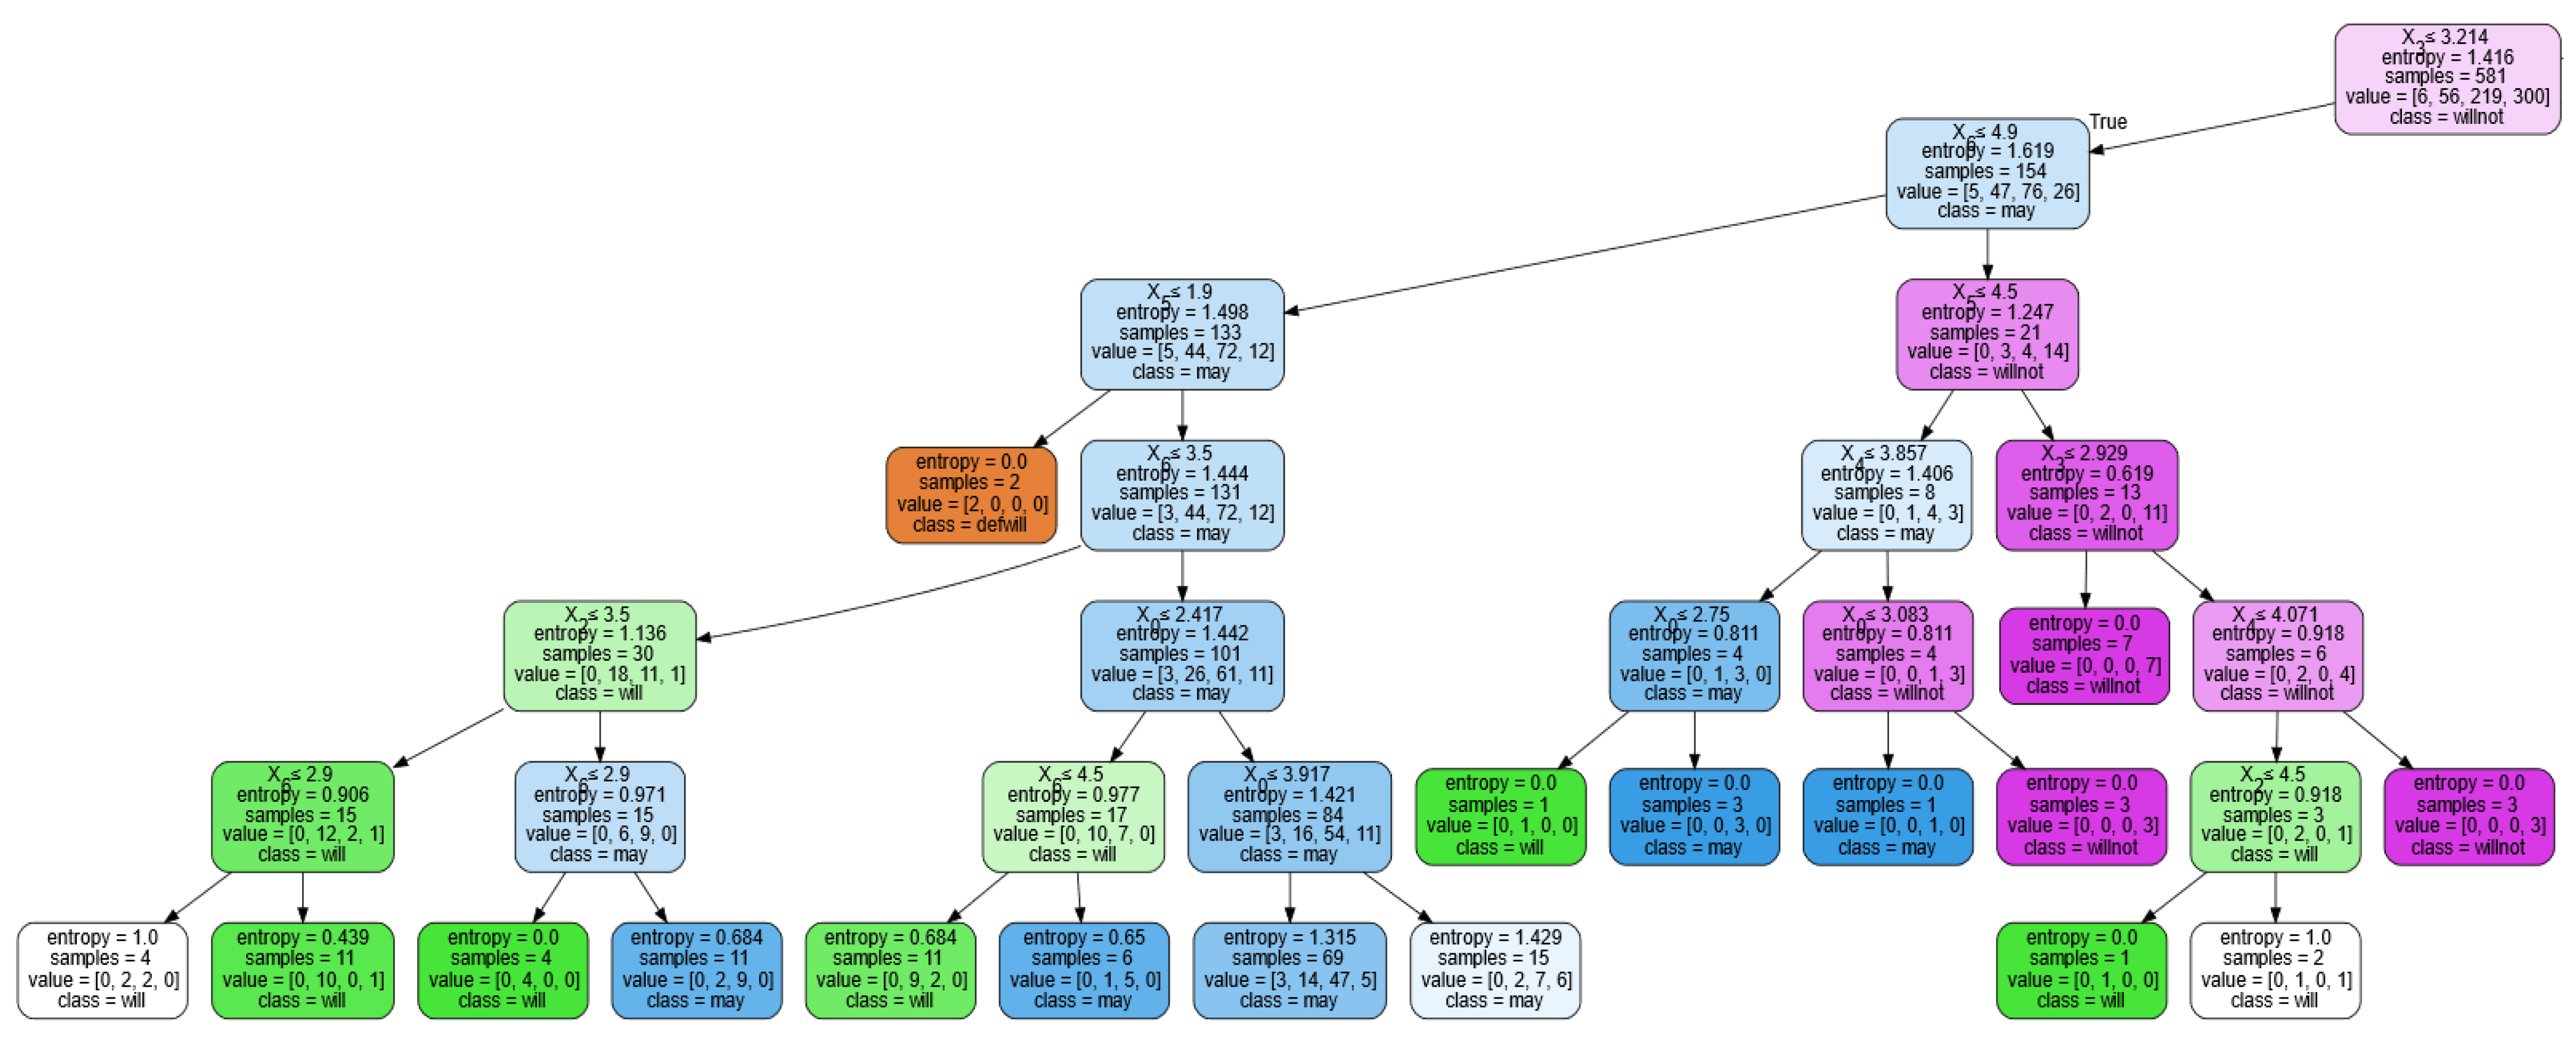
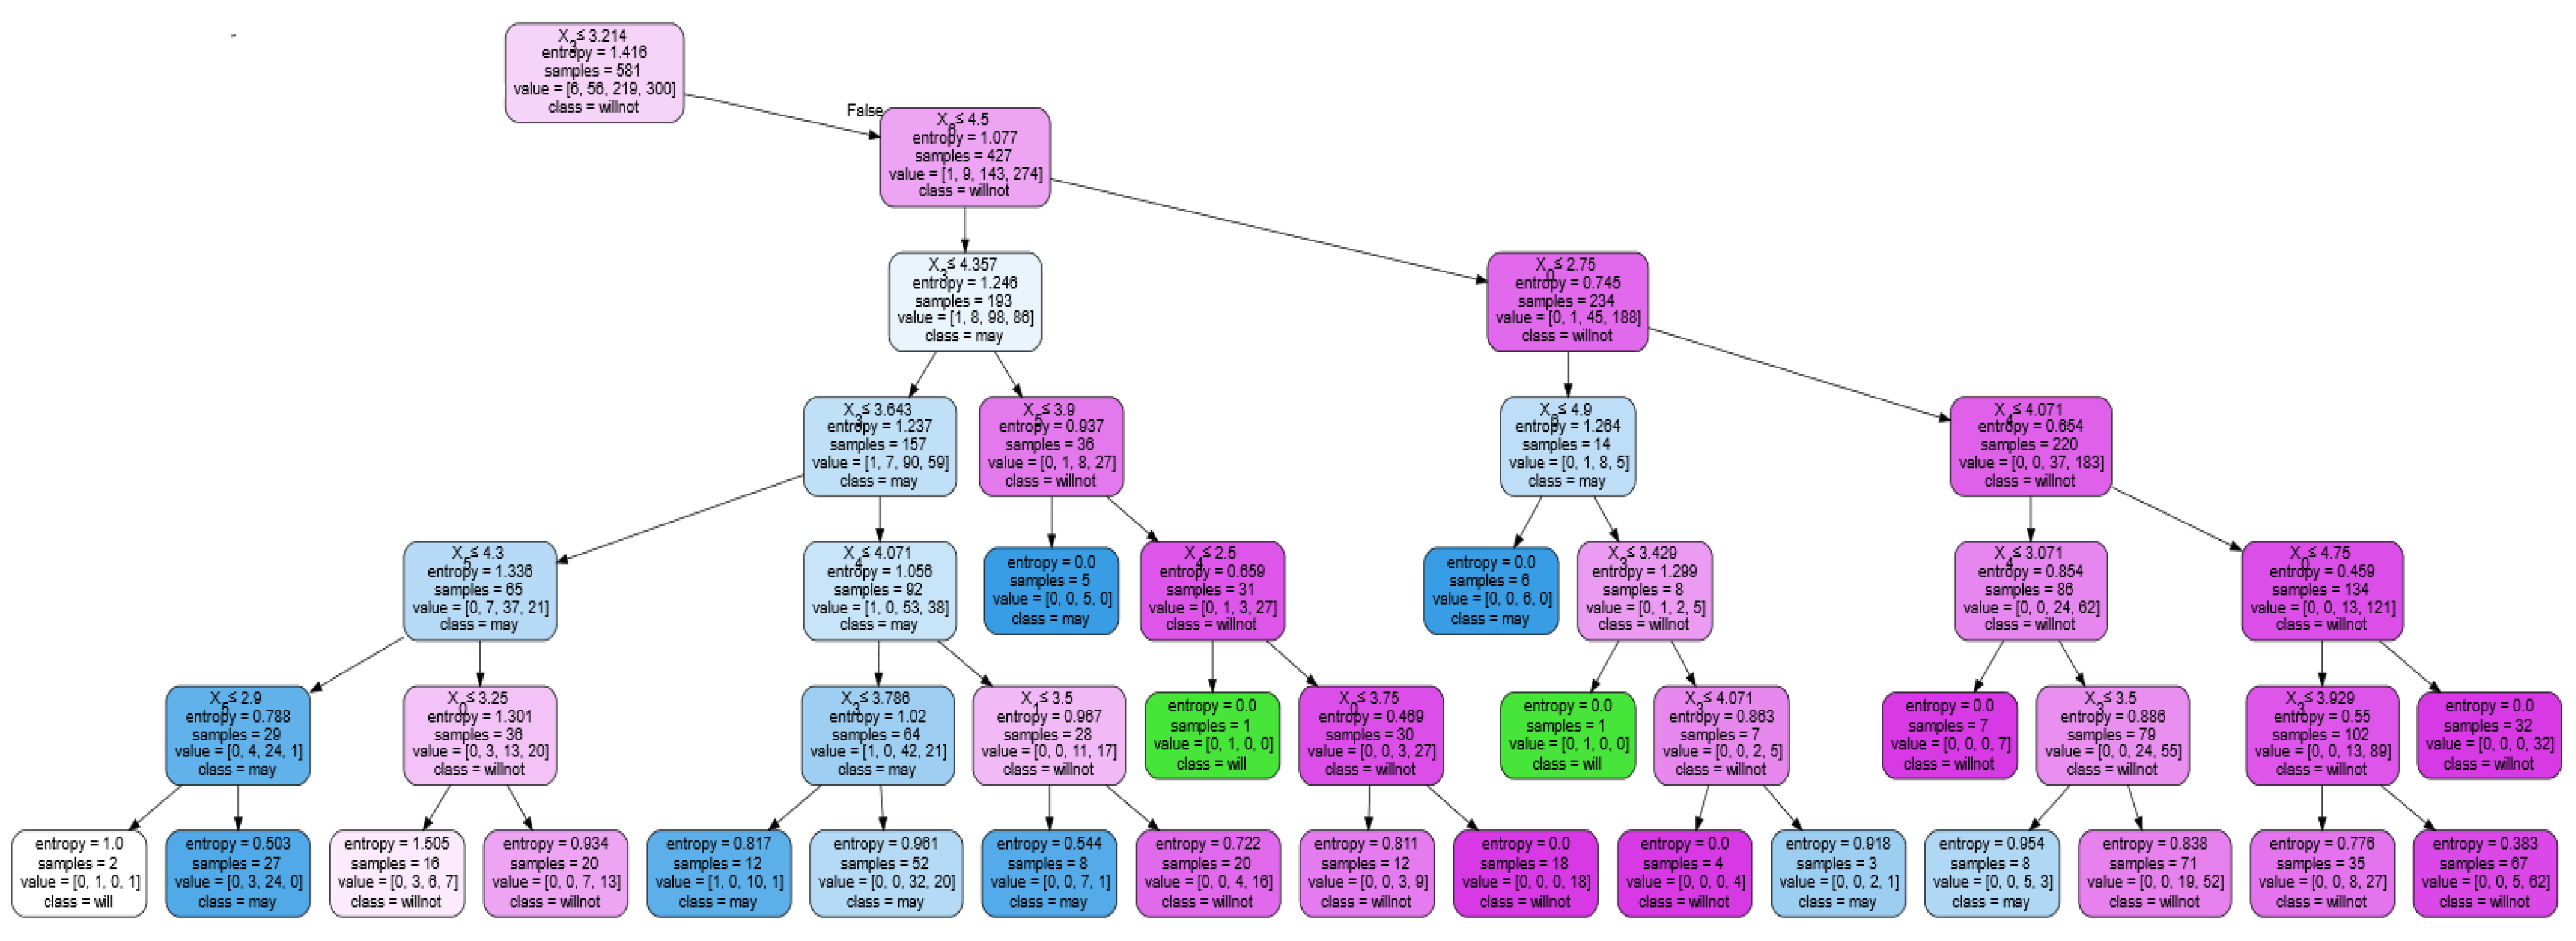
3.3.1. Decision Tree

Decision trees (DT) are tree-based classifications that can predict factors from a set of independent variables [20]. DTs create a model based on data supplied to predict a target attribute. The model consists of leaf nodes, branches, and root nodes, wherein each of the nodes and branches is formed from a test attribute and results in an outcome [23]. The outcome of the different decision trees could be evaluated using the Gini index and calculated as seen in Equation (2), as follows:
G i n i   t = 1 j   p t 2
The utilization of the Gini index measures the number of impurities of the split nodes in the decision tree model. Therefore, this maximizes the homogeneity of the child nodes created [20]. Aside from the Gini index, the Entropy index may also be utilized to measure the number of impurities for maximization of the homogeneity of the child nodes. The Entropy index may be computed as seen in Equation (3), as follows:
E n t r o p y t = j   p t l o g l o g   p ( j | t )  
Both index computations help in predicting the optimum hierarchical decision tree structure that would reinforce the decision-making process. Milani et al. [21] stated that DTs could be created as a nonparametric method with no assumptions needed.
Different training and testing ratios were utilized (40:60, 50:50, 60:40, 70:30, 80:20, 90:10) in testing the decision tree created. Moreover, experiments to determine the best criterion for either Gini or Entropy indexes and a splitter for either Random or Best were conducted. The determination of the minimum tree depth of 4, 5, 6, and 7 was also considered. Each combination of a parameter, training and testing ratio, criterion, splitter, and tree depth underwent 100 runs. A total of 9600 runs were completed from the different parameters considered to determine the best result. Analysis of Variance (ANOVA) as a statistical tool was utilized to determine the best training and testing ratio, Gini or Entropy classifier, Random or Best splitter, and tree depth.

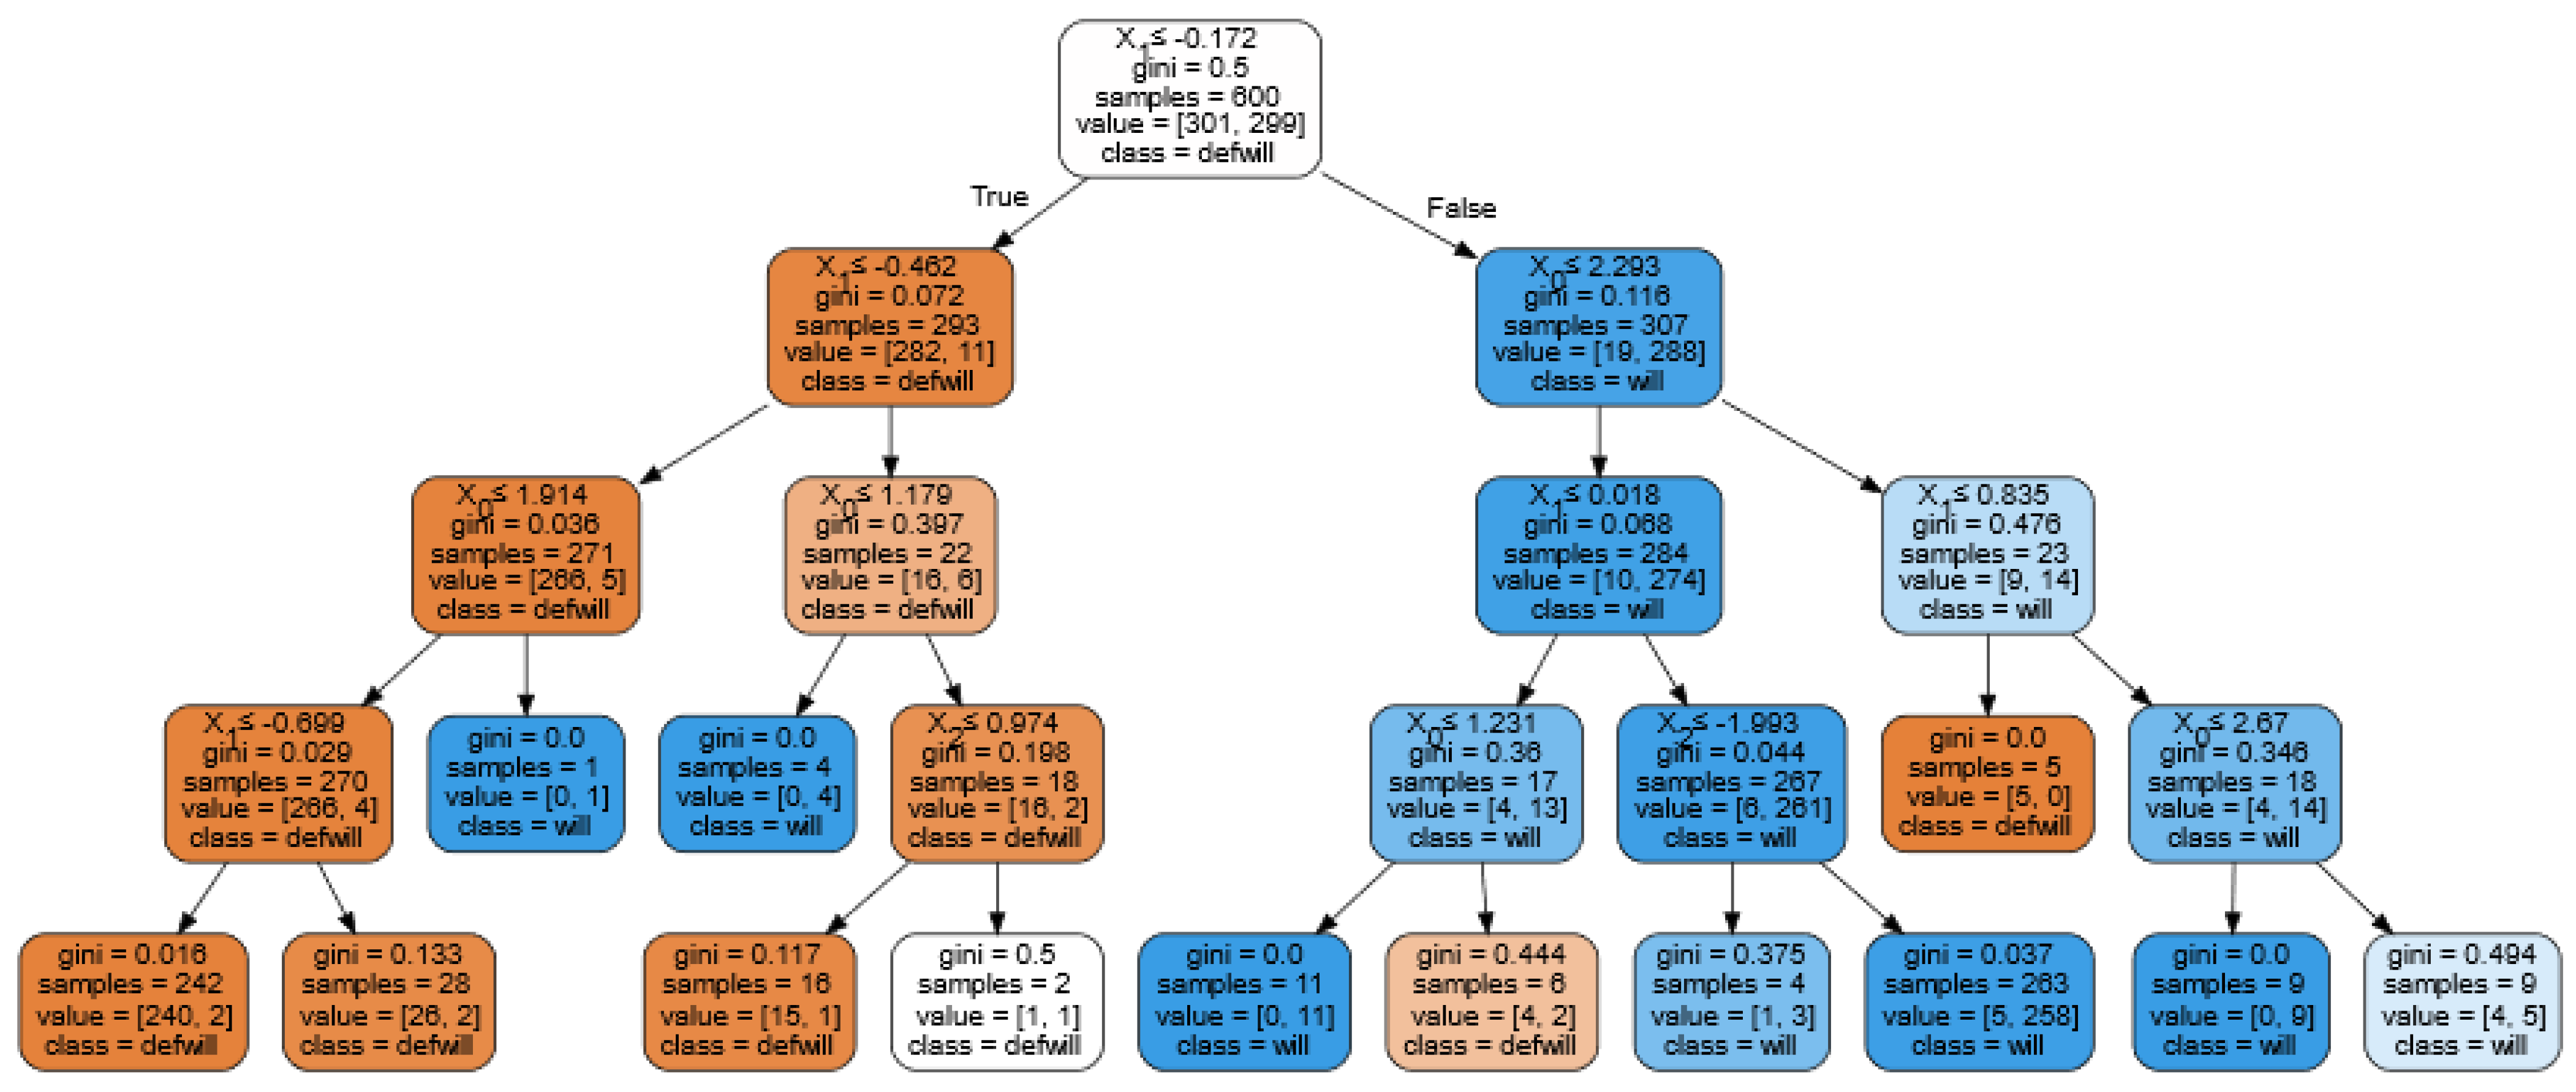
3.3.2. Random Forest Classifier

A random forest classifier is a decision-tree-based classifier with random decision tree generations. A random forest classifier (RFC) may be utilized to increase the accuracy rate and determine the optimum decision tree [22,23,24,42]. With this, the optimum tree may be deciphered for the classification of huge branched trees with a lot of attributes and would have higher accuracy compared to DT [22]. Moreover, Snehil and Goel [23] stated that RFC produces the best split among the random trees created. Like the DT process, the RFC was utilized in this study to determine the optimum tree. The parameter setting tested for RFC followed the same setting used by DT.

3.3.3. Artificial Neural Network

An Artificial Neural Network (ANN) is a tool utilized to simulate the behavior of the human brain. Jahangir et al. [43] explained how ANN is formulated by mathematical functions to model natural neurons by computation of weights through different communication lines. The input layer had seven nodes representing different factors, such as understandings of “The Big One” (U), perceived vulnerability (PV), perceived severity (PS), subjective norm (SN), perceived behavioral control (PBC), attitude (A), and media (M) to determine intention to prepare (IP).
From the model, the ANN trains itself using an iterative process [44]. The ANN utilizes the information fed into the input nodes with assigned weights. The input nodes may be denoted as x1 and the assigned weights as w1. The connection of the input layer nodes is parallel to the nodes in the hidden layer. The hidden layer nodes are individually treated, with no weight dependent on another node. Equation (4) presents the calculation of the sum of weights for every hidden node.
i = 1 m w 1 , x 1
The calculated weights are then summed within each hidden node and pass through an activation function to predict the value fed to the output node, y ^ 1 . Equation (5) presents the equation for the calculated summed weights.
X = 1 1 + e x
The output node is then compared to the known values, y1. The considered sum of squared errors between predicted and known values is calculated using Equation (6).
C = i = 1 n 1 2 y ^ 1 y 1   2
The parameters utilized were adopted from different studies. Table 1 presents the activation functions and optimizers utilized in this study with references.
Adapting the methodology by Pradhan and Lee [55], 10 runs for each combination were conducted, giving a total of 16,200 runs. The design of the experiment involved the different number of hidden layers (10, 20, 30, … 100), the activation function of the hidden layer (Swish, Elu, and Tanh), the activation function of the output layer (SoftMax, ReLu, and Sigmoid), and the optimizer (Adam, RMSProp, and SGD). Moreover, the epoch was set to 150 for the initial runs [50]. Epochs represent the set of data utilized for the study, and a learning algorithm hyperparameter represents the times each run would work within the dataset considered [56].

3.3.4. Swish Activation Function (SWAF)

SWAF was discovered by Google as a new type of activation function. The purpose of SWAF is to reduce activation with an increasing amount of values inputted [45]. Swish outperforms ReLu activation functions and could be utilized to have great output. Equation (7) presents the SWAF.
f x = x s i g m o i d x   a n d   f x = x / 1 e x

3.3.5. SoftMax Activation Function (SAF)

SAF is utilized for a combination of numerous sigmoid functions being considered [45]. Sigmoid functions return values in a range of 0 to 1. The function is considered as probabilistic values of data from a set. SAF is a special function that is utilized for multi-class datasets that consider classification [43]. Equation (8) presents the SAF utilized.
σ z j = e z j k = 1 K e z k   f o r   j = 1 , 2 , 3 , K

3.3.6. RMSProp Optimizer

The RMSProp optimizer is utilized for adaptive learning [57]. The optimizer is advantageous as it is utilized to enhance the performance from the adaptation of the ‘rprop’ algorithm and ‘Adagrad’. Moreover, RMSProp utilizes the mini-batch idea from ‘rprop’ to enhance the weights in the model [57]. The forward feeding of the moving average of the squared gradients of each function of weights is considered. Xu et al. [58] stated that RMPSProp automatically binds the weight sequence and holds any initial weights with respect to the independent variable and converges as a special case. Presented in Equation (9) is the equation for the RMSProp Optimizer.
E g 2 t = β E g t 1 + 1 β δ C δ w 2

4. Results

4.1. Decision Tree

The DT algorithm was simulated using several settings. The results were analyzed using ANOVA. The results showed that there was no significant difference among the different depths and criteria considered in the decision tree. Therefore, the highest mean accuracy among the results was considered, as seen in Table 2. Moreover, the 80:20 training and testing ratio utilizing the Entropy criterion and Best classifier with an average accuracy rate of 64.00% were the best result with a standard deviation of 0.00. As suggested by Kolose et al. [59], low accuracy may be due to the generalization of the dataset. Figure 2 and Figure 3 represent the best decision tree for predicting factors affecting the intention to prepare for mitigation of “The Big One” in the Philippines.

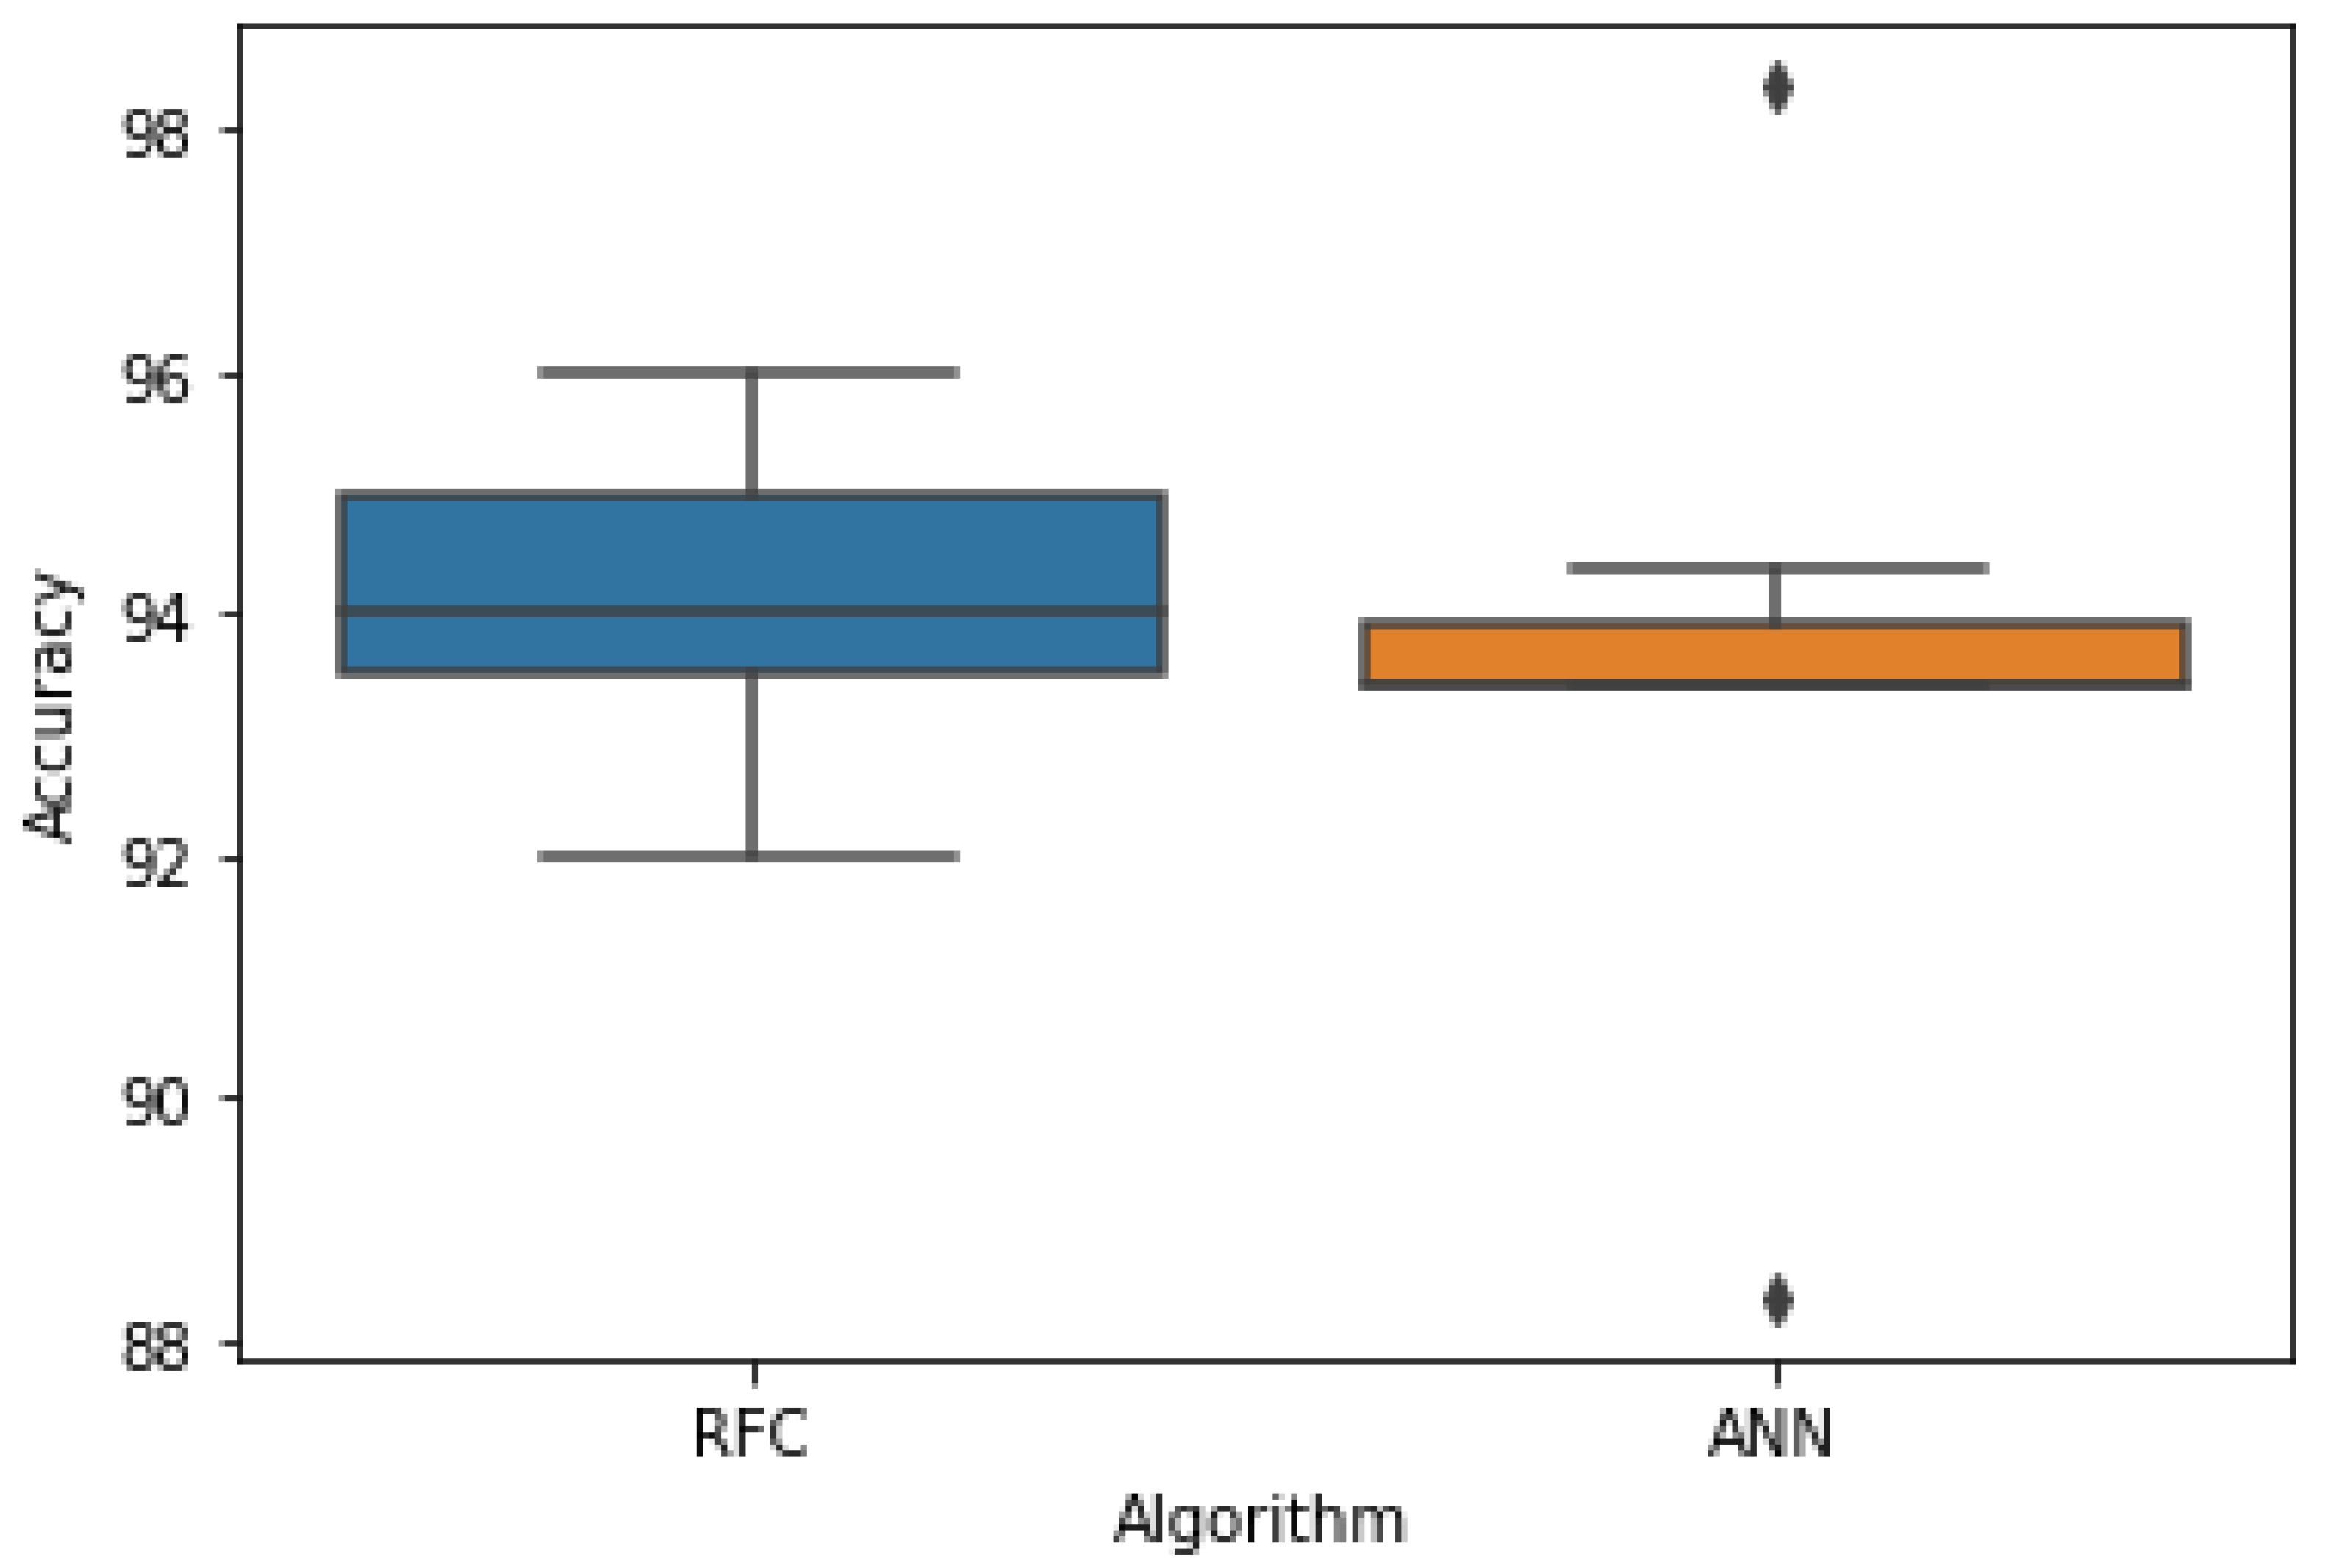
4.2. Random Forest Classifier

From the 9600 runs, it was seen that the tree depth (4, 5, 6, and 7) did not have any significant difference utilizing the ANOVA. With that, the lowest tree depth of 4 ensured a large-branched tree was not obtained.
As presented in Table 3, the 80:20 training and testing ratio had one of the highest means with the Gini criterion and Best splitter. Indeed, 96% accuracy was the optimum result with a 0.00 standard deviation. Figure 4 presents the results of the optimum decision tree. As explained by Aznar [58], it could be deduced that Gini and Entropy are different only in the way they are calculated, but their resulting trees are not that distinctly different. It was highlighted that the calculation complexity of Entropy is applied depending on the applicability of the dataset when Gini produces a lower accuracy rate. Since Entropy utilizes the logarithmic calculation, a more thorough calculation was indicated to provide different results [60]. Thus, when samples are not complex, then, the Gini criterion can be applied to analyze the decision tree in a simpler manner.
From the optimum decision tree determining the factors affecting the intention to prepare for mitigation of “The Big One”, Figure 3 shows that the starting leaf considered perceived vulnerability as the factor from which to branch out. If the average result is less than or equal to 0.172 (negative impact), then it considers a higher value of 0.462 (negative impact) for the same factor. If the condition is satisfied, it will consider a value of less than or equal to 1.194, or less than or equal to 1.179 otherwise for understanding “The Big One”. If it is less than or equal to 1.194, then it will consider 0.699 negative impacts from perceived vulnerability; otherwise people “will” have the intention to prepare for mitigation of “The Big One”. If 1.179 was satisfied, then it will also result in the same decision.
However, if the second child leaf is satisfied, then the tree further branches out considering a negative impact on perceived vulnerability with a value less than or equal to 0.699. Interestingly, either will result in people “definitely” having the intention to prepare for the mitigation of “The Big One”. On the other hand, if the first child leaf is not satisfied for values less than or equal to 1.179, then it will consider perceived severity with a value less than or equal to 0.974. Interestingly, either will result in “definitely” having the intention to prepare for the mitigation of “The Big One”.
On the other hand, if the starting leaf is not satisfied, then it will consider understanding “The Big One” with a value less than or equal to 2.293. From which, if satisfied, would lead to the consideration of perceived vulnerability with a value less than or equal to 0.018. If this was satisfied, it will consider understanding “The Big One” with a value less than or equal to 1.231, and a negative impact from perceived severity with less than or equal to 1.993 otherwise. Either of these results would lead to “will” having the intention to prepare for mitigation of “The Big One”.
If the first child leaf is not satisfied, it will consider a negative impact from the perceived vulnerability. If this is satisfied, then people “will definitely” have the intention to prepare for mitigation of “The Big One”. Otherwise, it will consider understanding “The Big One” with a value less than or equal to 2.67. Either of the results would lead to “will” having the intention to prepare for mitigation of “The Big One”.
Overall, it could be seen that the higher the perceived vulnerability (PV), the higher the intention to prepare for mitigation of “The Big One” (Will Definitely Prepare). Moreover, from the result of the decision tree, understanding “The Big One” also plays a crucial role. In line with PV, if people understand how “The Big One” can affect them, they have greater intentions to prepare. In relation, the results also showed that the perceived severity of the effect of “The Big One” would also lead the people to have the intention to prepare for mitigation. Therefore, understanding “The Big One” and its effect linking perceived vulnerability and perceived severity would be key indicators of why people will have the intention to prepare towards mitigation of “The Big One”. It was seen that three factors—perceived vulnerability, perceived severity, and understanding of “The Big One”—affected intention to prepare for mitigation of “The Big One”. The application of artificial neural networks may determine which among the three factors greatly contributes to IP.

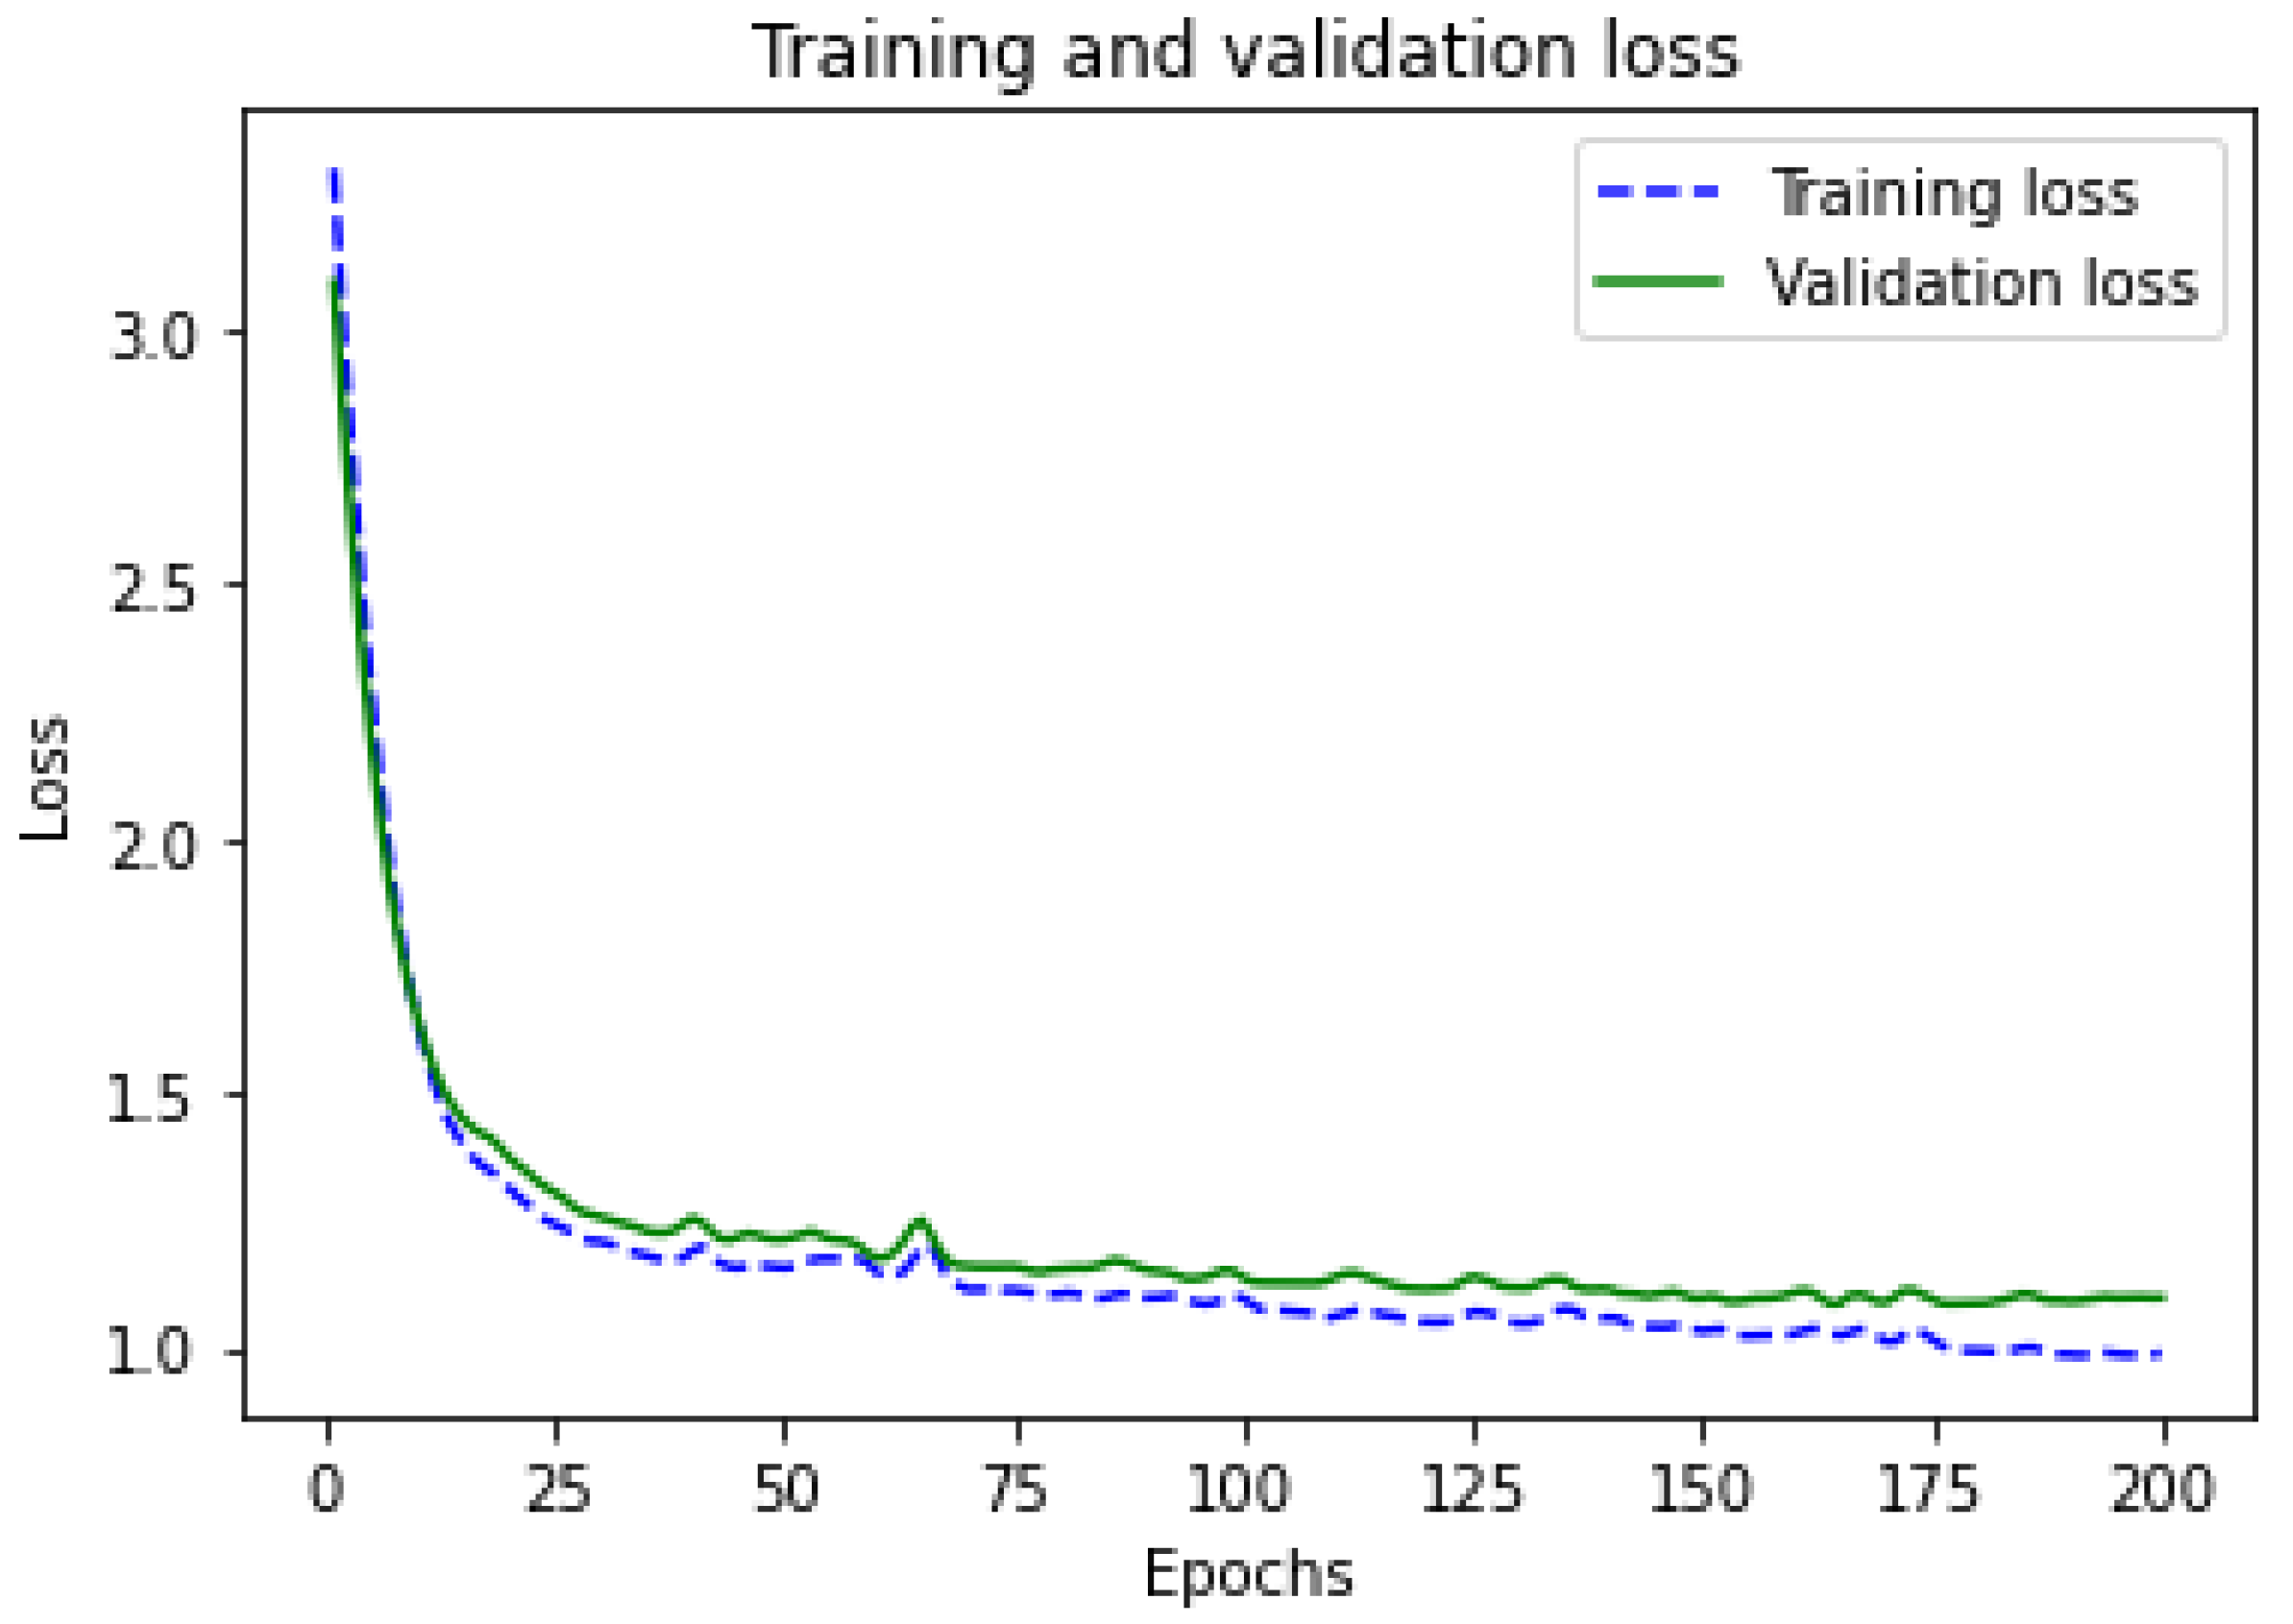
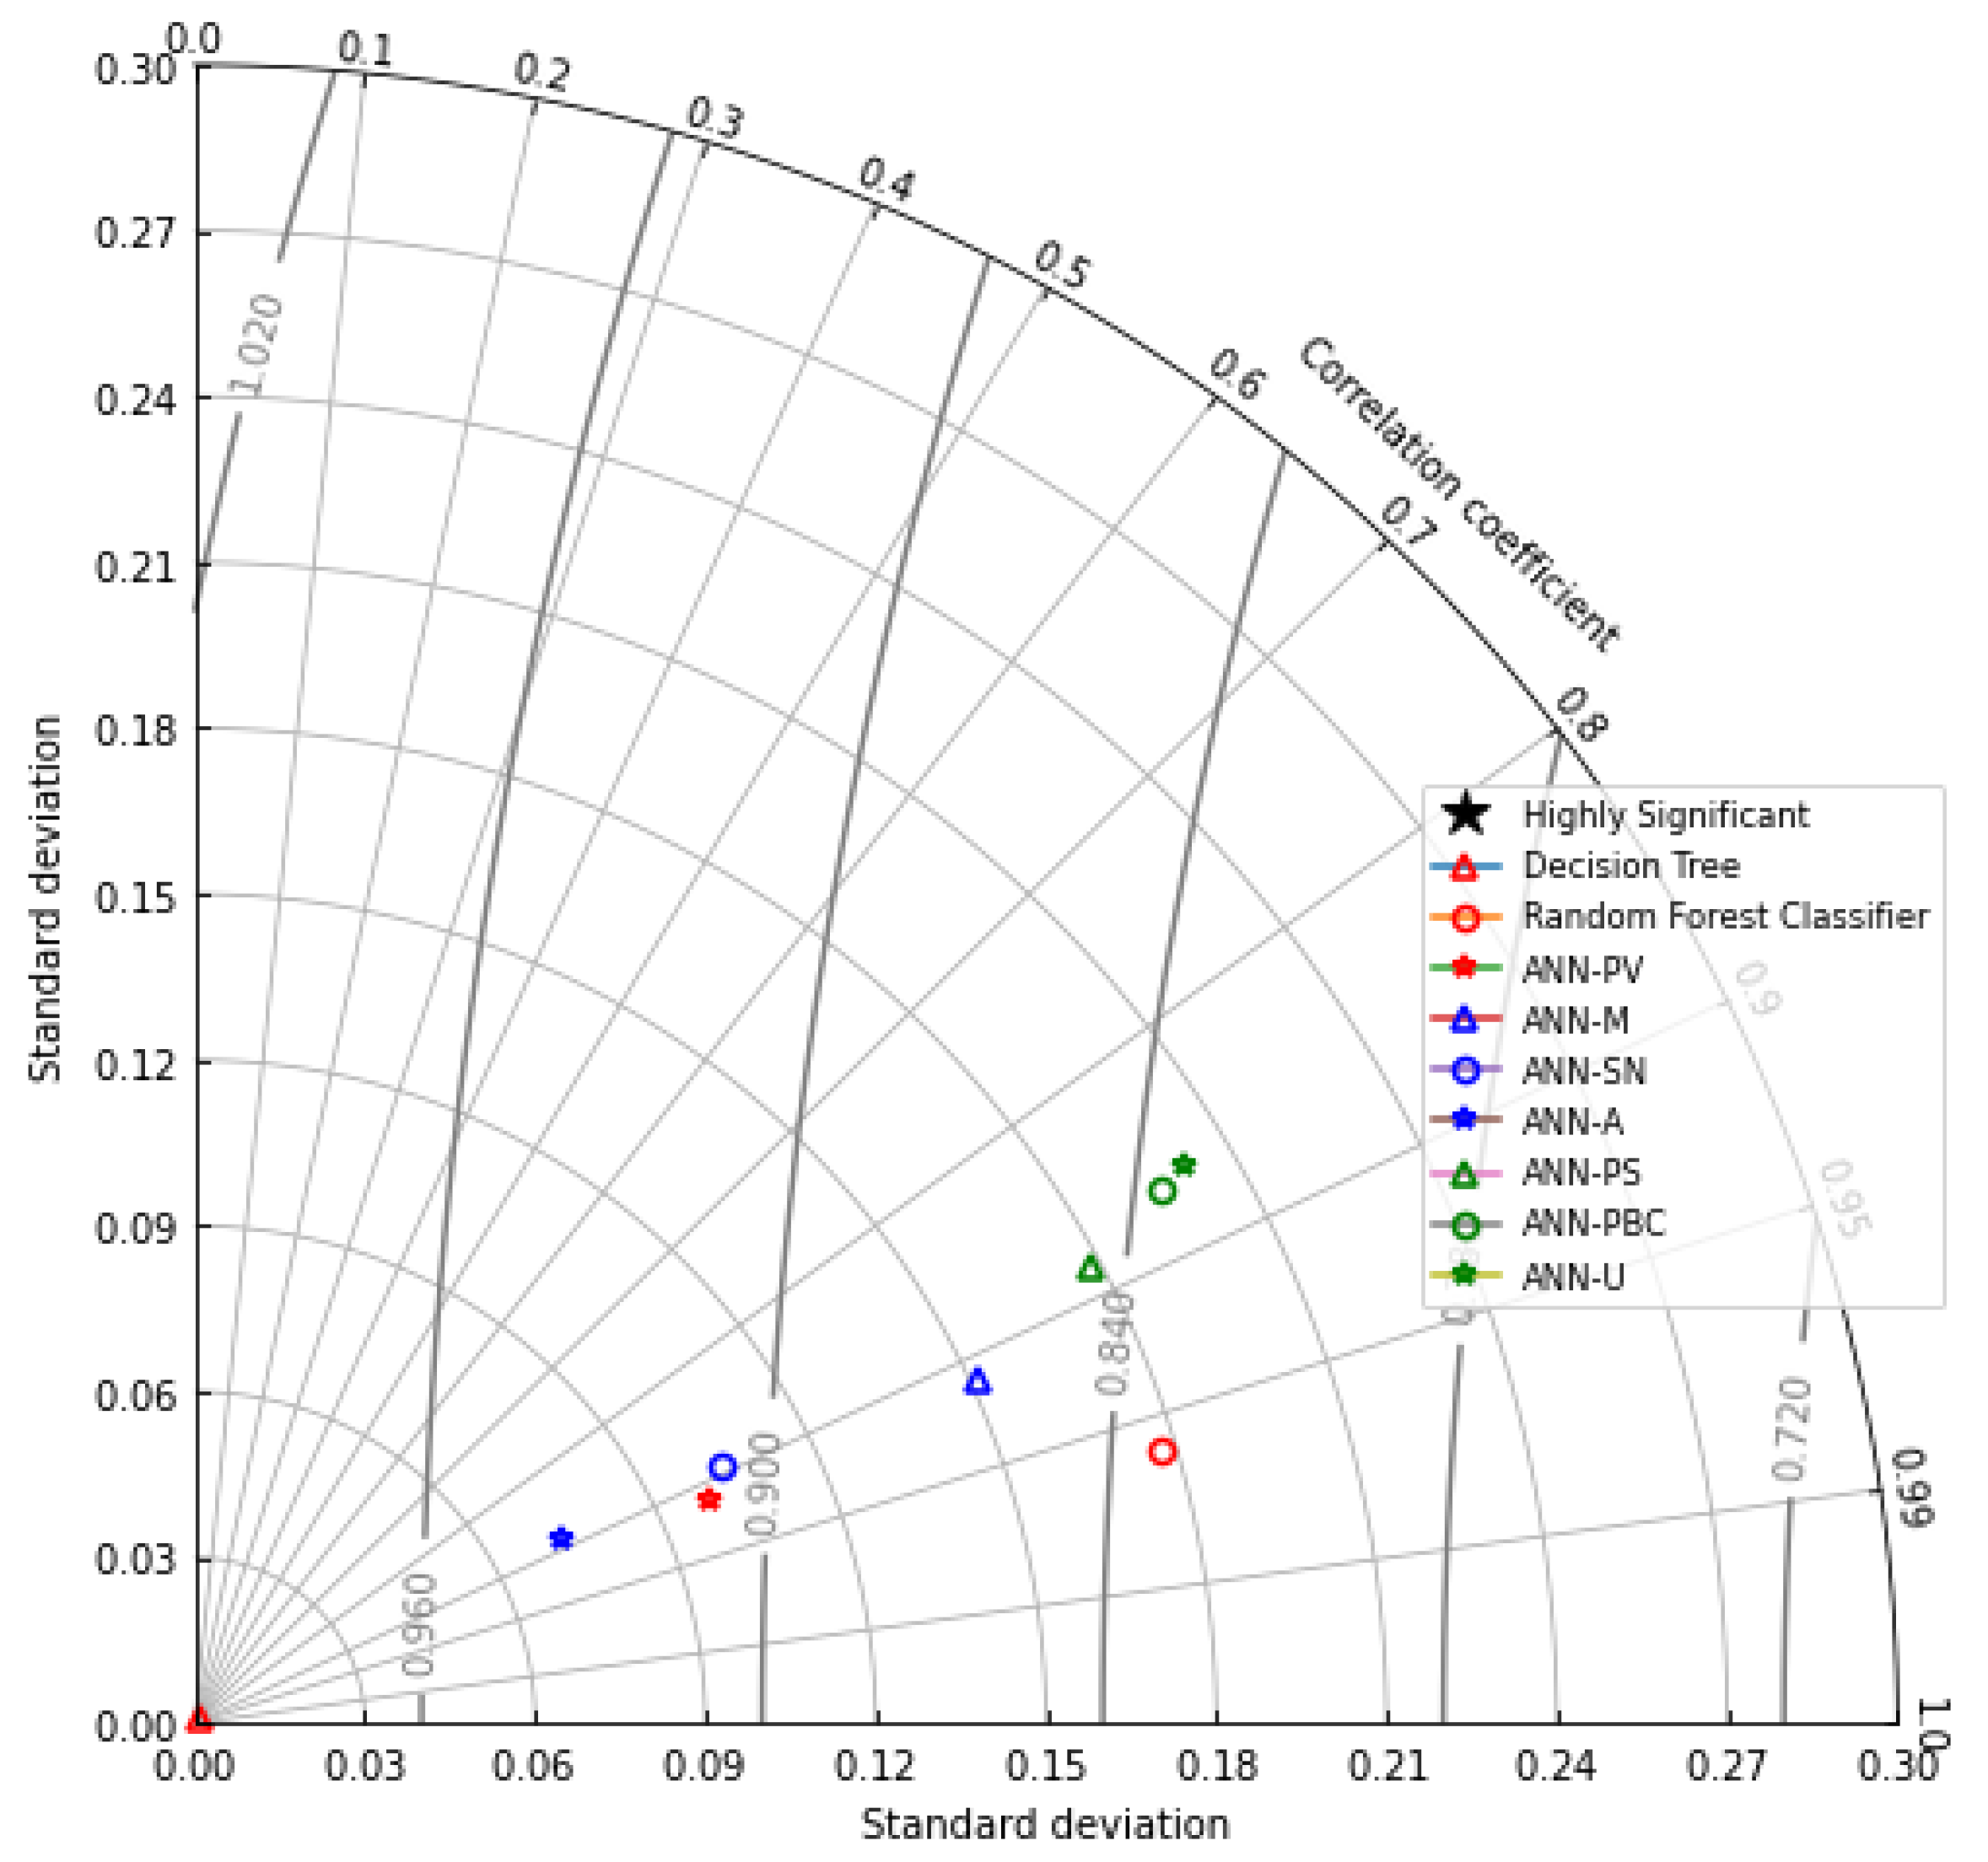
4.3. Artificial Neural Network

Optimization of the number of hidden layers and output layers was conducted. The results of ANN showed that 100 single-layered hidden nodes and 10 output nodes did not produce any overfitting and had the highest average accuracy. In addition, Figure 5 presents the optimum training and testing output. The higher the number of epochs used, overfitting was seen, while lower epochs showed a lower accuracy rate—similar to the results of Lara et al. [61].
Table 4 presents the summarized ANN results with average accuracy and standard deviation of the initial run. ANOVA showed that the different combinations had no significant differences. The highest average accuracy rate with the lowest standard deviation was chosen for the final run. The factor with the highest average accuracy rate was perceived vulnerability (PV) with Swish as the activation of the hidden layer, SoftMax as the activation function of the output layer, RMSProp optimizer, 75.057% average training (standard deviation = 2.321), and 68.350% average testing (standard deviation = 1.703).
The final run utilized 70%–30% and 80%–20% training and testing ratios for PV with Swish as the activation function for the hidden layer, Sotfmax activation function for the output layer, and RMSProp for the optimizer. Moreover, 30 runs with 200 epochs each were utilized. The result showed that 70%–30% had an average accuracy rate of 71.96%–67.58% in training and testing with standard deviation values of 4.82 and 3.12, respectively. On the other hand, 80%–20% had 69.42%–70.37% training and testing with a standard deviation of 3.29 and 1.74, respectively. With that, the highest accuracy rate of 70.37% represented perceived vulnerability, the factor that greatly affected the intention to prepare for “The Big One”.
In this study, different parameters for the activation function in the hidden layer, Swish, Elu, and Tanh were considered. For the output layer, the activation function considered Softmax, ReLu, and Sigmoid. The utilization of Softmax, SGD, and RMSProp as optimizers was also considered. Undergoing a total of 16,200 runs, it was seen that Swish as an activation function for the hidden layer, SoftMax for the output layer, and RMSProp as an optimizer produced the best result.
Activation functions are important to consider in ANN since it is utilized to calculate the sum of different weights in the input layer. The result of this is important to feed to the next layer. From the results, it was seen that Swish outperformed other activation functions, similar to the result of Sharma et al. [45]. The purpose of utilizing activation functions is to produce non-linear results from the input to output. Having a linear relationship results in not solving complex problems in ANN. Moreover, the linear relationship would limit the trigger for neurons to calculate results with high accuracy [45]. In addition, Swish outperforms other activation functions like Elu and Tanh as Swish is not monotonic. Monotonic is a state wherein the output of ANN does not change even when the input is increased, resulting in values being the same throughout the run. However, Sharma et al. [45] and Kizrak [62] stated that ReLu as an activation function may be utilized as it performs similarly to Swish, but only when the data is smaller. The results of Sharma et al. [45] were seen to be high with the consideration of Softmax as an activation function as well.
Softmax is the most preferred activation function in the output layer [62], similar to other studies [45,48,49,50]. Results have shown higher accuracy with the utilization of Softmax. Kizrak [62] discussed how Softmax determines a higher probability of classifying the results of ANN. Similar to the study of Gao et al. [63], Softmax resulted in higher accuracy and utilized Adam as the optimizer.
From the results of this study, the optimizer which produced the optimum result was RMSProp, when compared to SGD and Adam. Similar to the result of Yousefzadeh et al. [53], the RMSProp optimizer resulted in higher accuracy. Nhu et al. [64] discussed how Adam, SGD, and RMSProp are popular optimizers. However, the landslide susceptibility study of Nhu et al. [64] showed that having Adam as the optimizer resulted in the highest accuracy, but RMSProp showed the highest sensitivity in running the data. This justifies how RMSProp could be used for data generalization. Xu et al. [58] discussed how RMSProp, as an optimizer, has generalizable ability. Therefore, the results of this study from Swish, Softmax, and RMSProp showed higher accuracy compared to other parameter designs.
The results showed 100 hidden layer nodes were considered, which had no overfitting until the maximum nodes were considered. However, the increase in nodes produced overfitting, which is similar to the discussion of Lara et al. [61]. Furthermore, overfitting resulted in lower accuracy. With the parameters, further optimization was conducted using a 70:30 and 80:20 training and testing ratio; this is similar to Gao et al. [63]. The 80:20 training and testing ratio produced a higher accuracy rate of 70.37%. Walczak and Cerpa [65] discussed how ANN has been widely utilized for forecasting compared to other MLAs as it reaches a 60% or higher accuracy rate, which is considered acceptable. However, a higher accuracy rate would be considered a better result.
For the validity measures, the box plot was created to determine the quartile ranking of the results. Figure 6 presents the box plot for the results, which indicates consistent results. Both RFC and ANN are within the mean accuracy of 93—the significant factors. In addition, a correlation analysis with frequency of answers is provided, as seen in Table 5. It can be deduced that PV provided the most significant influence among other latent variables.
Furthermore, the simulation results from the decision tree, random forest, and ANN also presented that perceived vulnerability, perceived severity, and understanding of “The Big One” played a crucial role in determining the intention to prepare for “The Big One”. To validate the findings, German et al. [16] suggested applying the Taylor diagram, which would evaluate the error rate (20% threshold for RMSEA), relationship of the accuracies (90% threshold of correlation), and at 1.0 standard deviation. Figure 7 presents the Taylor diagram, which shows the distinct features of significant latent variables, outperformance of RFC to DT, and relative impact of ANN. Therefore, it could be deduced that the findings are acceptable.

5. Discussion

From the results, it was seen that PV greatly contributed towards the intention to prepare for the mitigation of “The Big One”. Based on the constructs, it could be seen that people think that the area they are in is vulnerable, family members could be affected, and negative experiences were being considered. Having predicted that “The Big One” will be huge, people perceive negative effects, even the aftermath. Moreover, the negative experiences and impacts of previous earthquakes cause Filipinos to perceive the vulnerability of the event before, during, and after the disaster. In relation to the results of Lam [66], PV was seen to increase the motivation of people towards their behavior, especially when health is concerned. Moreover, Garcia et al. [67] indicated the proportionality of PV and behaviors for strategies concerning consequences. This provided an insight that the more negative the impact of a situation is, the more likely people will have the intention to prepare. Compared to the findings of German et al. [16], it indicated that people presume the aftermath of natural calamities and have become accustomed with the effects. Moreover, knowledge gained from the curriculum of disaster risk reduction management among the younger generation during high school education should have proved understanding to be a distinctly significant factor affecting the intention to prepare. Interestingly, the results of this study provided understanding as one of the factors least affecting the intention to prepare for “The Big One” earthquake.
From the results of Ong et al. [11], it has been discussed how a lack of information regarding “The Big One”, except for the predicted intensity, affects perceptions of the natural disaster. This has led to the perception of people only based on past experiences of how infrastructure and livelihoods were damaged by earthquakes. With that, the reason why perceived severity (PS) was seen to be the only factor considered after PV. PS was measured through constructs such as people taking “The Big One” seriously, “The Big One” being a threat to the economy of the country for many years, and the predicted casualties and damage it may bring.
In relation to the study by Zhao et al. [68], PS and PV were seen to affect an individual’s attitude toward perceived risk. In addition, Yau et al. [69] also had the same result. It was seen that the fear perceived by people led them to an increased intention to prepare for mitigation. Ong et al. [11] stated that there is an effect on how people think about “The Big One” and how they can control the aftermath of the natural disaster. This could therefore dictate that the more people perceive the severity of a natural disaster, the more they have the intention to prepare for mitigation. In line with the findings of Laato et al. [70] and Wu [71], how people perceive a risk would affect their behavior or intention to prepare for it. Therefore, knowing how a natural calamity may affect the lives of the people, the more likely they will prepare for it.
Understanding “The Big One” was also seen as a significant factor in IP, but was relatively low. When people worry about the aftermath of the earthquake, have feelings of stress, have a high level of vulnerability in terms of their friends and family, and have the responsibility to prepare, were significant constructs. Ataei et al. [35] and Aboelmaged [37] had similar results that indicated how these could influence the intention of people towards preparation to mitigate. Following the results of Ong et al. [11], the study indicated that U had a direct significant effect on PV and PS. Understanding and being aware of “The Big One”, information regarding evacuation facilities and the area to be affected, and considering precautions led to a significance of factors. Becker et al. [33] indicated how the level of understanding of the perceived effects of risks increases the preparation against hazards. Moreover, Guo et al. [72] discussed how the perception and understanding of people relatively impact their intention to prepare. This would lead to influencing the intention to prepare for the mitigation of “The Big One”.
Based on the demographics, it could be deduced that the majority are of the younger generation. With the implementation of the disaster risk reduction management subject in senior high school, results still presented low significance in terms of understanding the natural disaster, “The Big One” earthquake. Bollettino et al. [15] indicated how Filipinos have a relatively low understanding and knowledge regarding disaster preparedness and climate change. This clearly shows the need to explore more on how the Philippines should consider preparation and mitigation, since it is prone to natural disasters. Guo et al. [72] also stated that providing information can significantly improve the perception and understanding of people regarding natural disasters. This will lead to positive reinforcement with preparation and mitigation for natural disasters. From this, a lack of distinct emphasis on the preparedness and mitigation is seen among younger individuals, which needs to be highlighted among educational sectors. Since the Philippines has been determined as one of the countries prone to constant devastation from natural disasters, the need to highlight preparedness, mitigation, and safety among the community should be seriously considered.

5.1. Practical Implications

As the results indicated, PV, PS, and U were factors that greatly affected IP. The government could take this into consideration. As indicated by Bollettino et al. [15], Filipinos need more knowledge reinforcement with regard to natural disasters. It could be suggested that small programs within the community could be implemented to enhance the knowledge and understanding of people towards natural disasters. This would lead to positive reinforcement for planning and mitigation of any calamities that may occur. It could also be suggested to create safety plans and mitigation strategies for natural disasters. People may be able to prepare for disasters before, during, and after the incident. In the education sector, an emphasis on and classification of different natural disasters should be taught. Currently, the education sector has established the need for a course requirement. As a subject among younger generations, improvement should be characterized by the education sector for different forms of natural disaster management, mitigation, and knowledge. Lastly, the implementation of safety protocols and enhancement of evacuation areas within the proximity of disaster-prone areas may help in the mitigation process. For the government, it could be seen that people are willing to adopt and apply relative safety needs. It could be capitalized on by providing programs, lectures, and hazard practices among the different communities in the Philippines.

5.2. Contribution and Application

From the machine learning algorithm, it was seen that the results were promising. Utilization of DT, DTRFC, and ANN for human factors and human behavior may be carried out for other studies regarding natural disasters. In addition, the advantage of MLAs such as ANN is that they simulate how the brain works. This could lead to future findings and research, specifically on how the algorithm could predict human behavior without the need for new data for evaluating the perception of people. This study proved how well MLAs could predict and determine factors affecting the intention of people to prepare for the mitigation of “The Big One” earthquake. Therefore, these techniques could be applied to determine factors affecting the intention to prepare for the mitigation of other natural disasters that may happen, even in other countries. In addition, RFC was seen to provide higher accuracy with the basic DT, and that RFC results aligned with the ANN results. However, compared to SEM, the results were significantly different. Table 6 presents the significant factors affecting intentions to prepare from SEM and MLA results from Ong et al. [11] and this study.
As MLA analyzed the nonlinear relationship among latent variables, a clear representation of distinct factors affecting intention to prepare was seen. Compared with the SEM results, distinct difference were seen. For example, media was seen to be the highest factor influencing IP for SEM, but PV was seen with MLAs. From the SEM results, M was placed as an exogenous latent variable and PV was an endogenous latent variable. Since a lot of other factors affected PV in SEM, the factor was ranked sixth in the SEM results. Clearly, the discussion of Fan et al. [14] and Woody [15] prevails due to the limitations of SEM from the evident results. Some factors may be characterized as similar with the findings, like PBC and U, which were placed in the lower ranked results. This indicates that comparable results of SEM and MLA may be applied with some differences.

5.3. Limitations and Recommendations

Even with the significant results, this study has various limitations. First, the study considered respondents in the Philippines. As indicated by PHILVOCS, “The Big One” will hit the west valley fault. The west valley fault is near the capital city and is also predicted to hit the nearby cities. Therefore, considerations of near proximity respondents may give different results or specifications towards the factors affecting the intention to prepare for “The Big One”. The generalized data may have led to the low accuracy rate of the ANN, 70.37%. Second, further parameter optimization could also be carried out to enhance the accuracy rate of the MLA, specifically the artificial neural network. Since the DTRFC was utilized to enhance the accuracy of the simple DT, other techniques integrated with ANN may also be conducted to enhance the accuracy as well. Lastly, self-perception of understanding towards “The Big One” was implemented in this study. Better implications may be created if the knowledge of the respondents was evaluated as well. This would lead to determining specific factors for preparation in the mitigation of earthquakes and other natural disasters.

6. Conclusions

The numerous earthquakes occurring in the Philippines and the lack of studies regarding preparedness for the mitigation of natural calamities prompted the need for studies regarding human factors. A machine learning algorithm was utilized in this study, specifically a decision tree, a random forest classifier, and an artificial neural network. The seven factors considered, such as understanding of “The Big One”, perceived severity, perceived vulnerability, attitude, media, subjective norm, and perceived behavioral control, were considered to measure the intention of Filipinos to prepare for mitigation of “The Big One”.
The simulation results revealed that the best model for the decision tree was a 80:20 training and testing ratio Entropy criterion and Best classifier. On the other hand, the best model for the random forest classifier was an 80:20 training and testing ratio with the Gini criterion and Best splitter. For the ANN, the best model was Swish as the activation function for the hidden layer, SoftMax as the output layer, and RMSProp as the optimizer.
By utilizing a machine learning algorithm, it was also found that three factors, understanding, perceived severity, and perceived vulnerability, had the most significant impact on the intention to prepare for mitigation. The more negative the impact or perception is, the more people will prepare for any natural disaster that may occur. Specifically, the artificial neural network indicated that perceived vulnerability was the most significant contributing factor. The negative experiences of people during the same natural disaster, the vulnerability of loved ones, and the proximity to the predicted natural disaster led to the intention of people to prepare for the mitigation of “The Big One”. The utilization of machine learning algorithms in predicting factors for human behavior could be utilized to measure preparation for other natural disasters and calamities.
Knowledge and understanding of people in the Philippines should be promoted. As Filipinos lack knowledge about natural disasters, it is recommended that programs, plans, and safety protocols be implemented by the government. This would lead to the reduction of damaged livelihood and promote strategies among communities to prepare for the mitigation of natural disasters. The awareness of people will lead to a reduction of casualties and would also lead to a willingness to prepare to mitigate during, before, and after natural disasters. The techniques and algorithm utilized in this study could help explore and compare the intention of people to prepare for the mitigation of other natural disasters, even in different countries.

Author Contributions

Conceptualization, A.K.S.O. and F.E.Z.; methodology, A.K.S.O. and F.E.Z.; software, A.K.S.O.; validation, A.K.S.O., F.E.Z. and Y.T.P.; formal analysis, A.K.S.O.; investigation, A.K.S.O. and F.E.Z.; resources, A.K.S.O., F.E.Z. and Y.T.P.; data curation, A.K.S.O.; writing—original draft preparation, A.K.S.O.; writing—review and editing, A.K.S.O., F.E.Z. and Y.T.P.; visualization, A.K.S.O.; supervision, F.E.Z. and Y.T.P.; project administration, F.E.Z. and Y.T.P.; funding acquisition, A.K.S.O. All authors have read and agreed to the published version of the manuscript.

Funding

This research was funded by Mapua University Directed Research for Innovation and Value Enhancement (DRIVE).

Institutional Review Board Statement

The study was approved by the Mapua University Research Ethics Committees (FM-RC-22-30).

Informed Consent Statement

Informed consent was obtained from all subjects involved in this study (FM-RC-21-61).

Data Availability Statement

The data presented in this study are available on request from the corresponding author.

Acknowledgments

The author would like to thank all the respondents who answered the online questionnaire.

Conflicts of Interest

The author declares no conflict of interest.

References

  1. Morales, N.J. Magnitude 6.7 Quake Hits South of the Philippine Capital. Available online: https://www.reuters.com/world/asia-pacific/magnitude-67-quake-hits-south-philippine-capital-2021-07-23/ (accessed on 30 December 2021).
  2. Badillo, V. The Moro Gulf tidal wave of 17 August 1976. Philipp. Stud. 1978, 26, 426–436. [Google Scholar]
  3. World, B. Natural Disaster Risk Management in the Philippines Reducing Vulnerability; Pacific Consultants International: Tama, Japan, 2005. [Google Scholar]
  4. Philippine Institute of Volcanology. 1990 July 16 Ms7.8 Luzon Earthquake; Philippine Institute of Volcanology: Manila, The Philippines, 2018.
  5. Yariyan, P.; Zabihi, H.; Wolf, I.D.; Karami, M.; Amiriyan, S. Earthquake risk assessment using an integrated Fuzzy Analytic Hierarchy Process with Artificial Neural Networks based on GIS: A case study of Sanandaj in Iran. Int. J. Disaster Risk Reduct. 2020, 50, 101705. [Google Scholar] [CrossRef]
  6. National Centers for Environmental. Philippines Earthquakes; National Centers for Environmental: Manila, The Philippines, 2021.
  7. Smoczyk, G.M.; Hayes, G.P.; Hamburger, M.W.; Benz, H.M.; Villaseñor, A.; Furlong, K.P. Seismicity of the Earth 1900–2012 Philippine Sea Plate and Vicinity: US. Geological Survey Open-File Report 2010–1083-M 2013, 1 Sheet, Scale 1 10,000,000; USGS: Washington, DC, USA, 2013.
  8. Carteciano, J.A. The Big One Part 2; National Research Council of the Philippines: Manila, The Philippines, 2017.
  9. Carteciano, J.A. The Big One: Facts and Impacts; National Research Council of the Philippines: Manila, The Philippines, 2017.
  10. Williams, L.; Arguillas, F.; Arguillas, M. Major storms, rising tides, and wet feet: Adapting to flood risk in the Philippines. Int. J. Disaster Risk Reduct. 2020, 50, 101810. [Google Scholar] [CrossRef]
  11. Ong, A.K.S.; Prasetyo, Y.T.; Lagura, F.C.; Ramos, R.N.; Sigua, K.M.; Villas, J.A.; Young, M.N.; Diaz, J.F.T.; Persada, S.F.; Redi, A.A.N.P. Factors affecting intention to prepare for mitigation of “the big one” earthquake in the Philippines: Integrating protection motivation theory and extended theory of planned behavior. Int. J. Disaster Risk Reduct. 2021, 63, 102467. [Google Scholar] [CrossRef]
  12. Prasetyo, Y.T.; Castillo, A.M.; Salonga, L.J.; Sia, J.A.; Seneta, J.A. Factors affecting perceived effectiveness of COVID-19 prevention measures among Filipinos during Enhanced Community Quarantine in Luzon, Philippines: Integrating Protection Motivation Theory and extended Theory of Planned Behavior. Int. J. Infect. Dis. 2020, 99, 312–323. [Google Scholar] [CrossRef]
  13. Kurata, Y.B.; Prasetyo, Y.T.; Ong, A.K.; Nadlifatin, R.; Persada, S.F.; Chuenyindee, T.; Cahigas, M.M. Determining factors affecting preparedness beliefs among Filipinos on Taal Volcano eruption in Luzon, Philippines. Int. J. Disaster Risk Reduct. 2022, 76, 103035. [Google Scholar] [CrossRef]
  14. Fan, Y.; Chen, J.; Shirkey, G.; John, R.; Wu, S.R.; Park, H.; Shao, C. Applications of structural equation modeling (SEM) in Ecological Studies: An updated review. Ecol. Process. 2016, 5, 19. [Google Scholar] [CrossRef] [Green Version]
  15. Woody, E. An SEM perspective on evaluating mediation: What every clinical researcher needs to know. J. Exp. Psychopathol. 2011, 2, 210–251. [Google Scholar] [CrossRef]
  16. German, J.D.; Redi, A.A.; Ong, A.K.; Prasetyo, Y.T.; Sumera, V.L. Predicting factors affecting preparedness of volcanic eruption for a sustainable community: A case study in the Philippines. Sustainability 2022, 14, 11329. [Google Scholar] [CrossRef]
  17. Gaillard, J. Alternative paradigms of volcanic risk perception: The case of Mt. Pinatubo in the Philippines. J. Volcanol. Geotherm. Res. 2008, 172, 315–328. [Google Scholar] [CrossRef]
  18. Bolletino, V.; Stevens, A.; Sharma, M.; Dy, P.; Pham, P.; Vinck, P. Public perception of climate change and disaster preparedness: Evidence from the Philippines. Clim. Risk Manag. 2020, 30, 250. [Google Scholar] [CrossRef]
  19. Venable, C.; Javernick-Will, A.; Liel, A.; Koschmann, M. Revealing (mis)alignments between household perceptions and engineering assessments of post-disaster housingsafety in typhoons. Int. J. Disaster Risk Reduct. 2021, 53, 101976. [Google Scholar] [CrossRef]
  20. Yang, W.; Zhou, S. Using decision tree analysis to identify the determinants of residents’ CO2 emissions from different types of trips: A case study of guangzhou, China. J. Clean. Prod. 2020, 277, 124071. [Google Scholar] [CrossRef]
  21. Milani, L.; Grumi, S.; Camisasca, E.; Miragoli, S.; Traficante, D.; Di Blasio, P. Familial risk and protective factors affecting CPS professionals’ child removal decision: A decision tree analysis study. Child. Youth Serv. Rev. 2020, 109, 104687. [Google Scholar] [CrossRef]
  22. Kim, Y.; Hardisty, R.; Torres, E.; Marfurt, K.J. Seismic facies classification using random forest algorithm. SEG Tech. Program Expand. Abstr. 2018, 2161–2165. [Google Scholar] [CrossRef]
  23. Snehil; Goel, R. Flood Damage Analysis Using Machine Learning Techniques. Procedia Comput. Sci. 2020, 173, 78–85. [Google Scholar] [CrossRef]
  24. Chen, J.; Li, Q.; Wang, H.; Deng, M. A Machine Learning Ensemble Approach Based on Random Forest and Radial Basis Function Neural Network for Risk Evaluation of Regional Flood Disaster: A Case Study of the Yangtze River Delta, China. Int. J. Environ. Res. Public Health 2019, 17, 49. [Google Scholar] [CrossRef] [Green Version]
  25. Zagajewski, B.; Kluczek, M.; Raczko, E.; Njegovec, A.; Dabija, A.; Kycko, M. Comparison of random forest, support vector machines, and neural networks for post-disaster forest species mapping of the Krkonoše/Karkonosze Transboundary Biosphere Reserve. Remote Sens. 2021, 13, 2581. [Google Scholar] [CrossRef]
  26. Benemaran, R.S.; Esmaeili-Falak, M.; Javadi, A. Predicting resilient modulus of flexible pavement foundation using extreme gradient boosting based optimised models. Int. J. Pavement Eng. 2022, 1–20. [Google Scholar] [CrossRef]
  27. Moustra, M.; Avraamides, M.; Christodoulo, C. Artificial neural networks for earthquake prediction using time series magnitude data or Seismic Electric Signal. Expert Syst. Appl. 2011, 38, 15032–15039. [Google Scholar] [CrossRef]
  28. Kimes, D.S.; Nelson, R.F.; Manry, M.T.; Fung, A.K. Review article: Attributes of neural networks for extracting continuous vegetation variables from optical and radar measurements. Int. J. Remote Sens. 2010, 19, 2639–2663. [Google Scholar] [CrossRef]
  29. Oktarina, R.; Bahagia, S.N.; Diawati, L.; Pribadi, K.S. Artificial neural network for predicting earthquake casualties and damages in Indonesia. IOP Sci. Earth Environ. Sci. 2020, 426, 012156. [Google Scholar] [CrossRef]
  30. Heidenrich, A.; Masson, T.; Bamberg, S. Let’s talk about flood risk—Evaluating a series of workshops on private flood protection. Int. J. Disaster Risk Reduct. 2020, 50, 101880. [Google Scholar] [CrossRef]
  31. Prasetyo, Y.T.; Senoro, D.B.; German, J.D.; Robielos, R.A.; Ney, F.P. Confirmatory factor analysis of vulnerability to natural hazards: A household Vulnerability Assessment in Marinduque Island, Philippines. Int. J. Disaster Risk Reduct. 2020, 50, 101831. [Google Scholar] [CrossRef]
  32. Vinnell, L.J.; Wallis, A.; Becker, J.S.; Johnston, D.M. Evaluating the ShakeOut drill in Aotearoa/New Zealand: Effects on knowledge, attitudes, and behaviour. Int. J. Disaster Risk Reduct. 2020, 48, 101721. [Google Scholar] [CrossRef]
  33. Becker, J.S.; Paton, D.; Johnston, D.M.; Ronan, K.R.; McClure, J. The role of prior experience in informing and motivating earthquake preparedness. Int. J. Disaster Risk Reduct. 2017, 22, 179–193. [Google Scholar] [CrossRef]
  34. Budhathoki, N.K.; Paton, D.; Lassa, J.A.; Zander, K.K. Assessing farmers’ preparedness to cope with the impacts of multiple climate change-related hazards in the Terai lowlands of Nepal. Int. J. Disaster Risk Reduct. 2020, 49, 101656. [Google Scholar] [CrossRef]
  35. Ataei, P.; Gholamrezai, S.; Movahedi, R.; Aliabadi, V. An analysis of farmers’ intention to use green pesticides: The application of the extended theory of planned behavior and health belief model. J. Rural Stud. 2021, 81, 378–384. [Google Scholar] [CrossRef]
  36. Song, Z.; Shi, X. Cherry growers’ perceived adaption efficacy to climate change and meteorological hazards in Northwest China. Int. J. Disaster Risk Reduct. 2020, 46, 101620. [Google Scholar] [CrossRef]
  37. Aboelmaged, M. E-waste recycling behaviour: An integration of recycling habits into the theory of planned behaviour. J. Clean. Prod. 2021, 278, 124182. [Google Scholar] [CrossRef]
  38. LaMorte, W. The Theory of Planned Behavior; Boston University School of Public Health: Boston, PA, USA, 2019. [Google Scholar]
  39. Memon, M.A.; Ting, H.; Ramayah, T.; Chuah, F.; Cheah, J. A review of the methodological misconceptions and guidelines related to the application of structural equation modeling: A Malaysian scenario. J. Appl. Struct. Equ. Model. 2017, 1, 1–13. [Google Scholar] [CrossRef] [PubMed]
  40. Hair, J.F. Multivariate Data Analysis: A Global Perspective; Pearson: London, UK, 2010. [Google Scholar]
  41. Vogels, E. Millenials Stand Out for Their Technology Use, But Older Generations Also Embrace Digitals Life; Pew Research Center: Washington, DC, USA, 2019. [Google Scholar]
  42. Mallouhy, R.; Jaoude, C.A.; Guyeux, C.; Makhoul, A. Major earthquake event prediction using various machine learning algorithm. In Proceedings of the 2019 International Conference on Information and Communication Technologies for Disaster Management (ICT-DM), Paris, France, 18–20 December 2019. [Google Scholar]
  43. Jahangir, M.H.; Reineh, S.M.M.; Abolghasemi, M. Spatial prediction of flood zonation mapping in Kan River Basin, Iran, using artificial neural network algorithm. Weather Clim. Extrem. 2019, 25, 100215. [Google Scholar] [CrossRef]
  44. Reese, K. Deep learning artificial neural networks for non-destructive archeological site dating. J. Archaeol. Sci. 2021, 132, 105413. [Google Scholar] [CrossRef]
  45. Sharma, S.; Sharma, S.; Athaiya, A. Activation Functions in Neural Network. Int. J. Eng. Appl. Sci. Technol. 2020, 4, 310–316. [Google Scholar] [CrossRef]
  46. Feng, J.; Lu, S. Performance Analysis of Various Activation Function in Artificial Neural Networks. IOP Conf. Ser. J. Phys. Conf. Ser. 2019, 1237, 022030. [Google Scholar] [CrossRef]
  47. Eckle, K.; Schmidt-Heiber, J. A comparison of deep networks with RELU activation function and linear spline-type methods. Neural Netw. 2019, 110, 232–242. [Google Scholar] [CrossRef]
  48. Pi, Y.; Nath, N.D.; Behzadan, A.H. Convultional neural networks for object detection in aerial imagery for disaster response and recovery. Adv. Eng. Inform. 2020, 43, 101009. [Google Scholar] [CrossRef]
  49. Anbarasan, M.; Muthu, B.; Sivaparthipan, C.B.; Sundarasekar, R.; Kadry, S.; Krishnamoorthy, S.; Samuel, D.J.; Dasel, A.A. Detection of flood disaster system based on IoT, big data, and convolutional neural network. Comput. Commun. 2010, 150, 150–157. [Google Scholar] [CrossRef]
  50. Satwik, P.M.; Sundram, M. An integrated approach for weather forecasting and disaster prediction using deep learning architecture based on memory Augmented Neural Network’s (MANN’s). Mater. Today Proc. 2021. [Google Scholar] [CrossRef]
  51. Jena, R.; Pradhan, B.; Beydoun, G.; Nizamuddin, A.; Sofyan, H.; Affan, H. Integrated model for earthquake risk assessment using neural network and analytical heirarchy process: Aceh provincce, Indonesia. Geosci. Front. 2020, 11, 613–634. [Google Scholar] [CrossRef]
  52. Jena, R.; Pradhan, B. Integrated ANN-cross-validation and AHP-TOPSIS model to improve earthquake risk assessment. Int. J. Disaster Risk Reduct. 2020, 50, 101723. [Google Scholar] [CrossRef]
  53. Yousefzadeh, M.; Hosseini, S.A.; Farnaghi, M. Spatiotemporally explicit earthquake prediction using deep neural network. Soil Dyn. Earthq. Eng. 2021, 144, 106663. [Google Scholar] [CrossRef]
  54. Elfwing, S.; Uchibe, E.; Doya, K. Sigmoid-weighted linear units for neural network function approximation in reinforcement learning. Neural Netw. 2018, 107, 3–11. [Google Scholar] [CrossRef] [PubMed]
  55. Pradhan, B.; Lee, S. Landslide susceptibility assessment and factor effect analysis: Backpropagation artificial neural networks and their comparison with frequency ratio and bivariate logistic regression modelling. Environ. Model. Softw. 2010, 25, 747–759. [Google Scholar] [CrossRef]
  56. Brownlee, J. Difference Between A Batch and An Epoch in A Neural Network; Machine Learning Mastery: San Juan, PR, USA, 2019. [Google Scholar]
  57. Bushaev, V. Understanding RMSProp—Faster Neural Network Learning; Towards Data Science: Toronto, ON, USA, 2018. [Google Scholar]
  58. Xu, D.; Zhang, S.; Zhang, H.; Mandic, D.P. Convergence of the RMSProp deep learning method with penalty for nonconvex optimization. Neural Netw. 2021, 139, 17–23. [Google Scholar] [CrossRef]
  59. Kolose, S.; Stewart, T.; Hume, P.; Tomkinson, G.R. Prediction of Military combat clothing size using Decision Trees and 3D body scan data. Appl. Ergon. 2021, 95, 103435. [Google Scholar] [CrossRef]
  60. Aznar, P. Decision Trees: Gini vs Entropy. Quantdare, 2 December 2020. Available online: https://quantdare.com/decision-trees-gini-vs-entropy/#:~:text=The%20Gini%20Index%20and%20the,both%20of%20them%20are%20represented (accessed on 13 December 2022).
  61. Lara, F.; Lara-Cueva, R.; Larco, J.C.; Carrera, E.V.; Leon, R. A deep learning approach for automation recognition of Seismo-volcanic events at the Cotopaxi volcano. J. Volcanol. Geotherm. Res. 2021, 409, 107142. [Google Scholar] [CrossRef]
  62. Kizrak, A. Comparison of Activation Functions for Deep Neural Network; Towards Data Science: Toronto, ON, USA, 2019. [Google Scholar]
  63. Gao, F.; Li, B.; Chen, L.; Shang, Z.; Wei, X.; He, C. A softmax classifier for high-precision classification of ultrasonic similar signal. Ultrasonic 2021, 112, 106344. [Google Scholar] [CrossRef]
  64. Nhu, V.; Hoang, N.; Nguyen, H.; Ngo, P.T.T.; Buo, T.T.; Hao, P.V.; Samui, P.; Bui, D.T. Effective assessment of Keras based deep learning with different robust optimization algorithm for shallow landslide susceptibility mapping at tropical area. Catena 2020, 188, 104458. [Google Scholar] [CrossRef]
  65. Walczak, S.; Cerpa, N. Artificial Neural Network. In Encyclopedia of Physical Science and Technology; Academic Press: Cambridge, MA, USA, 2003; pp. 631–645. [Google Scholar] [CrossRef]
  66. Lam, S. Predicting intention to save water: Theory ofplanned behavior, response efficacy, vulnerability, and perceived efficiency of alternative solutions. J. Appl. Soc. Psychol. 2006, 36, 2803–2824. [Google Scholar] [CrossRef]
  67. Garcia, T.A.; Fairlie, A.M.; Litt, D.M.; Waldron, K.A.; Lewis, M.A. Perceived vulnerability moderates the relations between the use of protective behavioral strategies and alcohol use and consequences among high-risk young adults. Addict. Behav. 2018, 81, 150–156. [Google Scholar] [CrossRef] [PubMed]
  68. Zhao, Y.; Ni, Q.; Zhou, R. What factors influence the mobile health service adoption? A meta-analysis and the moderating role of age. Int. J. Inf. Manag. 2018, 43, 342–350. [Google Scholar] [CrossRef]
  69. Yau, S.; Wongsawat, P.; Songthap, A. Knowledge, Attitude and Perception of Risk and Preventive Behaviors toward Premarital Sexual Practice among In-School Adolescents. Eur. J. Investig. Health Psychol. Educ. 2020, 10, 497–510. [Google Scholar] [CrossRef] [Green Version]
  70. Laato, S.; Islam, A.N.; Laine, T.H. Did location-based games motivate players to socialize during COVID-19? Telemat. Inform. 2020, 54, 101458. [Google Scholar] [CrossRef] [PubMed]
  71. Wu, D. Empirical study of knowledge withholding in cyberspace: Integrating protection motivation theory and theory of reasoned behavior. Comput. Hum. Behav. 2020, 105, 106229. [Google Scholar] [CrossRef]
  72. Guo, C.; Sim, T.; Ho, H.C. Impact of information seeking, disaster preparedness and typhoon emergency response on perceived community resilience in Hong Kong. Int. J. Disaster Risk Reduct. 2020, 50, 101744. [Google Scholar] [CrossRef]
Figure 1. Methodology flowchart.
Sustainability 15 00679 g001
Figure 2. Decision tree (true from first node).
Sustainability 15 00679 g002
Figure 3. Decision tree (false from first node).
Sustainability 15 00679 g003
Figure 4. Optimum Decision Tree.
Sustainability 15 00679 g004
Figure 5. Optimum Training and Testing Output.
Sustainability 15 00679 g005
Figure 6. Box plot.
Figure 6. Box plot.
Sustainability 15 00679 g006
Figure 7. Taylor diagram.
Sustainability 15 00679 g007
Table 1. ANN Parameters.
ParametersReferences
Hidden Layer Activation Function
SwishSharma et al. [45]
EluFeng and Lu [46]; Eckle and Schmidt-Hieber [47]
TanhSharma et al. [45]; Feng and Lu [46]; Eckle and Schmidt-Hieber [47]
Output Layer Activation Function
SoftMaxPi et al. [48]; Anbarasan et al. [49]; Satwik and Sundram [50]; Sharma et al. [45]
ReLuJena et al. [51]; Jena and Pradhan [52]; Yousefzadeh et al. [53]
SigmoidElfwing et al. [54]
Optimizer
AdamEckle and Schmidt-Hieber [47]
RMSPropYousefzadeh et al., [53]
SGDJena et al. [51]; Jena and Pradhan [52]
Table 2. Decision Tree Mean Accuracy (Depth = 6).
Category40:6050:5060:4070:3080:2090:10
Random
Gini59.2160.0160.8958.7758.7756.80
Std. Dev2.3783.5392.8132.4772.4774.624
Entropy57.9260.1260.1760.6358.5256.04
Std. Dev2.6672.6652.6943.1722.7964.373
Best
Gini57.6460.0060.3263.7460.5756.00
Std. Dev0.6320.0000.5330.7610.8840.000
Entropy60.5062.2261.1862.9864.0060.31
Std. Dev0.9970.6460.5310.3790.0001.525
Table 3. Decision Tree Mean Accuracy (Depth = 4).
Category40:6050:5060:4070:3080:2090:10
Random
Gini90.5989.3889.1889.9888.6286.74
Std. Dev5.9737.7498.7656.65010.809.208
Entropy88.9190.0288.7188.4389.5287.93
Std. Dev9.7707.6249.5028.9589.6879.542
Best
Gini94.0094.0096.0096.0096.0095.00
Std. Dev0.0000.0000.0000.0000.0000.000
Entropy94.0093.0095.0092.0094.0093.00
Std. Dev0.0000.0000.0000.0000.0000.000
Table 4. Summary of ANN.
LatentActivation
(H-layer)
Activation
(O-layer)
OptimizerAverage TrainingSTDEVAverage TestingSTDEV
USwishSigmoidAdam73.9823.68767.3612.508
PVSwishSoftMaxRMSProp75.0572.32168.3501.703
PSSwishSigmoidAdam72.0912.97867.3863.109
SNTanhSoftMaxAdam73.5742.87167.5261.870
PBCSwishSigmoidAdam73.7872.55767.3852.501
ASwishSigmoidAdam73.2094.08367.4223.598
MSwishSoftMaxAdam72.4133.30368.3502.121
Table 5. Correlation Analysis.
UPVPSSNPBCAM
PV0.298
PS0.1940.368
SN0.4120.2580.272
PBC0.4770.3070.2350.434
A0.1440.2970.3640.4250.182
M0.2950.2590.3720.4210.4290.363
IP0.4460.6870.4680.6120.4480.4570.596
Table 6. SEM vs. MLA results.
RankingSEMMLA
1MPV
2AM
3PSSN
4SNA
5UPS
6PVPBC
7PBCU
Disclaimer/Publisher’s Note: The statements, opinions and data contained in all publications are solely those of the individual author(s) and contributor(s) and not of MDPI and/or the editor(s). MDPI and/or the editor(s) disclaim responsibility for any injury to people or property resulting from any ideas, methods, instructions or products referred to in the content.

