Article

The Robust Emergency Medical Facilities Location-Allocation Models under Uncertain Environment: A Hybrid Approach

1
Sino-German College, University of Shanghai for Science and Technology, Shanghai 200093, China
2
Business School, University of Shanghai for Science and Technology, Shanghai 200093, China
3
School of Management, Shanghai University, Shanghai 200444, China
4
School of Management Science and Engineering, Nanjing University of Information Science and Technology, Nanjing 210044, China
*
Author to whom correspondence should be addressed.
Sustainability 2023, 15(1), 624; https://doi.org/10.3390/su15010624
Submission received: 2 November 2022 / Revised: 11 December 2022 / Accepted: 26 December 2022 / Published: 29 December 2022
(This article belongs to the Special Issue Sustainable Supply Chain Management and Optimization)

Abstract

:
In emergency medical facilities location, the hierarchical diagnosis and treatment system plays an obvious role in the rational allocation of medical resources and improving the use efficiency of medical resources. However, few studies have investigated the operational mechanism of hierarchical medical systems in uncertain environments. To address this research gap, this paper proposes a hybrid approach for emergency medical facilities’ location-allocation. In the first stage, in order to concentrate on the utilization of medical resources, we choose alternative facility points from the whole facilities through the entropy weight method (EWM). In the second stage, uncertainty sets are used to describe the uncertain number of patients at emergency medical points more accurately. We propose a robust model to configure large base hospitals based on the robust optimization method. Furthermore, the proposed robust models are applied to the emergency management of Huanggang City under COVID-19. The results show that the optimal emergency medical facility location-allocation scheme meets the actual treatment needs. Simultaneously, the disturbance ratio and uncertainty level have a significant impact on the configuration scheme.

1. Introduction

Public health emergencies such as COVID-19 have brought great threats to people and society [1,2,3,4,5]. For timely responses, a hierarchical diagnosis and treatment mode should be established to isolate, control, and treat patients [6,7,8,9,10,11,12]. During the epidemic period, the hierarchical diagnosis and treatment mode [13,14] avoided the paralysis of large hospitals caused by the concentration of a large number of patients, and the use efficiency of medical resources was significantly improved. At the same time, medical resources have been reasonably allocated [15]. It is crucial to improve residents’ satisfaction and happiness [16].
At present, many scholars have investigated facility location problems [17]. Biswas and Pamucar [18] studied the factors affecting the school location decision from the perspective of students. They developed an integrated group decision-making framework, that is, a pivot pairwise relative criteria importance assessment (PIPRECIA). Pamucar et al. [19] conducted location selection for wind farms using a GIS multi-criteria hybrid model based on fuzzy and rough numbers. Boonmee et al. [20] summarized the humanitarian facility location problem. They divided the location problem into a deterministic facility location problem, dynamic facility location problem, stochastic facility location problem, and robust facility location problem, respectively. Deterministic facility location problems form the basis for dynamic, stochastic, and robust models. However, the medical facility location problem is facing more and more uncertainties (e.g., the uncertain number of patients in facility points, the uncertainty of transportation costs, etc.). The deterministic facility location model cannot describe the impact that uncertain parameter changes have on the facility location problem, which has a certain gap with the actual situation. Therefore, the deterministic facility location model has some disadvantages. Stochastic, dynamic, and robust facility location models can be used to respond to real situations. The dynamic programming model is effective for solving multi-stage decision problems. However, the calculation amount of the dynamic facility location problem increases dramatically when the dimension of decision variables increases. Today’s computers still cannot effectively solve large-scale dynamic facility location problems in actual emergency medical responses. For the stochastic facility location, the probability distribution of random parameters needs to be precisely known in advance. In the emergency medical facilities’ location, it is difficult to obtain sufficient historical data to estimate the distribution function of random parameters. In order to overcome the shortcomings of the above three methods, a robust facility location model is proposed in this paper. We take into account the uncertain number of patients at the facility points and use the uncertainty sets to describe the uncertain number of patients more accurately. Therefore, this paper focuses on the robust facility location. Extant examples of the literature have studied the emergency medical facilities’ location through multi-objective programming [21], the analytic hierarchy process (AHP) and technique for order preference by similarity to an ideal solution (TOPSIS) [22], mixed integer linear programming [23,24], and so on. However, the uncertain number of patients in emergency medical sites during the epidemic situation was not taken into account in the above literature, which increased the risk of decision-making in the emergency medical facilities location and was not good for the life and health of patients. Accordingly, we need to focus on decision-making under an uncertain number of patients to reduce the uncertainty risk. On the other hand, the above-mentioned literature rarely utilized the hierarchical diagnosis and treatment system to locate the emergency medical facilities, so medical resources may not be reasonably allocated, and the use efficiency of medical resources may be reduced. Therefore, in order to deal with the impact of the epidemic more economically and effectively, the improvement of the community medical care level and the completion of the system should be the priority task, which is also beneficial to reduce the burden of large hospitals.
The robust optimization theory is widely used to deal with uncertain optimization problems. The solution of robust optimization is such that all the constraints still hold in the worst case. Unlike stochastic programming [25], robust optimization does not require the probability distribution function of the random parameters. However, it assumes that the uncertain parameters fluctuate in an interval [26,27,28,29,30]. Since its emergence, robust optimization theories have been applied to many fields, such as group decision-making [31,32,33,34,35,36], portfolios [37,38,39,40,41], efficiency evaluation [42,43], supply chain management [44,45,46,47,48,49], etc. In emergency medical location decisions, some scholars have adopted the stochastic programming method for modeling [50,51,52,53,54]. However, the stochastic programming needs to know the probability distribution of the patients’ number at the facility point. Due to the urgency of the event, it is impossible to accurately obtain the probability function of the patient’s number at the facility point. Consequently, the stochastic programming method describing the fluctuation of the patient’s number has defects. Hence, in order to overcome the shortcomings of the stochastic programming, we adopted the robust optimization method to handle the uncertainty of the patients’ number in the emergency medical facilities’ location.
In order to effectively avoid the paralysis of large hospitals caused by the concentration of a large number of patients and to significantly improve the use efficiency of medical resources, this paper proposes a hierarchical diagnosis and treatment system for the emergency medical facilities located under the background of the epidemic. Therefore, a hybrid evaluation method, including EWM and the robust optimization method, is proposed for modeling. We have a two-step plan for post-outbreak isolation and treatment. In the first stage, 10 facilities with the highest scores are selected from 30 facilities by EWM as community emergency medical points. When there are critical patients who cannot be handled by community medical centers, the second stage of decision-making is to send the critical patients to large base hospitals for treatment. We construct a robust location model with capacity and time window constraints with the presence of an uncertain number of patients to configure a large rear hospital.
Different from previous studies, this paper proposes a hybrid approach to cope with the emergency facilities’ location problems. This approach contains two-stage decisions under a hierarchical diagnosis system. The first stage decision is to obtain reasonable alternative points from all possible facility points. The second stage decision is to optimally configure the rear hospital under uncertain demand. The contributions of this paper are as follows: Firstly, this paper studies the location-allocation of emergency medical facilities under the hierarchical diagnosis and treatment mode. A hybrid location-allocation decision for emergency medical facilities is also investigated. In the first stage, alternatives are selected from all facility points by EWM. In the second stage, considering the uncertain number of patients at emergency facility points, this paper uses uncertainty sets to describe the number of patients more accurately. On this basis, a robust model with capacity and time window constraints is constructed to allocate large base hospitals. The proposed method fully takes into account the uncertainties when the epidemic occurs. The results of location-allocation significantly reduce the risk of decision-making and provide a strong guarantee for people’s health. Therefore, the optimization problem in this paper is in line with the actual situation when the epidemic occurs. Secondly, the robust optimization model is equivalently transformed into a mixed integer linear programming problem by utilizing the duality theory. The robust counterpart model can be solved in polynomial time. Finally, we conduct simulation experiments on the proposed model through the location-allocation scheme of emergency medical facilities in Huanggang City during the COVID-19 epidemic. The results verify the feasibility and robustness of the proposed model. Sensitivity analysis also shows the effectiveness of the proposed method. The proposed method of this paper can provide reference and compliance for health departments to effectively carry out regular epidemic prevention and control.
The remainder of this paper is organized as follows. Section 2 presents the framework and preliminaries; Section 3 derives the emergency facilities location modeling. Section 4 specifies numerical experiments; Section 5 concludes.

2. The Framework and Preliminaries

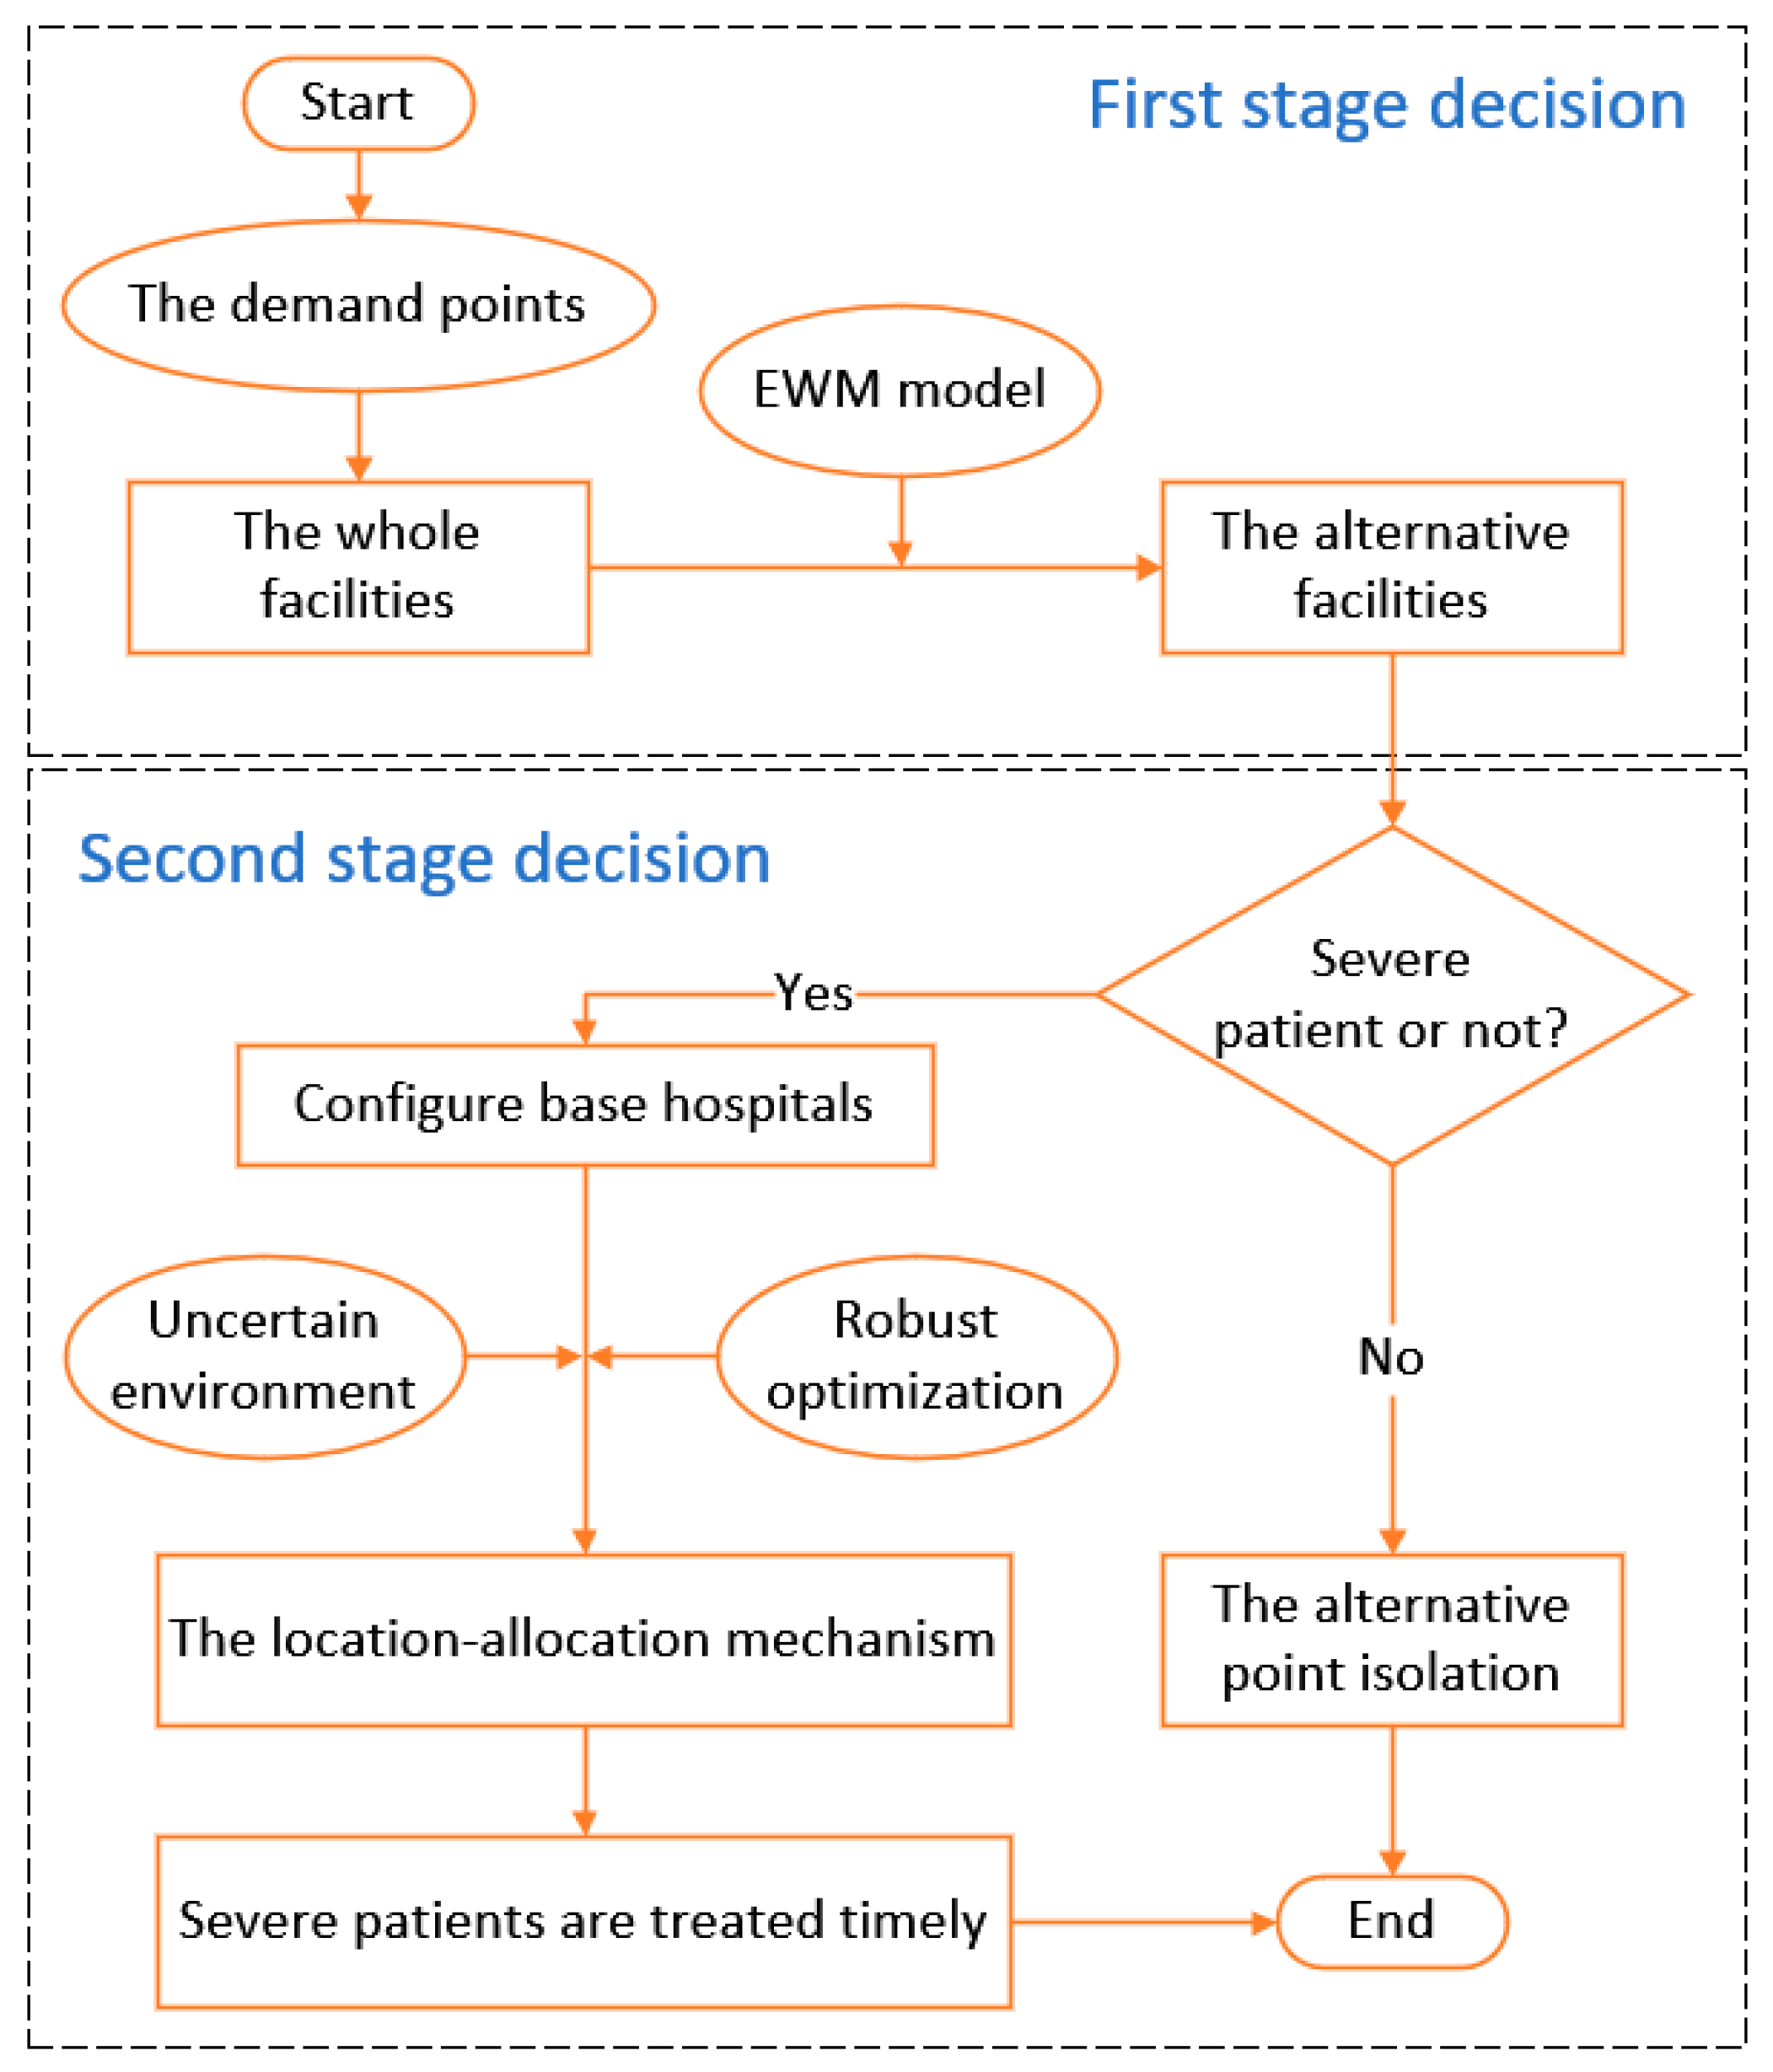
2.1. The Framewrok of This Paper

The framework of this paper is shown in Figure 1. A hierarchical diagnosis and treatment mode is proposed to cope with the impact of the pandemic. Firstly, it is unrealistic to establish emergency medical facilities at every point, considering the ease of the centralized utilization of medical resources. Hence, EWM was utilized to choose alternative facilities from the whole facilities in the first stage. Secondly, when patients at the facility points are critically ill, the robust optimization approach is used to configure the large rear hospital in the case of the uncertain number of patients in the second stage. The time window constraint is also constructed to ensure the timely treatment of patients. When patients at the facility are mild patients, they are directly isolated at the emergency medical point. Accordingly, a hybrid approach for emergency medical facilities location-allocation is proposed.

2.2. Assumptions and Notation

In order to facilitate modeling, the following assumptions were made:
  • The established emergency medical facilities can meet the medical needs of patients in the city, regardless of the situation of transferring patients to other cities.
  • The radiation range of each facility is a small area, and the patients’ number, which they receive, is the sum of the patients’ number in the area.
  • All critically ill patients are treated by large rear hospitals, which do not occupy the medical resources of the facility point. Additionally, the rear hospitals can meet the treatment needs of the assigned critically ill patients.
The notation in this paper is illustrated in Table 1.

3. Emergencies Facilities Location Modeling

3.1. Emergency Medical Facilities Alternatives Selection Based on EWM

In this section, we will reveal the first stage of the hybrid approach. Taking into account the ease of the centralized utilization of medical resources, it is impossible for public health departments to establish emergency medical facilities at every point. The scientific and rational decision is to select some facilities from the total of facilities as alternatives. Consequently, this paper utilizes EWM to make location decisions.
As an objective and comprehensive weighting method, EWM determines weight mainly based on the information amount transmitted to decision-makers by each index, which can effectively avoid the influence of subjective factors. Then, we can make weight calculations more scientific and reasonable. The advantages of EWM are as follows: (1) EWM can deeply reflect the ability to distinguish indicators and determine a good weight; (2) Wight assignment is more objective, theoretical, and reliable; (3) The procedure is simple and easy to practice, EWM does not require other software analysis. Therefore, the EWM method was utilized to make the first-stage decision in this paper.
The selection principles of the evaluation indicators are as follows: (1) Objective and true principles. The selected indicators should be objective and true. The data sources should be based on the official data information so as to ensure that the indicators can objectively reflect the real situation of each region and avoid deviations between the data that are caused by personal subjective assumptions and the actual situation. (2) Operability principle. Ensure that the selected index data can be obtained from statistical information released by national government departments or official media. Avoid indicators with vague information or a different statistical caliber. Additionally, we should adopt relatively easy-to-obtain and relatively stable indicator information. (3) Principle of representativeness. The selected indicators should have a certain logical relationship with each other to reflect the overall situation of each region to the greatest extent. The number of indicators should be moderate. Too many indicators will lead to high similarity, which greatly reduces computational efficiency. However, too few indicators will lead to a lack of convincing evaluation results, which is not conducive to reflecting the real situation.
According to the selection principle of evaluation indicators, this paper mainly considers three influential factors of facility location, namely cost factor, capacity factor, and infrastructure factor. Then, we constructed the evaluation index system of emergency medical locations during the epidemic situation, including the construction cost of facilities, transportation convenience, the patients’ number that the facility can accommodate, regional population density, accessibility of patients, and the number of hospitals within 10 km. In terms of cost factors, due to the particularity of emergency medical facilities, this paper only considers the construction cost of facilities. Construction costs are determined according to the scale of the facility point. It is the most representative of all the cost-influencing factors. The capacity factor mainly considers the population density in the region and the number of people that can be accommodated at the facility. The capacity limit of the emergency medical point determines its maximum service capacity. The emergency treatment demand needed to be met in the administrative area to the greatest extent. As infrastructure factors, the transportation convenience degree and the accessibility of the patients are sufficient to ensure that the infected are treated and isolated in the first place to prevent more people from becoming infected. The number of hospitals within 10 km can ensure that patients have access to transfer care and medical supplies at the large base hospital when the infected experience deterioration.
The procedure for selecting emergency medical facilities alternatives with the EWM are as follows.
Step 1: Construct the index matrix X . Let the Y = { y 1 , y 2 , , y n } indicate the necessary numbers of health care providers (i.e., all the facilities points) and A = { a 1 , a 2 , , a m } means the evaluation indicators. Let I = { 1 , 2 , , n } and J = { 1 , 2 , , m } be number sets. x i j is the value of the j - t h evaluation index under the facility point i , and the index matrix X is as follows:
X = ( x i j ) n × m = [ x 11 x 12 x 1 m x 21 x 22 x 2 m x n 1 x n 2 x n m ]
Step 2: Normalize the index matrix. Since the measurement units of each index are not uniform, it is necessary to standardize them to homogenize the heterogeneous indexes. Positive indicators and negative indicators are utilized for data standardization processing. In addition, the higher the positive indicator value is, the better. Additionally, the lower the negative indicator value is, the better. The specific methods are as follows.
Positive indicators:
x i j = x i j min { x i j , , x n j } max { x 1 j , , x n j } min { x 1 j , , x n j }
Negative indicators:
x i j = max { x 1 j , , x n j } x i j max { x 1 j , , x n j } min { x i j , , x n j }
Then, the normalized index matrix is:
X = ( x i j ) n × m = [ x 11 x 12 x 1 m x 21 x 22 x 2 m x n 1 x n 2 x n m ]
Step 3: Calculate the information entropy value of the j - t h index.
ε j = 1 ln ( n ) | i = 1 n p i j ln ( p i j ) | , j = 1 , 2 , , m .
Here, p i j = x i j / i = 1 n x i j is the proportion of the i - t h emergency medical facility points under the j - t h indicator when p i j = 0 , ln ( p i j ) is meaningless. In this case, the definition of p i j needs to be amended, that is, p i j = ( 1 + x i j ) / i = 1 n ( 1 + x i j ) .
Step 4: Calculate the entropy weight ω j of each index.
ω j = 1 ε j | m j = 1 m ε j |
Step 5: Calculate the comprehensive score s i for each emergency medical facility point.
s i = j = 1 m ω j p i j , i = 1 , 2 , , n .
Therefore, if the information entropy of one index is smaller, it indicates that the variation degree of its index value is greater. The more information it provides, the greater the role it plays in the comprehensive evaluation, and the greater its weight should be. Hence, in the specific analysis process, entropy can be used to calculate the weight of each index according to the variation degree of each index value. Additionally, all the indexes are then weighted to obtain a more objective, comprehensive evaluation result.

3.2. The Deterministic Model

In this section, we allocate the large rear hospital for the alternative facility points by using the robust optimization method to ensure the timely treatment of patients in the second stage.
After a comprehensive evaluation by EWM, the alternative sites were selected. Due to limited medical conditions, emergency medical centers can only be used as a place for treating ordinary patients. When patients are seriously ill, they still need to be sent to a large rear hospital for treatment. Accordingly, we also need to configure the large rear hospitals. We should rationally allocate these emergency medical facility points to rear large hospitals through quantitative analysis. On the basis of considering the capacity limitation of base hospitals and the time window limitation of treating patients, the emergency medical facilities configuration (EMFC) model was constructed with the goal of minimizing the total cost. Thus, a complete emergency medical security system was formed that can respond to public health emergencies.
When the patients’ number of k type in the emergency medical facility i is known as d i k , the deterministic model (DM) is as follows:
min   i I f i x i + i I j J k K c t h i j θ k d i k y i j + i I j J p ( t i j ) x i
s . t . i I x i S
j J y i j = 1 , i I
y i j x i , i I , j J
i I k K θ k d i k y i j c j , j J
p ( t i j ) = { 0   ,   0 t i j < E T c p ( t i j E T )   ,   E T t i j < L T +   ,   t i j L T , i I , j J
x i { 0 , 1 } , i I
y i j { 0 , 1 } , i I , j J
The objective function minimizes the total cost, which is composed of the operating cost of the emergency medical facility point, the patient transfer cost from the emergency facility point to the large rear hospital, and the penalty cost that fails to meet the optimal treatment time window.
The constraint conditions are represented from Equation (9) to Equation (15). Specifically, Equation (13) is the penalty cost function defined in this paper. The travel time t i j is determined by the ratio between the distance from the facility point to the hospital and the average speed of the transport vehicle, i.e., ( t i j = h i j /   v ¯ j , i I , j J ). When the patient’s condition becomes worse, the optimal treatment time is E T and the recoverable time window is [ E T , L T ] . When 0 t i j < E T , the patient can arrive at the base hospital for treatment with no penalty cost, i.e., ( p ( t i j ) = 0 ). When the patient arrives in the time window [ E T , L T ] , a punishment cost c p ( t i j E T ) is generated. Additionally, p ( t i j ) will increase with the increase in the arrival time. Once the patient’s arrival time exceeds the latest recoverable time L T , the patient’s life safety is endangered, and the cost increases infinitely.
In addition, Equation (9) represents the maximum number of opened emergency medical facility points. Equation (10) indicates that each emergency medical facility point is serviced by one large rear hospital and can only be served by one rear hospital. Equation (11) means that patients can be sent to the rear hospital for treatment only when the emergency medical facilities have opened. Equation (12) indicates that the number of patients sent from the emergency facility point to the large rear hospital does not exceed the maximum service capacity of the hospital. Equation (14) and Equation (15) are both a 0–1 integer decision variable.

3.3. The Robust Model

When a public health emergency occurs, the number of patients is highly uncertain. Therefore, this paper draws on the robust decision idea of Bertsimas and Sim; we adopted the absolute robust criterion to optimize the target from the worst case [30]. Specifically, we used d ˜ i k to represent the patients’ number of k type in the emergency medical facility point i under uncertain circumstances. Then, we had d ˜ i k [ d i k d ^ i k ξ i k , d i k + d ^ i k ξ i k ] , where d i k is the nominal value and d ^ i k is its disturbance value.
Under the disturbance of uncertain parameters, the original deterministic model can be equivalently transformed into the following robust optimization (RM) model:
min { i I f i x i + max ξ U p i I j J k K c t h i j θ k ( d i k + d ^ i k ξ i k ) y i j + i I j J p ( t i j ) x i } = min { i I f i x i + i I j J k K c t h i j θ k d i k y i j + i I j J p ( t i j ) x i + max ξ U p i I j J k K c t h i j θ k d ^ i k ξ i k y i j }
s . t . ( 9 ) ~ ( 11 ) ,   ( 13 ) ~ ( 15 )
i I k K θ k d i k y i j + max ξ U p i I k K θ k d ^ i k ξ i k y i j c j , j J
Here, Equation (16) minimizes the total cost of the system in the worst case. Equation (17) indicates that the number of patients transported from the emergency medical facility point to the base hospital cannot exceed the maximum service capacity of the hospital in the worst case. In order to further specify the proposed robust model, three models based on different uncertainty sets were introduced as follows.

3.3.1. Budgeted Uncertainty Set

Proposition 1. 
If the uncertain patients’ number is defined as a budgeted uncertainty set, that is, U p = { ξ :   i I ξ i k Γ k ,   0 ξ i k 1 ,   k K } , we can obtain the following robust equivalent model (REM):
min   i I f i x i + i I j J k K c t h i j θ k d i k y i j + i I j J p ( t i j ) x i + η
s . t . η i I k K u i k + k K v k Γ k
u i k + v k c t h i j θ k d ^ i k y i j , i I , j J , k K
u i k , v k 0 , i I , k K
i I x i S
j J y i j = 1 , i I
y i j x i , i I , j J
i I k K θ k d i k y i j + i I k K u i k + k K v k Γ k c j , j J
u i k + v k θ k d ^ i k y i j , i I , j J , k K
u i k , v k 0 , i I , k K
p ( t i j ) = { 0   ,   0 t i j < E T c p ( t i j E T )   ,   E T t i j < L T +   ,   t i j L T ,   i I , j J
x i { 0 , 1 } , i I
y i j { 0 , 1 } , i I , j J
Here, η is the auxiliary variable. u i k and v k are the dual variable of the problem (16). u i k and v k are the dual variable of the problem (17).
Proof of Proposition 1. 
Because the definition of the budgeted uncertainty set is U p = { ξ : i I ξ i k Γ k ,   0 ξ i k 1 ,   k K } , then the maximization problem max ξ U p { i I j J k K c t h i j θ k d ^ i k ξ i k y i j } in Equation (16) is equivalent to Equation (31).
max   i I j J k K c t h i j θ k d ^ i k ξ i k y i j s . t . i I ξ i k Γ k                 0 ξ i k 1                 i I , k K
According to the strong duality theory, the dual variables u i k and v k are introduced, respectively. Additionally, we can further obtain Equation (32).
min   i I k K u i k + k K v k Γ k s . t . u i k + v k c t h i j θ k d i k y i j                 u i k , v k 0                   i I , j J , k K
Hence, we can transform the inner layer maximization problem into the minimization problem, and introduce the auxiliary variable η to obtain the robust equivalent model from Equations (18)–(21).
Similarly, according to the strong duality theory, the dual variables u i k and v k are, respectively introduced for Equation (17), and the inner layer maximization problem is transformed into the minimization problem. Thus, Equations (25)–(27) are obtained. □

3.3.2. Box Uncertainty Set

Proposition 2. 
If the uncertain patients’ number is defined as a box set, that is, Z b o x = { ζ R M : ζ ψ } , ψ is the level of parameter uncertainty and the robust counterpart model in Section 3.3 can be constructed as follows:
min   i I f i x i + i I j J k K c t h i j θ k d i k y i j + ψ i I j J k K c t h i j θ k d ^ i k y i j + i I j J p ( t i j ) x i
s . t . i I x i S
j J y i j = 1 , i I
y i j x i , i I , j J
i I k K θ k d i k y i j + ψ i I k K θ k d ^ i k y i j   c j , j J
p ( t i j ) = { 0   ,   0 t i j < E T c p ( t i j E T )   ,   E T t i j < L T +   ,   t i j L T , i I , j J
x i { 0 , 1 } , i I
y i j { 0 , 1 } , i I , j J
Proof of Proposition 2. 
Suppose i I f i x i + i I j J p ( t i j ) x i = Q . According to the definition of the box set, the uncertain patients’ number can be written as:
i I j J k K c t h i j θ k d i k y i j + i I j J k K ζ c t h i j θ k d ^ i k y i j +   Q H , ( ζ R M : ζ ψ )
Then, we can obtain:
i I j J k K ζ c t h i j θ k d ^ i k y i j H i I j J k K c t h i j θ k d i k y i j Q , ( ζ R M : ζ ψ )
In the worst case, we have:
max ζ ψ i I j J k K ζ c t h i j θ k d ^ i k y i j H i I j J k K c t h i j θ k d i k y i j Q
Because the maximum value on the left side of the inequality is ψ i I j J k K c t h i j θ k d ^ i k y i j , the explicit constraint form can be obtained:
i I j J k K c t h i j θ k d i k y i j + ψ i I j J k K c t h i j θ k d ^ i k y i j + Q H
Similarly, the robust counterpart of constraint 12 can be obtained. Therefore, the model based on the box uncertainty set is proved. □

3.3.3. Ellipsoid Uncertainty Set

Proposition 3. 
If the uncertain patients’ number is defined as an ellipsoid set, that is, Z e l l i p s o i d = { ζ R M : ζ 2 Ω } , Ω is the level of parameter uncertainty and the robust counterpart model in Section 3.3 can be built as follows:
min   i I f i x i + i I j J k K c t h i j θ k d i k y i j + Ω ( i I j J k K c t h i j θ k d ^ i k y i j ) 2 + i I j J p ( t i j ) x i
s . t . i I x i S
j J y i j = 1 , i I
y i j x i , i I , j J
i I k K θ k d i k y i j + Ω ( i I k K θ k d ^ i k y i j ) 2 c j , j J
p ( t i j ) = { 0   ,   0 t i j < E T c p ( t i j E T )   ,   E T t i j < L T +   ,   t i j L T , i I , j J
x i { 0 , 1 } , i I
y i j { 0 , 1 } , i I , j J
Proof of Proposition 3. 
Suppose i I f i x i + i I j J p ( t i j ) x i = Q . According to the definition of the ellipsoid set, the uncertain patients’ number can be written as:
i I j J k K c t h i j θ k d i k y i j + i I j J k K ζ c t h i j θ k d ^ i k y i j +   Q H , ( ζ R M : ζ 2 Ω )
Then, we can obtain:
i I j J k K ζ c t h i j θ k d ^ i k y i j H i I j J k K c t h i j θ k d i k y i j Q , ( ζ R M : ζ 2 Ω )
At worst case, we have:
max ζ 2 Ω i I j J k K ζ c t h i j θ k d ^ i k y i j H i I j J k K c t h i j θ k d i k y i j Q
Consequently, the explicit form of the above formula can be obtained as:
i I j J k K c t h i j θ k d i k y i j + Ω ( i I j J k K c t h i j θ k d ^ i k y i j ) 2 + Q H
Similarly, the robust counterpart of constraint 12 can be obtained. Therefore, the model based on the ellipsoid uncertainty set is proved. □

4. Simulations

In order to verify the proposed method, this section shows an emergency management example under COVID-19.

4.1. Background and Data Sources

This paper chooses Huanggang City to conduct a numerical experiment, which was severely affected by the coronavirus. Huanggang has a total of 10 administrative areas. We took the township as the emergency demand points unit to carry out the detailed division for a total of 127 demand points. The emergency medical facility point is a large open area with flat terrain and convenient transportation. A total of 30 points are selected. Simultaneously, seven large rear hospitals with grades II and above were selected. The number of people per emergency demand point was obtained from the National Bureau of Statistics in 2017, while the number of confirmed COVID-19 patients in Huanggang was obtained from the National Health Commission of the People’s Republic of China released on 21 March 2020.
The selection of emergency facilities is based on the service capacity (i.e., Hongshan stadium), that is, c e = v e n u e s   b e d s v e n u e s   a r e a × f a c i l i t i e s   p o i n t   a r e a . The attraction factor of the facility point is calculated by the hospitals’ number within 10 km of each facility point. The reference attraction factor was one, and the attraction factor increased by 0.1 for each additional hospital, and so on. The relevant data of the demand points, emergency medical facility points, large rear hospitals, and the number of patients are shown in Table 2, Table 3, Table 4 and Table 5, respectively. The detailed distribution of the residents’ demand points, candidate facility points, and large rear hospitals is shown in Figure 2. The color distribution of each administrative area is determined according to the number of local patients with COVID-19. The more patients, the darker the color will be.
The distance between the two points was calculated according to the longitude and latitude coordinates. Equation (33) can be utilized to convert the coordinates of longitude and latitude into the actual traveling distance h i j between the two nodes i and j .
h i j = k ( x i x j ) 2 + ( y i y j ) 2 180 π 6370
Here, ( x i , y i ) , ( x j , y j ) is the longitude and latitude coordinates of the two points. The radius of the earth is 6370 (km). The formula ( x i x j ) 2 + ( y i y j ) 2 180 π 6370 is used to calculate the linear distance between the two points. The linear distance of the two points for 50 groups was extracted, and we compared this with the actual driving distance obtained from the Baidu map. The error value was obtained.

4.2. The Alternative Facilities Selection Based on EWM

The initial index data matrix of the candidate emergency medical facility points is composed of the following factors: the construction cost of facilities, transportation convenience, the patients’ number that can be accommodated, regional population density, the accessibility of patients, and the number of hospitals within 10 km. Among them, the construction cost of the facility point is calculated at 1000 yuan per square meter. Transportation convenience is determined by the distance between the facility point and the nearest provincial or national highway. The accessibility of patients is determined based on the maximum time it takes for the demand point to reach the candidate facility point. The regional population density (10,000 people per square kilometer) is obtained according to the area and population of the region.
According to Equations (5) and (6), the information entropy value and weight vector of the six evaluation indexes for the normalized matrix are obtained, as shown in Table 6. Meanwhile, the comprehensive evaluation score of each candidate emergency medical facility is calculated, si = (0.3395;0.3860;0.1694;0.8913;0.1325;0.4670;0.7570;0.6649;0.4847;0.6181;0.2177; 0.2641;0.6105;0.6263;0.2178;0.1831;0.6789;0.4127;0.5967;0.1523;0.6507;0.0876;0.6078; 0.1077;0.3519;0.1659;0.1309;0.2888;0.2024;0.1601).
According to the comprehensive evaluation value Si, ten emergency medical facilities with high evaluation values were selected: 4, 7, 8, 10, 13, 14, 17, 19, 21, and 23.

4.3. Robust Solution Process

After the alternative emergency medical facilities are selected by EWM, large rear hospitals should be configured rationally to ensure that severe patients can receive timely treatment. According to Equation (33), the distance hij  between each facility point and the base hospital is obtained, as shown in Table 7. Other relevant parameters are set as: ct = 10, cp = 6, v ¯ j = 35 km/h, ET = 120 min, LT = 480 min, θ1 = 1, θ2 = 0.5, θ3 = 0.1. When the uncertain level Γk is considered, it is assumed that the variation amplitude of the corresponding constraints is equal (i.e., Γk = Γ) and Γ is an all integer. In this paper, MATLAB R2016a was utilized for programming, and CPLEX was called to solve the problem under the experimental environment of 8 GB memory and 1.60 GHz CPU with Intel Core i5.

4.4. Result Analysis

When the disturbance ratio is 2%, and the uncertain level is Γ = 5, the configuration scheme is (4-7,7-1,8-5,10-2,13-4,14-5,17-3,19-3,21-5,23-6). The specific configuration scenario is shown in Figure 3. The green dot is the demand point of the residents, the blue square is the selected emergency medical facility point, and the red five-pointed star is the large rear hospital. The connecting line indicates the service relationship between the demand point, the facility point, and the base hospital. As can be seen from Figure 3, the needs of residents in each township have been met. The alternative emergency medical facility points (4,7,8,10,13,14,17,19,21,23) have corresponding large base hospitals to provide first-aid support to ensure the further transfer and treatment of critically ill patients. In addition, the optimal facility points are evenly distributed. One emergency medical facility has been established in each of the 10 administrative regions of Huanggang to ensure that the needs of the residents in each administrative region can be effectively covered by the emergency medical facility points. Additionally, the total traveled distance can be reduced. Similarly, we can obtain configuration plans in other scenarios. Due to space limitations, these will not be displayed here
The change in the optimal configuration scheme with a different uncertain level Γ and disturbance proportions is shown in Table 8. The optimal configuration scheme between the large base hospital and emergency medical facilities has also changed with the presence of uncertain patient numbers.
The change in the total cost with a different uncertainty level Γ and disturbance proportions is shown in Figure 4. When Γ = 0, the robust model is equivalent to the deterministic model, and the total cost is 4.47009 × 10⁹. Compared with the robust configuration model, the emergency medical facilities configuration deterministic model (EMFC) is not robust because it does not take into account the uncertain number of patients at the emergency medical points, so it has a certain deviation from the actual situation. As can be seen from Figure 4, the total cost increases with the increase in the uncertainty level Γ when the disturbance proportion remains unchanged. Additionally, the higher the disturbance proportion is, the higher the total cost will be when the uncertainty level remains unchanged. Simultaneously, the uncertainty level Γ can measure the risk preference of decision-makers to some extent. Accordingly, decision-makers can choose the optimal combination of uncertainty levels and the disturbance proportion according to their preference degree to the uncertain risk. If the decision-maker pursues a preference for risk, he can choose a small level of uncertainty and disturbance ratio. However, he must bear the possible losses caused by uncertainty in mind. If the decision-maker has a preference for risk aversion, he can select a large uncertainty level and disturbance proportion to provide a large probability guarantee for the effectiveness and feasibility of the configuration scheme. However, the total cost of the system operation will increase. If the decision-maker is risk neutral, he can choose a compromise.
It is worth mentioning that although the total cost varies with different disturbance proportions and uncertainty levels, there are only six configuration schemes. This further indicates that the model has good robustness, and the optimal scheme is not sensitive to parameter perturbation. Among them, the solution of the deterministic model is (4-7,7-1,8-5,10-2,13-4,14-5,17-3,19-3,21-3,23-6), as shown in Figure 5. The former number represents the emergency medical facility point, and the latter number indicates the large rear hospital that serves it when a patient is in an emergency. The blue dot in the figure represents the whole emergency medical facility, the red five-pointed star represents the large rear base hospital, and the black dotted line shows the service relationship between the emergency medical facility and the base hospital. When the disturbance proportion and uncertainty level Γ are small, the configuration scheme is (4-7,7-1,8-5,10-2,13-4,14-5,17-3,19-3,21-5,23-6), as shown in Figure 6. Additionally, the decision-maker with a risk preference can choose this scheme. When the disturbance proportion and uncertainty level Γ are large, the configuration scheme is (4-7,7-1,8-4,10-2,13-5,14-4,17-3,19-2,21-5,23-7), as shown in Figure 7. Additionally, the decision-maker with a risk aversion can choose this scheme. The rest of the configuration schemes are (4-7,7-1,8-5,10-2,13-5,14-5,17-3,19-3,21-5,23-6), (4-7,7-1,8-4,10-2,13-5,14-5,17-3,19-3,21-5,23-6), and (4-7,7-1,8-4,10-2,13-5,14-4,17-3,19-2,21-5,23-6). In this case, the decision-maker with risk neutrality can choose this solution. We will not show the configuration scheme figures here.
The calculation time of each scheme is shown in Figure 8. The shortest time is 1.9127 s, and the longest time is 11.6776 s. Additionally, the average time is 7.54 s, which meets the actual demand. As can be seen from Figure 8, compared with the robust configuration model, the deterministic EMFC model is not robust because it does not take into account the uncertain number of patients at the emergency medical points. Therefore, the solution time of the EMFC model is not sensitive to uncertain level parameters Γ. When the Γ is small, the solution time is relatively short. When the Γ is large, the solution time increases. This is because the increase in the uncertainty level leads to an increase in the search range of the solution, which in turn leads to an increase in the solution time. However, the longest solution time is only about 12 s, which fully meets the actual demand.
To sum up, this paper takes Huanggang City as an example to provide the optimal emergency medical facilities location and configuration scheme under COVID-19. Moreover, the impact of uncertain parameters on the total target cost, configuration scheme, and solution time of the model is deeply analyzed. Additionally, the feasibility and robustness of the proposed method are verified.

5. Conclusions

5.1. Discussions

This paper investigates a hierarchical diagnosis and treatment system for emergency medical facilities’ location-allocation under uncertain circumstances. Firstly, taking into account the ease of the centralized utilization of medical resources, we adopted EWM to select alternative facilities from the whole of the facilities. Secondly, three uncertainty sets were introduced to describe the uncertainty of the patients’ number. A robust optimization model with capacity and time window constraints was constructed to configure the large rear hospital to ensure the timely treatment of patients. The comparison between Figure 4 and Figure 8 shows that although the total cost and solution time of the deterministic location-allocation model is lower, the deterministic model is not robust and cannot effectively describe the uncertain number of patients under the epidemic situation. However, the robust optimization model proposed in this paper not only considers the actual uncertain number of patients but also does not need to know the probability distribution of the number of patients in advance. Additionally, the solution time of the robust model is less than 12 s, which is very consistent with the actual situation. Finally, numerical simulation experiments were conducted to solve the emergency medical facilities’ location and configuration in Huanggang City under COVID-19. The results show that the location-allocation decision method proposed in this paper is scientific and effective. The proposed method can meet the treatment needs of patients after public health emergencies and effectively reduce driving time.
During the epidemic period, the hierarchical diagnosis and treatment mode avoids the paralysis of large hospitals caused by the concentration of a large number of patients. It significantly improves the use efficiency of medical resources. This study proposes a hybrid approach of emergency medical facility location-allocation. We have a two-step plan for post-outbreak isolation and treatment. In the first stage, 10 facilities with the highest scores are selected from 30 facilities by EWM, which are regarded as community emergency medical points. When there are critical patients who cannot be handled by community medical centers, the second stage is to send the critical patients to large base hospitals for treatment.
The hierarchical diagnosis and treatment mode plays an obvious role in reversing the unreasonable pattern of medical resource allocation and solving the problem of unbalanced medical resource allocation during the epidemic period. Based on the construction of a coordinated medical and health service network between urban and rural areas, the hierarchical diagnosis and treatment mode has rationally allocated medical resources, effectively revitalized the stock of medical resources, and improved the allocation and use efficiency of medical resources by relying on the majority of hospitals and grassroots medical and health institutions. The most economical and effective measures to deal with the epidemic are to improve the level of community medical care and complete the system. Therefore, this study has a certain practical significance for public health authorities to improve the scientific level of epidemic prevention and control.

5.2. Future Directions

The proposed method in this paper can provide a scientific and reasonable reference for decision-makers to choose the optimal facility layout plan. In order to further improve the practical application value of the proposed model, future research work will refine the factors affecting the location decision. Additionally, we could consider the existence of various factors, such as the traffic time uncertainty under different road congestion conditions and resource constraints, and isolation from the public, so as to further investigate the robust optimization model. In future research directions, we can also consider the impact of facility interruption on the hierarchical diagnosis system, which will make the emergency medical location-allocation model more realistic. Meanwhile, this paper only studies the budgeted uncertainty model. The next work can be compared with the box uncertainty model and ellipsoid uncertainty model, which can further illustrate the effectiveness of the proposed method.
In addition, group consensus plays an important role in decision-making [55,56,57,58]. In future studies, we can invite experts from different fields to help emergency management departments make better decisions through the consensus-building process. There are various methods for facility location. This paper only studies the impact of the robust optimization method on facility location. In the future, we can extend the fuzzy rough decision-making approach [59] and multi-criteria decision-making [60] to the emergency medical facilities location. Supply chains have become a hot research field in recent years [61]. In the future, we can study how to improve the fairness and efficiency of supply chains in the transportation of emergency medical supplies. In the future, we can consider adding machine learning [62] methods to the location of emergency medical facilities.

Author Contributions

Conceptualization, L.W. and M.Y.; data curation, F.X. and M.Y.; formal analysis, L.W. and M.Y.; investigation, F.X. and S.Q.; methodology, L.W. and M.Y.; resources, F.X.; validation, F.X. and M.Y.; writing—original draft, L.W. and M.Y.; writing—review and editing, F.X., S.Q. and M.Y. All authors have read and agreed to the published version of the manuscript.

Funding

This research was supported by the National Natural Science Foundation of China (No. 72171149, 72171123).

Institutional Review Board Statement

Not applicable.

Informed Consent Statement

Not applicable.

Data Availability Statement

The data used to support the findings of this study are available from the database with the web address http://www.nhc.gov.cn/ (accessed on 21 March 2020). The data presented in this study are available on request from the corresponding author.

Acknowledgments

The authors would like to thank the anonymous reviewers for their comments and suggestions.

Conflicts of Interest

The authors declare that they have no conflicts of interest.

References

  1. Liu, J.; Bai, J.Y.; Wu, D.S. Medical supplies scheduling in major public health emergencies. Transp. Res. Part E Logist. Transp. Rev. 2021, 154, 102464. [Google Scholar] [CrossRef]
  2. Xu, Y.; Li, J.; Liu, Y.W. Quantitative evaluation of provincial government plans for public health emergencies in China. Int. J. Disast. Risk Reduct. 2022, 81, 103292. [Google Scholar] [CrossRef]
  3. Alsafi, R.T. Lessons from SARS-CoV, MERS-CoV, and SARS-CoV-2 Infections: What We Know So Far. Can. J. Infect. Dis. Med. 2022, 2022, 1156273. [Google Scholar] [CrossRef] [PubMed]
  4. Hartt, M. COVID-19: A lonely pandemic. Cities Health 2021, 5, S80–S82. [Google Scholar] [CrossRef]
  5. Zhang, X.; Ding, Z.J.; Hang, J.Q.; He, Q.Z. How do stock price indices absorb the COVID-19 pandemic shocks? N. Am. J. Econ. Financ. 2022, 60, 101672. [Google Scholar] [CrossRef]
  6. Zhu, L.; Chen, P.L.; Dong, D.D.; Wang, Z.X. Can artificial intelligence enable the government to respond more effectively to major public health emergencies? Taking the prevention and control of Covid-19 in China as an example. Socio Econ. Plan. Sci. 2022, 80, 101029. [Google Scholar] [CrossRef]
  7. Liu, M.; Xu, X.F.; Cao, J.; Zhang, D. Integrated planning for public health emergencies: A modified model for controlling H1N1 pandemic. J. Oper. Res. Soc. 2020, 71, 748–761. [Google Scholar] [CrossRef]
  8. Zhang, L.; Zhao, W.J.; Sun, B.B.; Huang, Y.; Glänzel, W. How scientific research reacts to international public health emergencies: A global analysis of response patterns. Scientometrics 2020, 124, 747–773. [Google Scholar] [CrossRef]
  9. Jin, R.; Xia, T.; Liu, X.; Murata, T.; Kim, K.S. Predicting Emergency Medical Service Demand With Bipartite Graph Convolutional Networks. IEEE Access 2021, 9, 9903–9915. [Google Scholar] [CrossRef]
  10. Xu, Z.Q.; Cheng, Y.K.; Yao, S.L. Tripartite Evolutionary Game Model for Public Health Emergencies. Discrete Dyn. Nat. Soc. 2021, 2021, 6693597. [Google Scholar] [CrossRef]
  11. Tessema, F.S.; Koya, P.R.; Bole, B.K. Optimal Control and Cost-Effectiveness Analysis of Cholera with Vaccination. J. Math. 2022, 2022, 1705277. [Google Scholar] [CrossRef]
  12. Deng, X.C. Location-Routing Problem of Emergency Facilities under Uncertain Demand by Branch-Price and Cut. J. Math. 2021, 2021, 9152989. [Google Scholar] [CrossRef]
  13. Yang, N.; Shen, L.Y.; Shu, T.H.; Liao, S.J.; Peng, Y.; Wang, J.H. An integrative method for analyzing spatial accessibility in the hierarchical diagnosis and treatment system in China. Soc. Sci. Med. 2021, 270, 113656. [Google Scholar] [CrossRef] [PubMed]
  14. Schullerus, G.; Supavatanakul, P.; Krebs, V.; Lunze, J. Modelling and hierarchical diagnosis of timed discrete-event systems. Math. Comp. Model. Dyn. 2006, 12, 519–542. [Google Scholar] [CrossRef]
  15. Toregas, C.; Swain, R.; ReVelle, C.; Bergman, L. The Location of Emergency Service Facilities. Oper. Res. 1971, 19, 1363–1373. [Google Scholar] [CrossRef]
  16. He, Q.Z.; Tong, H.; Liu, J.B. How Does Inequality Affect the Residents’ Subjective Well-Being: Inequality of Opportunity and Inequality of Effort. Front. Psychol. 2022, 13, 843854. [Google Scholar] [CrossRef] [PubMed]
  17. Gigovic, L.; Pamucar, D.; Bozanic, D.; Ljubojevic, S. Application of the GIS-DANP-MABAC multi-criteria model for selecting the location of wind farms: A case study of Vojvodina, Serbia. Renew. Energ. 2017, 103, 501–521. [Google Scholar] [CrossRef]
  18. Biswas, S.; Pamucar, D. Facility Location Selection for B-Schools in Indian Context: A Multi-Criteria Group Decision Based Analysis. Axioms 2020, 9, 77. [Google Scholar] [CrossRef]
  19. Pamucar, D.; Gigovic, L.; Bajic, Z.; Janosevic, M. Location Selection for Wind Farms Using GIS Multi-Criteria Hybrid Model: An Approach Based on Fuzzy and Rough Numbers. Sustainability 2017, 9, 1315. [Google Scholar] [CrossRef] [Green Version]
  20. Boonmee, C.; Arimura, M.; Asada, T. Facility location optimization model for emergency humanitarian logistics. Int. J. Disast. Risk Reduct. 2017, 24, 485–498. [Google Scholar] [CrossRef]
  21. Zhang, H.Z.; Zhang, K.; Chen, Y.T.; Ma, L. Multi-objective two-level medical facility location problem and tabu search algorithm. Inf. Sci. 2022, 608, 734–756. [Google Scholar] [CrossRef]
  22. Liu, K.N. GIS-based MCDM framework combined with coupled multi-hazard assessment for site selection of post-earthquake emergency medical service facilities in Wenchuan, China. Int. J. Disast. Risk Reduct. 2022, 73, 102873. [Google Scholar] [CrossRef]
  23. Yücel, E.; Salman, F.S.; Bozkaya, B.; Gökalp, C. A data-driven optimization framework for routing mobile medical facilities. Ann. Oper. Res. 2020, 291, 1077–1102. [Google Scholar] [CrossRef]
  24. Zhen, L.; Wang, K.; Liu, H.C. Disaster Relief Facility Network Design in Metropolises. IEEE Trans. Syst. Man Cybern. Syst. 2015, 45, 751–761. [Google Scholar] [CrossRef]
  25. Ji, Y.; Li, H.H.; Zhang, H.J. Risk-Averse Two-Stage Stochastic Minimum Cost Consensus Models with Asymmetric Adjustment Cost. Group Decis. Negot. 2022, 31, 261–291. [Google Scholar] [CrossRef]
  26. Soyster, A.L. Technical Note—Convex Programming with Set-Inclusive Constraints and Applications to Inexact Linear Programming. Oper. Res. 1973, 21, 1154–1157. [Google Scholar] [CrossRef] [Green Version]
  27. Ben-Tal, A.; Nemirovski, A. Robust solutions of uncertain linear programs. Oper. Res. Lett. 1999, 88, 411–424. [Google Scholar] [CrossRef] [Green Version]
  28. Ben-Tal, A.; Nemirovski, A. Robust Convex Optimization. Math. Oper. Res. 1998, 23, 769–805. [Google Scholar] [CrossRef] [Green Version]
  29. Bertsimas, D.; Sim, M. Robust discrete optimization and network flows. Math. Program. 2003, 98, 49–71. [Google Scholar] [CrossRef]
  30. Bertsimas, D.; Sim, M. The Price of Robustness. Oper. Res. 2004, 52, 35–53. [Google Scholar] [CrossRef]
  31. Ji, Y.; Jin, X.W.; Xu, Z.S.; Qu, S.J. A mixed 0-1 programming approach for multiple attribute strategic weight manipulation based on uncertainty theory. J. Intell. Fuzzy Syst. 2021, 41, 6739–6754. [Google Scholar] [CrossRef]
  32. Qu, S.J.; Li, Y.M.; Ji, Y. The mixed integer robust maximum expert consensus models for large-scale GDM under uncertainty circumstances. Appl. Soft Comput. 2021, 107, 107369. [Google Scholar] [CrossRef]
  33. Zhang, H.J.; Ji, Y.; Qu, S.J.; Li, H.H.; Huang, R.P. The robust minimum cost consensus model with risk aversion. Inf. Sci. 2022, 587, 283–299. [Google Scholar] [CrossRef]
  34. Han, Y.; Qu, S.J.; Wu, Z.; Huang, R.P. Robust consensus models based on minimum cost with an application to marketing plan. J. Intell. Fuzzy Syst. 2019, 37, 5655–5668. [Google Scholar] [CrossRef]
  35. Li, C.N.; Guo, T.Y.; Chen, Y. Robust Emission Reduction Strategies under Cap-and-Trade and Demand Uncertainty. Sustainability 2022, 14, 13445. [Google Scholar] [CrossRef]
  36. Qu, S.J.; Wei, J.P.; Wang, Q.H.; Li, Y.M.; Jin, X.W.; Chaib, L. Robust minimum cost consensus models with various individual preference scenarios under unit adjustment cost uncertainty. Inf. Fusion 2023, 89, 510–526. [Google Scholar] [CrossRef]
  37. Huang, R.P.; Qu, S.J.; Yang, X.G.; Xu, F.M.; Xu, Z.S.; Zhou, W. Sparse portfolio selection with uncertain probability distribution. Appl. Intell. 2021, 51, 6665–6684. [Google Scholar] [CrossRef]
  38. Cacador, S.; Dias, J.M.; Godinho, P. Portfolio selection under uncertainty: A new methodology for computing relative-robust solutions. Int. T. Oper. Res. 2021, 28, 1296–1329. [Google Scholar] [CrossRef]
  39. Gubu, L.; Rosadi, D.; Abdurakhman. A New Approach for Robust Mean-Variance Portfolio Selection Using Trimmed k-Means Clustering. Ind. Eng. Manag. Syst. 2021, 20, 782–794. [Google Scholar] [CrossRef]
  40. Luan, D.Q.; Wang, C.M.; Wu, Z.; Xia, Z.J. Two-Stage Robust Optimization Model for Uncertainty Investment Portfolio Problems. J. Math. 2021, 2021, 3087066. [Google Scholar] [CrossRef]
  41. Xu, L.J.; Zhou, Y.J. New Robust Reward-Risk Ratio Models with CVaR and Standard Deviation. J. Math. 2022, 2022, 8304411. [Google Scholar] [CrossRef]
  42. Qu, S.J.; Xu, Y.T.; Ji, Y.; Feng, C.; Wei, J.P.; Jiang, S. Data-Driven Robust Data Envelopment Analysis for Evaluating the Carbon Emissions Efficiency of Provinces in China. Sustainability 2022, 14, 13318. [Google Scholar] [CrossRef]
  43. Qu, S.J.; Feng, C.; Jiang, S.; Wei, J.P.; Xu, Y.T. Data-Driven Robust DEA Models for Measuring Operational Efficiency of Endowment Insurance System of Different Provinces in China. Sustainability 2022, 14, 9954. [Google Scholar] [CrossRef]
  44. Ji, Y.; Du, J.H.; Han, X.Y.; Wu, X.Q.; Huang, R.P.; Wang, S.L.; Liu, Z.M. A mixed integer robust programming model for two-echelon inventory routing problem of perishable products. Physica A 2020, 548, 124481. [Google Scholar] [CrossRef]
  45. Liu, Z.M.; Qu, S.J.; Raza, H.; Wu, Z.; Qu, D.Q.; Du, J.H. Two-stage mean-risk stochastic mixed integer optimization model for location-allocation problems under uncertain environment. J. Ind. Manag. Optim. 2021, 17, 2783–2804. [Google Scholar] [CrossRef]
  46. Liu, H.R.; Qu, S.J.; Li, R.J.; Razaa, H. Bi-objective robust project scheduling with resource constraints and flexible activity execution lists. Comput. Ind. Eng. 2021, 156, 107288. [Google Scholar] [CrossRef]
  47. Kumar Tarei, P.; Kumar, G.; Ramkumar, M. A Mean-Variance robust model to minimize operational risk and supply chain cost under aleatory uncertainty: A real-life case application in petroleum supply chain. Comput. Ind. Eng. 2022, 166, 107949. [Google Scholar] [CrossRef]
  48. Savoji, H.; Mousavi, S.M.; Antucheviciene, J.; Pavlovskis, M. A Robust Possibilistic Bi-Objective Mixed Integer Model for Green Biofuel Supply Chain Design under Uncertain Conditions. Sustainability 2022, 14, 13675. [Google Scholar] [CrossRef]
  49. Kaoud, E.; Abdel-Aal, M.A.M.; Sakaguchi, T.; Uchiyama, N. Robust Optimization for a Bi-Objective Green Closed-Loop Supply Chain with Heterogeneous Transportation System and Presorting Consideration. Sustainability 2022, 14, 10281. [Google Scholar] [CrossRef]
  50. Sun, H.P.; Li, Y.C.; Zhang, J.H. Collaboration-based reliable optimal casualty evacuation network design for large-scale emergency preparedness. Socio. Econ. Plan. Sci. 2021, 81, 101192. [Google Scholar] [CrossRef]
  51. Zhang, J.H.; Liu, H.Y.; Yu, G.D.; Ruan, J.H.; Chan, F.T.S. A three-stage and multi-objective stochastic programming model to improve the sustainable rescue ability by considering secondary disasters in emergency logistics. Comput. Ind. Eng. 2019, 135, 1145–1154. [Google Scholar] [CrossRef]
  52. Zhang, Y.W.; Li, Z.P.; Jiao, P.B.; Zhu, S. Two-stage stochastic programming approach for limited medical reserves allocation under uncertainties. Complex Intell. Syst. 2021, 7, 3003–3013. [Google Scholar] [CrossRef]
  53. Jamali, A.; Ranjbar, A.; Heydari, J.; Nayeri, S. A multi-objective stochastic programming model to configure a sustainable humanitarian logistics considering deprivation cost and patient severity. Ann. Oper. Res. 2021, 2021, 1–35. [Google Scholar] [CrossRef]
  54. Yin, X.C.; Büyüktahtakın, İ.E. A multi-stage stochastic programming approach to epidemic resource allocation with equity considerations. Health Care Manag. Sci. 2021, 24, 597–622. [Google Scholar] [CrossRef]
  55. Zhang, Z.; Li, Z.L. Consensus-based TOPSIS-Sort-B for multi-criteria sorting in the context of group decision-making. Ann. Oper. Res. 2022, 2022, 1–28. [Google Scholar] [CrossRef]
  56. Gai, T.T.; Cao, M.S.; Chiclana, F.; Zhang, Z.; Dong, Y.C.; Herrera-Viedma, E.; Wu, J. Consensus-trust Driven Bidirectional Feedback Mechanism for Improving Consensus in Social Network Large-group Decision Making. Group Decis. Negot. 2022, 2022, 1–30. [Google Scholar] [CrossRef]
  57. Zhang, Z.; Li, Z.L. Personalized Individual Semantics-Based Consistency Control and Consensus Reaching in Linguistic Group Decision Making. IEEE Trans. Syst. Man Cybern. Syst. 2022, 52, 5623–5635. [Google Scholar] [CrossRef]
  58. Gao, Y.; Zhang, Z. Consensus reaching with non-cooperative behavior management for personalized individual semantics-based social network group decision making. J. Oper. Res. Soc. 2021, 2021, 1–18. [Google Scholar] [CrossRef]
  59. Pamucar, D.; Torkayesh, A.E.; Biswas, S. Supplier selection in healthcare supply chain management during the COVID-19 pandemic: A novel fuzzy rough decision-making approach. Ann. Oper. Res. 2022, 2022, 1–43. [Google Scholar] [CrossRef]
  60. Biswas, S.; Pamucar, D.; Bozanic, D.; Halder, B. A New Spherical Fuzzy LBWA-MULTIMOOSRAL Framework: Application in Evaluation of Leanness of MSMEs in India. Math. Probl. Eng. 2022, 5480848. [Google Scholar] [CrossRef]
  61. Qu, S.J.; Shu, L.L.; Yao, J.Y. Optimal pricing and service level in supply chain considering misreport behavior and fairness concern. Comput. Ind. Eng. 2022, 174, 108759. [Google Scholar] [CrossRef]
  62. Qu, S.J.; Xu, L.; Mangla, S.K.; Chan, F.T.S.; Zhu, J.L.; Arisian, S. Matchmaking in reward-based crowdfunding platforms: A hybrid machine learning approach. Int. J. Prod. Res. 2022, 2022, 1–21. [Google Scholar] [CrossRef]
Figure 1. The resolution framework of the proposed hybrid approach.
Sustainability 15 00624 g001
Figure 2. Distribution of demand points, candidate facility points, and base hospitals.
Sustainability 15 00624 g002
Figure 3. Configuration scenario with 2% disturbance ratio and Γ = 5.
Sustainability 15 00624 g003
Figure 4. The total cost varies with different disturbance proportions and Γ .
Sustainability 15 00624 g004
Figure 5. The configuration scheme with Γ = 0 .
Sustainability 15 00624 g005
Figure 6. The configuration scheme with Γ = 2 .
Sustainability 15 00624 g006
Figure 7. The configuration scheme with Γ = 10 .
Sustainability 15 00624 g007
Figure 8. The total solution time varies with different disturbance proportions and Γ.
Sustainability 15 00624 g008
Table 1. The utilized notation in this paper.
Sets
I The collection of the whole emergency medical facilities (reconfigurable convention and exhibition centers, sports venues, schools), i I , i = 1 , 2 , , n .
J The collection of existing large rear hospitals (Grade II and above),
j J , j = 1 , 2 , , m .
K The collection of patient types (mild, moderate, and severe three disease grades, represented by 1, 2, 3), k K , k = 1 , 2 , 3 .
Decision variables
x i = { 1   ,   Open   emergency   medical   facility   point   i . 0   ,   Otherwise .
y i j = { 1   ,   Patients   at   facility   point   i   are   serviced   by   hospital   j . 0   ,   Otherwise .
z j = { 1   ,   Select   hospital   j   to   treat   critically   ill   patients . 0   ,   Otherwise .
Parameters
S Number of emergency medical facilities opened.
f i Operating cost of emergency medical facility point i .
h i j Distance from facility point i to hospital j .
c t Unit driving cost from facility point i to hospital j .
d i k Patients’ number of k type at facility point i .
θ k The proportion of k type patients, respectively represents the severity level of patients.
c j The maximum service capacity of large rear hospital j .
Table 2. Latitude and longitude coordinates of demand points and population size.
No.CoordinatePopulationNo.CoordinatePopulationNo.CoordinatePopulation
1114.66064,31.4598380,79844115.65594,30.7654119,73187115.69542,30.3074850,072
2114.60284,31.27431119,42545115.63523,30.8888122,06588115.85314,30.5145130,936
3114.49922,31.2899339,65846115.75470,30.9903332,41289115.82113,30.3164536,759
4114.55444,31.1555650,88347115.90135,31.0021118,10890115.56911,29.85114161,582
5114.56646,31.0560532,14548115.75740,30.8867232,27991115.56400,29.8504334,026
6114.44895,31.3073635,44749115.76842,30.8158242,32592115.42095,29.9131218,948
7114.64585,31.0200330,63950115.61337,30.6418325,04593115.70016,29.887954083
8114.64488,30.9630023,43251115.63833,30.8359819,31894115.61056,30.11381113,247
9114.70241,31.1461256,04452115.93407,30.90572747795115.73690,30.0831750,297
10114.53016,31.4571643,80453114.86957,30.6320371,18596115.71488,30.0127564,690
11114.64299,31.2884186,47954114.88533,30.7432557,18397115.62547,29.9399344,857
12114.66770,31.38754204955115.07828,30.6964324,06398115.61438,29.9953435,921
13114.99998,31.1666155,60156115.19036,30.7603741,22699115.55408,30.0284932,203
14115.02587,31.1852468,48557115.09952,30.6472029,827100115.47552,29.9493047,311
15115.04128,31.1771680,72258115.02658,30.6519619,640101115.70678,29.8663237,082
16114.80704,31.0682850,10959114.98275,30.6051232,134102115.93927,30.07392141,488
17115.12917,31.2071531,29760115.08718,30.7942719,117103115.92131,29.8825898,543
18115.01422,31.0380361,83961115.05516,30.7916318,816104115.98622,29.7563697,956
19114.88605,31.1227142,91862114.93149,30.6789622,811105116.00873,30.0500321,945
20114.98878,31.3565047,63263115.26651,30.43888193,988106115.84793,30.0897959,759
21115.09380,31.4740836,16964115.02802,30.42591113,356107115.98671,30.2122933,323
22115.18852,31.0727636,56765115.34092,30.5516671,852108115.94173,30.1700913,971
23115.17771,30.9600032,07966115.12536,30.5935466,860109115.89000,30.0075565,122
24115.31886,31.0468237,06667115.17918,30.6174749,785110115.80776,29.8789471,168
25115.23286,31.3275840,08368115.23300,30.7270978,925111115.82248,29.8169355,883
26115.07628,31.3715234,51369115.44597,30.5910914,885112116.03935,30.0782027,127
27114.83977,31.3324543,23370115.41237,30.5644235,562113115.90764,29.7859147,872
28114.75598,31.0121420,52071115.47997,30.4664549,312114115.95513,30.2709912,357
29115.03054,30.9664726,47072115.27209,30.3825035,922115115.98193,30.1030434,299
30115.37487,31.1869437,99273115.11897,30.2328060,655116115.90153,30.1311927,634
31114.84998,31.0366440,45774115.14533,30.3501348,792117116.10982,29.8320615,919
32115.27363,30.8322757,98075115.53676,30.5215022,214118114.88374,30.44167156,011
33115.46262,31.1265159,21976115.44136,30.25094150,600119114.90441,30.4700221,939
34115.67112,31.1402430,04177115.33968,30.0748967,040120114.88198,30.4729122,977
35115.60163,31.0029029,20478115.38161,30.3063768,543121114.97287,30.4521616,593
36115.47994,30.8409630,82579115.50228,30.3685030,920122114.94966,30.4886121,550
37115.19510,30.8184435,91880115.61687,30.3851342,447123114.91279,30.5456625,416
38115.39093,30.9897650,82381115.79129,30.4192442,065124115.03657,30.5958525,856
39115.55835,30.6972259,27082115.80244,30.4935419,624125114.98103,30.5374019,654
40115.40694,30.6821433,13283115.42998,30.2030749,666126115.00178,30.580774753
41115.39610,30.78371114,89084115.28774,30.1492020,547127114.91652,30.4488552,020
42115.67654,30.74001121,66985115.28122,30.2722235,569
43115.61889,30.5906816,02786115.58902,30.2964267,756
Table 3. Coordinates, service capacity, and attraction factors of candidate facility points.
No.CoordinateCapacityAttraction FactorNo.CoordinateCapacityAttraction Factor
1114.63284,31.3143127,8401.316114.89070,30.6493744781.3
2115.00939,31.1656317,0431.217115.70328,30.8131390,0321.1
3114.73256,31.1038491001.118114.95961,30.5280129,7081.2
4115.95857,30.09049118,450119115.41705,30.7963649,8791.3
5115.55704,30.0001869981.220115.78056,30.9001452821.2
6115.10718,31.3142710,9891.421115.38103,30.4974073,5021
7114.62315,31.29476104,9171.122115.20200,30.4853582201.1
8114.93146,30.6206373,4261.223115.62718,30.0001964,5201.1
9115.08277,30.2346430,9641.324114.98103,30.5374075981.2
10115.02813,31.1801935,0971.125115.05760,30.5258545,0081.4
11115.93927,30.113929320126115.02813,31.1801928901
12115.01814,31.1777932331.227115.09380,30.9640853541.1
13114.90714,30.4395452,5601.128115.41122,30.2368662101.2
14115.16036,30.6403739,088129114.89070,30.6493710,8791.2
15115.43629,30.2326283521.430115.55681,29.8505148771.1
Table 4. Coordinates and number of beds in the large rear hospitals.
No.CoordinateNumber of BedsNo.CoordinateNumber of Beds
1114.62522,31.286878105114.89880,30.47378600
2115.03035,31.185475606115.59644,29.87249400
3115.66802,30.732847807115.95089,30.08262350
4114.88141,30.451941050
Table 5. The number of cases in each region.
RegionNumber of PatientsRegionNumber of Patients
Huangzhou District968Xishui County303
Tuanfeng County173Qichun County265
Hongan County316Huangmei County284
Luotian County69Macheng County243
Yingshan County62Wuxue County224
Table 6. Information entropy and entropy weight.
123456
Information entropy εj0.864310.965590.839730.952490.919320.94877
Entropy weight wj0.266170.067490.314390.093190.158260.10049
Table 7. The distance between each facility points and the large rear hospital.
Facility PointsLarge Base Rear Hospital
J 1 J 2 J 3 J 4 J 5 J 6 J 7
I 4 199.1641319.1826235.1414505.2721626.4589281.96188.558354
I 7 0.90698593.74792395.6967392.0141481.40941149.6291399.142
I 8 81.52122127.5054248.500278.2509946.62485667.7027897.0696
I 10 46.337591.272584260.4087330.3708399.213951.14181115.944
I 13 99.2809168.108271.9812.6982819.58887595.4059858.4737
I 14 93.30548124.6055172.1071149.700772.38121589.0629752.9345
I 17 130.9173171.005229.24747399.2292485.3551631.5039600.2825
I 19 103.5559121.979786.34575283.1968339.3343627.7912693.6411
I 21 121.5096171.71963.80801223.1036268.3869440.9306548.5269
I 23 181.3071295.079244.7432387.752482.959287.61668259.9675
Table 8. Configuration scheme with different disturbance proportions and uncertainty levels.
Γ Disturbance in Proportion
2%5%10%20%
04-7,7-1,8-5,10-2,13-4,14-5,17-3,19-3,21-3,23-64-7,7-1,8-5,10-2,13-4,14-5,17-3,19-3,21-3,23-64-7,7-1,8-5,10-2,13-4,14-5,17-3,19-3,21-3,23-64-7,7-1,8-5,10-2,13-4,14-5,17-3,19-3,21-3,23-6
24-7,7-1,8-5,10-2,13-4,14-5,17-3,19-3,21-5,23-64-7,7-1,8-5,10-2,13-4,14-5,17-3,19-3,21-5,23-64-7,7-1,8-4,10-2,13-5,14-5,17-3,19-3,21-5,23-64-7,7-1,8-4,10-2,13-5,14-5,17-3,19-3,21-5,23-6
44-7,7-1,8-5,10-2,13-4,14-5,17-3,19-3,21-5,23-64-7,7-1,8-5,10-2,13-4,14-5,17-3,19-3,21-5,23-64-7,7-1,8-4,10-2,13-5,14-5,17-3,19-3,21-5,23-64-7,7-1,8-4,10-2,13-5,14-4,17-3,19-2,21-5,23-6
64-7,7-1,8-4,10-2,13-5,14-5,17-3,19-3,21-5,23-64-7,7-1,8-4,10-2,13-5,14-5,17-3,19-3,21-5,23-64-7,7-1,8-4,10-2,13-5,14-4,17-3,19-2,21-5,23-64-7,7-1,8-4,10-2,13-5,14-4,17-3,19-2,21-5,23-6
84-7,7-1,8-4,10-2,13-5,14-4,17-3,19-2,21-5,23-64-7,7-1,8-4,10-2,13-5,14-4,17-3,19-2,21-5,23-64-7,7-1,8-4,10-2,13-5,14-4,17-3,19-2,21-5,23-74-7,7-1,8-4,10-2,13-5,14-4,17-3,19-2,21-5,23-7
104-7,7-1,8-4,10-2,13-5,14-4,17-3,19-2,21-5,23-64-7,7-1,8-4,10-2,13-5,14-4,17-3,19-2,21-5,23-74-7,7-1,8-4,10-2,13-5,14-4,17-3,19-2,21-5,23-74-7,7-1,8-4,10-2,13-5,14-4,17-3,19-2,21-5,23-7
Disclaimer/Publisher’s Note: The statements, opinions and data contained in all publications are solely those of the individual author(s) and contributor(s) and not of MDPI and/or the editor(s). MDPI and/or the editor(s) disclaim responsibility for any injury to people or property resulting from any ideas, methods, instructions or products referred to in the content.

