Article

Mineral Requirements for China’s Energy Transition to 2060—Focus on Electricity and Transportation

College of Environmental Science and Engineering, Nankai University, 38 Tongyan Road, Jinnan District, Tianjin 300350, China
*
Author to whom correspondence should be addressed.
Sustainability 2023, 15(1), 585; https://doi.org/10.3390/su15010585
Submission received: 9 December 2022 / Revised: 23 December 2022 / Accepted: 27 December 2022 / Published: 29 December 2022
(This article belongs to the Special Issue Sustainable Mining and Processing of Mineral Resources)

Abstract

:
Through energy transition, China can help curb the global climate challenge and achieve carbon neutrality. However, the development of energy transition is potentially constrained by minerals. Previous studies on energy minerals have been limited to power generation technologies (e.g., wind and solar) and have mostly focused on rare metals. In this study, 18 minerals were selected for investigation based on the energy transition scenario in China. A dynamic stock model was used to calculate the installed capacity and phase-out of infrastructure. Through scenario analysis, changes in the demand for minerals from China’s energy transition and the risks of these minerals were assessed. Uncertainties in mineral intensity and lifetime assumptions were also addressed through statistical estimation and sensitivity analysis. The results indicate that wind power and photovoltaics will dominate the power generation sector in the future. Further, some minerals (Co, Cr, Cu, In, Li, Ni, Te) will face risk (especially Co and In), which may limit the development of electric vehicles and photovoltaics. Extending lifetime and reducing material intensity can reduce material demands but cannot fully mitigate material supply risks. Therefore, resource security strategies should be developed in advance to secure the supply of mineral resources in the energy transition process.

1. Introduction

The low-carbon energy transition is a key pillar of climate change policy, aimed at achieving the Paris Agreement’s “well below 2°” target [1]. It is also crucial for achieving the UN’s 2030 Sustainable Development Goals (SDGs) [2]. According to the International Energy Agency’s (IEA) World Energy Outlook 2021 [3], the total share of electricity in the global end-use energy consumption will rise from 20% in 2020 to around 50% in 2050. According to the International Renewable Energy Agency (IRENA), 14,000 GW and 8100 of solar energy and wind power (WP), respectively, will be installed in 2050, and 90% of electricity demand will be provided by renewable energy [4]. Transportation is also a major sector for the country’s economic and social development, as well as for achieving SDGs. It is a major energy end-use sector and a contributor to greenhouse gas (GHG) emissions [5], accounting for about 24% of global energy-related GHG emissions [6], and electric vehicles (EVs) are considered the main solution to curb climate change in the transportation sector. Specifically, global EV ownership is expected to reach 1.78 billion in 2050 [7].
China’s recent rapid economic growth has led to massive consumption of fossil fuels, making the country the largest primary energy consumer and CO2 emitter. With China’s oil import dependency rising annually [8,9] and its long-term passive position in international climate change negotiations, low-carbon energy transition is the only option for the country’s sustainable development under the dual pressure of energy crisis and CO2 emission reduction [10]. Thus, renewable energy’s development will significantly reduce GHG emissions and related climate impacts, which is crucial to improve global climate change.
Accordingly, the Chinese government has proposed a series of targets for the low-carbon energy transition. The 12th and 13th Five-Year Plans predicted that the share of nonfossil energy in primary energy consumption would reach 11.4% and 15% by 2015 and 2020, respectively [11,12,13]. This target is reaffirmed in the newly released 14th Five-Year Plan [14], which expects that the share of nonfossil energy in total energy consumption will increase to about 20% by 2025. The National Development and Reform Commission has released the “China 2050 Renewable Energy High Penetration Scenario and Roadmap Study,” which provides a feasible pathway for high penetration of renewable energy (mainly wind and solar) by 2050 [15]. Simultaneously, several agencies (e.g., the IEA [3] and DNV [16]) have made similarly optimistic projections for the growth of renewable energy in China. The country has recently made rapid progress in renewable energy development and is the global leader in installed renewable energy capacity. In particular, 2021 has seen approximately 1020 GW of installed capacity, with most of the growth from solar and wind [17], and this rapid growth is expected to continue for some time.
However, clean energy technologies are more mineral-intensive than conventional energy systems. They often rely on multiple minerals, and consequently, the demand for them will increase rapidly during the transition to clean energy technologies [18]. Some of these minerals are indispensable and extremely scarce, as well as at high risk in their supply chain [19]. Therefore, prejudging potential resource supply bottlenecks, and dependence on foreign minerals, is critical to both China’s energy transition and climate policy. Further, China should develop a strategy accordingly.
Scientific studies have analyzed the mineral demand for energy technologies in different dimensions and perspectives (Table 1), and the spatial boundaries of these studies cover different geographical scales, from global [20,21] to a particular country [22,23]. The energy technologies considered in these studies are diverse, conducting extensive research on WP [24], photovoltaics (PV) [19], and concentrated solar power (CSP) [25]. These studies either include all metals required for energy technologies or are limited to key metals. However, the following are several of the remaining shortcomings. First, most of these studies have been conducted on a global scale, with fewer studies at the national level and much fewer in developing and emerging economies. Second, country-wide studies often consider only certain power generation technologies or material requirements for transportation electrification. However, the deployment of low-carbon energy technologies will also lead to a large expansion of electricity transmission and distribution (T&D) networks. Regarding the types of minerals analyzed, only key rare metals, such as rare earth elements (REEs), are often considered, and less often base metals and nonmetals.
The energy technologies selected for this study include WP, PV, CSP, EVs, and T&D because of the following reasons. First, they are expected to be deployed in large numbers in China and worldwide in the future. With new development targets for China’s installed WP and solar power under the carbon neutrality target, WP and solar power are ranked as top priorities for the future development of renewable energy. Second, as important clean technology with high market penetration, EVs have attracted the attention of the Chinese government. China’s “New Energy Industry Development Plan (2021–2035)” sets the goal of new energy vehicle sales. The sales will reach about 20% of total new vehicle sales by 2025, with EVs becoming the mainstream of new vehicles sold by 2035 [33]. Additionally, future large-scale electrification may result in a significant increase in the demand for electricity T&D.
WP and EVs require large amounts of REEs (e.g., Nd and Dy) to make permanent magnets for generators [28]. Minerals such as Cd, Te or In, Ga, and Se are required for thin-film solar technology, and Ge is a key component of a-Si (amorphous silicon) cells [34,35]. Meanwhile, CSP requires Ag for reflectors, Ni, and Mo for the high-strength steel alloys needed for structures [25]. EVs drive the development of high-capacity batteries, which will increase the demand for various materials (e.g., Li, Ni, Co, and Mg) [27]. Cu is the “cornerstone” of all power-related technologies [5], while Fe and Al are crucial components of T&D networks [31]. In this study, 18 elements that are crucial for the future development of electricity and transportation are selected for investigation (Table 2). We did not distinguish between metals and nonmetals as we consider them equally important.
The study aims to determine which minerals will pose constraints on energy technologies required for China’s energy transition in the medium to long term. Hence, relevant measures can be developed to avoid these constraints. This study did not aim to propose a new list of key minerals, but rather to determine which technologies may be at risk of not meeting their current deployment targets owing to shortages in mineral supply. The remainder of this paper is structured as follows. Section 2 describes the methodology. Section 3 provides the results of the analysis. Section 4 discusses technology development, substitution and recycling, and the impact of energy transition in China. Finally, Section 5 provides the main conclusions of the study.

2. Methods

2.1. Energy Scenario

Many organizations have conducted studies on the future development of China’s energy system [3,16,36,37]. These studies have different analytical perspectives and focus and include one or more scenarios, which are predicted as far as 2060. Among the various roadmaps on the feasibility of renewable energy development in the country, this study adopts the “energy and power deep decarbonization scenario” as the main energy scenario from the China Energy and Electricity Development Outlook 2021 by China Magisterial Energy Navigato [38].
First, this scenario is based on a comprehensive model that considers different factors (e.g., economic, technological, and national policies), with China’s newly proposed carbon neutrality target as the constraint and energy supply security as the bottom line. Second, the “energy and power deep decarbonization scenario” is set up to quantify the transformation path of China’s energy and electricity by 2060. Additionally, forecasts are made for the installation and generation of electricity by different energy technologies and the use of electricity in the transportation sector.

2.2. Key Assumptions

This study focuses on energy technologies that might be deployed on a large scale and are highly dependent on minerals (e.g., WP, PV, CSP, EV, and T&D). Each energy technology includes different types of sub-technologies whose market shares are one of the main determinants of future mineral demand. However, the shares are not often provided in energy scenarios [30]. This section focuses on describing key assumptions, such as the lifetime of energy technologies (Table 3) and the share of sub-technologies.
Two major PV technologies are currently used, namely, c-Si (crystalline silicon) and CdTe (cadmium telluride) thin film, which are called first and second-generation PV technologies. Globally, c-Si has about 95% market share, CdTe has the second highest market share (3.96%) [39]. However, a-Si has a lower market share, and its low efficiency makes it unattractive for most applications [26]. In China, c-Si is the most mature technology, occupying a major market share (about 90%). Unlike silicon-based cells (e.g., c-Si), thin-film cells use few materials and theoretically have higher efficiency. CIGS (copper indium gallium selenide) and CdTe are the main types of thin-film solar cells that can be currently commercialized [40]. Among them, CdTe has developed faster in recent years, with its stable performance and low manufacturing cost. However, CIGS may become more common in the future owing to its high efficiency, low cost, and low toxicity [41]. As the current market is dominated by c-Si, thin-film technology still has the potential to grow. This study assumes 85% and 15% shares for c-Si and thin-film technology (CdTe 10%, CIGS 5%), respectively (Table 3).
According to the concentration mode, the current CSP includes four different technologies: tower collector system (CRS), parabolic trough (PT), linear Fresnel, and dish Stirling [26]. Specifically, PT and CRS are widely used [27]. In China’s installed CSP infrastructure, CRS, PT, and linear Fresnel technology account for about 60%, 28%, and 12%, respectively. Meanwhile, in the global installed solar thermal power generation, PT, CRS, and linear Fresnel account for about 76%, 20%, and 4%, respectively [42]. It is assumed that the CSP infrastructure in China has a 50% share each of CRS and PT.
The current Chinese new energy vehicle market is dominated by battery electric vehicles (BEVs), supplemented by hybrid plug-in electric vehicles (PHEV). In 2021, 2.91 million BEVs were sold in China, accounting for 82.8% of total new energy vehicle sales [43]. With the charging infrastructure improvement and technological advancement, the number of EVs is expected to continue to grow in China. Based on selected scenario forecasts, EV ownership is expected to reach 350 million units in 2060. From the current market share and considering the future development of hybrid tram technology, the market share of BEVs and PHEVs is assumed to be 80% and 20%, respectively.
In this study, only the wires and transformers in electricity T&D are investigated depending on data availability and importance. Different sizes are used for wires of different voltages [31]. Based on the current status of the Chinese grid, we select 35, 110, 220, 330, ±400, 500, ±660, 750, ±800, and 1000 kV in the accounting. The grid sizes for future transmission grids were calculated using the current grid size and generation capacity growth factors [21]. Then, the line length is multiplied by the mineral intensity (MI) of the grid subelements. The results are summed to the mineral demand of the transmission grid.
The installed life is referenced to the average value in previous studies and is taken to be slightly higher while considering future technological advances (Table 3).

2.3. Mineral Demand Calculation

2.3.1. Installed Capacity

A life-cycle-based dynamic stock model was applied to calculate the inflow and outflow of infrastructure stock [21,30,44]. The installed capacity (inflow) of infrastructure was estimated based on the cumulative installed capacity in the energy scenario and the phase-out capacity (outflow) in the old years, as expressed in Equation (1).
F i n ( t ) = S ( t ) S ( t 1 ) + F D o u t ( t )
where Fin(t) is the installed capacity (inflow) in year t, S(t) is the cumulative installed capacity (stock) in year t, and FDout(t) is the phased-out capacity (outflow) in year t.
The phased-out capacity is driven by the assumed development of lifetime and in-service capacity [24]. Outflow is estimated based on the old annual installed capacity (inflow), as expressed in Equation (2).
F D o u t ( t ) = F i n ( t L )
Here, L is the lifetime, and the initial year t is 2016.
The historical data on wind and solar installed capacity, transmission line length, and transformer number are from the China Electricity Statistical Yearbook 2020 [45]. The historical data on EVs are from the Ministry of Public Security.

2.3.2. Mineral Demand Calculation

The demand estimates for the minerals are based on dynamic stock analysis. Equation (3) expresses the calculation of the demand for each mineral in a specific year [27]. Table A1, Table A2, Table A3, Table A4, Table A5 and Table A6 present the mineral intensities assuming that the composition and proportions of each element do not change between now and 2060. The annual installed capacity of sub-technologies is estimated based on the total installed capacity and the market share of each sub-technology.
dagt = [   i = 1 i = m F i n ( t ) MI ( 1 r ) ]
where dagt is the amount of mineral “a” required for the analyzed technology in a given year (gt), MI is the amount of mineral “a” required to make one functional unit FU per technology (for power generation technology, FU = 1 GW; for electric vehicle FU = 1 vehicle, for wire FU = 1 km, for transformer FU = 1 unit), m is the number of technologies investigated, and r is the recycled content of the mineral.
A certain amount of raw material is assumed to come from the recycling process. The “recycled content”, also called the “recycled input rate,” is the share of recycled materials in the total input [27]. Because the information available on “recycled content” is often very general, the data used in this study are from the United Nations Environment Programme and are presented in Appendix B.

2.3.3. Risk Level Classification

Risk assessment often involves various indicators (e.g., price, political stability, resource, and exporting country policies) [10], while depletion potential is a fundamental risk for conducting an assessment from a long-term perspective [46]. This study focuses on the factor of physical depletion, which is evaluated using Equation (4) and is related to reserves (RSV). Specifically, “reserve” is a resource that can be economically extracted through the application of technology that is currently or foreseeably available in the future. For this study, current reserves are considered static, and the risk to mineral supply increases as the depletion potential value increases.
D e p ( a ) = D a _ T R S V ( a ) 2020
where Dep(a) is the depletion potential of “a”, RSV2020 is the proven reserves of “a” in China in 2020, and Da_T is the cumulative demand within 2021–2060.
Additionally, supply constraints may arise when supply does not endure the rapid growth in demand. Therefore, we compared cumulative demand with production P(a) 2020 to assess the rate of increase in demand (RDI), Equation (5).
R D I = D a _ T P ( a ) 2020
where RDI is the ratio of the demand increase and P(a) 2020 is the production in China in 2020.
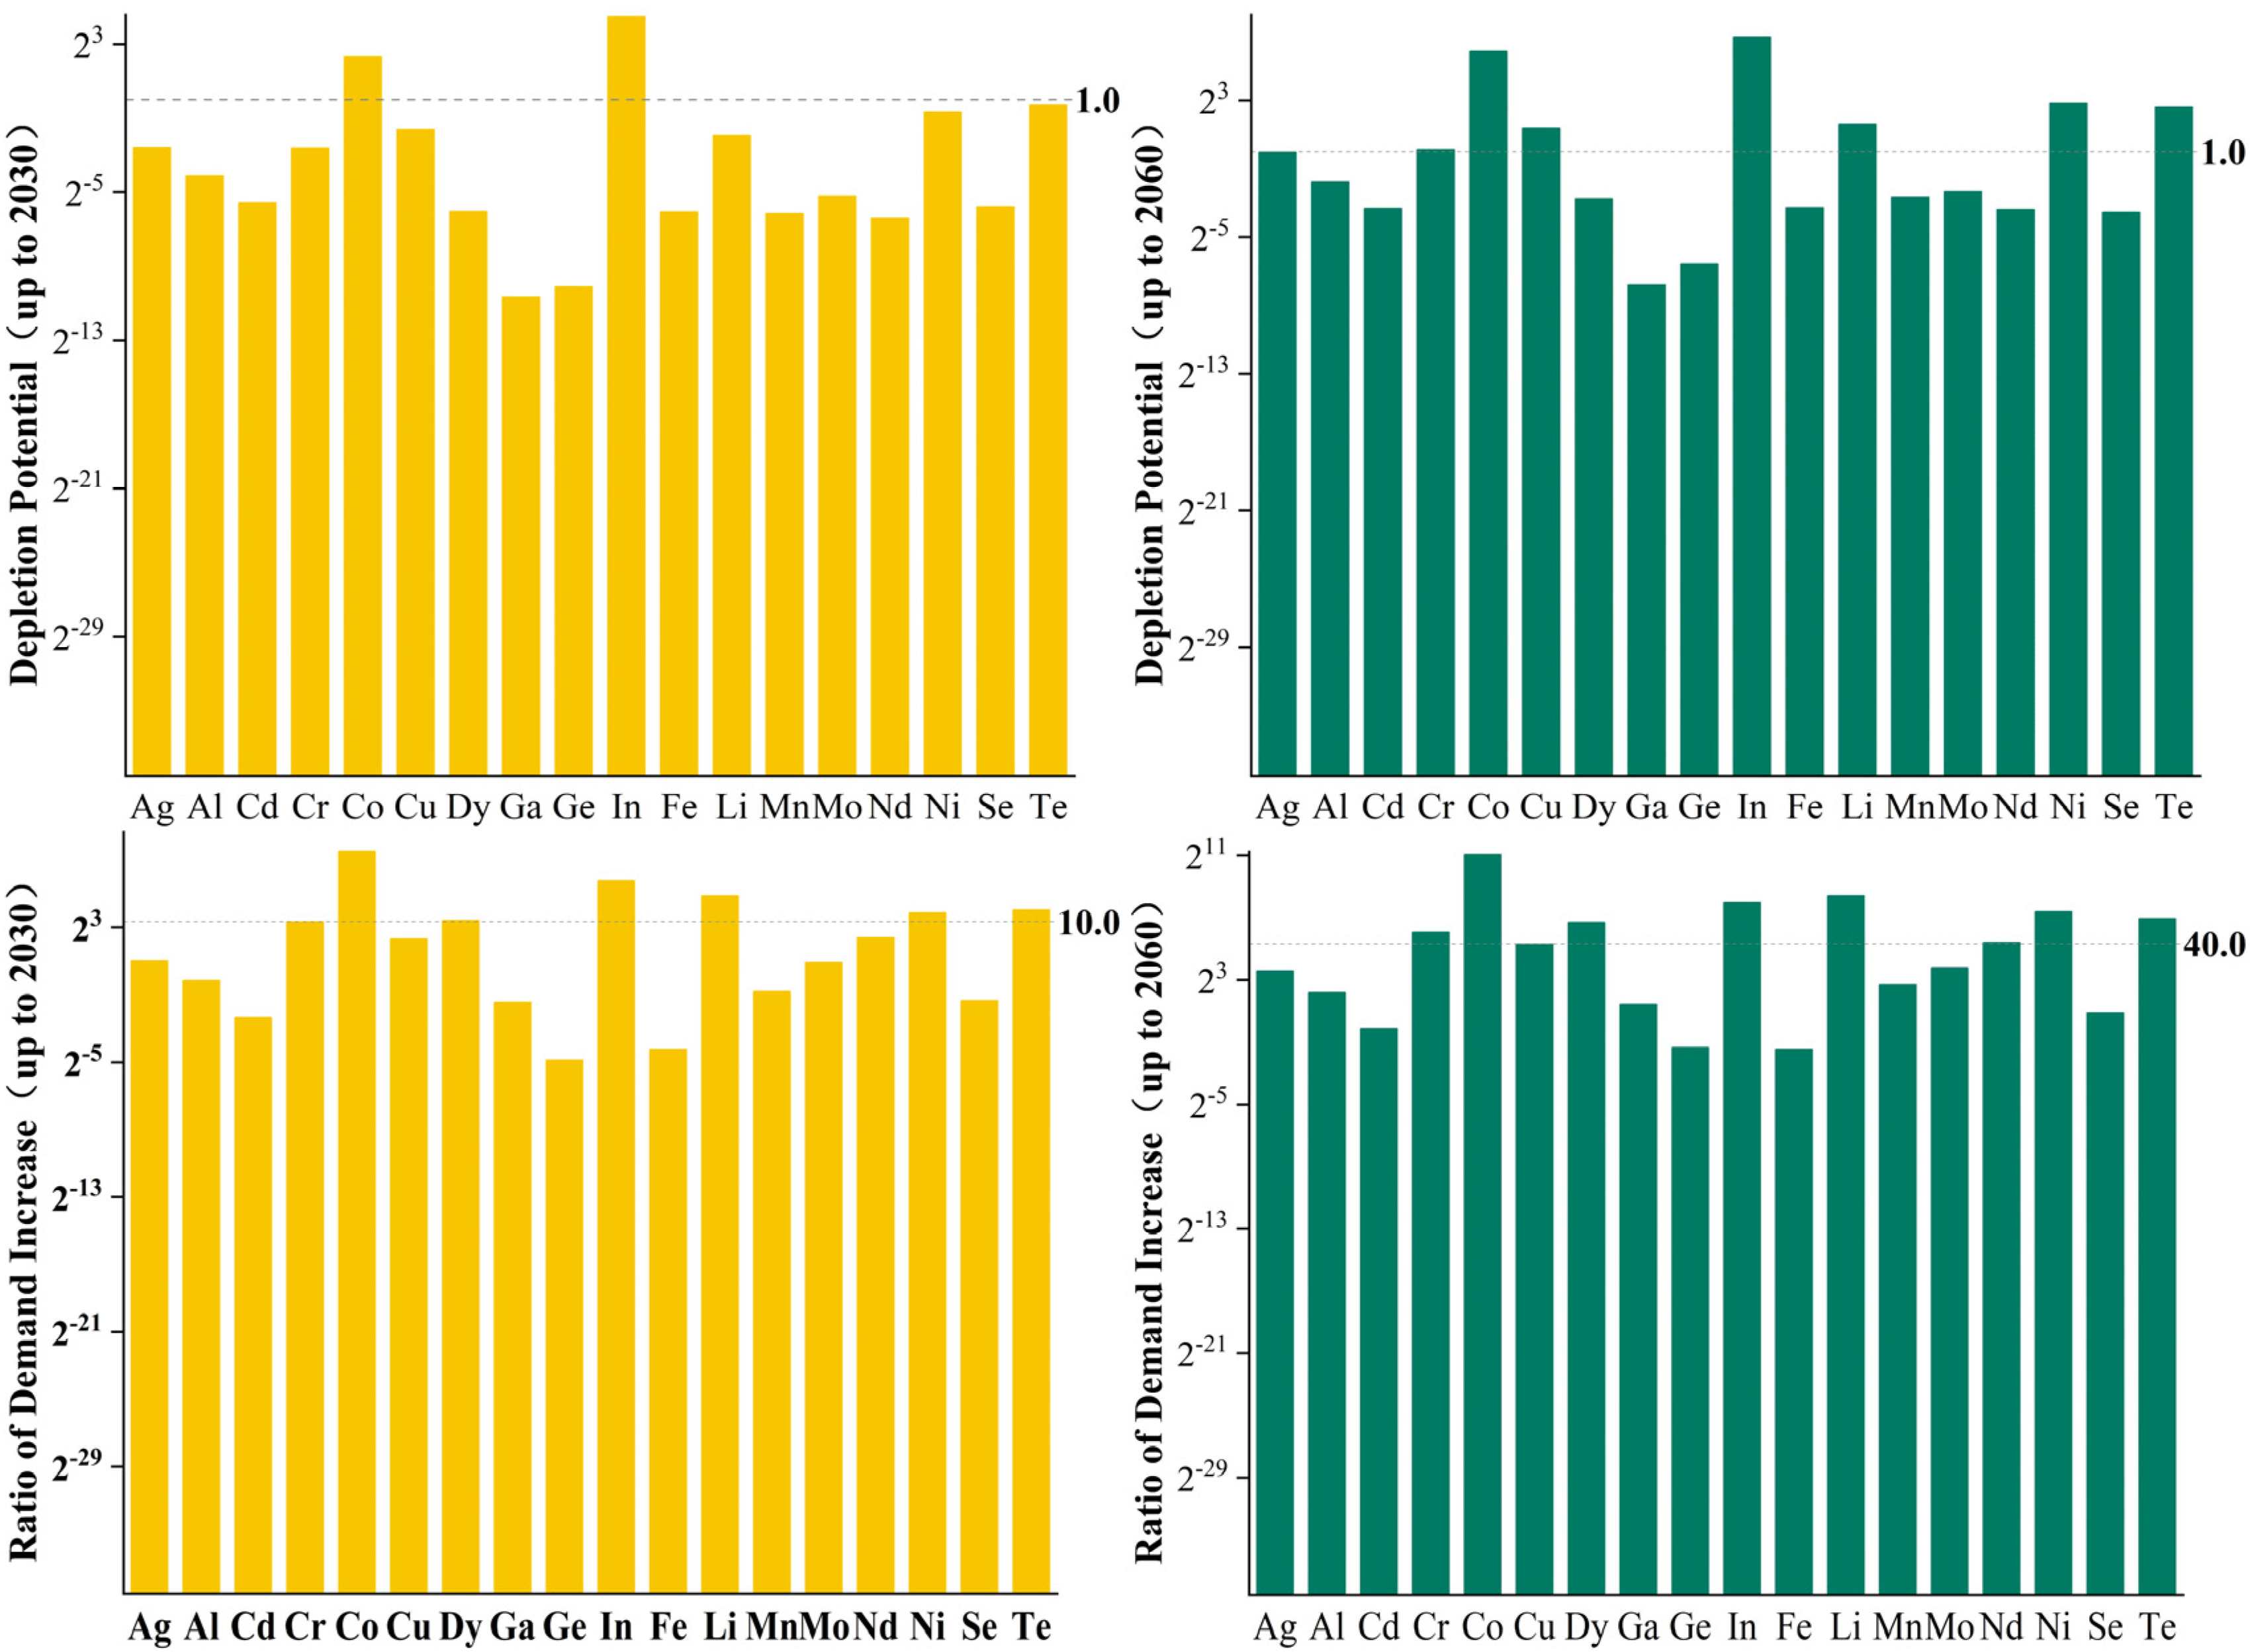
In this paper, Dep and RDI are used to classify the risk level of future supply (Table 4). When Dep2060 ≥ 1, the cumulative demand for energy technologies is higher than China’s reserves and may encounter high supply risk in the future. However, when Dep2030 ≥ 1, the risk is extremely high. When the cumulative demand is lower than the country’s reserves, but the ratio of the demand increase is high (RDI2060 ≥ 40), mineral production may become an important limiting factor for the supply of raw materials, defined as medium risk, and others as low risk.
However, note that reserve data are dynamic and change with technology, mining costs, the discovery of new deposits, etc. Thus, the risk level of minerals will also change. Second, this study considered only several energy technologies, and no other applications were considered. The evaluation results can only be regarded as an indication and not a fact. Additionally, during risk assessment, extraction and production encounter uncertainty because the most critical materials are produced as byproducts/coproducts together with other main materials.

3. Results

3.1. Installed and Phase-Out Capacity

According to the China Energy and Power Development Outlook 2021 [38], in the “energy and power deep decarbonization scenario,” China’s installed power capacity continuously grows in the long term, and nonfossil energy sources gradually become the mainstay (about 80%, Table 5). Compared with the stock in 2020, the total installed capacity of renewable energy will increase 5–6 times by 2060, and PV and WP are still dominant. EV ownership in 2060 reaches seven times that of 2020 and is expected to exceed 350 million units.
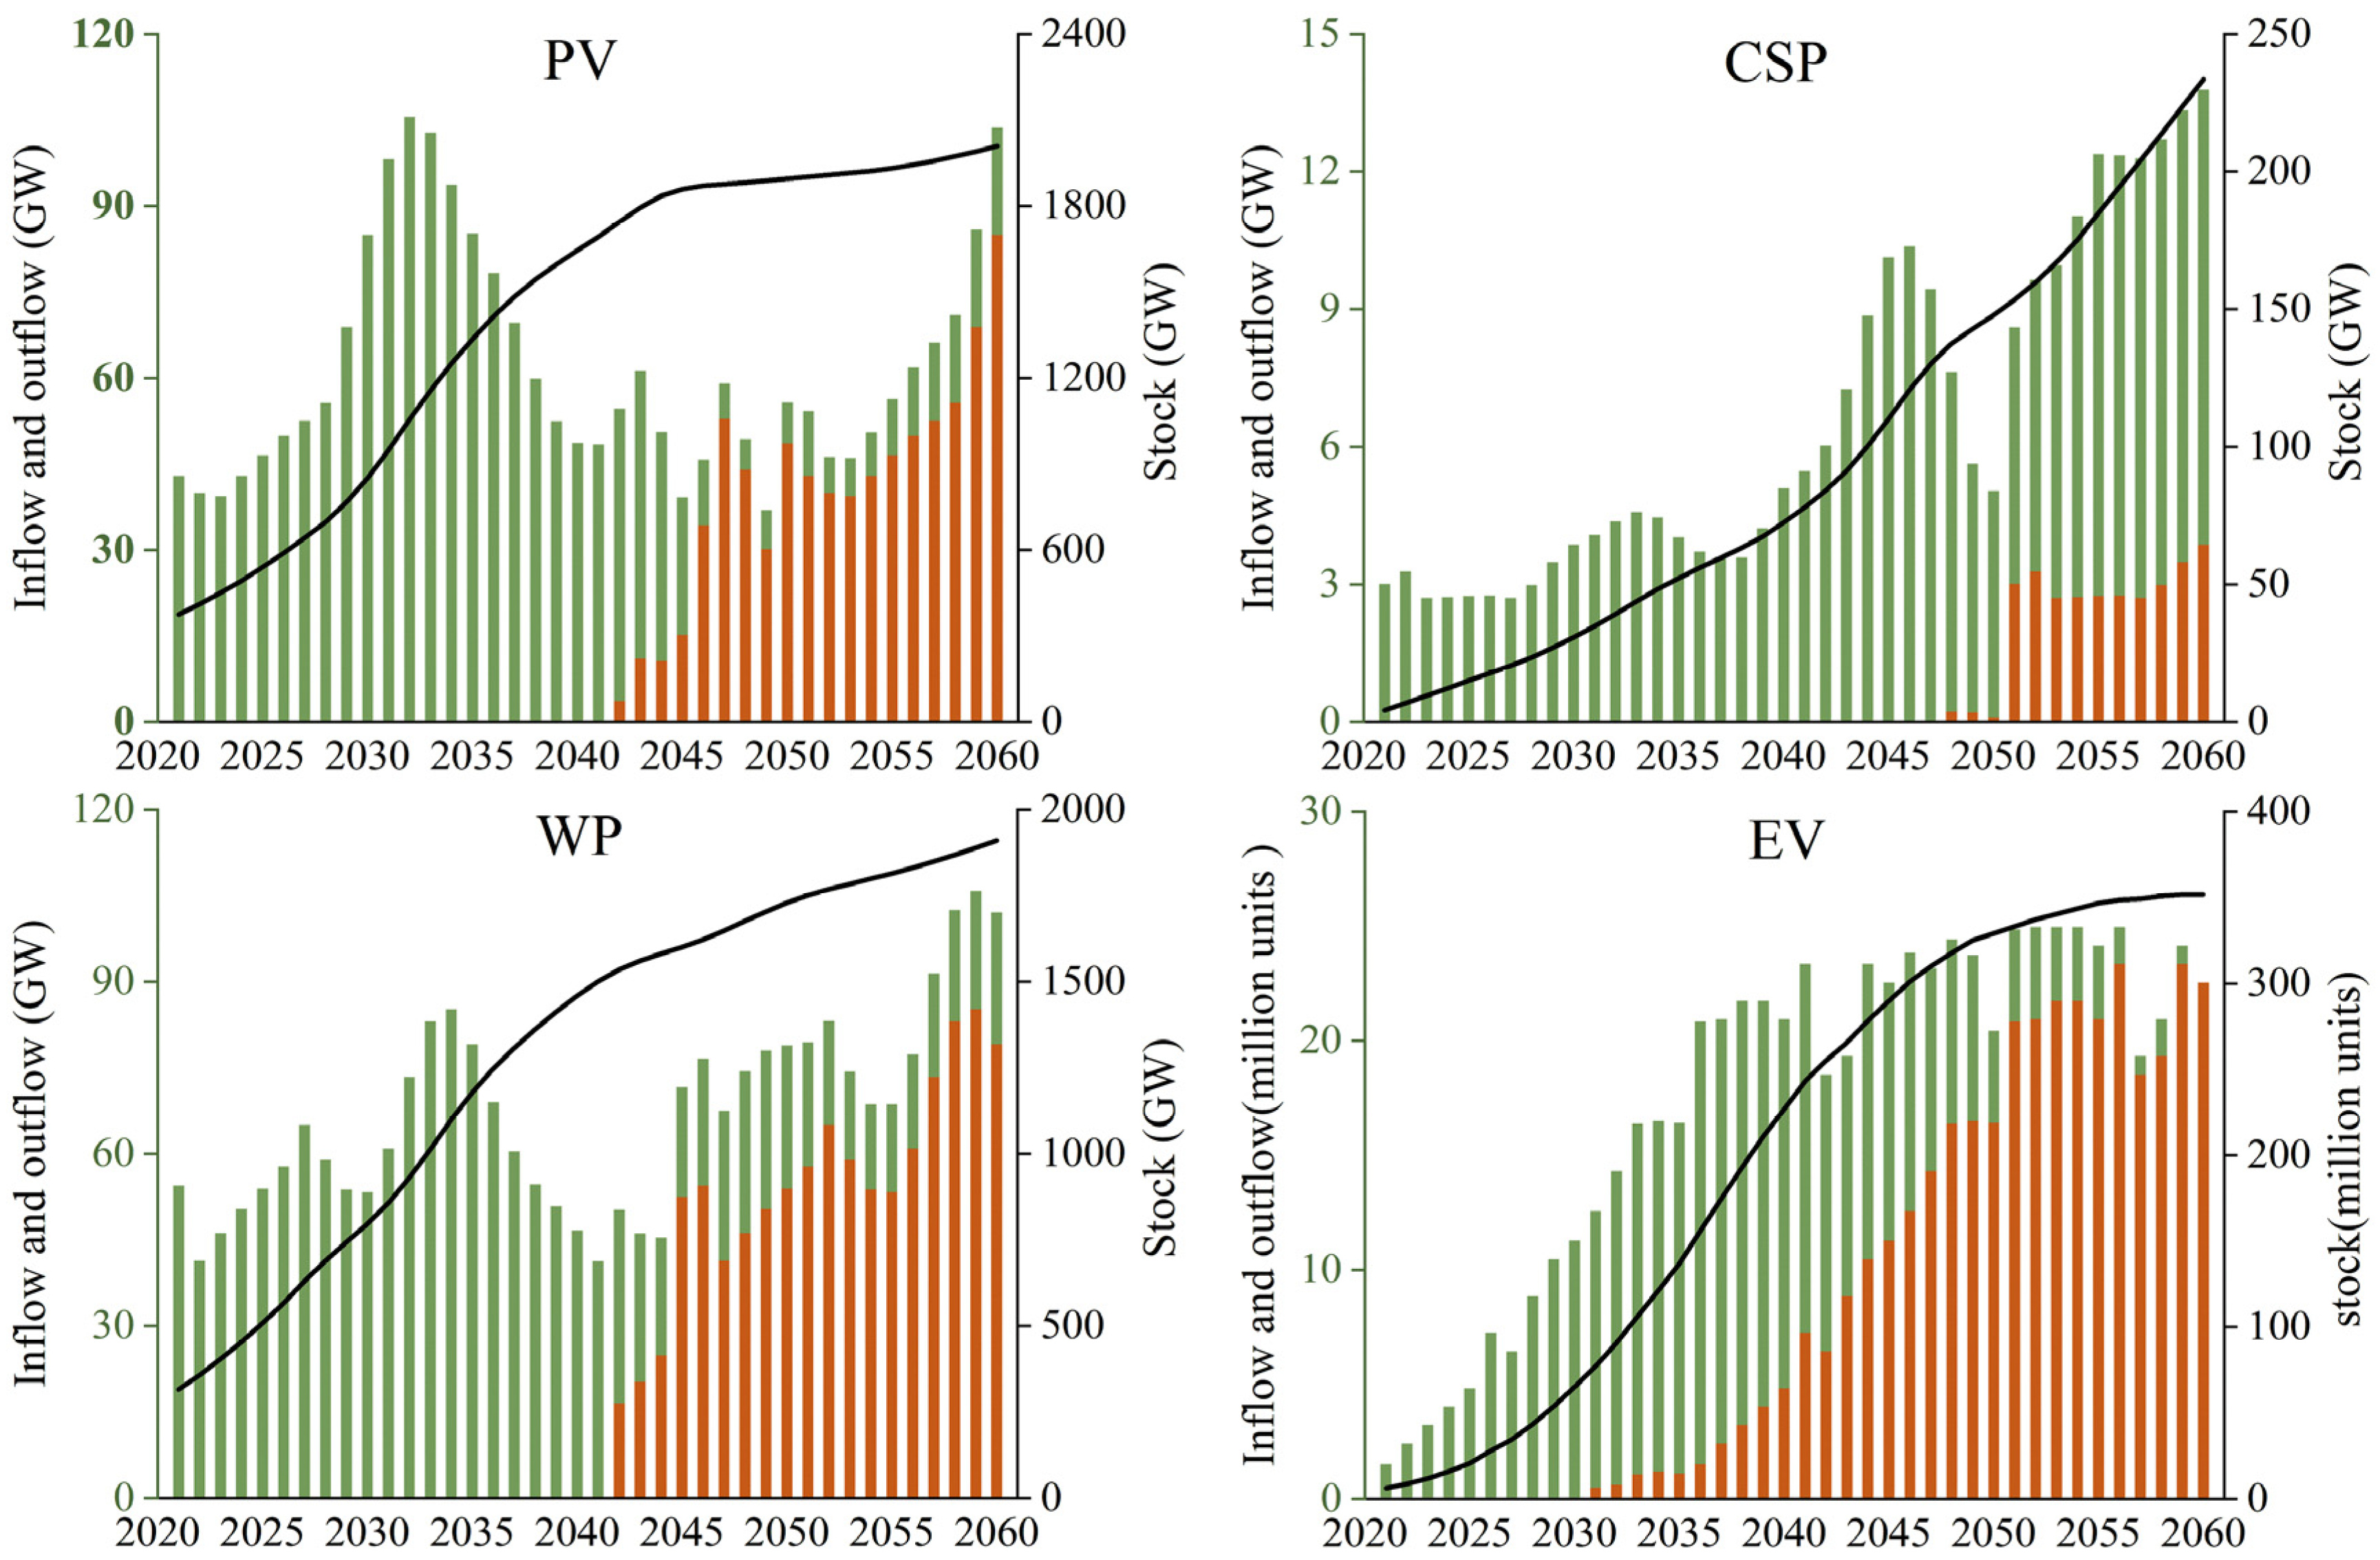
The installed capacity calculated by the dynamic stock model is higher. Figure 1 shows the annual infrastructure inflows (expansion and replacement), outflows, and stocks from 2021 to 2060. Overall, the stock of PV, WP, and EVs will grow faster through 2040 and will slow down between 2040 and 2045, while CSP will continuously grow. PV and WP inflows will peak around 2030, which may be linked to carbon peaking targets, with inflows after 2040 mainly coming from trade-ins, about 88% of CSP inflows occurring after 2030. The cumulative PV inflow from 2021 to 2060 is 2605 GW, and the WP is 2680 GW. The dynamic stock model calculates inflows to be approximately 1.5–23 times the stock differential (1.5, 2.0, and 23 for PV, wind, and EVs, respectively) because inflows are driven by a combination of infrastructure stock changes and replacements, while later demand has been widely ignored in previous studies. For PV, WP, and EVs, the expansion of system capacity in the early stage drives the inflow, while the trade-in is the main driver in the later stage. For CSP, the new installed capacity is mainly driven by expansion as the growth is slower in the early stage and the stock is low.
A large amount of obsolete infrastructure will be generated in the later years. Since 2030, much of China’s infrastructure will not be able to maintain its function and will enter a phase of obsolescence. As shown in Figure 1, the phase-out capacity for all technologies continues to increase. In the early years (2040–2045), the size of the phase-out capacity is at a low level (i.e., about 3–30 GW for solar PV and 15–25 GW for wind). However, it rises significantly from 2045 to 2060 (i.e., 40–80 GW for solar PV and 50–80 GW for wind). This similar trend can be found in renewable cases in Germany [22], Francce [23], and the rest of the world [24], as they commonly have a lifetime of more than 20 years and take a long time to reach the end-of-service stage.

3.2. Mineral Demand

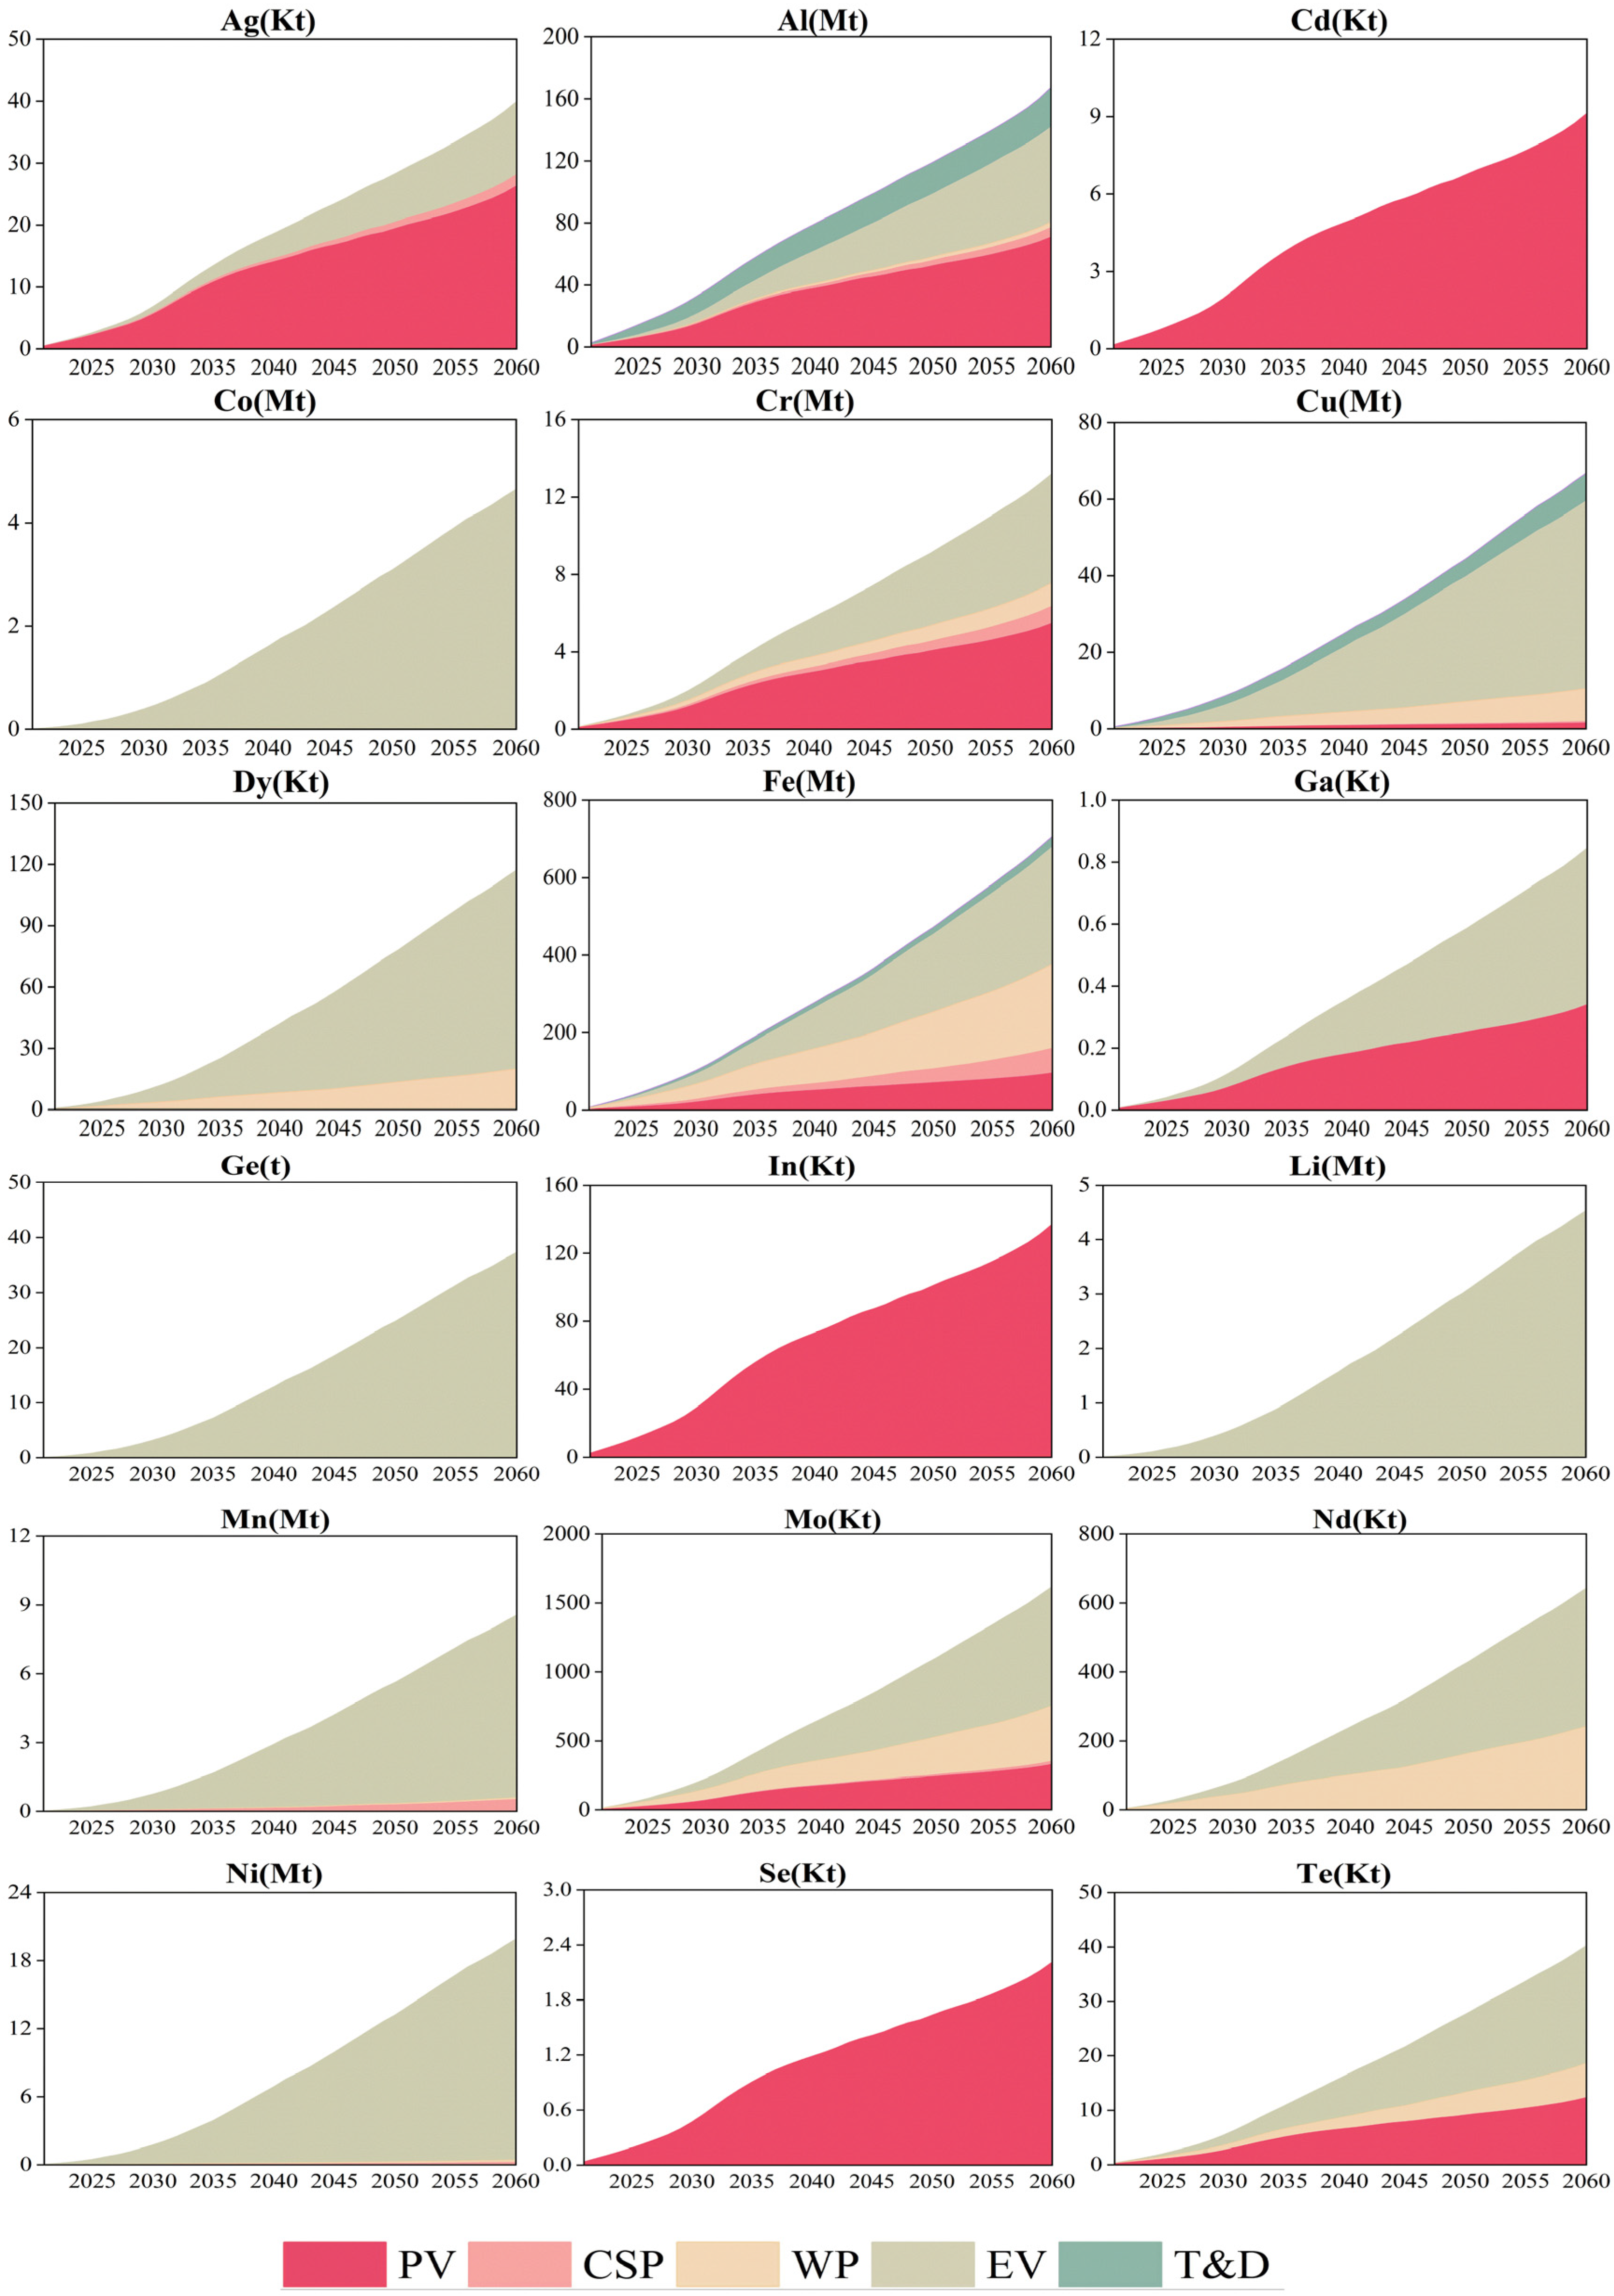
Figure 2 shows the estimated cumulative mineral requirements by technologies and elements from 2021 to 2060. Among all the technologies analyzed, EVs requires a wider variety of minerals, including REEs, such as Nd and Dy. T&D mainly needs Al, Cu, and Fe. Some metals (e.g., Se, Cd, Li, Co, and Ge) are used primarily in a single technology, and others are used in multiple technologies (e.g., In, Dy, Mn, and Ni), but the main use is in one technology. Overall, Fe, Al, Cu, and Cr will be the high-demand minerals.
PV is expected to account for the largest share of cumulative demand for Al by 2060 (43%), followed by EVs (36%) and T&D (15%). The largest share of demand for Fe is EVs (43%), followed by WP (31%) and PV (13%). The highest cumulative demand for Cu is for EV. Note that, in the future, various minerals will be required by EVs more than those in other applications. In addition to common metals (e.g., Cu, Fe, and Al), other rare minerals (e.g., Nd, Dy, Co, Li, and Ni) will be necessary. This is mainly because of the large ownership and short lifetime of EVs, resulting in a large inflow driven by elimination during the study period.

3.3. Uncertainty and Sensitivity

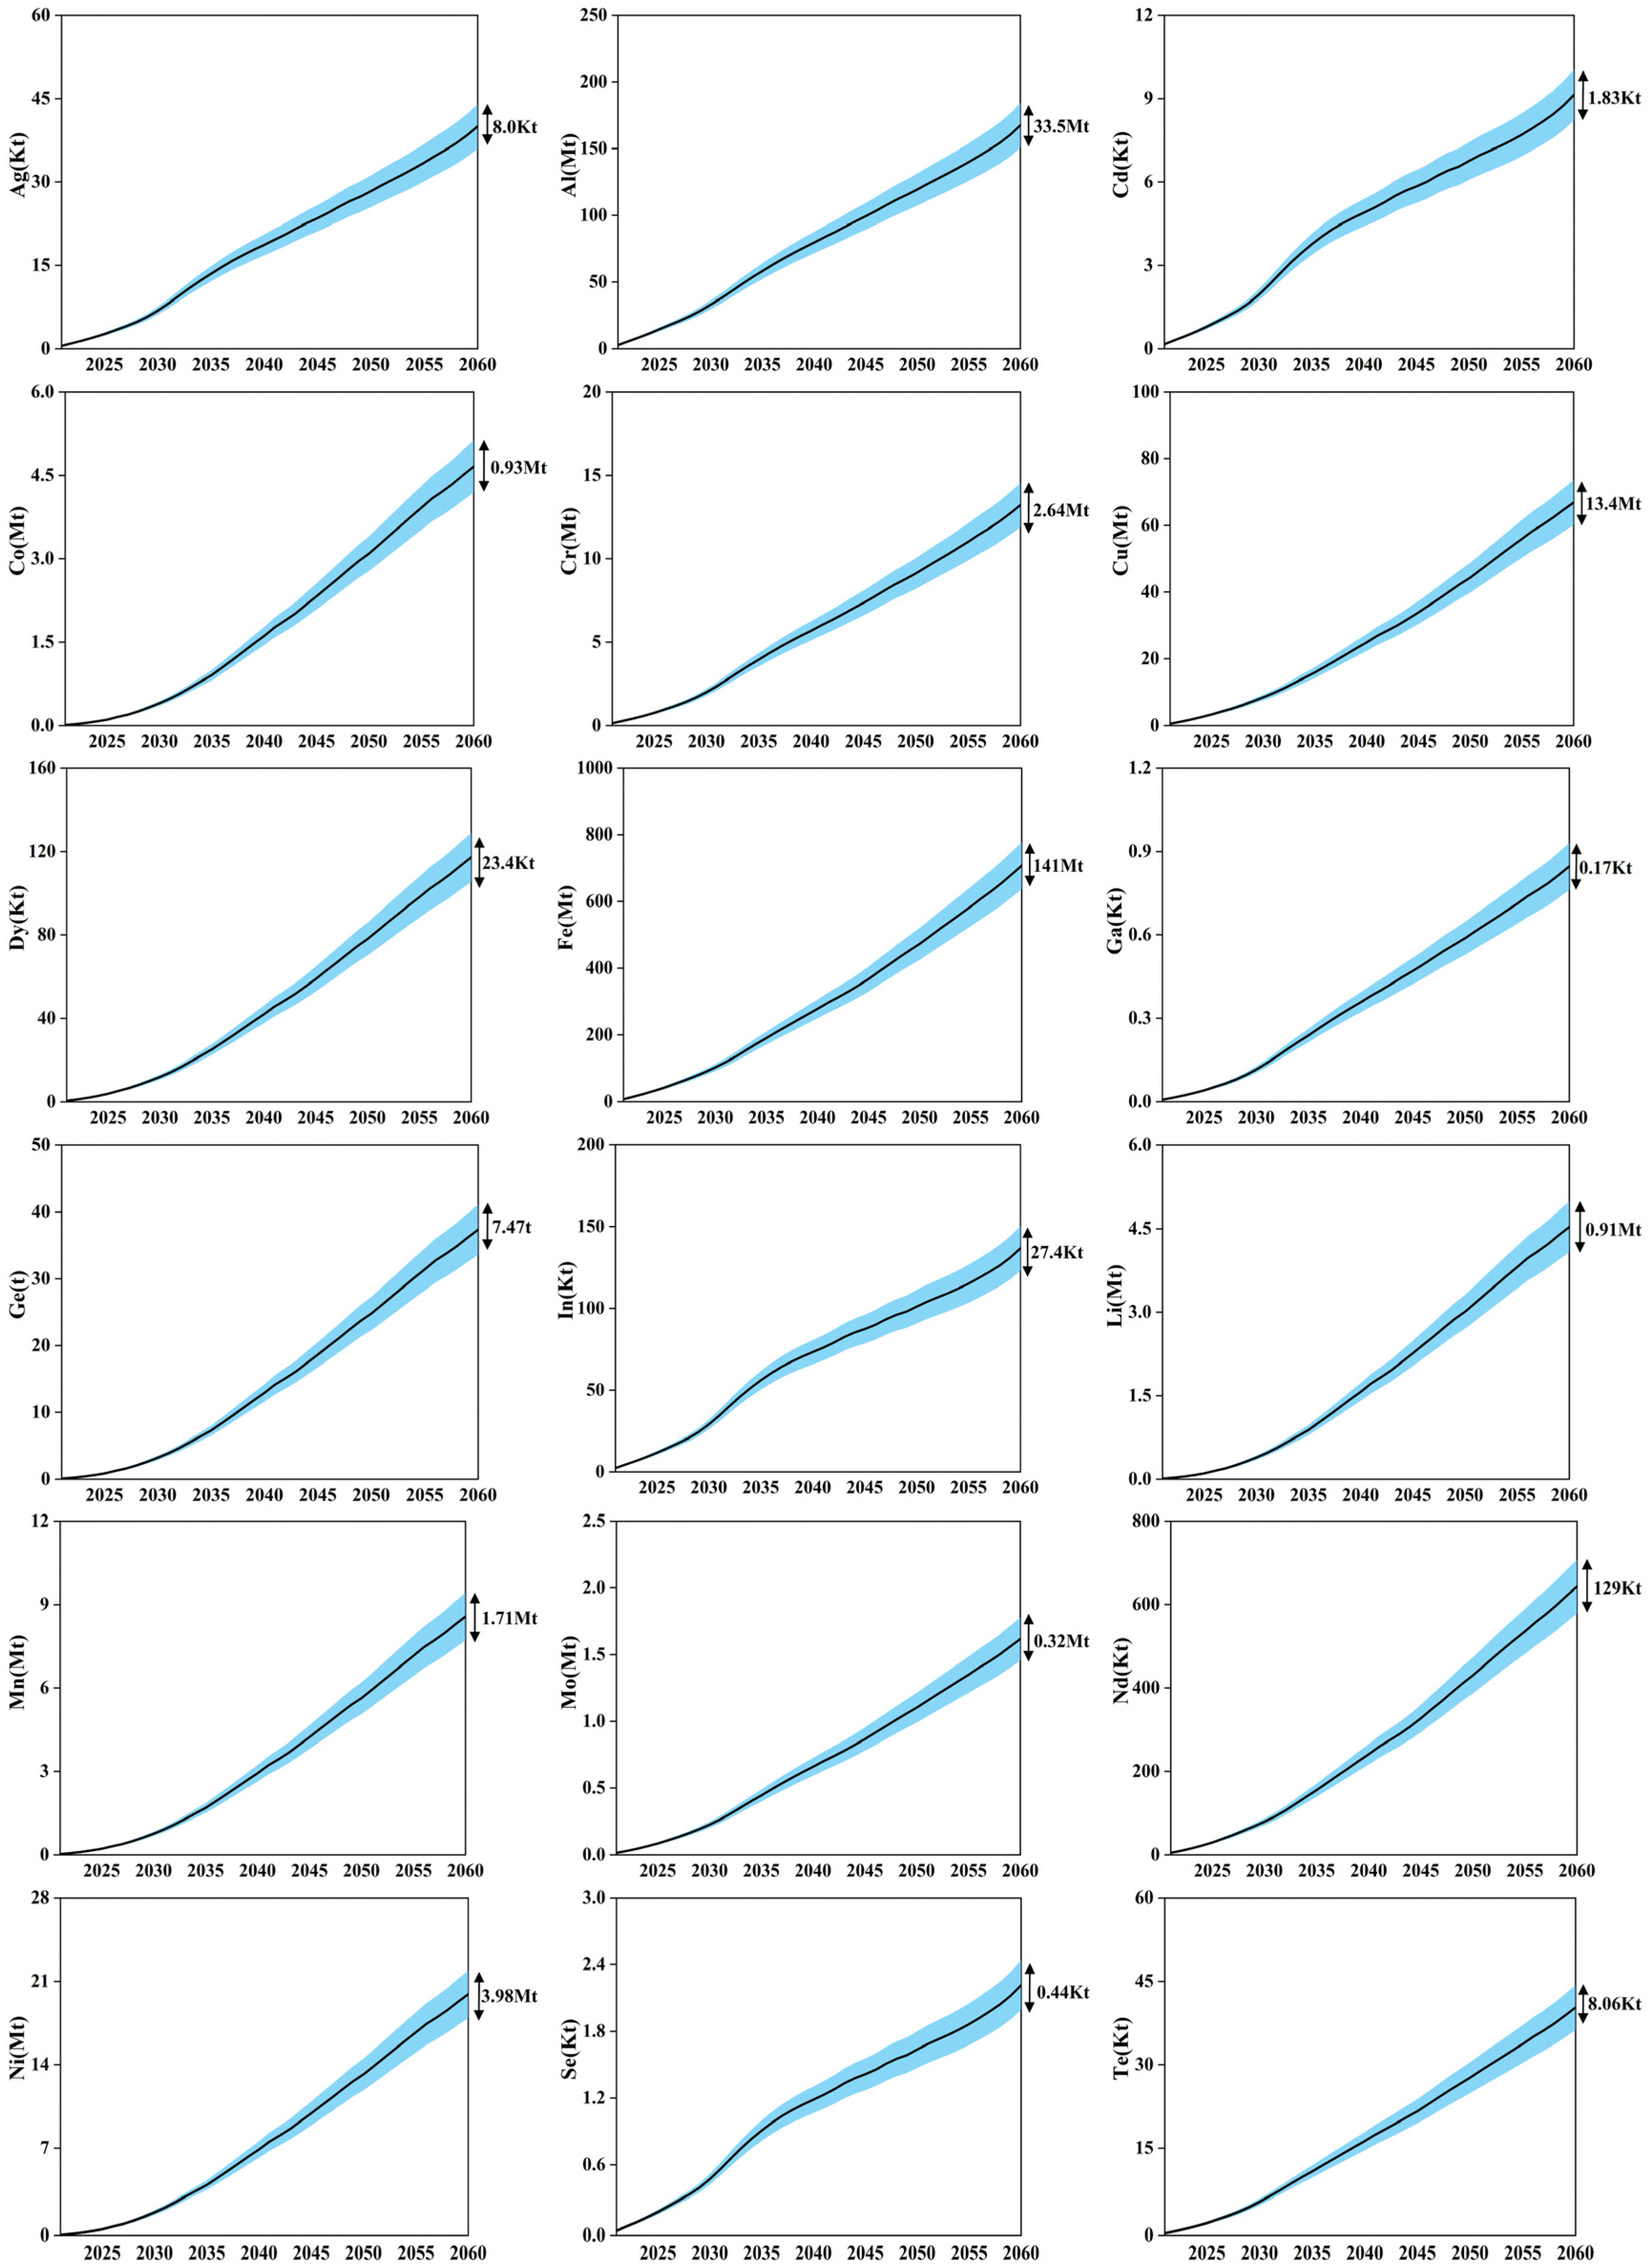
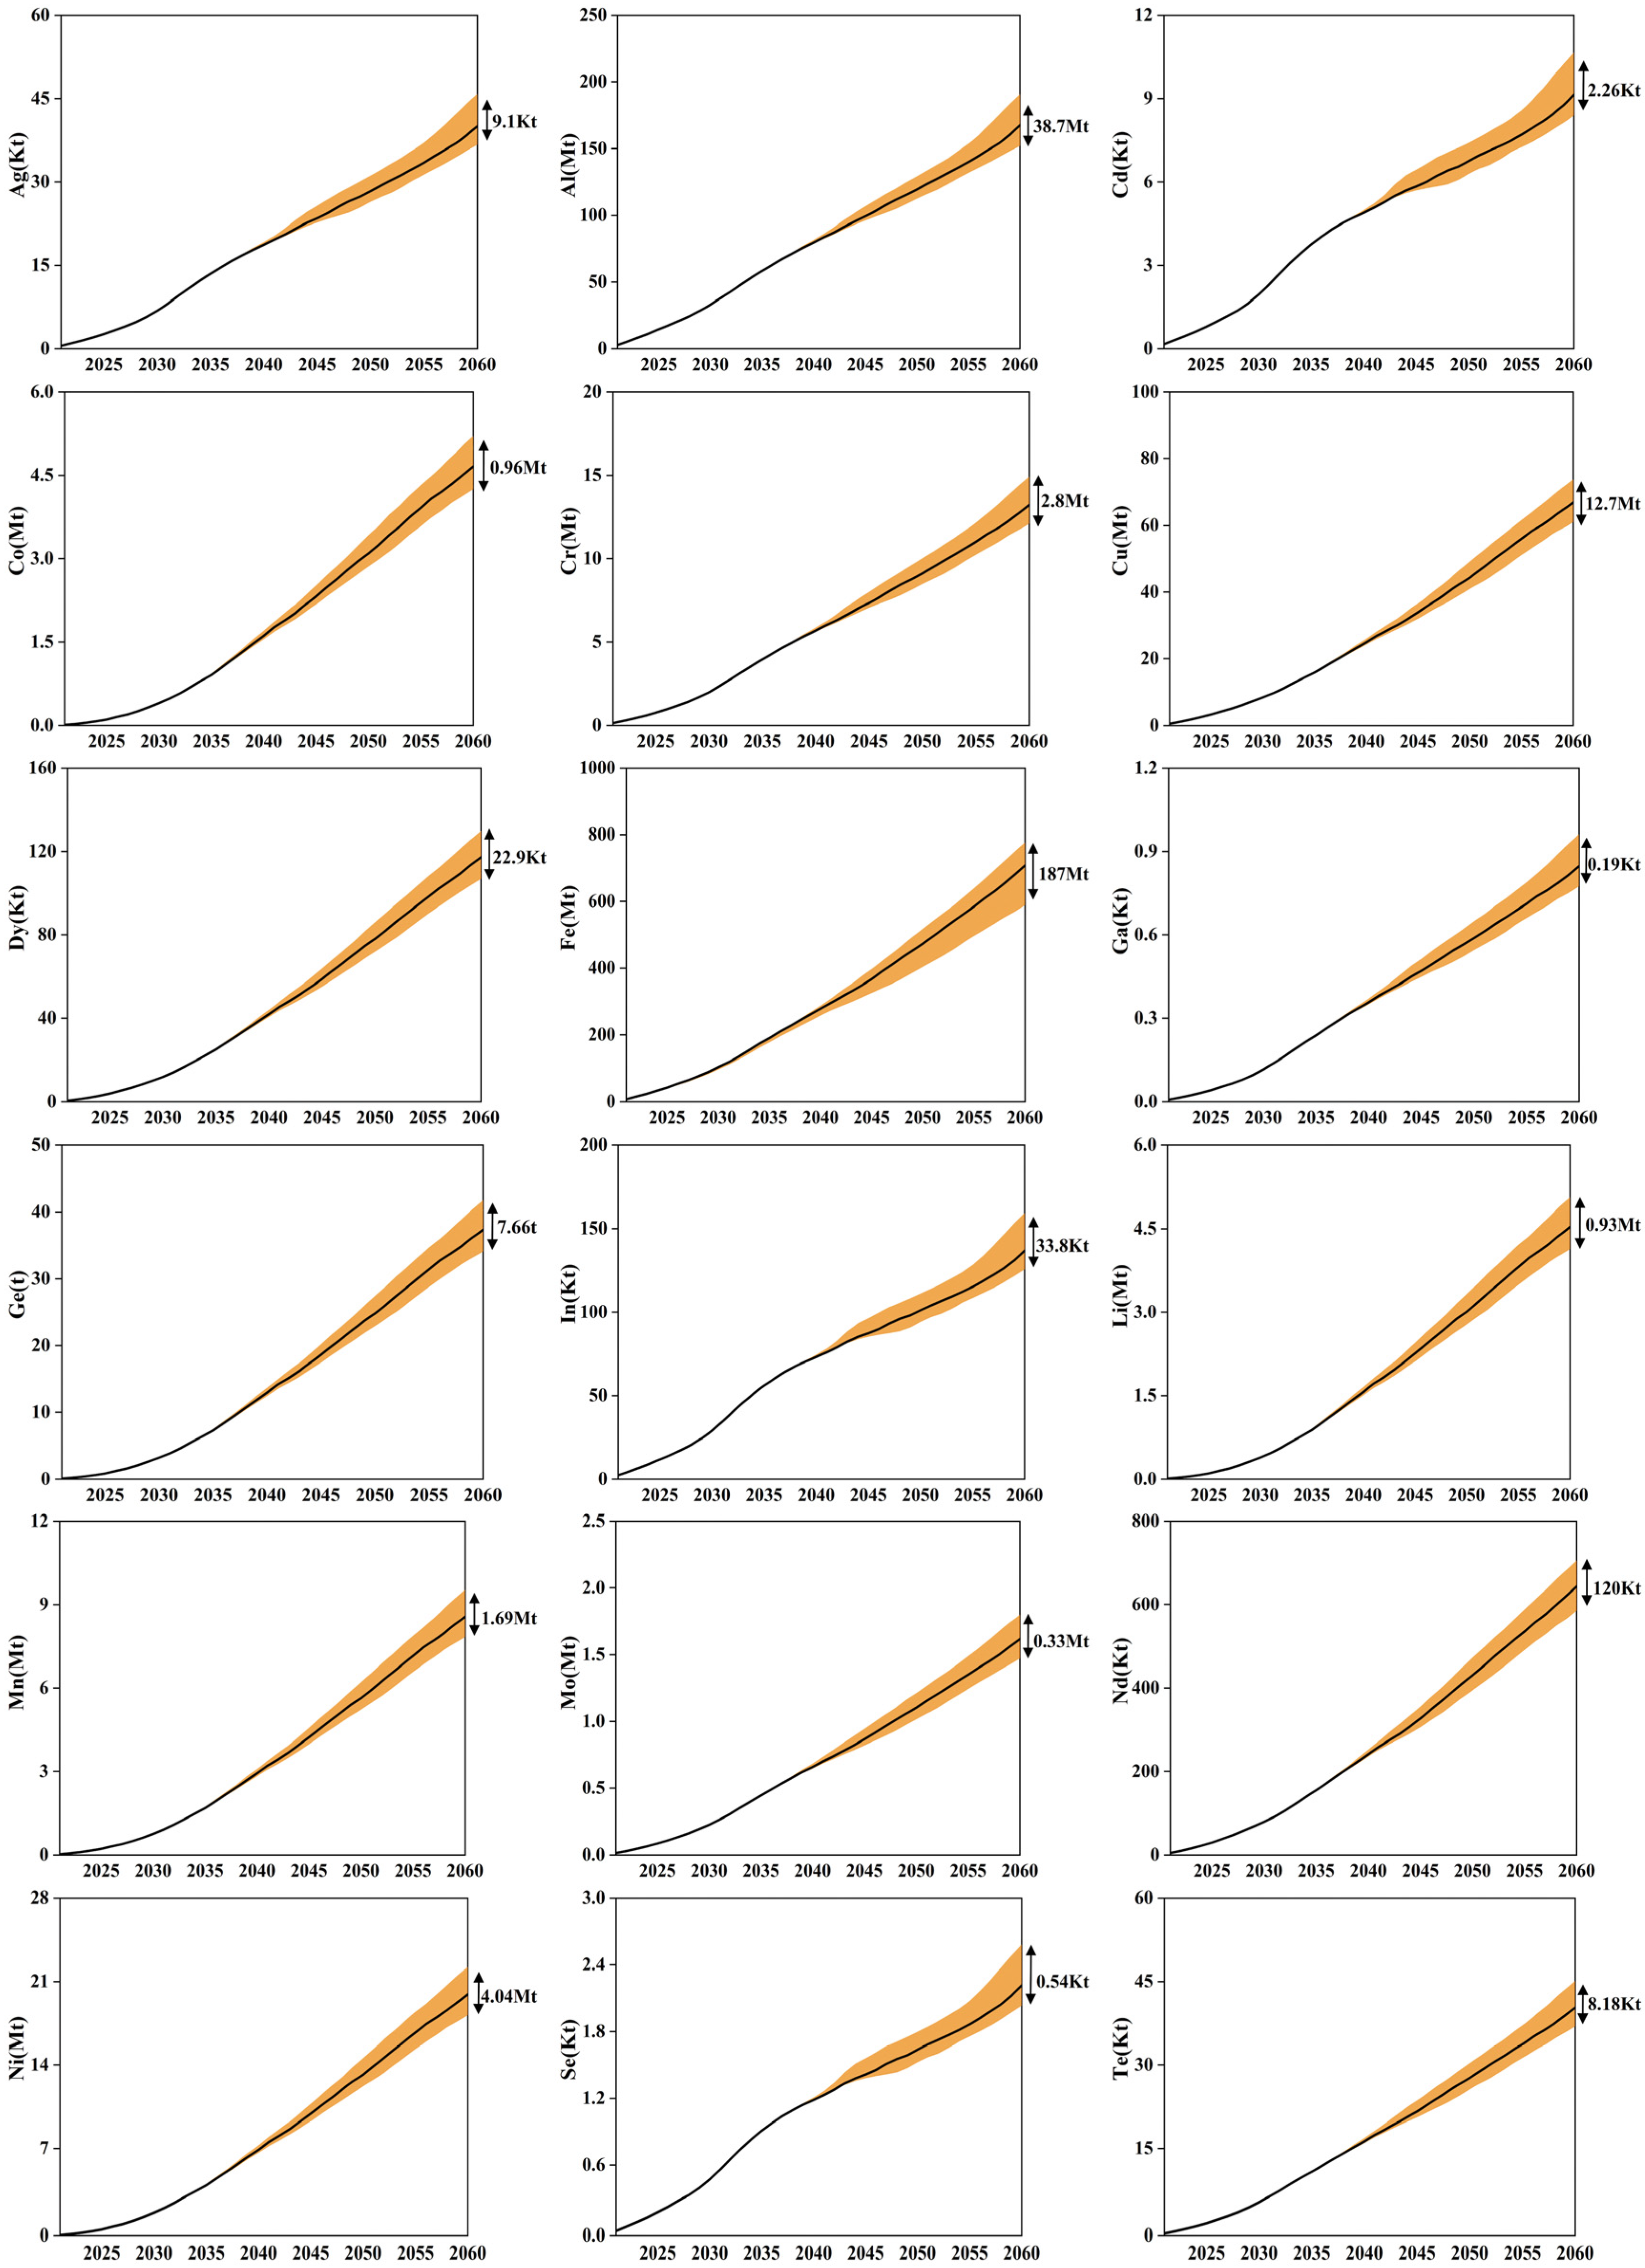
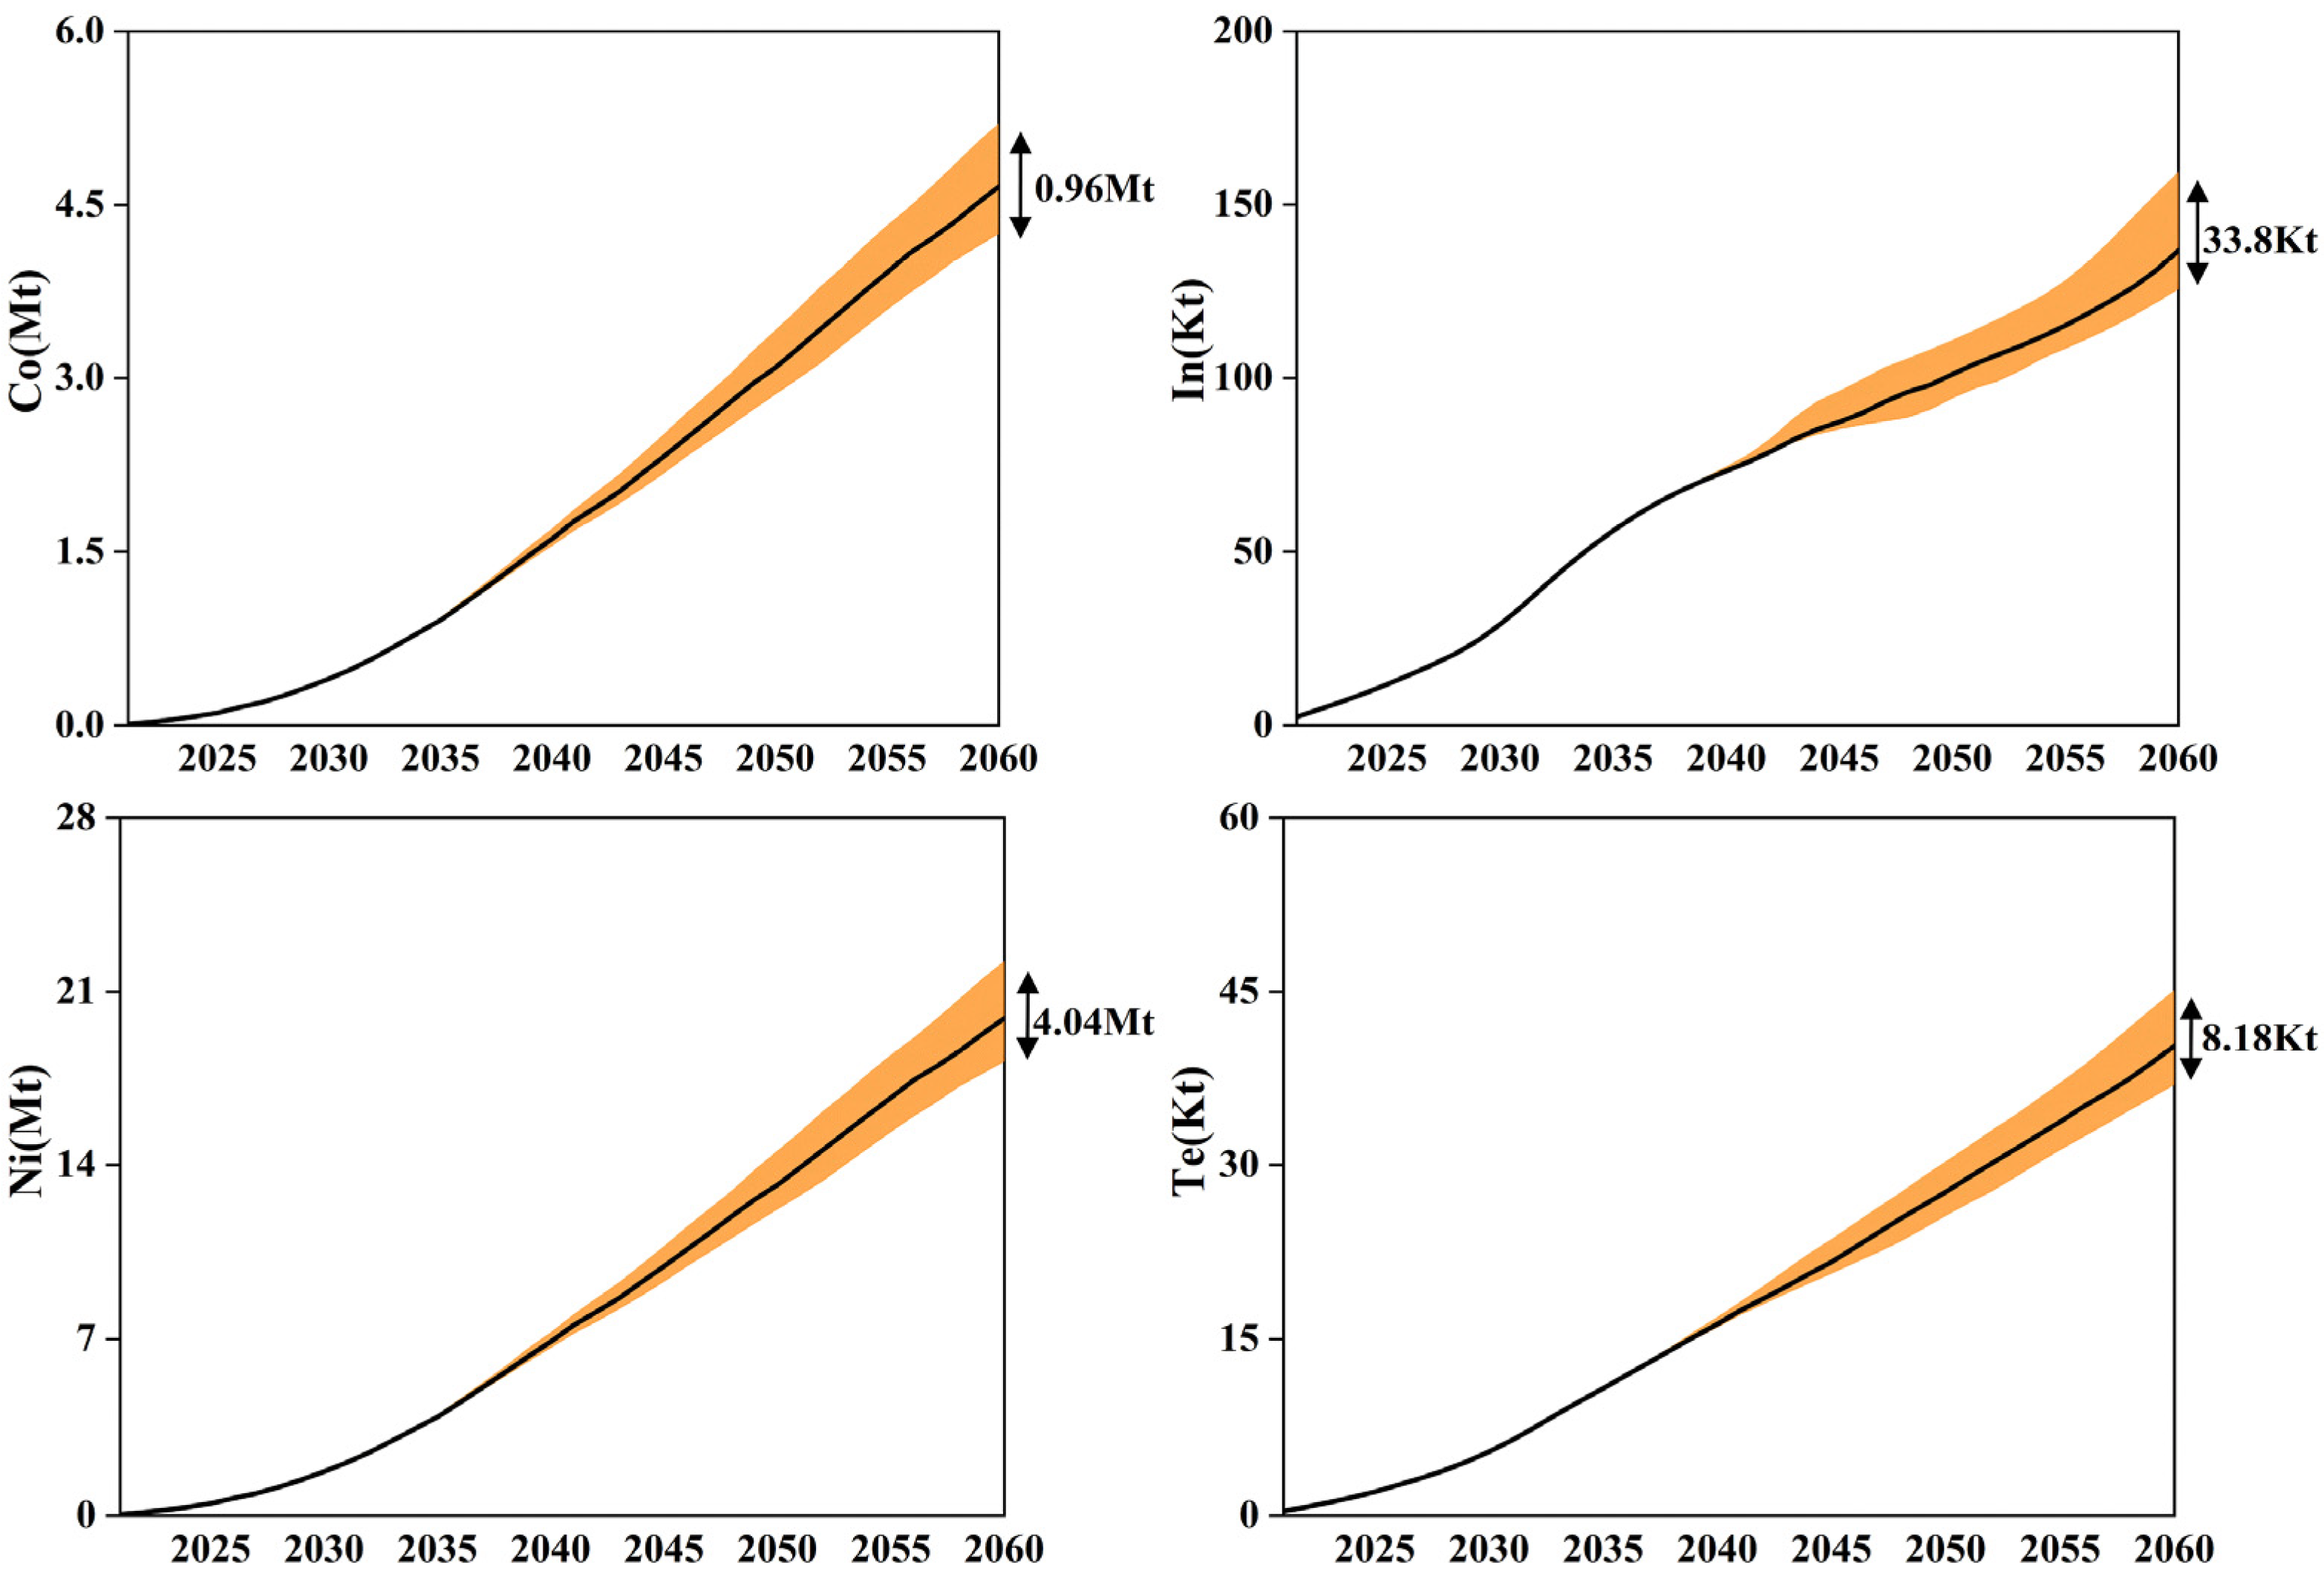
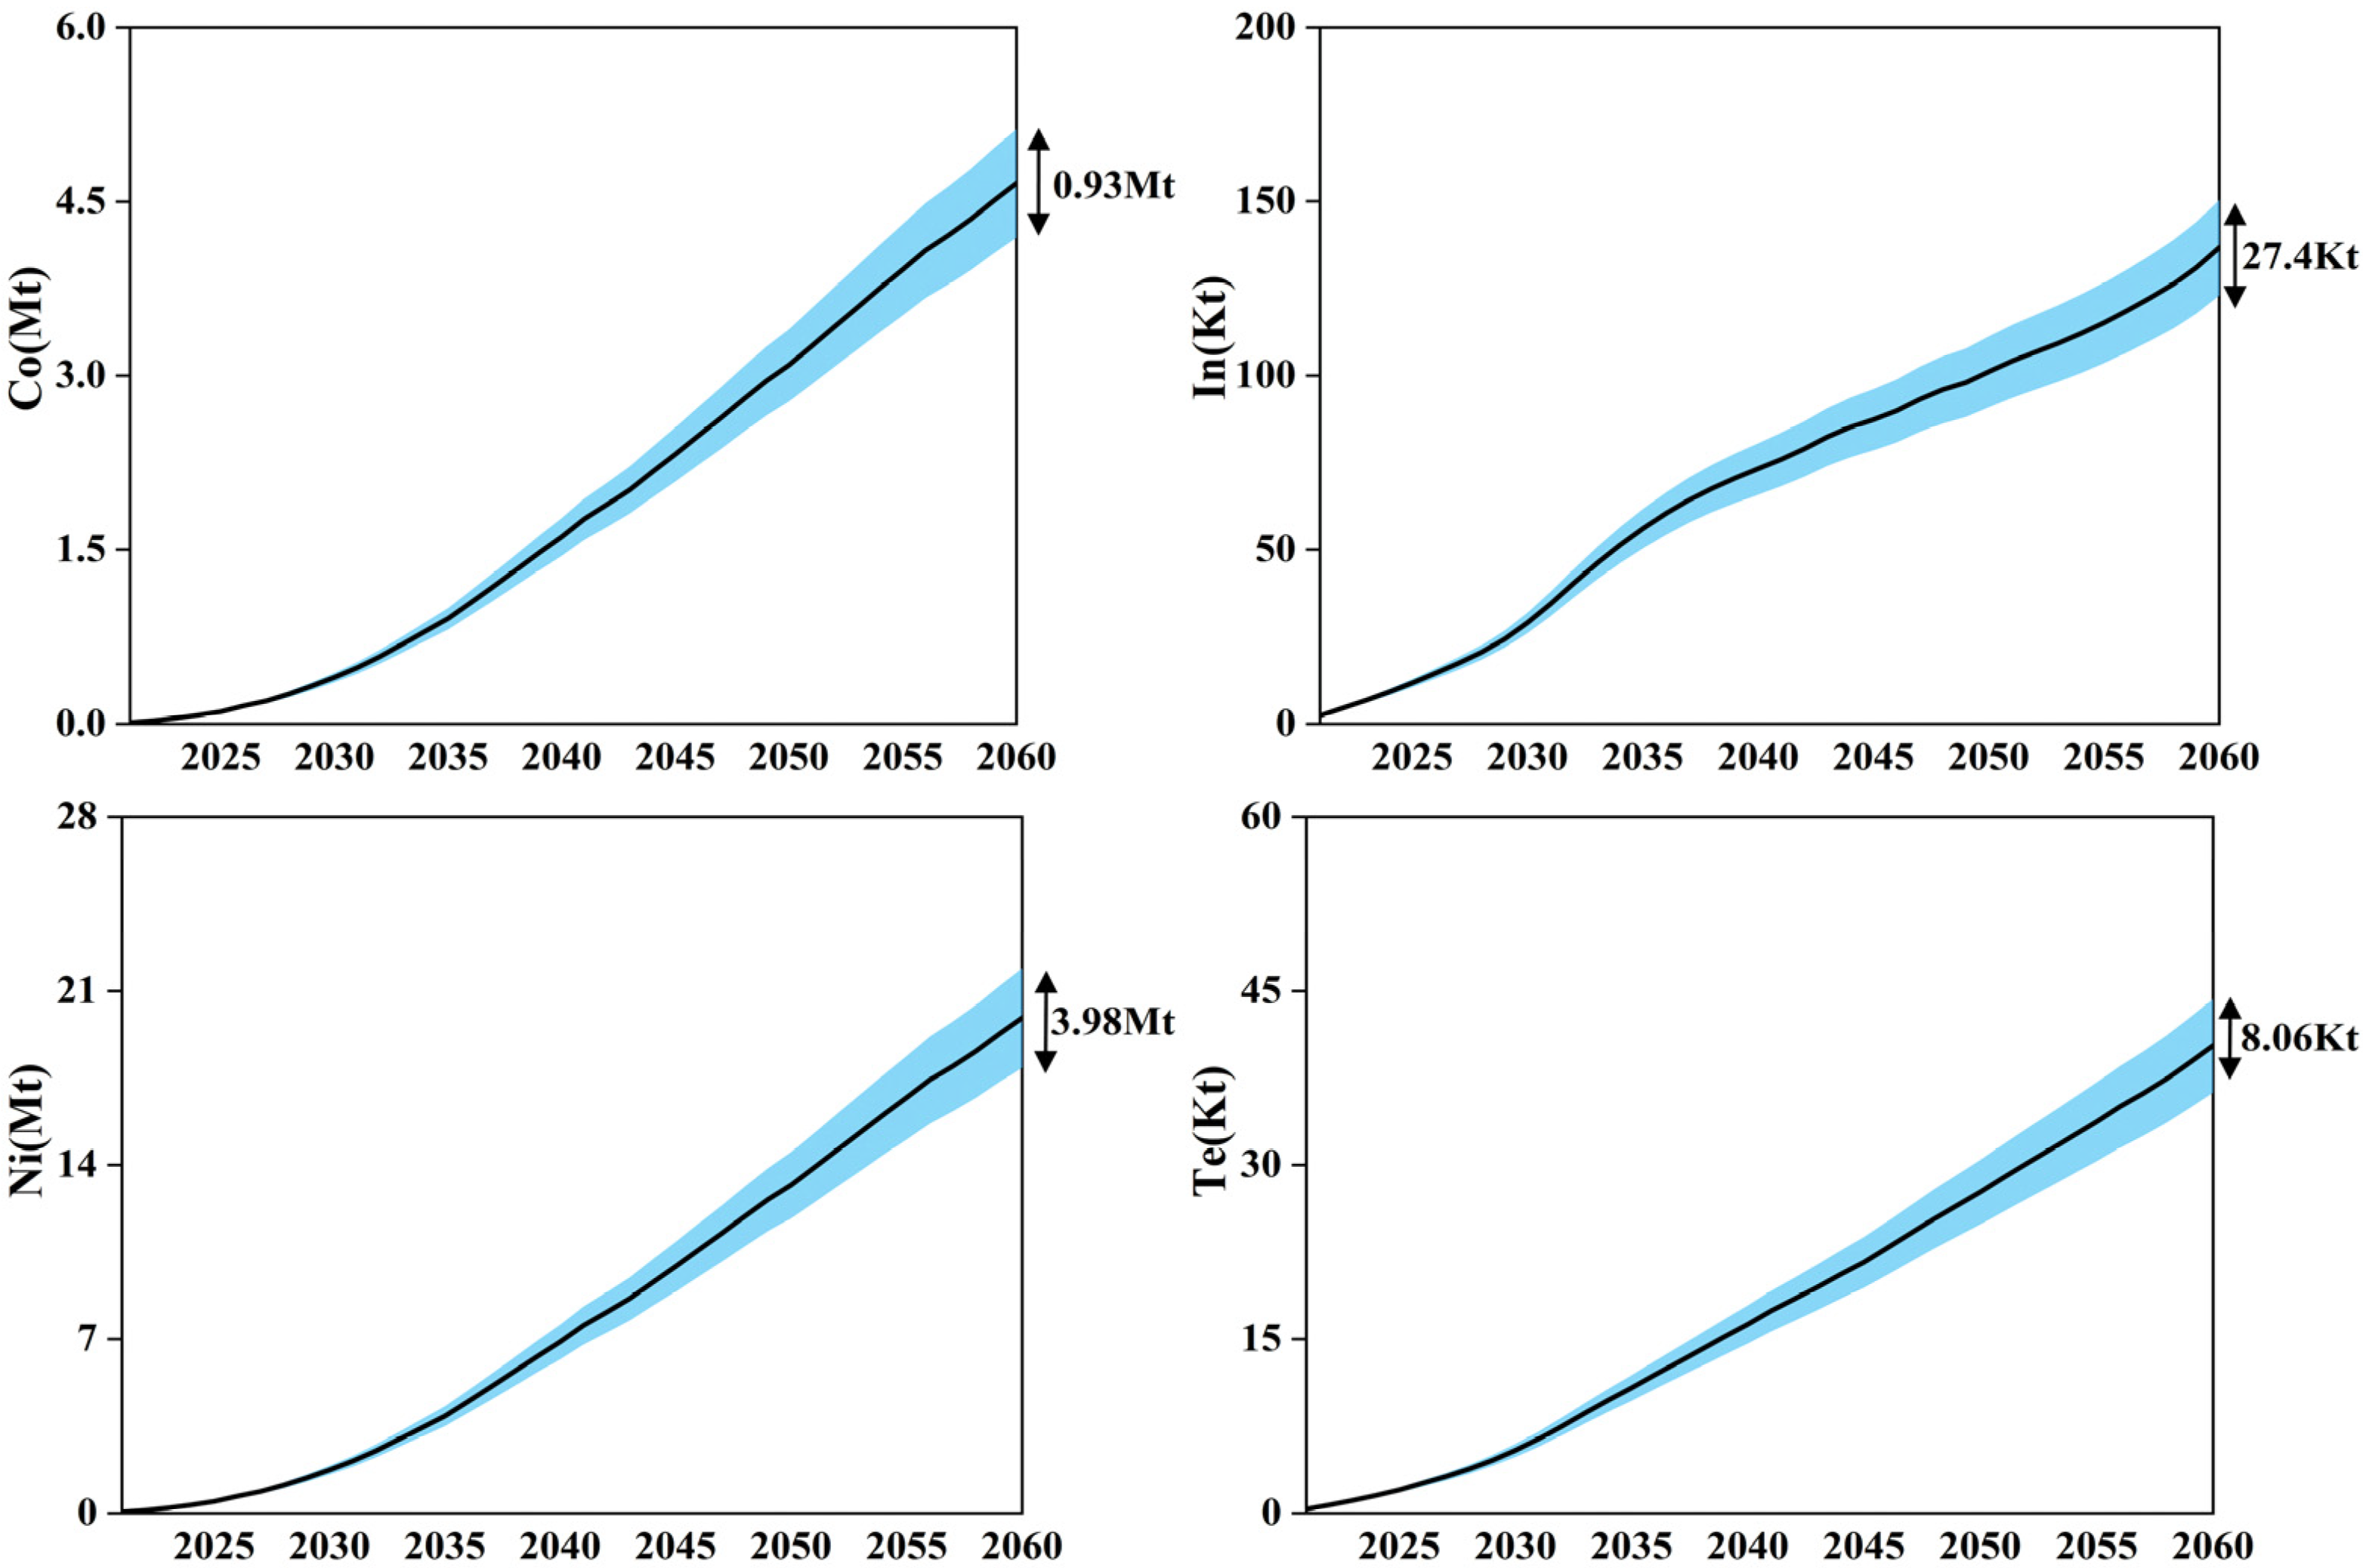
The results for mineral demand depend on assumptions about several parameters (e.g., energy scenario, market share of sub-technologies, MI, lifetime), so are subject to a degree of uncertainty. To assess the uncertainty of results, we conducted a one-way sensitivity analysis using two sensitivity variables (MI and lifetime) to assess the impact of each parameter on mineral demand. That is, a single parameter is changed, while other parameters are held constant [24]. Two key parameters are adjusted by a certain range to assess the impact on mineral demand. In this study, it was assumed that the installed lifetime of each energy technology varied between 10% up and down. This range is roughly the average lifetime to lifetime maximum in previous studies. Material intensity varies between 10% up and down. In this section, we discuss the results for four selected minerals. Appendix C provides the results for all materials.
Figure 3 indicates that extending the life reduces the “recycling potential” by changing the pattern of inflows and outflows, thereby reducing the inflow and outflow of minerals. For example, if the average lifetime is increased by 10%, cumulative Co demand would be 4.24 Mt. Conversely, if the average lifetime is reduced by 10%, cumulative Co demand would be increased by 24.5%. Results show that extending the lifetime will not alleviate short-term supply shortages. However, in the long term, it can alleviate the potential supply bottleneck by reducing the material throughput. Reducing the material intensity of energy technologies does not change the inflow and outflow patterns; however, this can directly reduce material demand (Figure 4).
This study provides a conservative estimate of future mineral demand owing to the following assumptions: (a) In this study, we used the average of material intensity from previous studies to calculate total demand and assumptions based on the mean value of lifetime. (b) Recycled content used is optimistic, and the actual share of recycling may be lower owing to significant growth in installed capacity in the short term. (c) Growth in other uses is not considered. In addition to energy technology, important minerals are needed in various industries (e.g., advanced manufacturing, green transportation, and the military) [19]. For example, only 46% and 44% of global Li and Co are used in lithium-ion batteries [47]. (d) This study does not consider imports and exports of materials and infrastructure, given that China is a global leader in wind and solar manufacturing and may manufacture related infrastructure for other countries, which may increase total demand. Moreover, international trade in EVs and key components may also affect the demand for key materials [7].
Despite large uncertainty in the results owing to the above factors, the key mineral demand growth and supply risk assessment remain valid. This study should not be considered as an estimate of actual future material demand but as a hypothetical analysis of future trends. Moreover, predicting all relevant developments in the material composition of the technology is impossible. Therefore, refining these assumptions in future research is necessary.

3.4. Risk Assessment

Figure 5 shows the depletion potential and demand increase ratio of 18 minerals in 2030 and 2060. Table 6 shows the evaluation results of risk. Table 7 summarizes the basic data of mineral assessment, wherein, in addition to demand, reserves, production, and other indicators, external dependency, and host elements are added.
Table 6 indicates that the risk level of Co and In is “very high,” and the current domestic reserves can hardly meet the demand for energy technologies by 2030. The current dependence of China on Co is 97.7%, and it is estimated that the cumulative demand for Co will exceed 60% of the current global reserves. Hence, according to the current reserves, meeting demand through imports in the future may be difficult, which is extremely risky. The current domestic production of In can almost meet the consumption; however, the policy needs to be strengthened to protect it in the future.
Current Cr, Cu, Li, Ni, and Te reserves can meet the consumption of several energy technologies until 2030; however, they will not meet demand until 2060. Cumulative demand for Ni is expected to be higher than seven times the current Chinese reserve, and the average annual demand for Li and Te is expected to exceed current annual global production. Notably, other areas of consumption for these minerals (e.g., metallurgical (85.2%) and chemical (11.0%) industries) currently account for the largest share of domestic Cr consumption [48].
For Dy and Nd, the current reserve can meet the demand for the energy transition to 2060, but supply risk may be detectable from production. Dy has a high demand to increase the potential of 102. Conversely, Nd has a demand increase potential of 42, meeting most of the demand without considering other uses. While other metals, both in terms of depletion potential and the ratio of demand increase, are at lower risk, this is not absolute.

4. Discussion

4.1. Risk of Mineral Supply

The demand for Co and In of China’s energy technologies by 2060 is 58 and 104 times the current reserves, wherein the demand for Co is 0.8% of global reserves and can be met by global reserves. Conversely, the demand for In far exceeds global reserves and may face greater supply risk in the future. Cumulative demand for Cr, Cu, Li, and Ni are all higher than China’s reserves and do not exceed global reserves. China is a large consumer of Cr, and stainless steel production accounts for more than half of the world, rapid increase in stainless steel production drives the upstream Cr demand [48]. Constrained by resource conditions, China’s Cr demand is mainly met by imports.
Cumulative demand for Li and Ni exceeds 20% of global reserves, and a supply bottleneck is likely in the future. According to the current situation, demand for Te exceeds the global reserves, and the promising CdTe industry will continue driving future demand for Te. Current Chinese Te production can meet domestic demand and export slightly. However, as demand continues to increase, it will probably outstrip supply in the future. The potential for Te resources in China is large and the degree of exploitation is also large. Moreover, China is an important global supplier of Te, the resources are currently exported in large quantities in the form of raw materials or products. Hence, a national reserve policy should be established in time. Dy and Nd may be subject to production constraints. Therefore, production in China would have to be significantly higher compared to historical production to meet the demand for energy technology in China.

4.2. Supply of Coproduced Minerals

Minerals are coproduced with other host materials [7]. For example, about 95% and 70% of In and Ge, respectively, are associated with Zn; about 90% of Te with Cu, Co mainly with Ni and Cu, and Nd and Dy with Fe [19,34,55]. Hence, in addition to issues related to the availability and production capacity of the metals themselves, the supply of host and associated metals should be concerned.
The amount of Zn and Cu that would need to be produced to meet the demand for In and Te in the Chinese energy system can be estimated based on current production ratios of associated (In and Te) and main metals (Zn and Cu), and the demand for the associated metals. For instance, current global production ratios are 51 g of In per ton of Zn and 20.4 g of Te per ton of Cu [30]. In this study, demand for In and Te is 136 kt and 40 kt, respectively. Hence, based on the current production ratios and demand for the associated metals, to meet the demand for In and Te, 2667 and 1960 Mt of Zn and Cu, respectively, should be produced to meet the demand for Te. Considering the historical production of these two metals, these numbers are huge.
Additionally, if one associated metal drives an increase in the production of the main metal, it will also drive an increase in the production of the other associated metals produced jointly. For example, if the demand for Nd and Dy increases, the supply of the main metal Fe will increase, as will the supply of other REEs, such as La, Ce, and Y. China should increase the production of several metals including Nd and Dy to avoid a production supply shortage. Simultaneously, to minimize the impact of possible oversupply of other coproduction metals, mining these metals from Dy and Nd-rich deposits and promoting the utilization of other coproduction metals in more new applications is necessary.

4.3. Role of Recycling

Recycling is a promising alternative to primary resources, by reducing the use of primary resources, recycling can alleviate shortages of critical materials and improve resource use efficiency. Most studies have also highlighted the urgent need for more recycling of critical metals in applications [56,57]. However, our findings indicate that the benefits of recycling are significantly limited in terms of mitigating supply risk, especially over the next 30 years. Additionally, more emphasis should be placed on options for production and use phases (i.e., technology development and better application management, resource efficiency improvements) for the following reasons:
(a) Available recycling resources are considerably limited in the short term. First, historical inflows and lifetimes determine available recycling resources. Energy infrastructure typically has a 20-year (or more) lifespan and is installed in small volumes in the initial years. Therefore, recycling resources are very limited until 2030 and remain low until 2040. (b) Between 2021 and 2060, China will experience a rapidly growing demand for renewable energy and key materials. Owing to the limited recovery resources and large material requirements, the mineral demand for renewable energy technologies in China will continue to become dominated by primary ore resources. (c) Recycling is not always the best option. Key minerals are always used in small quantities; however, these are combined with other materials in complex ways in components [58]. In some cases, collecting, isolating, and purifying critical materials from other components may require greater effort than extracting new materials [59]. Therefore, recycling is not always technically, environmentally, or economically feasible.
However, critical materials for the end-of-life phase are expected to become abundant, beginning in 2040. Therefore, this study advocates that recycling should still be pursued, but more attention should be paid to extending its lifetime and efficiency during the use phase and using more advanced technologies to reduce material intensity. In conclusion, from a material perspective, attention should be paid to technological development and innovation.

4.4. Technology Development and Substitution

Technological development and substitution can mitigate risks associated with material availability. Examples include reducing the intensity of materials while maintaining performance, increasing service life, and finding substitutes. In this study, the impact of technological developments can be illustrated by changes in MI and lifetime. For example, PV technology, which adds 6 years to its current lifespan, would reduce material requirements by 27%, and an increase in the lifetime of EVs by 4 years would reduce demand for metals used by 22%. The effect of reducing the intensity of the material can be more immediate than that of extending its life. As the life-extending effect does not manifest itself until at least one service cycle is completed, a delay effect manifests. If mineral intensity maintains its continuous decline, cumulative demand will decrease.
Substitution of materials or sub-technologies can also reduce risks associated with key materials. Most technologies can be replaced by slightly lower performance (or higher cost) technologies. However, lithium batteries outperform current competitors owing to higher energy and power density, making lithium more difficult to replace while maintaining performance and cost [26]. The choice of sub-technology is expected to make a decisive difference in material requirements and associated risks. In most cases, whether the material is important depends on the particular sub-technology used (e.g., thin-film solar PV) rather than the share or amount of renewable energy used. Demand for Te is expected to decrease if CdTe is eliminated and the market share of CIGS increases, and other metals (e.g., Ag and In) are not expected to increase much [32]. A detailed discussion of technology development and substitution for PV and WP is included in the reference [26]. Policymakers and researchers studying the importance of minerals should consider this finding and focus more on how risk can be reduced by developing the use of new technologies that reduce intensity or increase lifetime, and promote technological and material diversity.

4.5. International Impact

Mitigating global climate change will require an unprecedented scaling up of renewable infrastructure worldwide. Considering the greater metal intensity of renewables, global energy system demand will rapidly shift from fossil energy to metals [18]. The enhanced metal–energy nexus will have various key impacts on mineral systems.
First, energy transition may increase resource competition among countries. While global energy governance analyzes supply risks to oil, coal, and other fossil fuels, renewable technologies enhance global energy security [60]. With the global transition to renewable energy, demand for the requisite materials is growing [61,62], but availability remains limited. Key minerals are unevenly distributed across countries and concentrated in a few countries. About 82% of REE production and 37% of reserves are currently concentrated in China; more than 75% of Li production is concentrated in Australia and Chile; 84% of reserves are concentrated in Australia, China, and Chile; and about 52% of Co production and 47% of reserves are concentrated in Congo [49]. Consequently, global and national policymakers monitor such mineral constraints in energy planning, and have thus developed corresponding mineral policies [63]. Future developments are expected to significantly increase the competition for these minerals among countries.
Second, driven by global energy transition, mineral demand has made international trade in key minerals increasingly important. In this study, China will require a large number of different materials to support rapid renewable energy growth. Demand for most of these minerals (i.e., Cd, Te, In, Ga, Se, and Ge) will exceed its domestic reserves, making international trade imperative. As these key minerals remain unevenly distributed and highly concentrated in a limited number of countries, the transnational exchange of technologies and minerals will be instrumental in mitigating climate change. Cooperation among countries with renewable energy and mineral resources is key to the global energy transition, enhancing international energy cooperation decisions to mitigate potential supply risks.

4.6. Environmental and Social Issues

While environmental health is a key driver in energy transition, policies and strategies that only consider decarbonization can present serious unprecedented problems. Copper mining can lead to long-term heavy mineral contamination of soil and water bodies [64]. The production process of REEs requires large amounts of chemicals—which can endanger human health if poorly managed—and generates large amounts of solid waste, gas, and wastewater [65]. In the early stage, while China’s rare earth industry was developing rapidly, extensive mining caused damage to mountains, soil, water bodies, and the ecological environment [66]. In addition, the environmental impacts are unclear for some minerals (e.g., specialty minerals used in PV) because these are often mined as byproducts [64].
Although the increase in mineral demand and a large number of mining activities can create environmental or social problems, these will reduce fossil fuel extraction impacts, especially coal mining, which can lead to lung damage and kidney disease due to coal dust exposure [67]. For all energy-related mining activities, developing protective measures to avoid negative impacts on the environmental health of workers and local communities will contribute to the achievement of sustainable energy (or SDG 7). Considering the environmental and social impacts (including health and human rights impacts) of resource demand may help advance management policies and mitigate the potential adverse impacts of a low-carbon transition. Hence, examining the full life cycle of energy technologies and their materials ensures that these mining activities create a net positive contribution to the fight against climate change [68].

5. Conclusions

This study analyzed the minerals required for the future development of power generation technologies, electricity T&D, and EVs in China. Through a dynamic stock model, we calculated the flows and stocks of energy infrastructure by making assumptions about mineral intensity, sub-technology market share, service life, and recycling while quantifying annual and cumulative demand for 18 minerals, and discussed future mineral supply risks. Finally, we discussed the influence of uncertainty on the results from parameters such as lifetime and material intensity. From the analysis, we draw the following conclusions:
  • Our analysis demonstrates that using materials in energy systems should not only emphasize power generation but also consider mineral material demand in transmission and consumption sectors, according to scenarios of future energy system development. For example, owing to very high ownership and the short lifetime of future EVs, demand for a wide range of minerals will exceed future demand in other applications, including other scarce minerals (e.g., Nd, Dy, Co, Li, and Ni).
  • From the research perspective of this paper, China’s energy system prioritizes the security of Co and In; availability of Cr, Cu, Li, Ni, and Te; and the production capacity of Nd and Dy. Currently, Co, Li, and Ni mainly limit EV development, particularly in thin-film technologies (CdTe and CIGS) in PV; moreover, the availability of In has a relatively large impact on EVs. Among high-risk minerals, no mineral availability is expected to limit WP. Conversely, the production of medium-risk minerals Nd and Dy may limit these technologies.
  • Without adequate supplies of primary minerals, carbon-neutral scenarios remain difficult to achieve. China should balance the development and use of different technology types to improve the lifetime of its energy infrastructure, reduce the material intensity, improve resource efficiency, and, in the long term, increase the recycling and reuse of end-of-life materials. This could mitigate some of the environmental impacts associated with the production of these materials and drive technological development. Additionally, energy models used to generate these scenarios should include energy–mineral relationships.
  • China plays an important role in the future supply of several metals, but it currently has a low share of resources in some other minerals. China’s production of minerals such as REEs will be required to meet the growing demand for these materials in the domestic energy transition. Therefore, we can expect shortages in the availability of these materials for energy technologies in other regions. Future use of several metals, including Ni, Co, and Li, is expected to be large, and resource security strategies should be developed in advance.
  • While the power sector is not the only contributor to the growth in the demand for global materials over the next few decades, expected growth in infrastructure required for electrifying power generation, transmission, and transportation will likely mean that it will become increasingly important in material demand through 2060. Our study analysis is limited to several energy technologies and excludes other applications. Therefore, expanding the analysis to include the entire electricity system in future studies and combining it with analyses of other sectors is important.

Author Contributions

Data curation, B.C.; formal analysis, Z.L.; investigation, B.Q. and S.C.; supervision, C.S.; writing—original draft, B.C.; writing—review and editing, C.S. All authors have read and agreed to the published version of the manuscript.

Funding

This work was supported by the Department of Science and Technology of Shandong Province (No. 2021SFGC0904-05); and Zaozhuang Science and Technology Bureau (No. 2021GH21). The authors appreciate the insightful and constructive comments of each reviewer.

Data Availability Statement

The data used to support the findings of this study will be available from the corresponding authors upon request.

Acknowledgments

The authors would like to thank the anonymous reviewers and the editor for their constructive comments and suggestions for this paper.

Conflicts of Interest

The authors declare no conflict of interest.

Appendix A

Assumptions of mineral intensity.
Table A1. List of minerals used in CSP installations (in ton/GW) [64].
TroughTower
Ag812
Al28572,967
Cr47333700
Cu31751400
Fe583,333393,000
Mn7365700
Mo20056
Ni4711800
Table A2. List of minerals used in PV installations (in ton/GW) [69].
CIGSCdTeC-SiUndefined
Ag 18.00703125
Al 45,125
Cd1.348.86666667
Cr 2790
Cu132.83333332930.023333697.5
Fe 78,014.28571
Ga3.693103448
In1747.50588215.5
Mo 200
Ni 161
Se18.00703125
Si 1716.25
Te 50.68888889
Table A3. List of minerals used in WP installations (in ton/GW) [69].
OffshoreOnshoreUndefined
Al3060.4285711656
Cr372610.3333333
Cu8187.13514.071429
Dy13.382222226.78
Fe257,696.6667134,575.5
Mn 45
Mo 225.5
Nd136.771333383.29
Ni111111
Pr342.325
Te71
Table A4. List of minerals used in wires (in ton/km) [31].
Voltage (kV)FeAl
Alternating Current (AC)350.652
1101.44
22039
3301030
5002060
75045135
100065195
Direct Current (DC)±40011.535
±66022.567.5
±80040120
Table A5. List of minerals used in transformer (in Kg/unit) [21].
Steel (Fe)AlCu
HV Transformer296,00049776047
Table A6. List of minerals used in EV (in g/vehicle) [69].
BEVPHEV
Ag2328
Al136,900134,652
Co11,2343911
Cr991010,696
Cu110,19658,418
Dy161127
Fe828,7311,003,969
Ga10.81
Ge0.090.05
In0.280.22
Li72343719
Mn1957711,808
Mo18351835
Nd552804
Ni42,18427,086
Pr77336
Te3420

Appendix B

Recycled content.
Table A7. List of contents of recovered minerals [27].
Recycled Content/% Recycled Content/%
Ag30Ge35
Al36In37.5
Cd25Li1
Co32Mn37
Cr20Mo33
Cu30Nd5
Dy10Ni29
Fe50Se0 [19]
Ga25Te1

Appendix C

Sensitivity and uncertainty analysis.
Figure A1. Results of mineral intensity sensitivity analysis for all minerals.
Sustainability 15 00585 g0a1
Figure A2. Results of lifetime sensitivity analysis for all minerals.
Sustainability 15 00585 g0a2

References

  1. Rogelj, J.; den Elzen, M.; Hohne, N.; Fransen, T.; Fekete, H.; Winkler, H.; Schaeffer, R.; Sha, F.; Riahi, K.; Meinshausen, M. Paris Agreement climate proposals need a boost to keep warming well below 2 degrees C. Nature 2016, 534, 631–639. [Google Scholar] [CrossRef] [PubMed] [Green Version]
  2. Johnston, B. Arsenic and the 2030 Agenda for Sustainable Development. 2016. Available online: https://www.semanticscholar.org/paper/Arsenic-and-the-2030-Agenda-for-Sustainable-Johnston/ce835c47d4eb12b1764b61a83d0b16182e933c3b (accessed on 20 December 2021).
  3. IEA. World Energy Outlook 2021; IEA: Dallas, TX, USA, 2021. [Google Scholar]
  4. IRENA. World Energy Transitions Outlook 1.5 °C Pathway; IRENA: Abu Dhabi, United Arab Emirates, 2022. [Google Scholar]
  5. IEA. The Role of Critical Minerals in Clean Energy Transitions; IEA: Dallas, TX, USA, 2021. [Google Scholar]
  6. Tianduo, P.; Zhiyi, Y.; Lei, R. Pathway for China’s Transport Sector Towards Carbon Neutrality Target. Chin. J. Automot. Eng. 2022, 12, 351–358. [Google Scholar]
  7. Elshkaki, A. Long-term analysis of critical materials in future vehicles electrification in China and their national and global implications. Energy 2020, 202, 117697. [Google Scholar] [CrossRef]
  8. Xu, B.; Lin, B. Do we really understand the development of China’s new energy industry? Energy Econ. 2018, 74, 733–745. [Google Scholar] [CrossRef]
  9. BP. Energy Outlook 2022; BP: London, UK, 2022. [Google Scholar]
  10. Zhou, Y.; Li, J.; Wang, G.; Chen, S.; Xing, W.; Li, T. Assessing the short-to medium-term supply risks of clean energy minerals for China. J. Clean. Prod. 2019, 215, 217–225. [Google Scholar] [CrossRef]
  11. Yang, S.; Wang, Y.; Ao, W.; Bai, Y.; Li, C. Prediction and Analysis of CO(2) Emission in Chongqing for the Protection of Environment and Public Health. Int. J. Environ. Res. Public Health 2018, 15, 530. [Google Scholar] [CrossRef] [Green Version]
  12. Wang, Y.; Ge, X.-L.; Liu, J.-L.; Ding, Z. Study and analysis of energy consumption and energy-related carbon emission of industrial in Tianjin, China. Energy Strategy Rev. 2016, 10, 18–28. [Google Scholar] [CrossRef]
  13. Zhu, B.; Zhang, T. The impact of cross-region industrial structure optimization on economy, carbon emissions and energy consumption: A case of the Yangtze River Delta. Sci. Total Environ. 2021, 778, 146089. [Google Scholar] [CrossRef]
  14. Mi, Z.; Yuan, B.; Zhang, J. Study on the Scale of New Energy Development during the 14th Five-Year Plan Period. Earth Environ. Sci. Trans. 2019, 371, 042059. [Google Scholar] [CrossRef]
  15. NDRC. China 2050 High Renewable Energy Penetration Scenario and Roadmap Study; NDRC: Beijing, China, 2015. [Google Scholar]
  16. DNV. Energy Transition Outlook 2021; DNV: Høvik, Norway, 2021. [Google Scholar]
  17. IRENA. Renewable Capacity Statistics 2022; IRENA: Abu Dhabi, United Arab Emirates, 2022. [Google Scholar]
  18. Ali, S.H.; Giurco, D.; Arndt, N.; Nickless, E.; Brown, G.; Demetriades, A.; Durrheim, R.; Enriquez, M.A.; Kinnaird, J.; Littleboy, A.; et al. Mineral supply for sustainable development requires resource governance. Nature 2017, 543, 367–372. [Google Scholar] [CrossRef] [Green Version]
  19. Wang, P.; Chen, L.-Y.; Ge, J.-P.; Cai, W.; Chen, W.-Q. Incorporating critical material cycles into metal-energy nexus of China’s 2050 renewable transition. Appl. Energy 2019, 253, 113612. [Google Scholar] [CrossRef]
  20. Grandell, L.; Lehtilä, A.; Kivinen, M.; Koljonen, T.; Kihlman, S.; Lauri, L.S. Role of critical metals in the future markets of clean energy technologies. Renew. Energy 2016, 95, 53–62. [Google Scholar] [CrossRef]
  21. Deetman, S.; de Boer, H.S.; Van Engelenburg, M.; van der Voet, E.; van Vuuren, D.P. Projected material requirements for the global electricity infrastructure—Generation, transmission and storage. Resour. Conserv. Recycl. 2021, 164, 105200. [Google Scholar] [CrossRef]
  22. Viebahn, P.; Soukup, O.; Samadi, S.; Teubler, J.; Wiesen, K.; Ritthoff, M. Assessing the need for critical minerals to shift the German energy system towards a high proportion of renewables. Renew. Sustain. Energy Rev. 2015, 49, 655–671. [Google Scholar] [CrossRef] [Green Version]
  23. Beylot, A.; Guyonnet, D.; Muller, S.; Vaxelaire, S.; Villeneuve, J. Mineral raw material requirements and associated climate-change impacts of the French energy transition by 2050. J. Clean. Prod. 2019, 208, 1198–1205. [Google Scholar] [CrossRef]
  24. Cao, Z.; O’Sullivan, C.; Tan, J.; Kalvig, P.; Ciacci, L.; Chen, W.; Kim, J.; Liu, G. Resourcing the Fairytale Country with Wind Power: A Dynamic Material Flow Analysis. Environ. Sci. Technol. 2019, 53, 11313–11322. [Google Scholar] [CrossRef] [Green Version]
  25. Pihl, E.; Kushnir, D.; Sandén, B.; Johnsson, F. Material constraints for concentrating solar thermal power. Energy 2012, 44, 944–954. [Google Scholar] [CrossRef]
  26. Månberger, A.; Stenqvist, B. Global metal flows in the renewable energy transition: Exploring the effects of substitutes, technological mix and development. Energy Policy 2018, 119, 226–241. [Google Scholar] [CrossRef]
  27. Valero, A.; Valero, A.; Calvo, G.; Ortego, A. Material bottlenecks in the future development of green technologies. Renew. Sustain. Energy Rev. 2018, 93, 178–200. [Google Scholar] [CrossRef]
  28. Klimenko, V.V.; Ratner, S.V.; Tereshin, A.G. Constraints imposed by key-material resources on renewable energy development. Renew. Sustain. Energy Rev. 2021, 144, 111011. [Google Scholar] [CrossRef]
  29. Zhou, Y.; Li, J.; Rechberger, H.; Wang, G.; Chen, S.; Xing, W.; Li, P. Dynamic criticality of by-products used in thin-film photovoltaic technologies by 2050. J. Clean. Prod. 2020, 263, 121599. [Google Scholar] [CrossRef]
  30. Elshkaki, A.; Shen, L. Energy-material nexus: The impacts of national and international energy scenarios on critical metals use in China up to 2050 and their global implications. Energy 2019, 180, 903–917. [Google Scholar] [CrossRef]
  31. Li, F.; Ye, Z.; Xiao, X.; Xu, J.; Liu, G. Material stocks and flows of power infrastructure development in China. Resour. Conserv. Recycl. 2020, 160, 104906. [Google Scholar] [CrossRef]
  32. Elshkaki, A. Material-energy-water-carbon nexus in China’s electricity generation system up to 2050. Energy 2019, 189, 116355. [Google Scholar] [CrossRef]
  33. Jinhuan, Z. Adjustment and interpretation of new energy vehicle industry development plan (2021–2035). Auto Manuf. Eng. 2021, 32–34. [Google Scholar] [CrossRef]
  34. Elshkaki, A.; Graedel, T.E. Solar cell metals and their hosts: A tale of oversupply and undersupply. Appl. Energy 2015, 158, 167–177. [Google Scholar] [CrossRef]
  35. Kavlak, G.; Graedel, T.E. Global anthropogenic selenium cycles for 1940–2010. Resour. Conserv. Recycl. 2013, 73, 17–22. [Google Scholar] [CrossRef]
  36. Zhou, N.; Lu, H.; Nina, K.; Xu, L.; David, F.; Lynn, P.; Bo, S.; Wei, F.; Jiang, L.; Carolyn, S.; et al. China Energy Outlook 2020. Available online: https://china.lbl.gov/sites/default/files/China%20Energy%20Outlook%202020.pdf (accessed on 20 December 2021).
  37. Institute of Climate Change and Sustainable Development of Tsinghua University. China’s Long-Term Low Carbon Development Strategies and Pathways. Available online: https://link.springer.com/content/pdf/10.1007/978-981-16-2524-4.pdf?pdf=button (accessed on 20 December 2021).
  38. Navigato, C.M.E. China Energy and Electricity Development Outlook 2021; China Electric Power Publishing House: Beijing, China, 2021. [Google Scholar]
  39. Albertus, B.J. The Solar Futures Study; U.S. Department of Energy: Washington, DC, USA, 2021. [Google Scholar]
  40. Cao, S.; Zhou, G.; Cai, Q.; Ye, Q.; Pang, H.; Wu, X. A review of solar cells: Materials, policy-driven mechanisms and application prospects. Acta Mater. Compos. Sin. 2022, 39, 1847–1857. [Google Scholar] [CrossRef]
  41. Qingqing, M.; Chunyan, S.; Xiangping, Z. Photovoltaic technology under carbon neutrality. Chem. Ind. Eng. Prog. 2022, 41, 1125–1131. [Google Scholar] [CrossRef]
  42. CSTA. Blue Book of Concentrating Solar Power Industry; CSTA: Beijing, China, 2022. [Google Scholar]
  43. Bo, Y. Development of China’s new energy automobile industry under the goal of carbon neutrality. Manag. Eng. 2022, 27, 5–10. [Google Scholar]
  44. Pauliuk, S.; Heeren, N. ODYM—An open software framework for studying dynamic material systems: Principles, implementation, and data structures. J. Ind. Ecol. 2019, 24, 446–458. [Google Scholar] [CrossRef] [Green Version]
  45. China Electricity Statistical Yearbook 2020. Available online: https://www.chinayearbooks.com/china-energy-statistical-yearbook-2020.html (accessed on 20 December 2021).
  46. Watari, T.; McLellan, B.; Ogata, S.; Tezuka, T. Analysis of Potential for Critical Metal Resource Constraints in the International Energy Agency’s Long-Term Low-Carbon Energy Scenarios. Minerals 2018, 8, 156. [Google Scholar] [CrossRef]
  47. Song, J.; Yan, W.; Cao, H.; Song, Q.; Ding, H.; Lv, Z.; Zhang, Y.; Sun, Z. Material flow analysis on critical raw materials of lithium-ion batteries in China. J. Cleaner Prod. 2019, 215, 570–581. [Google Scholar] [CrossRef]
  48. Liu, Q.; Sha, J.; Yan, J.; Zhang, G. Risk assessment and countermeasures of chromium resource supply in China. Resour. Sci. 2018, 40, 516–525. [Google Scholar] [CrossRef]
  49. U.S. Geological Survey. Mineral Commodity Summaries 2022; U.S. Geological Survey: Reston, VA, USA, 2022. [Google Scholar]
  50. Xiaojing, Y. Analysis of global investment of chromium resources in China. China Min. Mag. 2019, 28, 60. [Google Scholar]
  51. Yanran, D. Current situation and utilization trend of the global gallium resources. Conserv. Util. Minaral Resour. 2019, 39, 9–15. [Google Scholar]
  52. Frenzel, M.; Hirsch, T.; Gutzmer, J. Gallium, germanium, indium, and other trace and minor elements in sphalerite as a function of deposit type—A meta-analysis. Ore Geol. Rev. 2016, 76, 52–78. [Google Scholar] [CrossRef]
  53. Wen, H.; Zhu, C.; Du, S.; Fan, Y.; Luo, C. Gallium, germanium, thallium and cadmium resources in China. Chin. Sci. Bull. 2020, 65, 3688–3699. [Google Scholar] [CrossRef]
  54. Nassar, N.T.; Du, X.; Graedel, T.E. Criticality of the Rare Earth Elements. J. Ind. Ecol. 2015, 19, 1044–1054. [Google Scholar] [CrossRef]
  55. Mudd, G.M.; Jowitt, S.M.; Werner, T.T. The world’s by-product and critical metal resources part I: Uncertainties, current reporting practices, implications and grounds for optimism. Ore Geol. Rev. 2017, 86, 924–938. [Google Scholar] [CrossRef]
  56. Habib, K.; Wenzel, H. Exploring rare earths supply constraints for the emerging clean energy technologies and the role of recycling. J. Clean. Prod. 2014, 84, 348–359. [Google Scholar] [CrossRef]
  57. Xu, Y.; Li, J.; Tan, Q.; Peters, A.L.; Yang, C. Global status of recycling waste solar panels: A review. Waste Manag. 2018, 75, 450–458. [Google Scholar] [CrossRef] [PubMed]
  58. Nassar, N.T.; Wilburn, D.R.; Goonan, T.G. Byproduct metal requirements for U.S. wind and solar photovoltaic electricity generation up to the year 2040 under various Clean Power Plan scenarios. Appl. Energy 2016, 183, 1209–1226. [Google Scholar] [CrossRef]
  59. Chowdhury, M.S.; Rahman, K.S.; Chowdhury, T.; Nuthammachot, N.; Techato, K.; Akhtaruzzaman, M.; Tiong, S.K.; Sopian, K.; Amin, N. An overview of solar photovoltaic panels’ end-of-life material recycling. Energy Strategy Rev. 2020, 27, 100431. [Google Scholar] [CrossRef]
  60. Bilgili, F.; Baglitas, H.H. The dynamic analysis of renewable energy’s contribution to the dimensions of sustainable development and energy security. Environ. Sci. Pollut. Res. Int. 2022, 29, 75730–75743. [Google Scholar] [CrossRef] [PubMed]
  61. Alonso, E.; Sherman, A.M.; Wallington, T.J.; Everson, M.P.; Field, F.R.; Roth, R.; Kirchain, R.E. Evaluating rare earth element availability: A case with revolutionary demand from clean technologies. Environ. Sci. Technol. 2012, 46, 3406–3414. [Google Scholar] [CrossRef]
  62. Harvey, L.D.D. Resource implications of alternative strategies for achieving zero greenhouse gas emissions from light-duty vehicles by 2060. Appl. Energy 2018, 212, 663–679. [Google Scholar] [CrossRef]
  63. Månberger, A.; Johansson, B. The geopolitics of metals and metalloids used for the renewable energy transition. Energy Strategy Rev. 2019, 26, 100394. [Google Scholar] [CrossRef]
  64. Watari, T.; McLellan, B.C.; Giurco, D.; Dominish, E.; Yamasue, E.; Nansai, K. Total material requirement for the global energy transition to 2050: A focus on transport and electricity. Resour. Conserv. Recycl. 2019, 148, 91–103. [Google Scholar] [CrossRef]
  65. McLellan, B.; Corder, G.; Ali, S. Sustainability of Rare Earths—An Overview of the State of Knowledge. Minerals 2013, 3, 304–317. [Google Scholar] [CrossRef]
  66. Yan Peng, G.H.; Zhaoming, Z.; Wei, J.; Zhiyun, O.; Guizhou, W. Eco-environmental dynamic monitoring and assessment of rare earth mining area in Southern Ganzhou Using Remote Sensing. Acta Ecol. Sin. 2016, 36, 1676–1685. [Google Scholar]
  67. Castleden, W.M.; Shearman, D.; Crisp, G.; Finch, P. The mining and burning of coal: Effects on health and the environment. Med. J. Aust. 2011, 195, 333–335. [Google Scholar] [CrossRef] [PubMed]
  68. Lee, J.; Bazilian, M.; Sovacool, B.; Hund, K.; Jowitt, S.M.; Nguyen, T.P.; Månberger, A.; Kah, M.; Greene, S.; Galeazzi, C.; et al. Reviewing the material and metal security of low-carbon energy transitions. Renew. Sustain. Energy Rev. 2020, 124, 109789. [Google Scholar] [CrossRef]
  69. Liang, Y.; Kleijn, R.; Tukker, A.; van der Voet, E. Material requirements for low-carbon energy technologies: A quantitative review. Renew. Sustain. Energy Rev. 2022, 161, 112334. [Google Scholar] [CrossRef]
Figure 1. Inflows, outflows, and stocks of infrastructure (2021–2060). Note: green represents the new installed capacity (inflow), orange represents the eliminated capacity (outflow), and the curve represents the stock.
Sustainability 15 00585 g001
Figure 2. Cumulative mineral demand for different energy technologies (2021–2060). Note: Different colors represent the cumulative year-to-year mineral demand of different energy technologies.
Sustainability 15 00585 g002
Figure 3. Sensitivity analysis of the lifetime on mineral demand.
Sustainability 15 00585 g003
Figure 4. Sensitivity analysis of mineral intensity on mineral demand.
Sustainability 15 00585 g004
Figure 5. Depletion potential and ratio of demand increase for 18 minerals in 2030 and 2060. Note: Yellow bars show the depletion potential (top) and the ratio of demand increase (bottom) for 18 minerals in 2030. Green bars show the depletion potential (top) and the ratio of increased demand (bottom) for 18 minerals in 2060.
Sustainability 15 00585 g005
Table 1. Summary of related studies on mineral demand in the energy transition.
LiteratureRegionTimeTechnologyMineral
[26]Global2060PV, CSP, WP, EVsCo, Cu, Dy, Ga, In, Li, Nd, Ni, Pt, Se, Ag, Te
[21]Global2060PV, WP, CSP, hydropower, nuclear power, energy storage, T&DFe, Al, Cu, Nd, Co, Pb
[27]Global2050WP, PV, CSP, EVCd, Cr, Co, Cu, Ga, In, Li, Mn, Ni, Ag, Te, Sn, Zn
[20]Global2050PV, WP, EVs, fuel cells, batteries, electrolysis, efficient lightingAg, Nd, Pr, Dy, Tb, Yt, La, Ce, Eu, Co, Pt, Ru, In, Te
[28]Global2100EVs, WPLi, Co, REE (Pr, Dy, Nd)
[25]Global2050CSPFe, Al, Ti, Cu, Mn, Cr, Zn, Ni, V, Mo, Nb, Ag
[29]Global2050PV (thin film)In, Ge, Ga, Se, Te, Cd
[19]China2050WP, PVNd, Dy, Cd, Te, In, Ga, Se, Ge
[30]China2050All generation technologiesAg, Te, In, Ge, Se, Ga, Cd, Nd, Dy, Pr, Tb, Pb, Cu, Ni, Al, Fe, Cr,
[31]China2050PV, WP, CSP, T&D hydropower, nuclear power, energy storageAl, Cu, Fe
[32]China2050All generation technologiesAl, Cu, Fe, Cr, Ni
[7]China2050EVFe, B, Ni, Ti, Al, Co, Mn, Li, Cu, REE (La, Ce, Pr, Nd, Sm, Dy)
[22]Germany2050PV, WP, T&D, hydropower, geothermal, biomass, energy storage,In, Ga, Se, Cd, Te, Nd, Dy, Y, Ag, Li, V
[23]France2050PV, WP, hydropower, nuclear powerAl, Cu, Fe
[24]Denmark2050WPNd, Dy, steel, cast iron, nonferrous metals
Table 2. Energy technologies and related minerals involved in this study.
MineralCSPPVWPBVsT&D
Ag
Al
Cd
Co
Cr
Cu
Dy
Fe
Ga
Ge
In
Li
Mn
Mo
Nd
Ni
Se
Te
Table 3. Market shares and lifetime assumptions of sub-technologies.
PVCSPWPBVsT&D
c-SiCdTeCIGSPTCRSOnshoreOffshoreBEVsPHEVsWireTransformer
Market share %851055050//8020//
Lifetime/year303030302525154030
Table 4. Risk ratings and definition.
RatingDefinition
Very HighDep2030 ≥ 1
HighDep2060 ≥ 1
MediumDep2060 < 1, and RDI2060 ≥ 40
LowDep2060 < 1, and RDI2060 < 40
Table 5. Summary of stocks in China in the “energy and power deep decarbonization scenario” (2020–2060).
Stock in China (2020)Stock in China (2060)Stock Increase
PV (GW)2532010794%
CSP (GW)0.5423042,590%
WP (GW)2821920681%
EVs (million)4.923507114%
Power Demand (TWh)75,204158,465210%
Table 6. Assessment results of mineral risk.
RatingMineral
Very HighCo, In
HighCr, Cu, Li, Ni, Te
MediumDy, Nd
LowAg, Al, Cd, Ga, Ge, Fe, Mn, Mo, Se
On the left are the four risk levels, and on the right are the minerals in each risk level.
Table 7. Basic data of the mineral risk assessment.
AgAlCdCrCoCuDyGaGe
Cumulative demand/Kt40167,4999.113211465666,8211170.850.037
Reserves in China/Kt [49]41576,00092 [19]12,200 [50]8026,000792 [19]190 [51]3.53 [52]
Global reserves/Kt [49]53055,000,000500 [53]570,0007600880,0001100 [19]230 [51]8.6 [52]
China’s annual production kt [49]3.3837,10010200 [50]2.217201.142 [19]0.3170.095
Global annual production Kt [49]2465,1002437,00014220,6001.328 [54]0.3270.14
External dependency/%52.144.440.799.397.767.1---
Coproduction/host metal [54]Zn-ZnPtNi, Cu-FeAl, ZnZn
InFeLiMnMoNdNiSeTe
Cumulative demand/Kt136707,39145318568161764319,9162.240
Reserves in China/Kt [49]1.3 [19]6,900,000150054,00083006784 [19]2800266.6
Global reserves/Kt [49]12 [19]85,000,00022,0001,500,00016,00012,800 [19]95,00010031
China’s annual production kt [49]0.541,948,00013.3134012015.215 [19]1201.20.33
Global annual production Kt [49]0.963,100,0008318,90029817.937 [54]25103.120.56
External dependency/%-74.486.874.515.5-90.863.3-
Coproduction/host metal [54]Zn--FeCuFe-CuCu
Disclaimer/Publisher’s Note: The statements, opinions and data contained in all publications are solely those of the individual author(s) and contributor(s) and not of MDPI and/or the editor(s). MDPI and/or the editor(s) disclaim responsibility for any injury to people or property resulting from any ideas, methods, instructions or products referred to in the content.