Article

Experimental Characterisation of Different Ecological Substrates for Use in Green Roof Systems

1
Itecons, 3030-289 Coimbra, Portugal
2
CERIS, University of Coimbra, 3030-790 Coimbra, Portugal
3
Centre Metrics, Universidade do Minho, 4710-057 Braga, Portugal
4
CVR—Centre for Waste Valorisation, 4800-058 Guimarães, Portugal
5
W2V, Lda., Rua das Alminhas, 900, Calvos, 4810-608 Guimarães, Portugal
6
Neoturf, Rua das Amoreiras, 155, 4460-227 Senhora da Hora, Portugal
7
Department of Civil Engineering, CERIS, University of Coimbra, 3030-790 Coimbra, Portugal
*
Author to whom correspondence should be addressed.
Sustainability 2023, 15(1), 575; https://doi.org/10.3390/su15010575
Submission received: 9 December 2022 / Revised: 23 December 2022 / Accepted: 26 December 2022 / Published: 29 December 2022

Abstract

:
Green roofs are made up of several components, including those belonging to the waterproofing and drainage layers, substrate, and vegetation. Of these, the substrate is undoubtedly one of the most important layers of a green roof, contributing not only to the healthy growth of vegetation but also to the water retention capacity and thermal behaviour of the whole solution. Although green roofs are widely recognized as sustainable solutions, it is possible to further improve their environmental performance by developing more ecological substrates that contain industrial by-products. Bearing this objective in mind, sixteen newly developed substrates were characterized in terms of thermal conductivity, specific heat, emissivity, water vapour transmission, hygroscopic sorption, and water retention/drainage capacity. These properties are extremely relevant when solving heat and mass transfer problems as well as for water management prediction. Two reference substrates were also studied for comparison purposes. The results showed that the new ecological substrates have properties that make them comparable to conventional substrates already available on the market. Additionally, the results showed that temperature, moisture content, and density play an important role in the behaviour of substrates of this kind and have a significant influence on many of the studied properties.

1. Introduction

Rapid urban expansion is at the origin of more frequent flood events, heat accumulation phenomena, and poorer water and air quality, among other city-related problems. Recent figures indicate that more than half the world’s population live in cities, and this indicator is expected to reach nearly 75% by 2050 [1,2]. Furthermore, the building and construction sector is responsible for 39% of all carbon emissions in the world, 28% of which relates to the energy consumed to meet heating and cooling needs [3]. The implementation of nature-based solutions to mitigate the negative effects of urban growth has increased, and green roofs are currently targeted as a clever solution to face many environmental problems in cities. One of the great benefits of green roofs is their ability to delay the runoff peak, thus preventing the overloading of public drainage systems and consequently helping to mitigate the urban flood risk [4,5,6,7]. Built-up areas in cities, such as streets, pavements, façades, and roofs, absorb solar energy throughout the day and release it at night in the form of heat, leading to an increase in air temperature in cities. This released heat remains in the urban atmosphere forming a phenomenon known as an urban heat island effect (UHI) [8,9,10]. Green roofs can also reduce noise pollution [11,12,13], increase biodiversity [14], and reduce building energy consumption [15], among other benefits.
Although several benefits have been attributed to green roofs, it is possible to further improve their performance by developing substrates containing recycled waste materials. In recent decades, the production of organic and inorganic waste from both human activity and industry has increased. Considering the physical and chemical properties of some recycled waste materials, they can be good candidates for replacing conventional raw materials commonly used in lightweight substrates for green roofs, and thus contribute towards the circular nature and resilience of the built environment. Adding value to these types of waste could, in fact, leverage the true concept of a circular economy associated with their management and would still allow the fulfilment of community goals regarding the recycling, reuse, and recovery of waste.
The substrate is also important for water drainage and retention capacity [16] and provides additional thermal inertia to the roof [17,18]. Previous studies have shown that the thermal conductivity of substrates varies between 0.10 and 0.25 W/(m·°C) and 0.30 and 0.60 W/(m·°C) for dried and saturated states, respectively [19,20,21,22,23]. Although only a few experimental studies explore the specific heat of substrates, this is an important parameter to evaluate the dynamic thermal behaviour of green roofs. Coma et al. [19] and Kazemi et al. [23,24] studied the specific heat of substrates and reported values ranging between 710 and 880 (J/kg·°C). Pianella et al. [22] also studied this property in substrates, showing specific heat values ranging from around 1000 to 2000 (J/kg·°C) in dried and saturated states, respectively. The ability to delay the runoff peak is well represented in the literature. The average retention value for substrates composed of materials like mineral grit, washed sand, peat, gravel, lime, and organic compounds ranges from 47% to 55% [25]. Organic waste components can improve the physical properties of substrates. Generally, greater amounts of organic material can make substrates lighter and increase their water-holding capacity, which will improve water availability for vegetation by 15–20% [26,27]. Although substrates are important for the hydrological behaviour of green roofs, they have a dynamic behaviour since the water content in this material is constantly changing. In dry conditions, substrates can drain up to 4% of a rain event simulation. However, after a rain event, substrates can drain up to 73% of the water because of the high water content in the substrate [28].
According to the literature, the most important components of the green roof with regard to thermal performance are the vegetation and substrate. As mentioned above, the thermal inertia provided by the substrate plays an important role under dynamic conditions. Vegetation helps to regulate heat transfer through shading and evapotranspiration effects. Considering the complexity of the various phenomena that occur in a green roof, it is sometimes difficult to ascertain what each variable provides to the heat flow that occurs in the system. Therefore, numerical models based on experimentally obtained parameters have been used to predict the behaviour of such systems when subjected to different environmental conditions [20].
Most studies found in the literature that aim to characterise green roofs systems and their components take the German FLL Green Roofs Guidelines (Guidelines for the Planning, Construction, and Maintenance of Green Roofs) as a reference [29]. Recently, a European Assessment Document has been proposed. However, the scope of the document only considers the green roof as a kit, and only considers the drainage layer as a loose-fill mineral material [30]. In spite of there being a lack of standards focused on the components of green roofs, characterising these components using the best of our knowledge is crucial to a better understanding of the behaviour of green roofs. In this work, the tests carried out as part of this experimental characterisation were based on international standards whenever possible.
As mentioned before, these new ecological substrates are expected to be used in green roof solutions. Thus, the scope of this work includes an experimental campaign that was carried out to learn about their performance in terms of hygrothermics, water retention/drainage capacity, and subsequent optimisation. The next part of this paper describes the samples and the test methods. Section 3 presents the experimental results. For thermal conductivity, specific heat, and emissivity, the influence of moisture content on the behaviour of substrates was evaluated. For the drainage and water retention, the test followed the methodology described in the FLL Guidelines. Finally, Section 4 presents the main conclusions. All tests were carried out under controlled laboratory conditions at Itecons—Institute for Research and Technological Development for Construction Sciences, Energy, Environment, and Sustainability (Coimbra, Portugal).

2. Materials and Methods

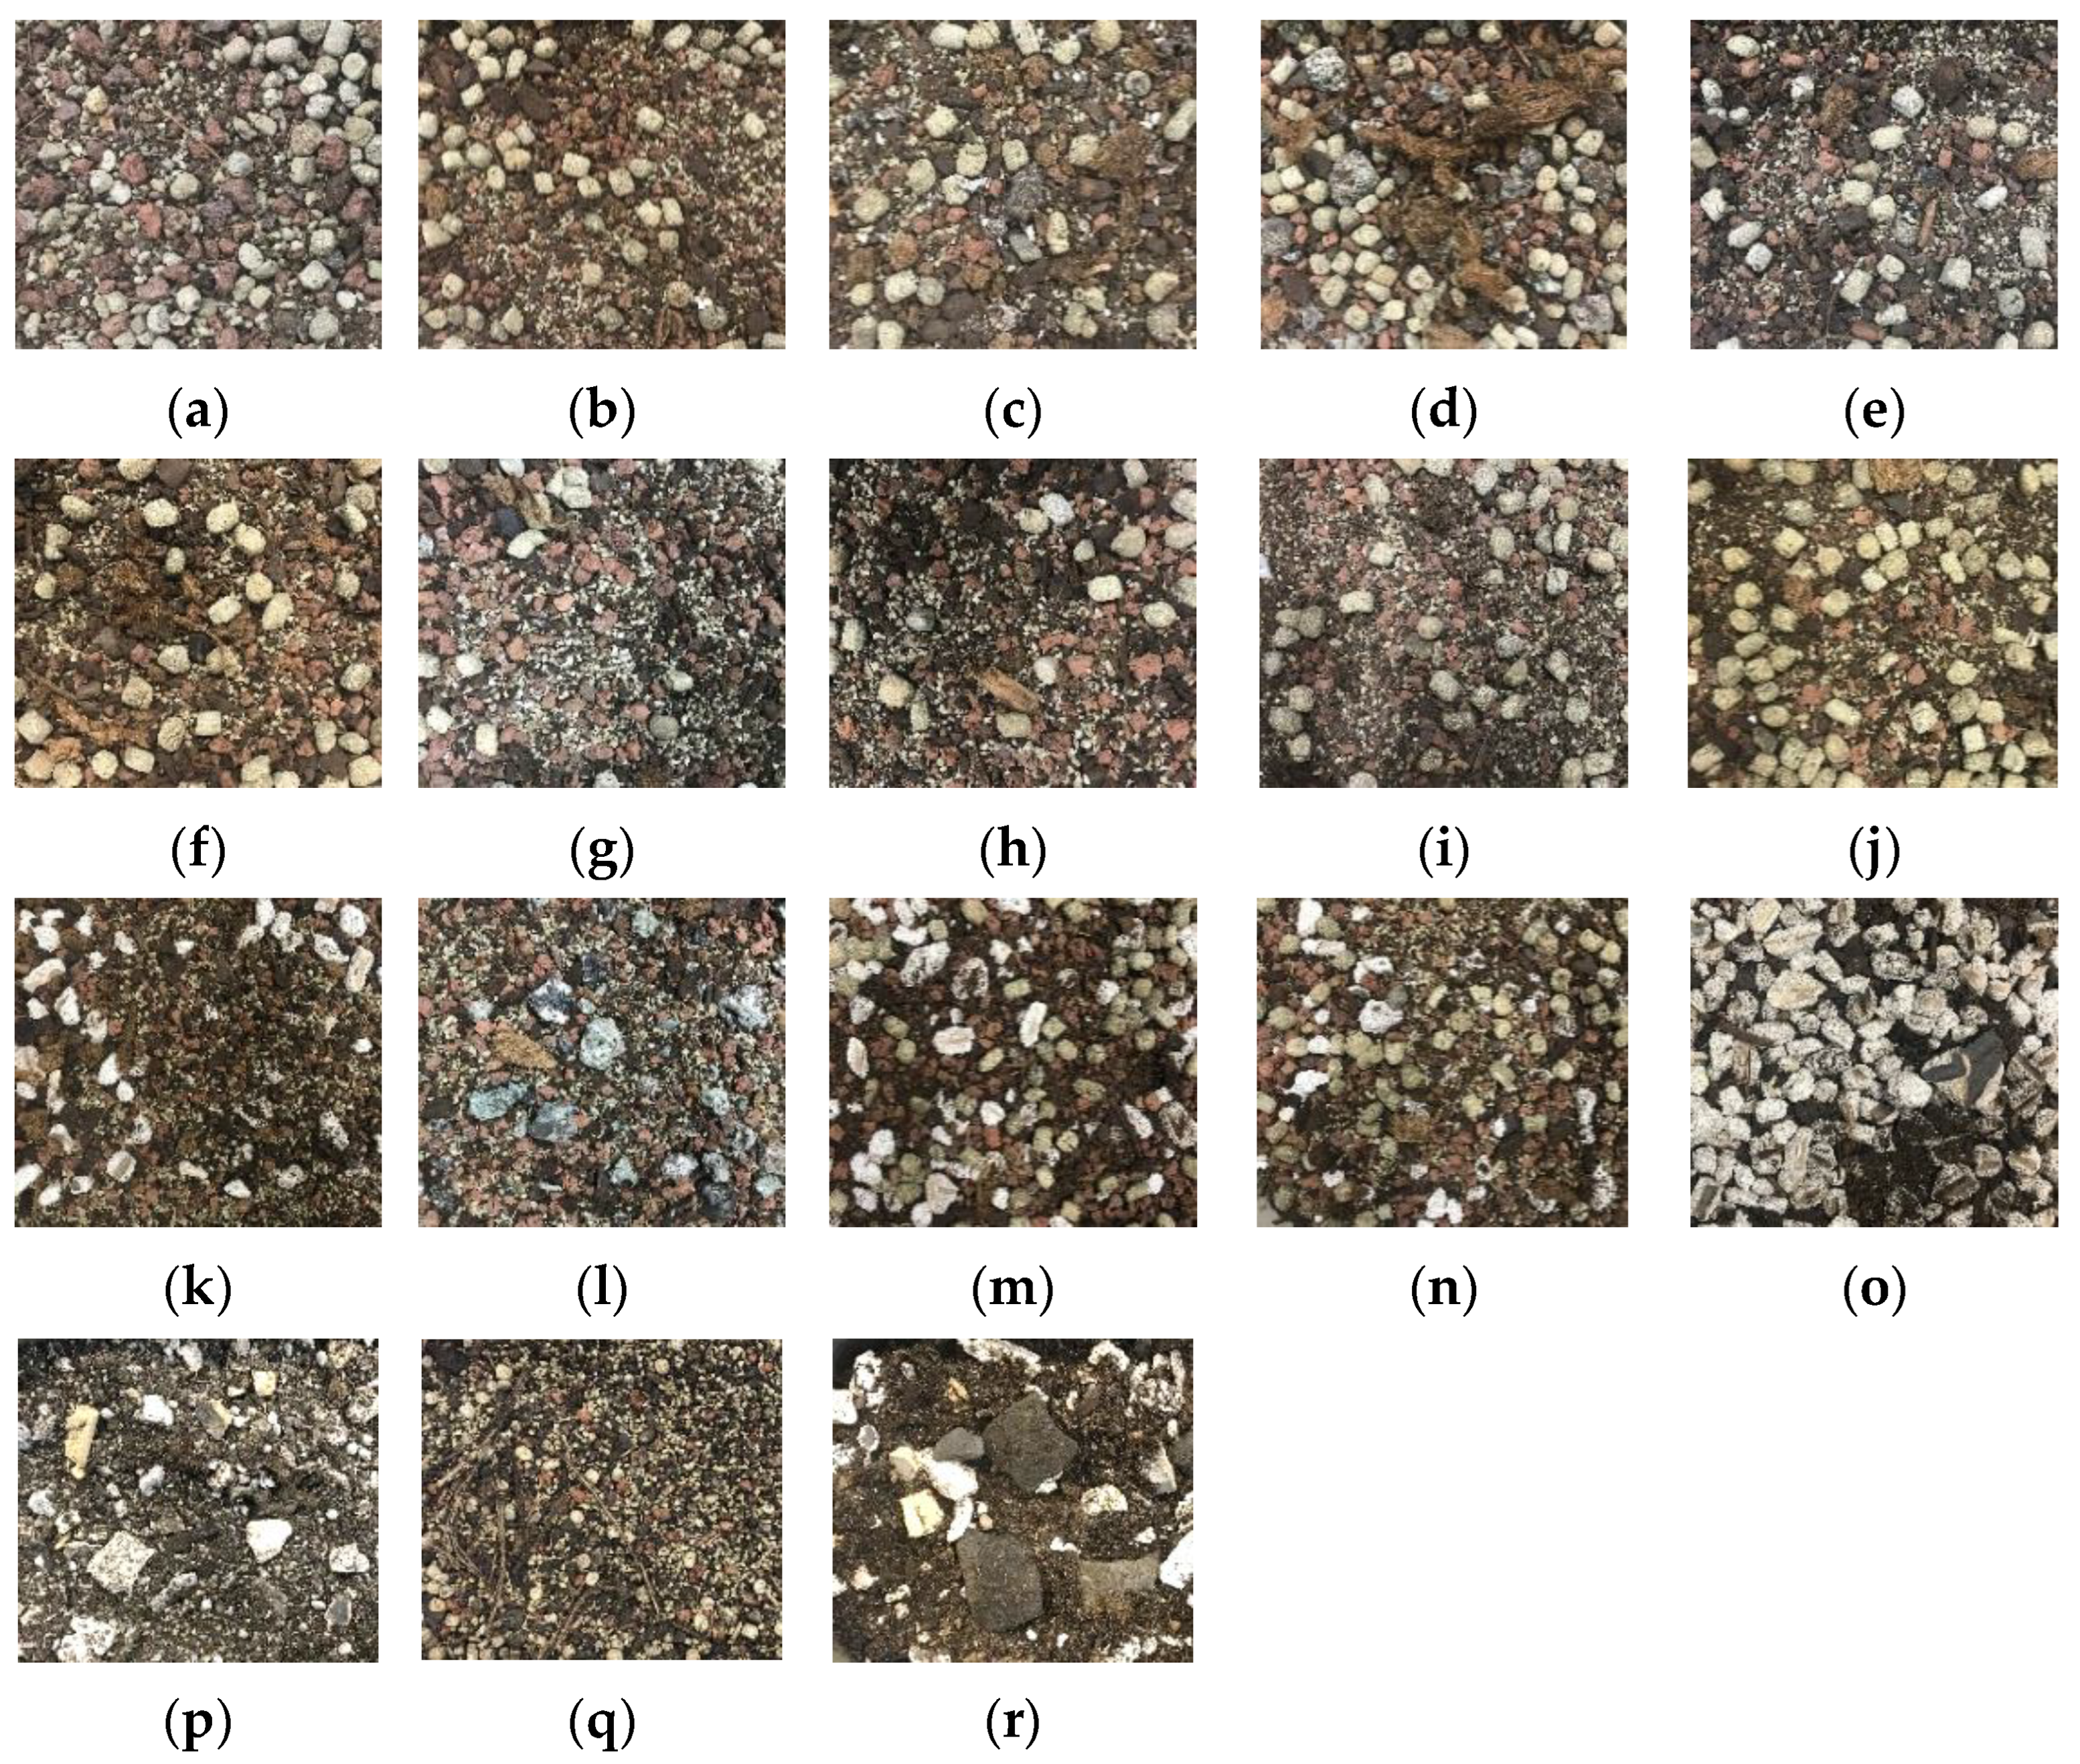
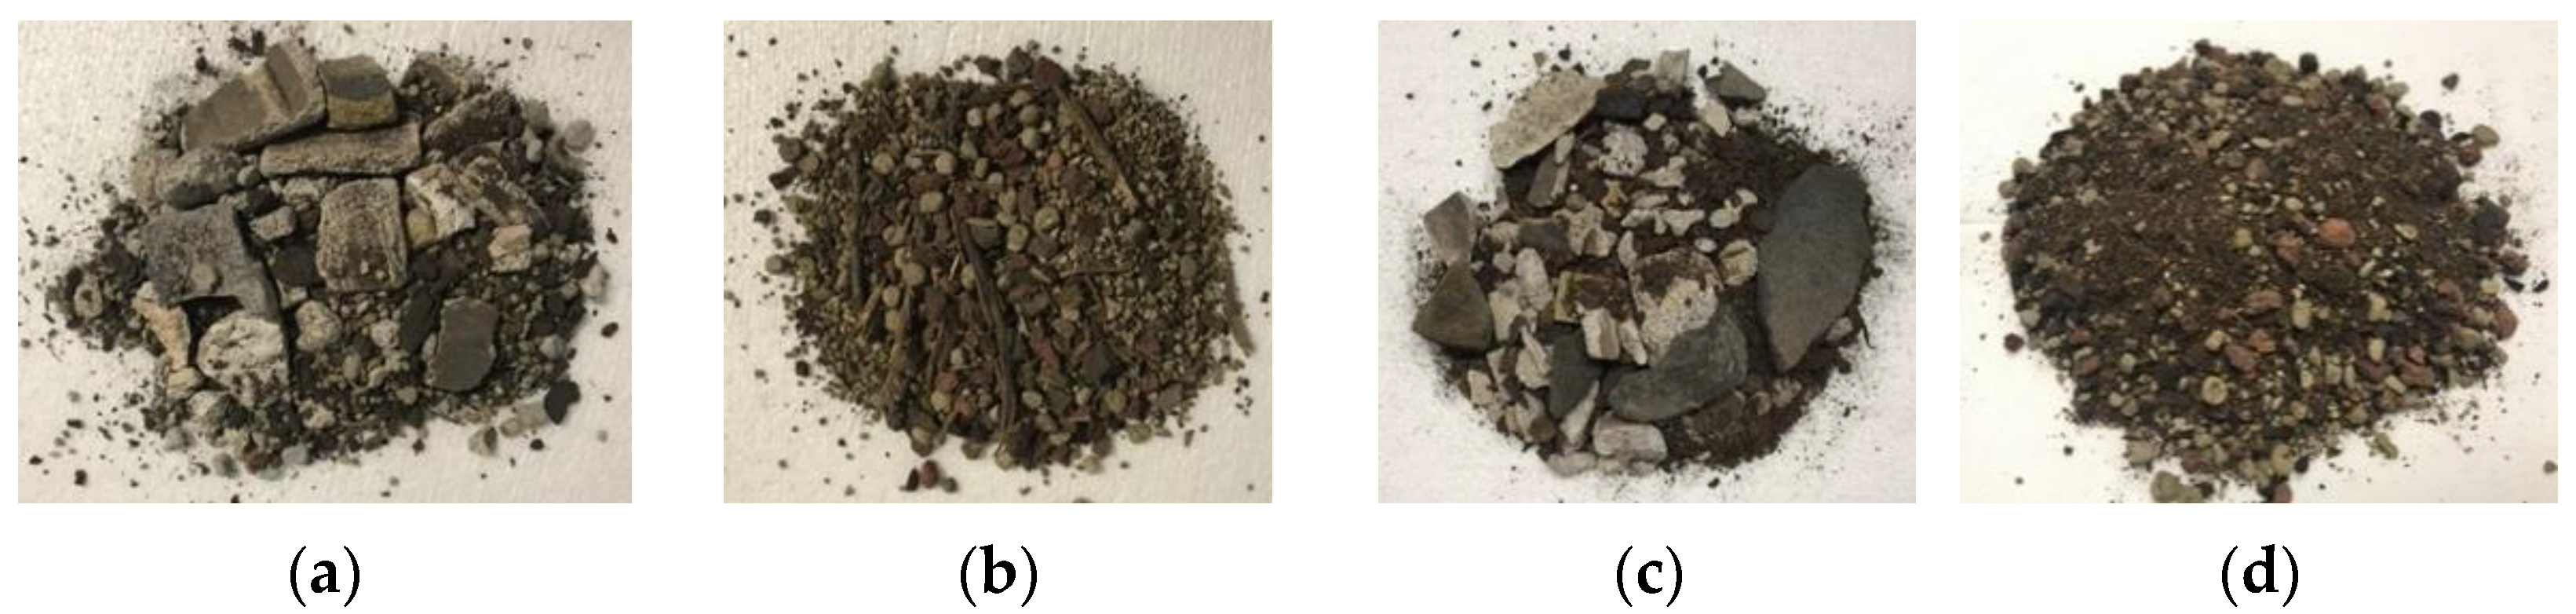
2.1. Substrate Samples

The substrates under study were developed based on recycled organic and inorganic residues from different industrial sectors. The organic fraction was obtained by composting urban solid waste and other organic materials, while the inorganic fraction was produced by transforming waste from several industries (e.g., ceramics, foundry, etc.) The organic composition of the substrates represents a fixed mass fraction of 50% of materials, such as composts derived from forest residues, blond peat, and coco peat. The inorganic fraction of the substrate is composed of residues or products formulated from industrial waste, namely slags from iron and steel melting furnaces, used refractories, and even products from the geopolymer family based on the alkaline activation of fly ashes from coal power plants. Eighteen substrates were developed for characterisation.
Figure 1 presents the substrates under study. The ON substrate is a lightweight commercial product specially designed for green roofs. The OL substrate was prepared in the laboratory, following the formulation of the 0N substrate. ON and OL substrates were considered as reference substrates. Table 1 presents the composition of the substates containing waste materials:

2.2. Test Methods

First, the eighteen substrates were experimentally analysed to determine the thermal conductivity for different temperatures and moisture contents, the surface emissivity of the substrates as a function of moisture content, and the water vapour transmission properties. Then, based on the results obtained, four substrates were selected, taking into account the physical properties and technical feasibility of production. Afterwards, the hygroscopic sorption properties as well as the water drainage and retention capacity were determined. Finally, the specific heat of a selected substrate and a reference substrate was determined. Details of all the methods are given in the following subsections.

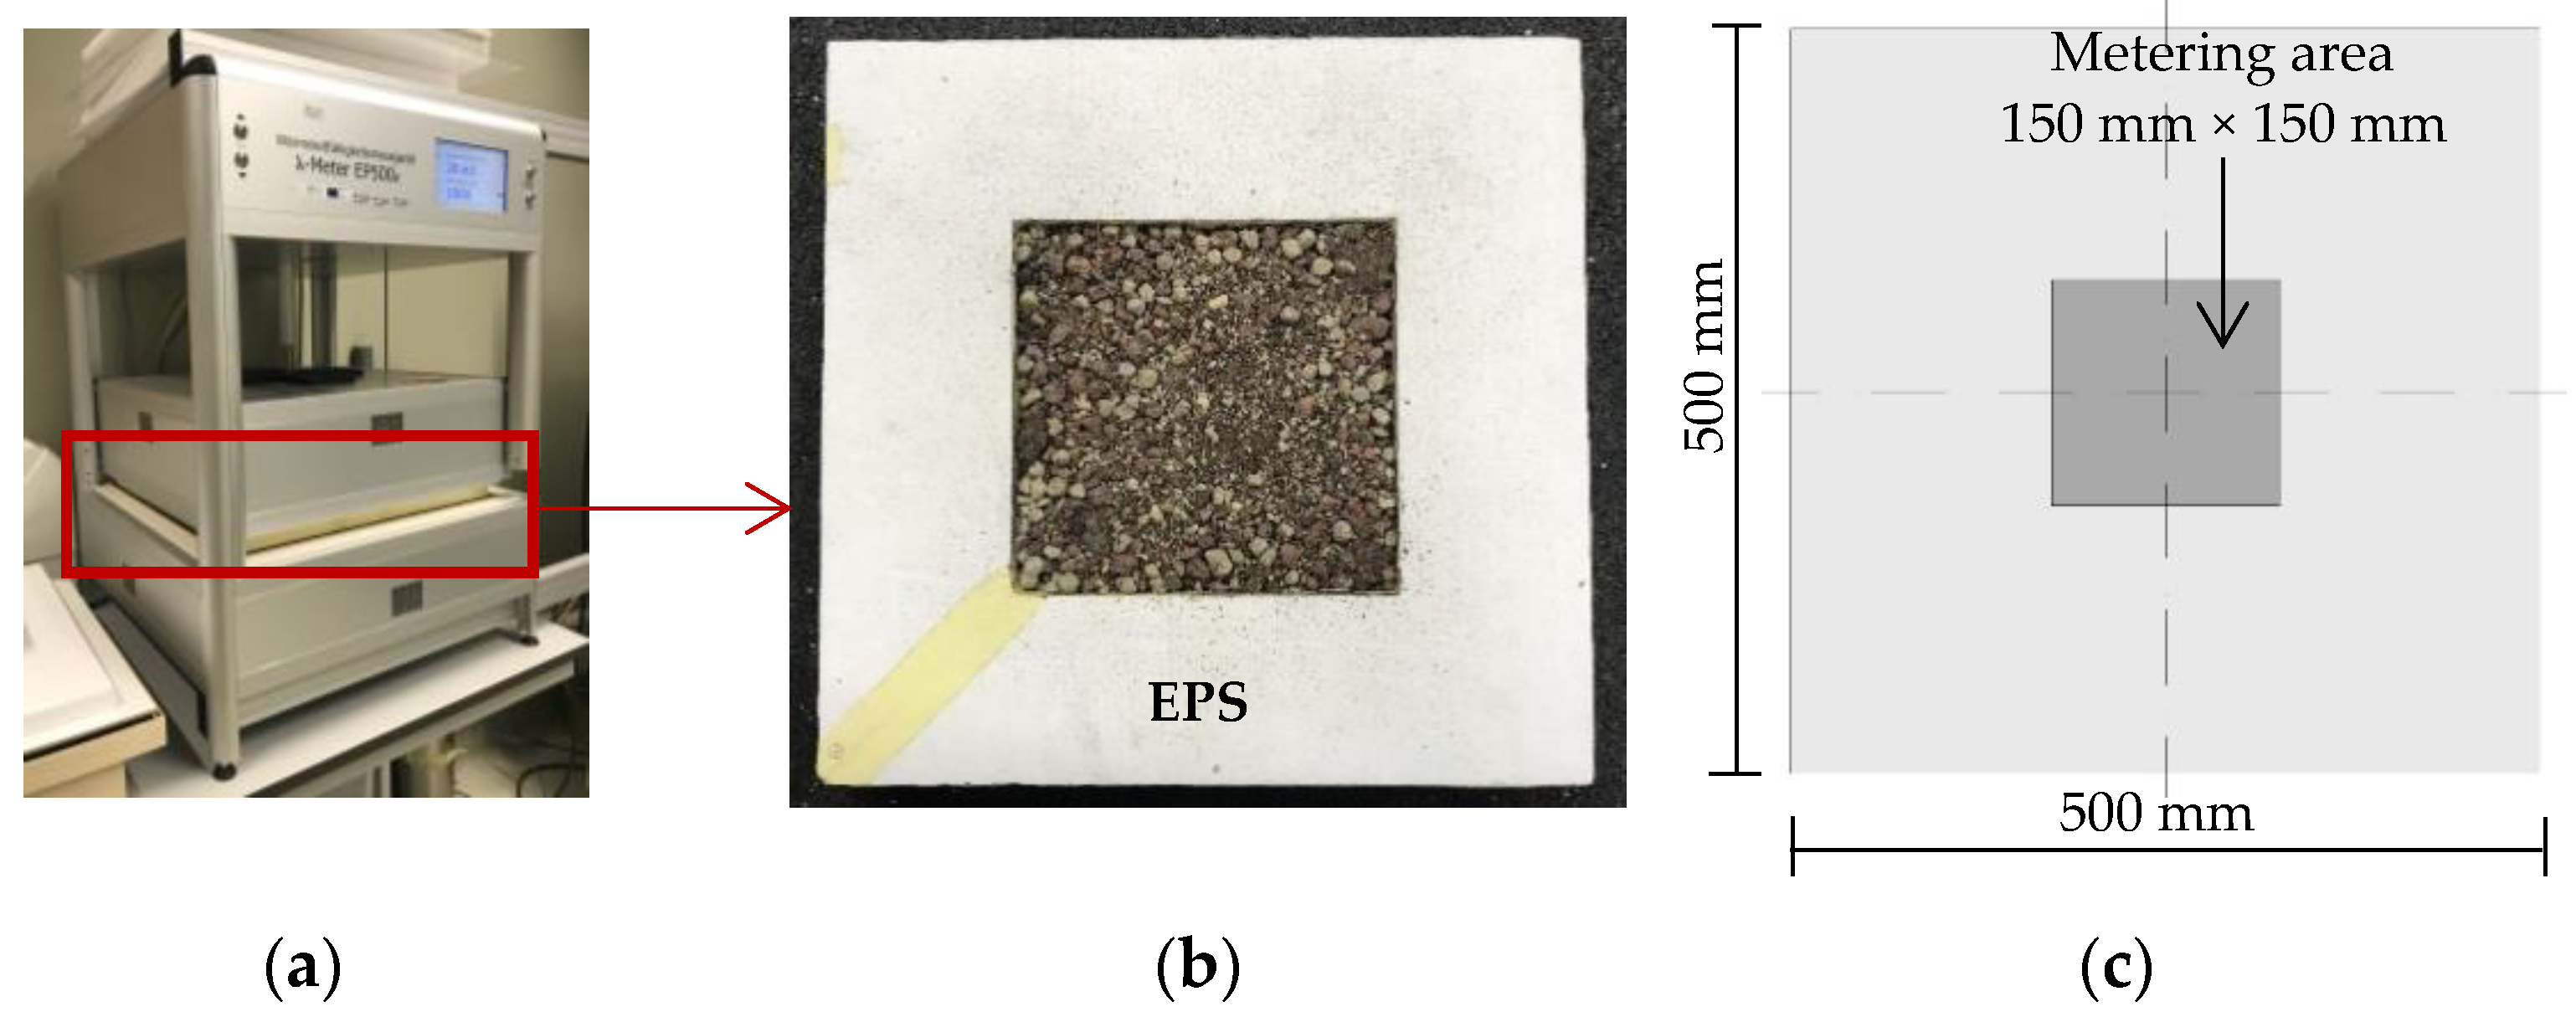
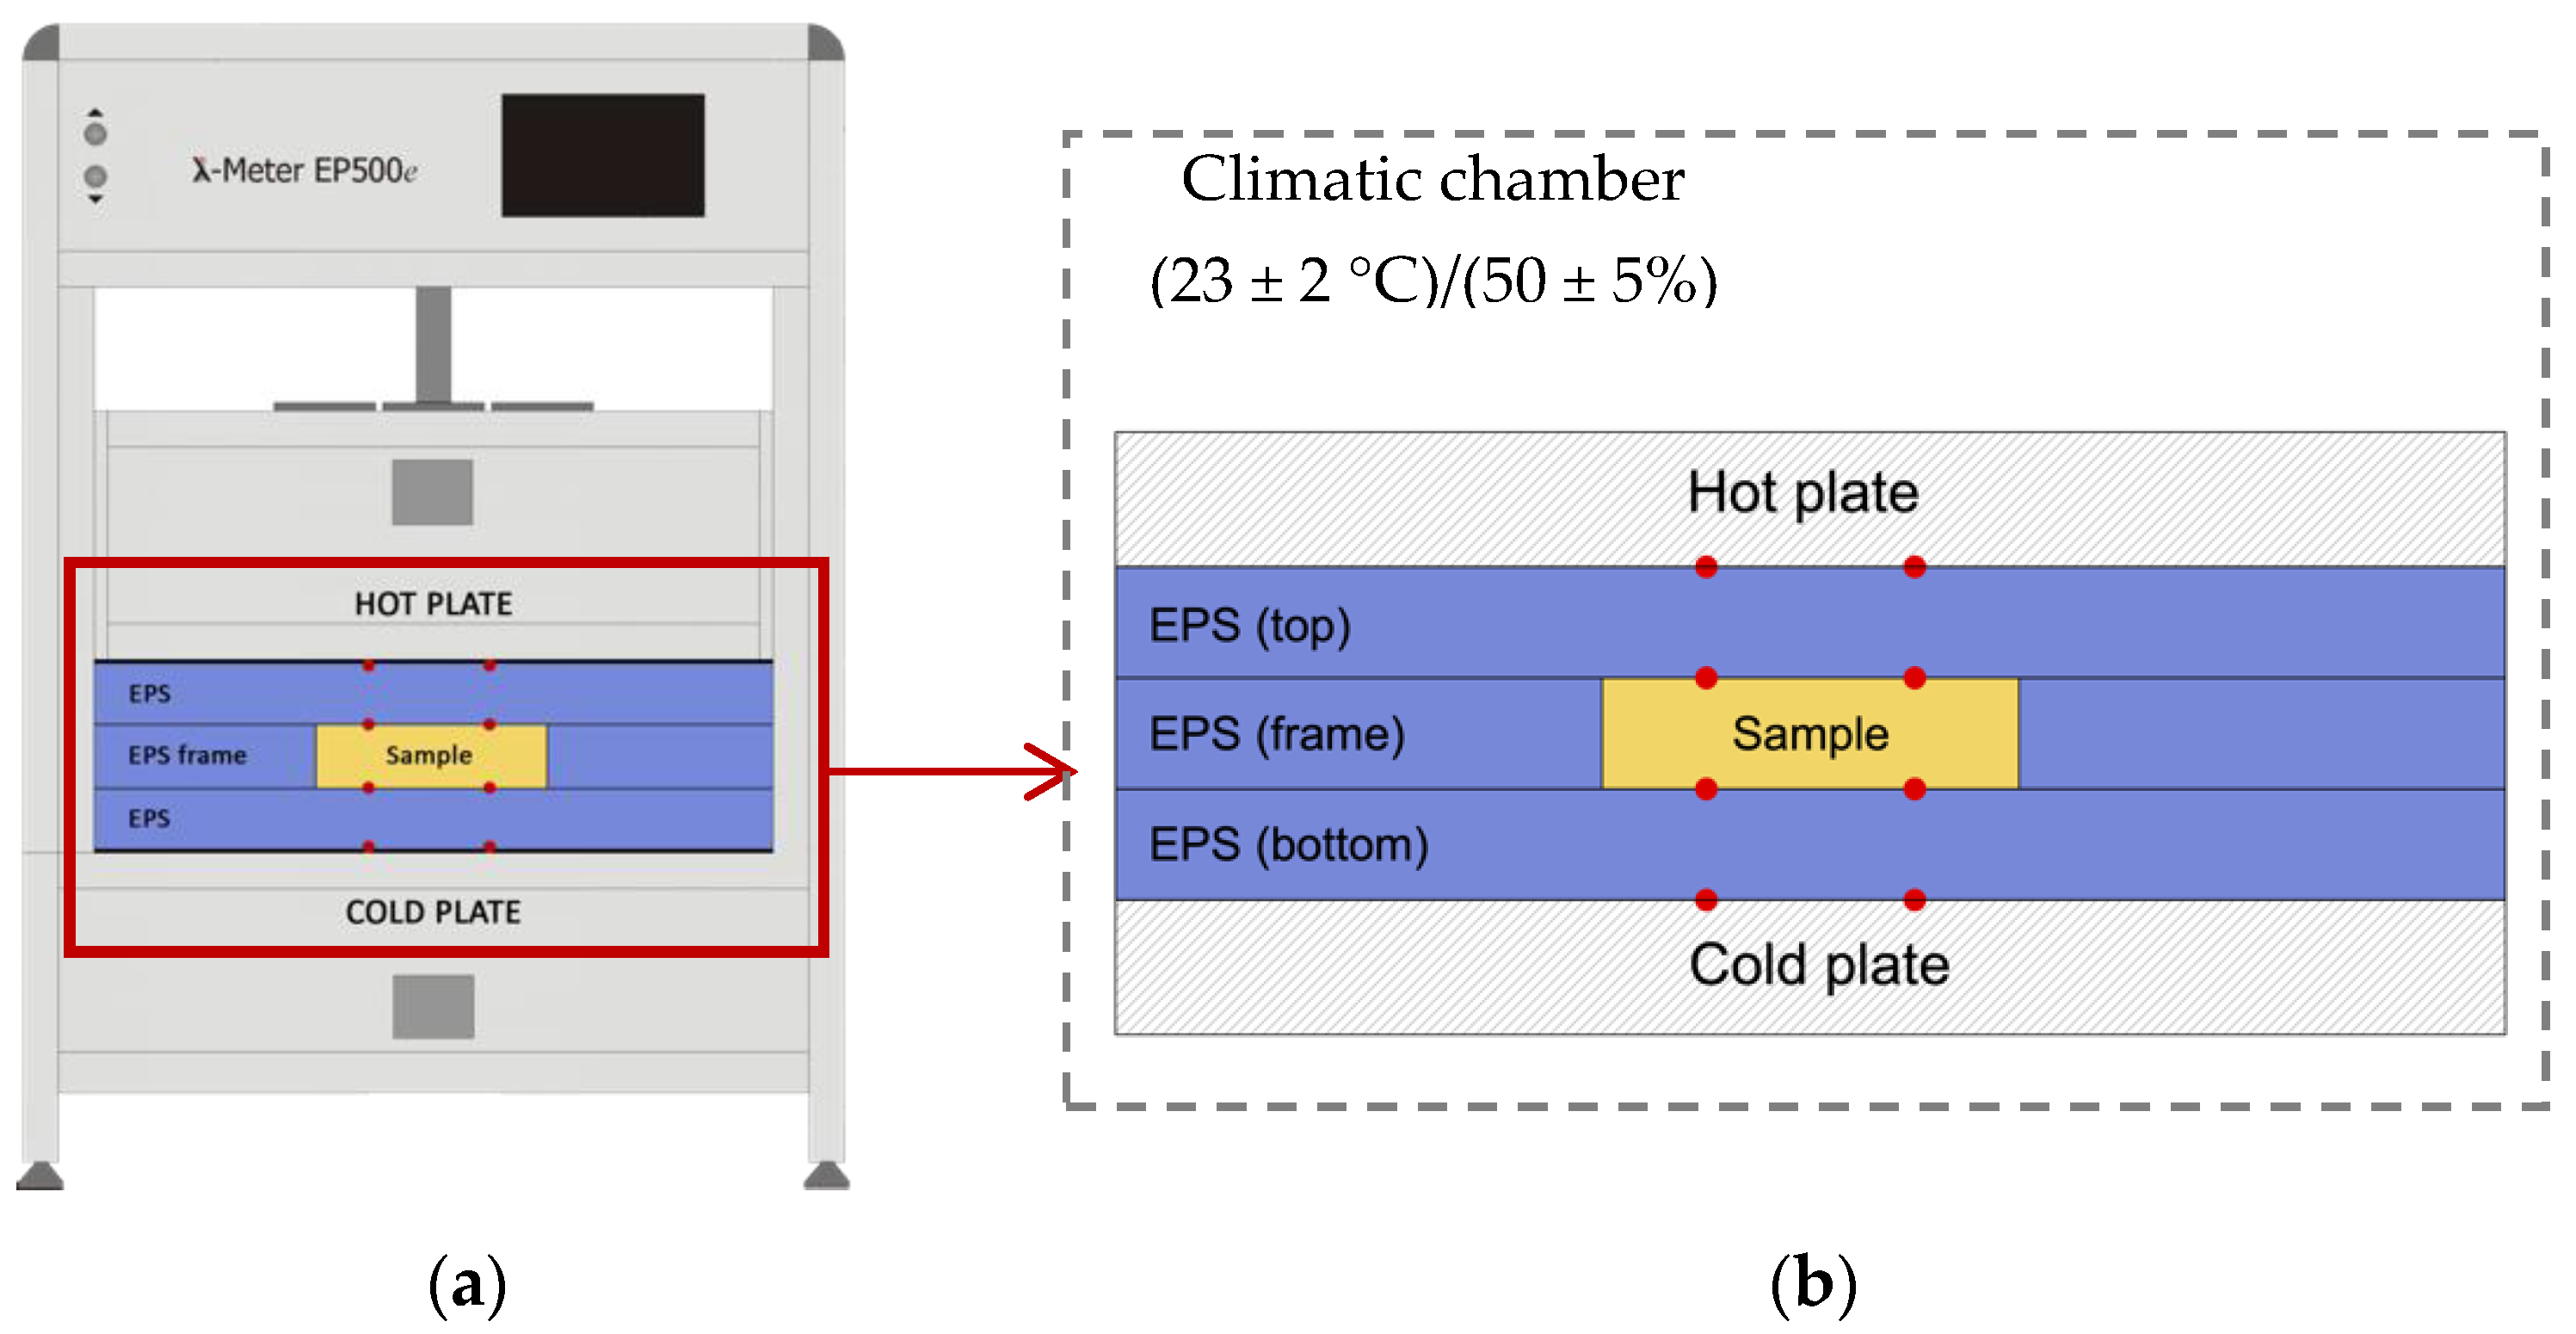
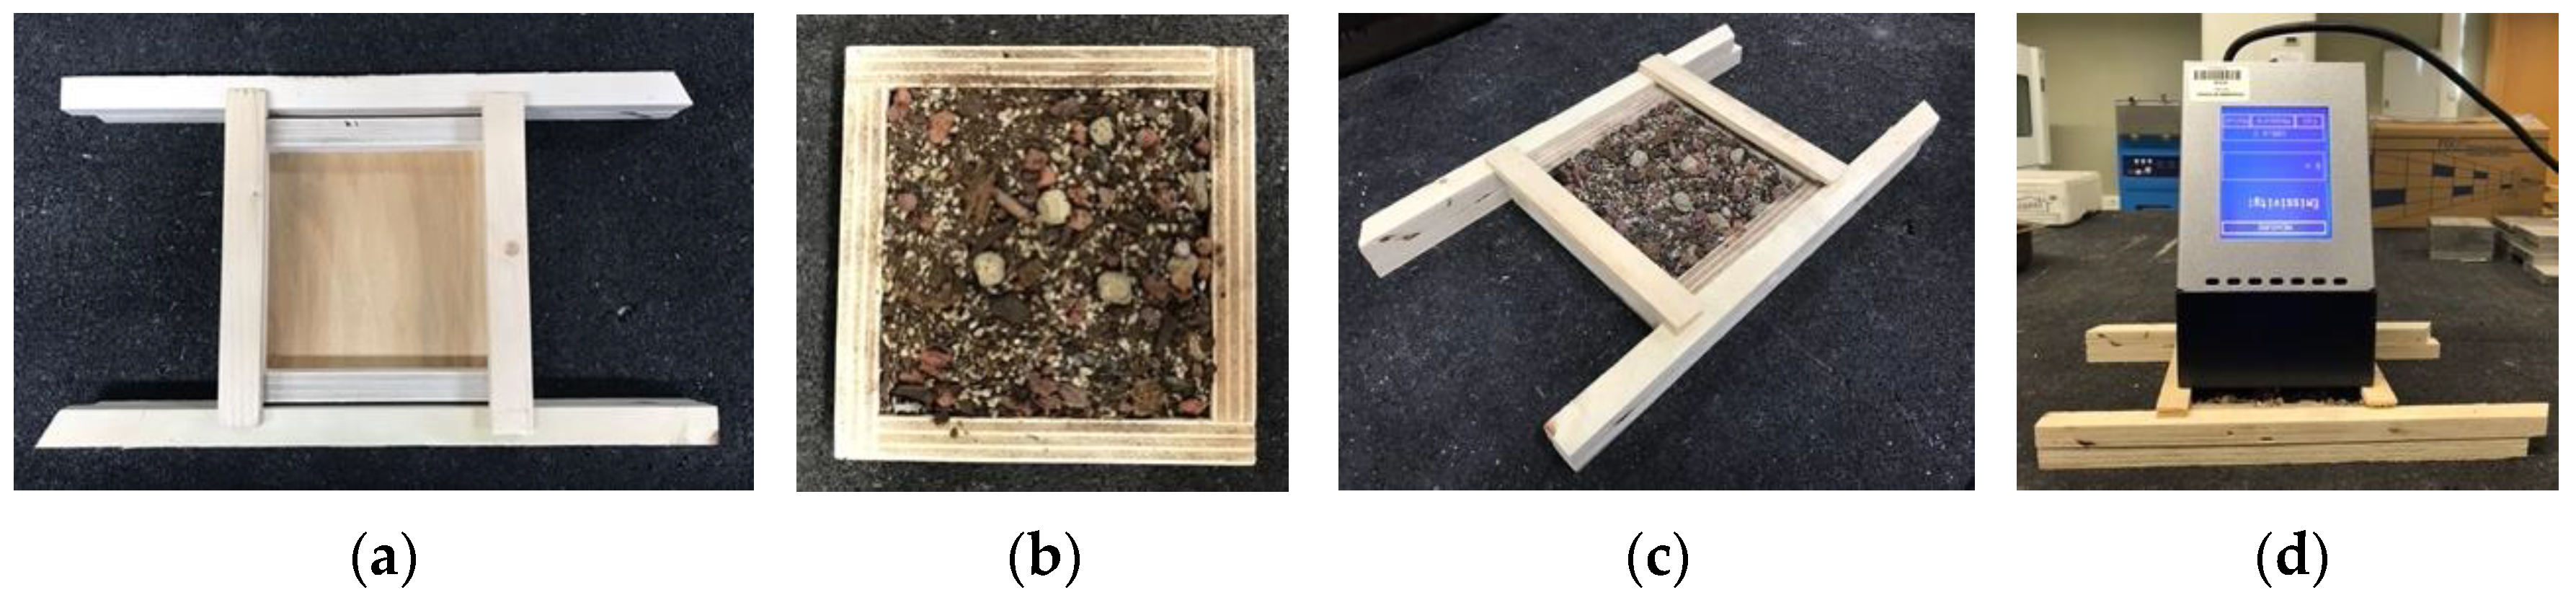
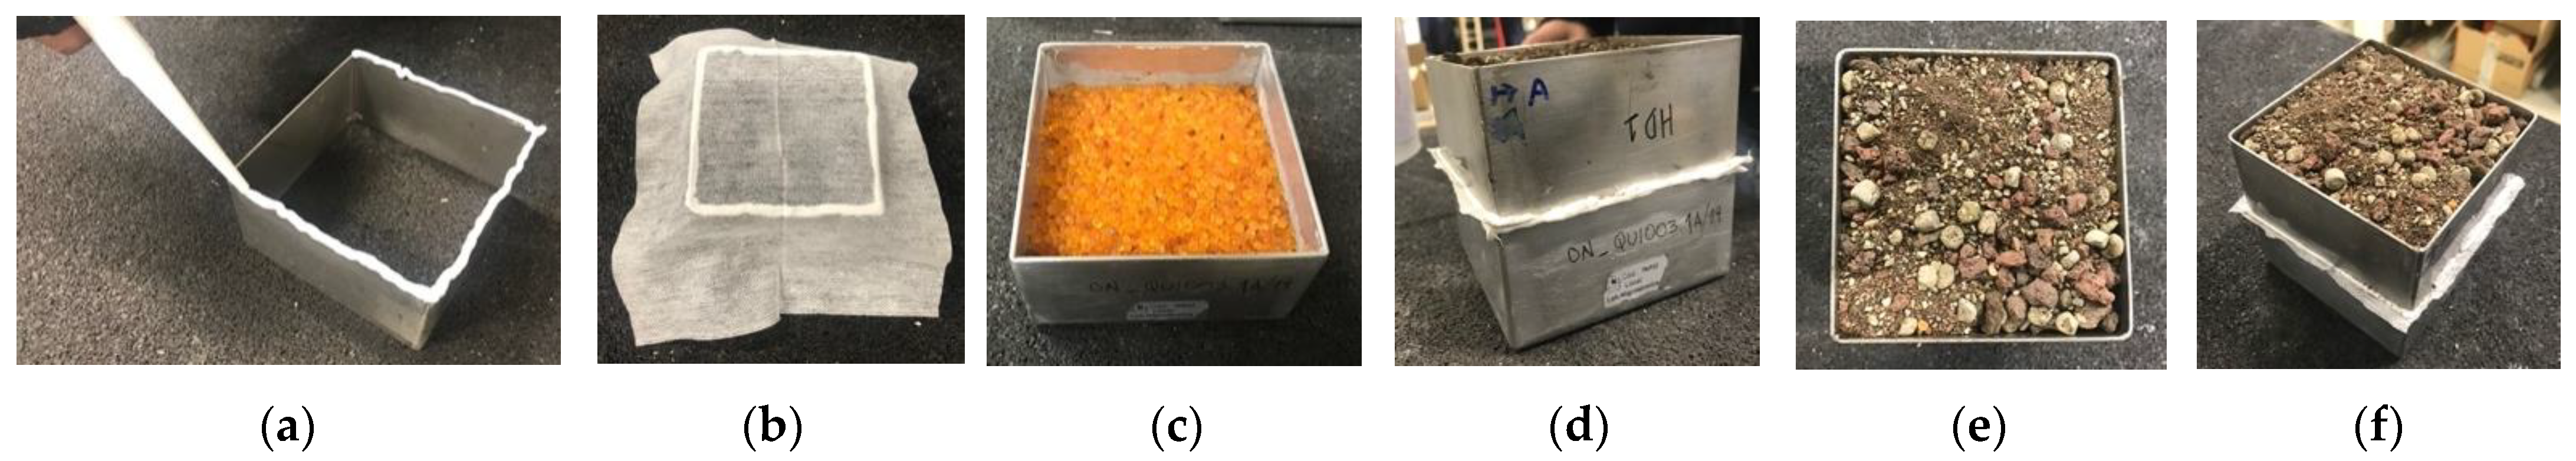
2.2.1. Thermal Conductivity

The thermal conductivity in steady-state conditions was measured using a Lambda-Messtechnik GmbH Dresden single-model λ-Meter EP-500 guarded hot plate (Figure 2) in accordance with the standard ISO 8302: 1991 [31] and following the test procedure described in EN 12664: 2001 [32]. The thermal conductivity was determined in the dry state, reference state, for high moisture content, and saturated state. For the dry state, the samples were conditioned by exposure to a ventilated oven at (60 ± 5 °C), until constant mass was reached. For the reference state, the samples were placed in a climatic chamber at (23 ± 2 °C) air temperature and (50 ± 5%) relative air humidity and subsequently for the high moisture content at (23 ± 2 °C) air temperature and (80 ± 5%) air relative humidity, until constant mass was reached. Constant mass is considered to have been established when the change in the mass of the samples over a 24 h period is random and less than the equivalent of 0.1 kg/m3. For the saturated state, the samples were immersed in water for approximately 2 h and the excess water was allowed to drain before the test.
The substrates were also tested at three average temperatures (10 °C, 25 °C, and 40 °C) for each moisture content, keeping a gradient temperature of 15 °C between plates. The apparent density was recorded for all tests.

2.2.2. Specific Heat Capacity

Specific heat capacity is defined by the amount of heat needed to increase the temperature of a unit mass of a material by 1 °C. Assessing the specific heat, Cp, of substrates is essential to parameterize numerical simulation models used to evaluate green roofs performance under dynamic boundary conditions [20]. Since the substrates are non-homogeneous materials, specific heat capacity was determined using an indirect method according to the methodology proposed by Simões et al. [33] and applied by Marques et al. [34] and Gonçalves et al. [35]. For this, a guarded hot plate λ-meter EP500 test tool (Figure 2) was used, combined with a number of thermocouples located at different heights between the hot and cold plates, as described in Figure 3. The temperature values were recorded every minute using a data logger.
Due to the complexity of the method, this test was only performed for two selected substrates, the reference substrates ON and S45, for two conditions of humidity, dry state, and reference state at (23 ± 2 °C)/(50 ± 5%). The substrate S45 was selected since it has the lowest value of thermal conductivity in a dry state. The samples used were similar to those used in thermal conductivity (150 mm × 150 mm × 30 mm). To this end, for the dry state, Cp,dry, the samples were dried in a ventilated oven at (60 ± 5 °C) until constant mass was reached (change < 0.1 kg in 24 h). For the reference state, Cp,(23,50), the samples were stabilised in a climatic chamber at (23 ± 5 °C) air temperature and (50 ± 5%) relative air humidity until constant mass was reached (same criterion). To ensure that there was no heat loss, two layers of a known homogeneous thermal insulating material (expanded polystyrene) were introduced on the upper and lower part of the sample, which was also contained within the same insulating material. The test was carried out inside a climatic chamber under controlled conditions of temperature and relative humidity, i.e., (23 ± 2 °C) air temperature and (50 ± 5%) air relative humidity.

2.2.3. Emissivity

The emissivity, ε, of a material is defined as the ratio between the energy emitted by the surface of that material per unit area and the energy emitted by a blackbody for the same wavelength at the same temperature following the Stefan–Boltzmann Law. When talking about the environmental and energy benefits of a material or construction system, it is essential to emphasise this surface parameter, since it is directly related to the surface temperature of the materials and to their ability to emit energy. The emissivity of the substrates was characterised using an INGLAS TIR100-2 thermal emissivity meter. The sample was subjected to thermal radiation from a body at a temperature of approximately 100 °C during a very short measurement period (<5 s). Eighteen substrates were tested, as shown in Figure 4. Since the samples being analysed are substrates and they cannot be kept vertically, it was necessary to rotate the measuring device to adapt to the position of the substrate. A wooden support structure was built for this purpose. To accommodate the substrate while the test was being carried out, a tray measuring 120 mm × 120 mm × 25 mm was built to allow the substrate to be removed without moving the apparatus. These dimensions are considered the measurement area of the emissometer, which corresponds to a semi-sphere. To obtain more accurate values, the minimum distance between the sample and the measurement area of the equipment was guaranteed. Due to the heterogeneity of each substrate, three measurements were performed at different points in each sample to give a total of nine measurements. In this way, an average emissivity value was obtained from each series of measurements.
For each measurement cycle, calibrations were performed using the reference standards provided by the equipment manufacturer. In a study by Kononogova et al. [36], the principle of operation, calibration, and validation of the TIR100-2 emissometer is explained, and uncertainty in the results of 0.050 is assumed. To determine the emissivity, the effect of the moisture content was also considered. For this, the following levels of moisture content were considered: dry state, at (23 ± 2 °C)/(50 ± 5%), and saturated. The measurements were carried out under controlled laboratory conditions.

2.2.4. Water Vapour Transmission

Water vapour permeability can be defined as the passage of water in the vapour state through a porous material. The aim of this study was to determine the amount of water vapour transmitted; per unit of surface; during the unit of time; and under defined conditions of temperature, humidity, and pressure. The water vapour transmission properties were determined using the dry cup method recommended in ISO 12572:2016 [37]. Before testing, the substrate samples were conditioned at (23 ± 2) °C and (50 ± 5%) until constant mass was reached (change < 0.1 kg/m3 over 24-h). The samples were supported on a permeable membrane placed over the mouth of a metallic cup with nominal dimensions of 100 mm × 100 mm × 50 mm. These assemblies were placed in a temperature- and humidity-controlled climatic chamber at (23 ± 2 °C) and (50 ± 5%). Because of the different partial vapour pressure between the interior of the test cup, which contained a desiccant (silica gel), and the atmosphere of the chamber, vapour flow occurs through permeable specimens. The test samples were laterally sealed to ensure that the humidity inside the cup remained constant with a downward moisture flow, as shown in Figure 5.
The assemblies were weighed inside the climatic chamber at 24 h intervals until their mass variation was less than 5% in relation to their total mass. The linear variation in time, corresponding to the equilibrium state of the mass gain, allows the determination of the water vapour transfer properties. In other words, the linear regression referring to the last five weighings makes it possible to determine the water vapour transmission rate, g [mg/(h·m2)]. The quotient of the water vapour transmission rate of the sample and the water vapour pressure difference between the two sample faces during the test is given by the water vapour permeance W [mg/(m2·h·Pa)]. The water vapour resistance, Z [(m2·h·Pa)/mg], corresponds to the inverse of the water vapour permeance (W). The water vapour permeability, δ [mg/(m·h·Pa)], is determined from the thickness of the test sample. The water vapour resistance factor, μ, corresponds to a dimensionless parameter that relates the air permeability to water vapour and the water vapour permeability of the material.

2.2.5. Hygroscopic Sorption Properties

Since the substrates are intended for use outdoors, it is important to analyse their behaviour in the presence of different levels of ambient air humidity. This variation in the relative humidity of the environment is reflected in the materials through the increase or decrease of their moisture content due to their sorption and desorption behaviour. This sorption (increase in moisture content) and desorption (decrease in moisture content) behaviour can be expressed in hygroscopic curves following the test procedures described in EN ISO 12571:2013 [38] using the climatic chamber method. To determine the hygroscopic curves, samples were placed in a series of test environments with four levels of relative humidity (10%, 38%, 66%, and 95%) and at a constant test temperature of (23 ± 0.5 °C) until equilibrium was reached. Four substrate formulations were selected based on the results of tests carried out previously on the scope of this study (thermal conductivity, emissivity, and water vapour permeability).
To determine the adsorption curves, the samples were dried in a ventilated oven at (60 ± 2 °C) until constant dry mass was reached (change < 0.1 kg/m3 over 24-h). After determining the dry mass, m0, the samples were placed in the climatic chamber at the first relative humidity stage, 10%. For each relative humidity level, weighings were carried out at 24 h intervals until constant mass was reached (same criterion). The equilibrium moisture content of the samples, u, was calculated according to EN ISO 12571:2013. This procedure was repeated to determine the desorption curves. The starting point for determining the desorption curve was the last point of the sorption curve at 95% relative humidity.

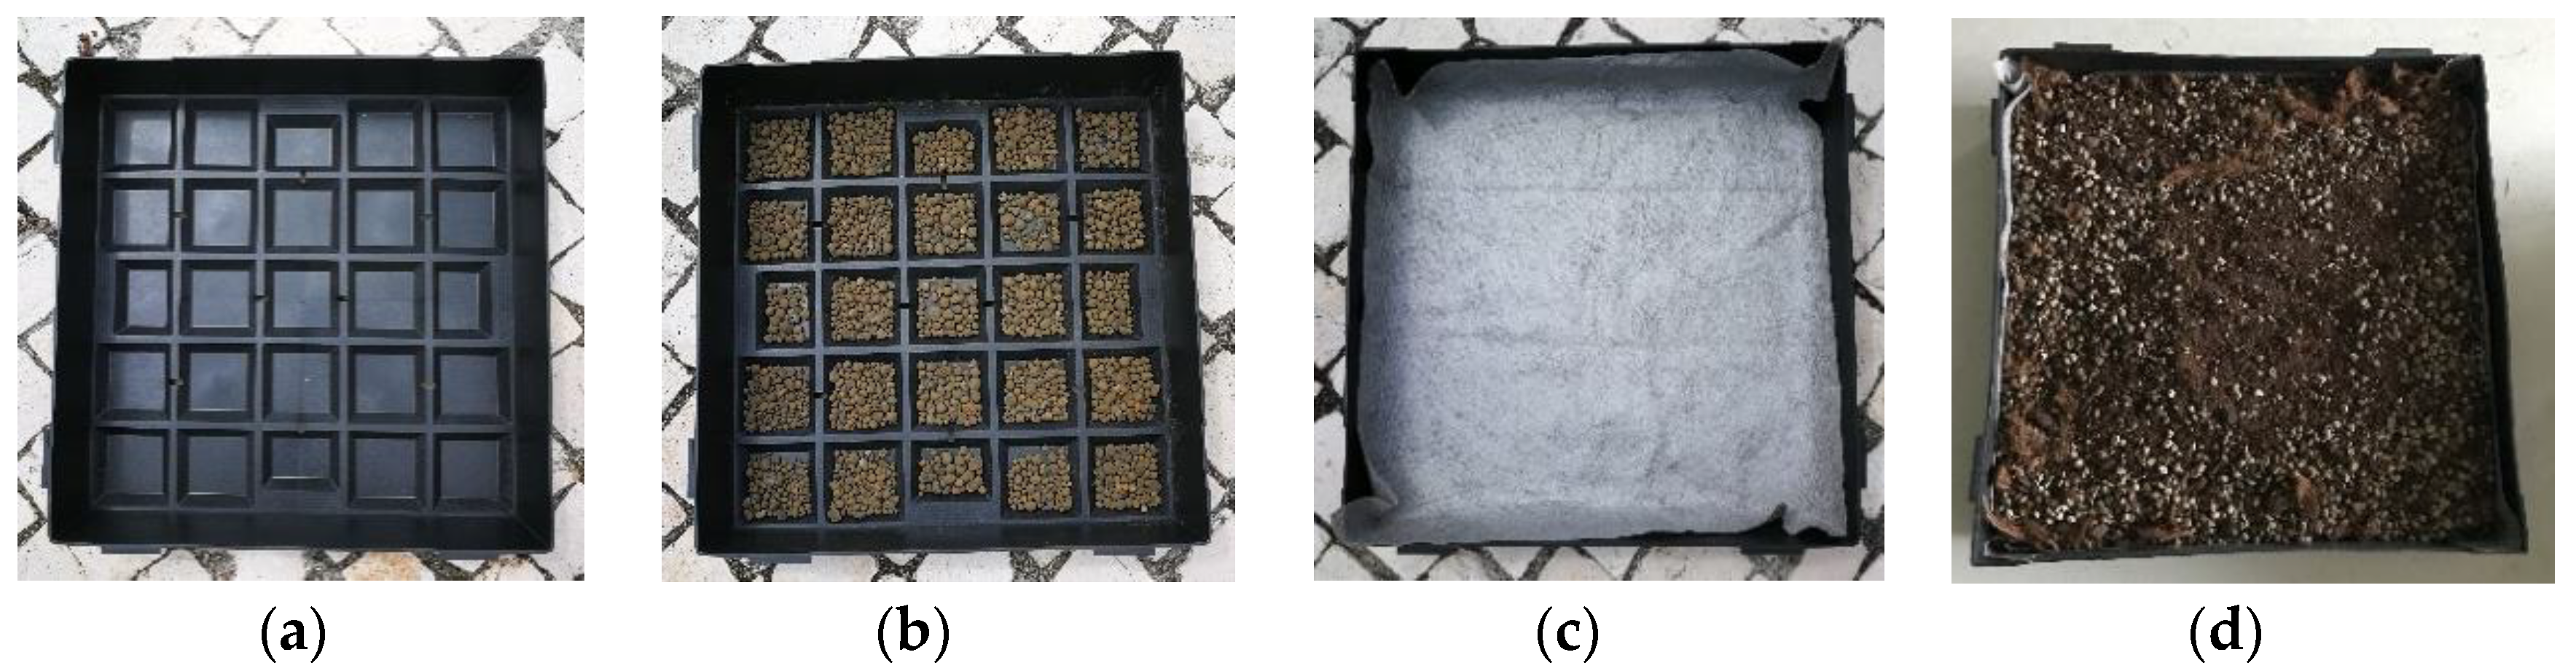
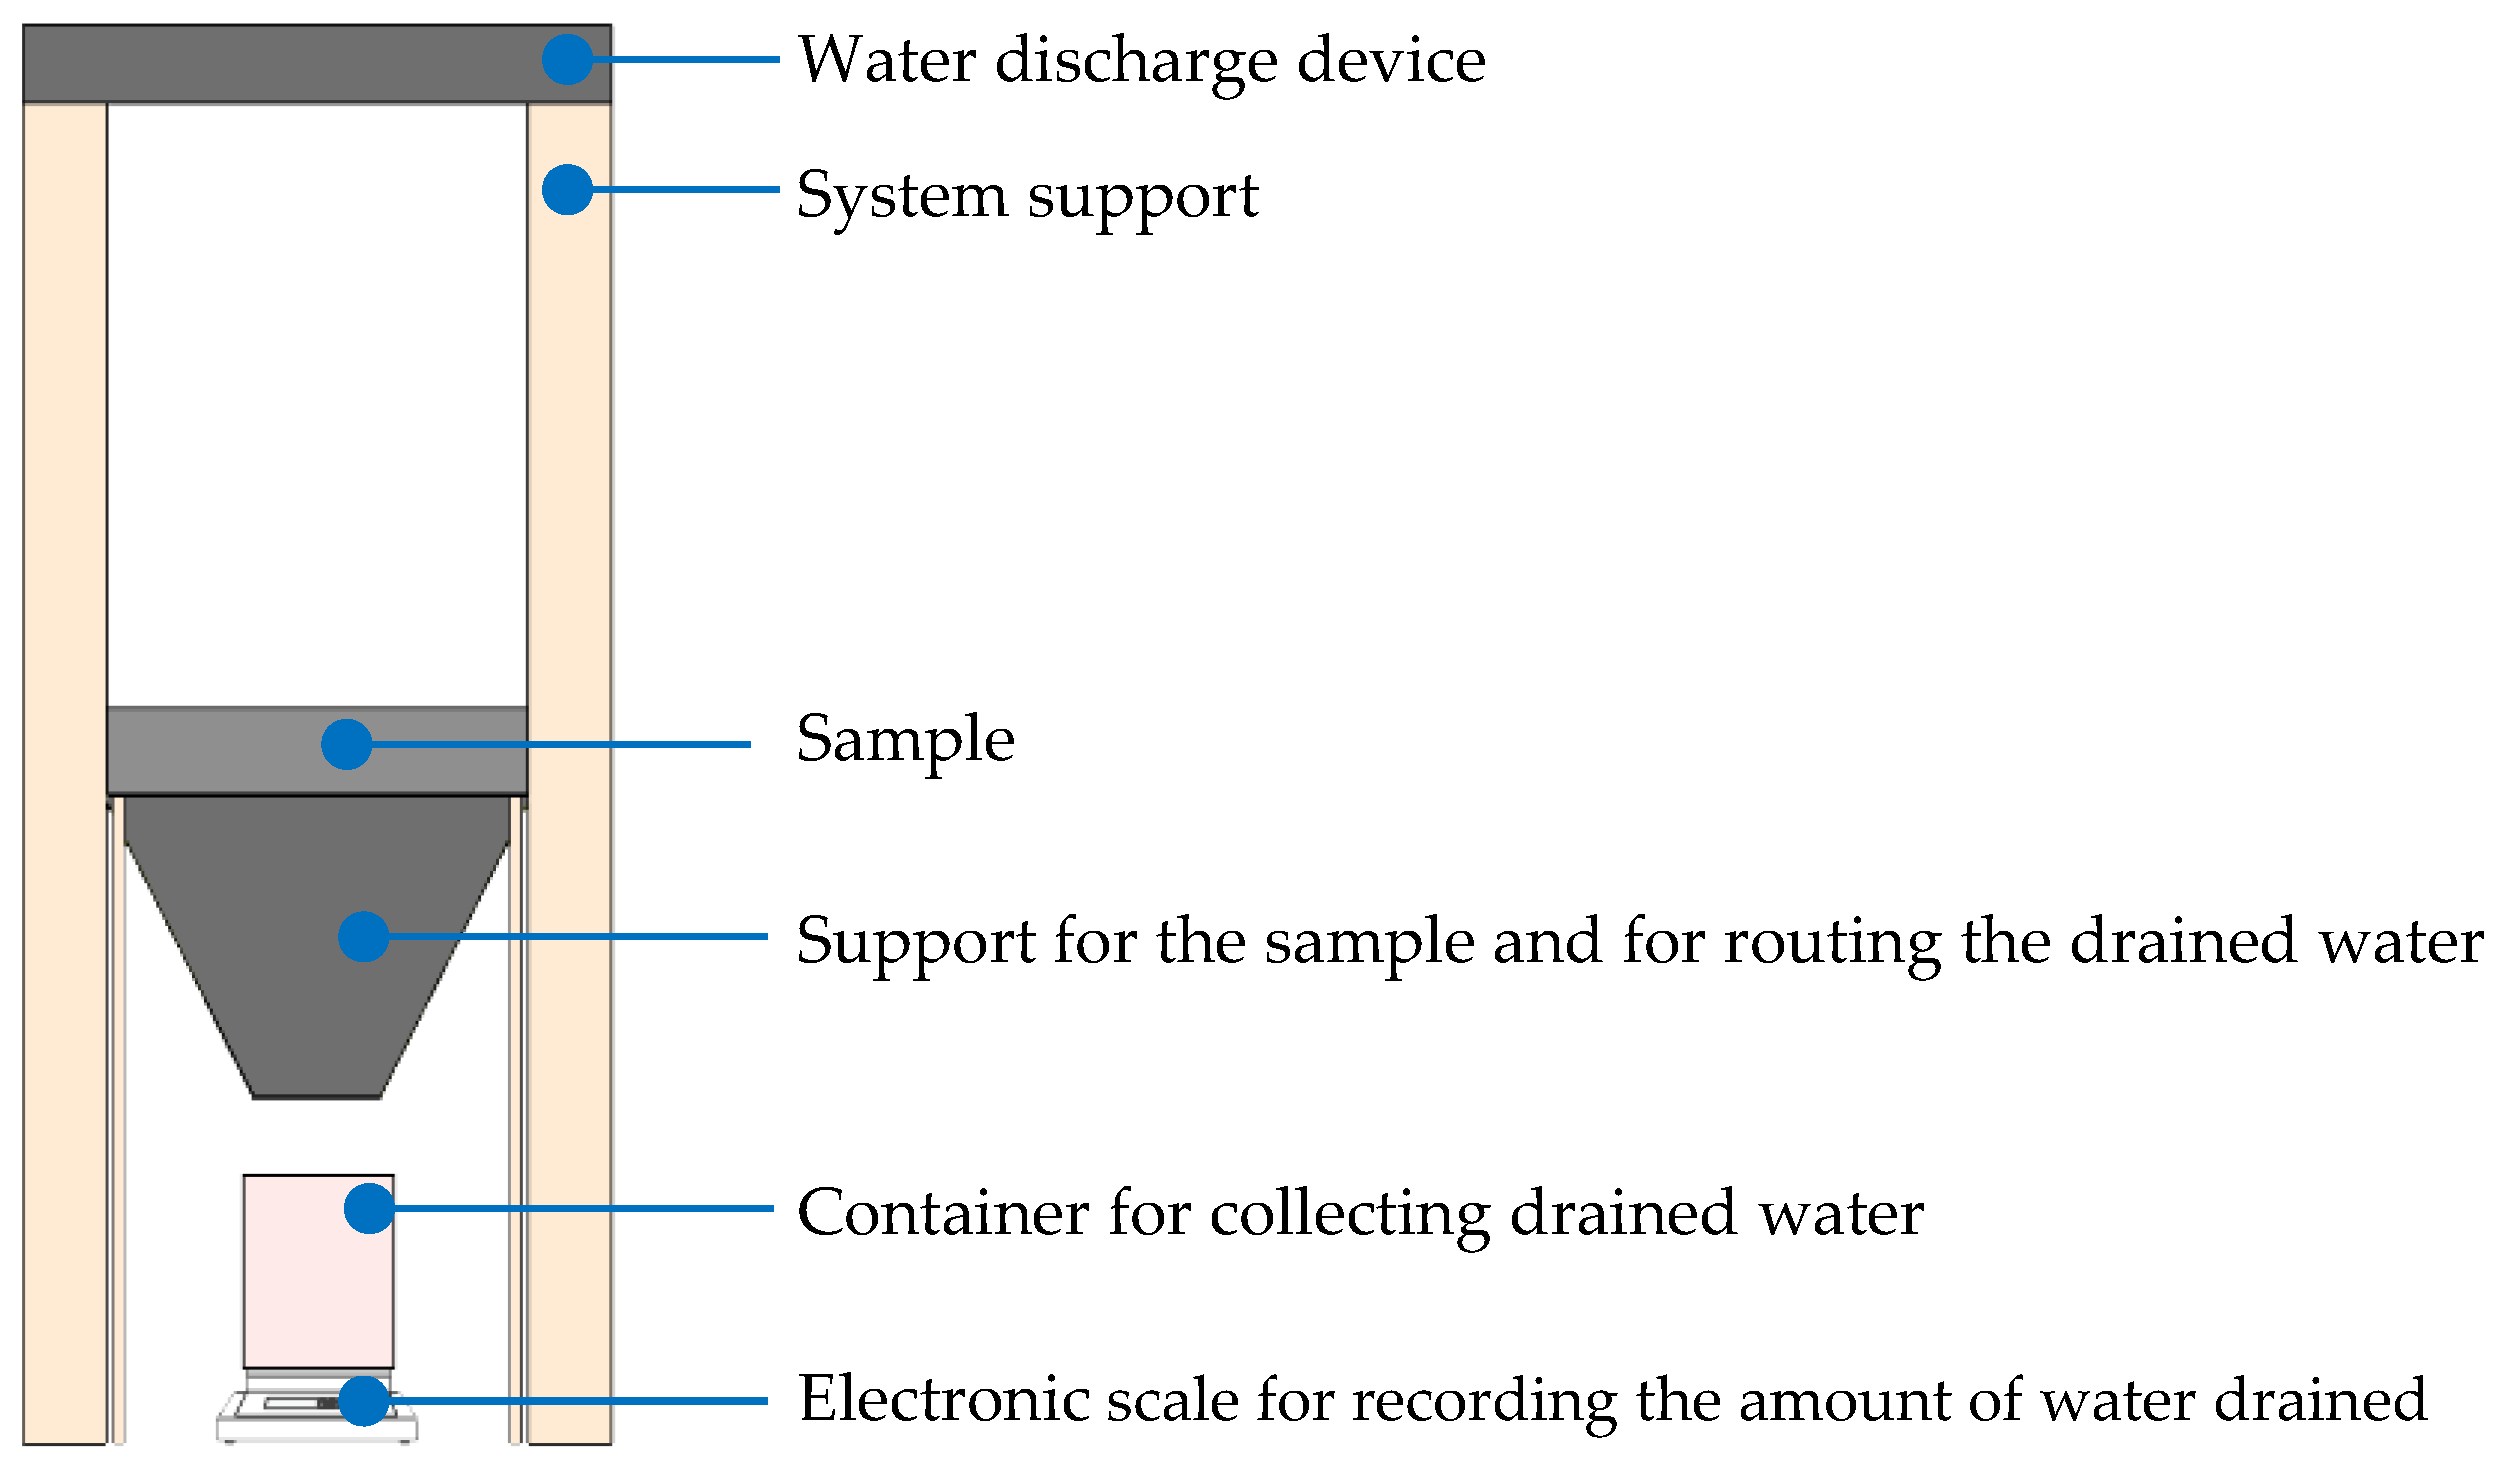
2.2.6. Water Drainage and Retention Capacity

It is well known that substrates contribute to reducing stormwater runoff and delaying the peak flow, which leads to less stress on drainage systems. To determine the drainage capacity and water retention of the selected substrates, tests were performed to obtain the temporal evolution of drained water and water holding capacity. For this test, tray modules were prepared with the selected substrates. The layers used in the assembly followed the same composition of green roof modules used in a real situation without vegetation (Figure 6). The tests were performed under controlled laboratory conditions using a test procedure adapted from the FLL guidelines. Accordingly, the samples were saturated and allowed to drain for a period of no less than 24 h before the test. Still following the FLL guidelines, the determination of drainage capacity must be calculated for an area equivalent to one hectare for a precipitation rate of 300 L/sec, equivalent to a rain event lasting 15 min, which is equivalent to 27 L/m2. Therefore, the volume of water that was applied to the area of the modules (0.25 m2) was 6.75 litres. During the test, three water discharges were applied at 24 h intervals.
For this test, an experimental water discharge apparatus was developed, as shown in Figure 7. This apparatus could control the volume and flow rate of water applied to the sample and monitor the amount of water drained. The drained water was monitored using a scale capable of continuous recording with a frequency of five measurements per second. Thus, it was possible to determine the flow rate, the amount of water drained, and the amount retained in the system. Reference values to characterise the drainage/water retention capacity of the system were determined by carrying out tests without a tray and with an empty tray.
The following tests were carried out: no tray, empty tray (T_empty), tray with reference substrate (ON), tray with substrate 35 (S35), tray with substrate 36 (S36), and tray with substrate 45 (S45). A drainage and water retention test were also carried out for the system with the reference substrate (ON) without the previous saturation foreseen by the FLL guideline. This test was used to compare the drainage and water retention capacity of the system for a wet and almost dry substrate. The samples were weighed before and after the test to assess the amount of water retained by the system. The mass of water drained through the sample at each water discharge was obtained based on the total mass of water drained and accumulated in the container after 24 h.

3. Results and Discussion

This section describes the results of the experimental characterisation performed according to the test methods presented above.

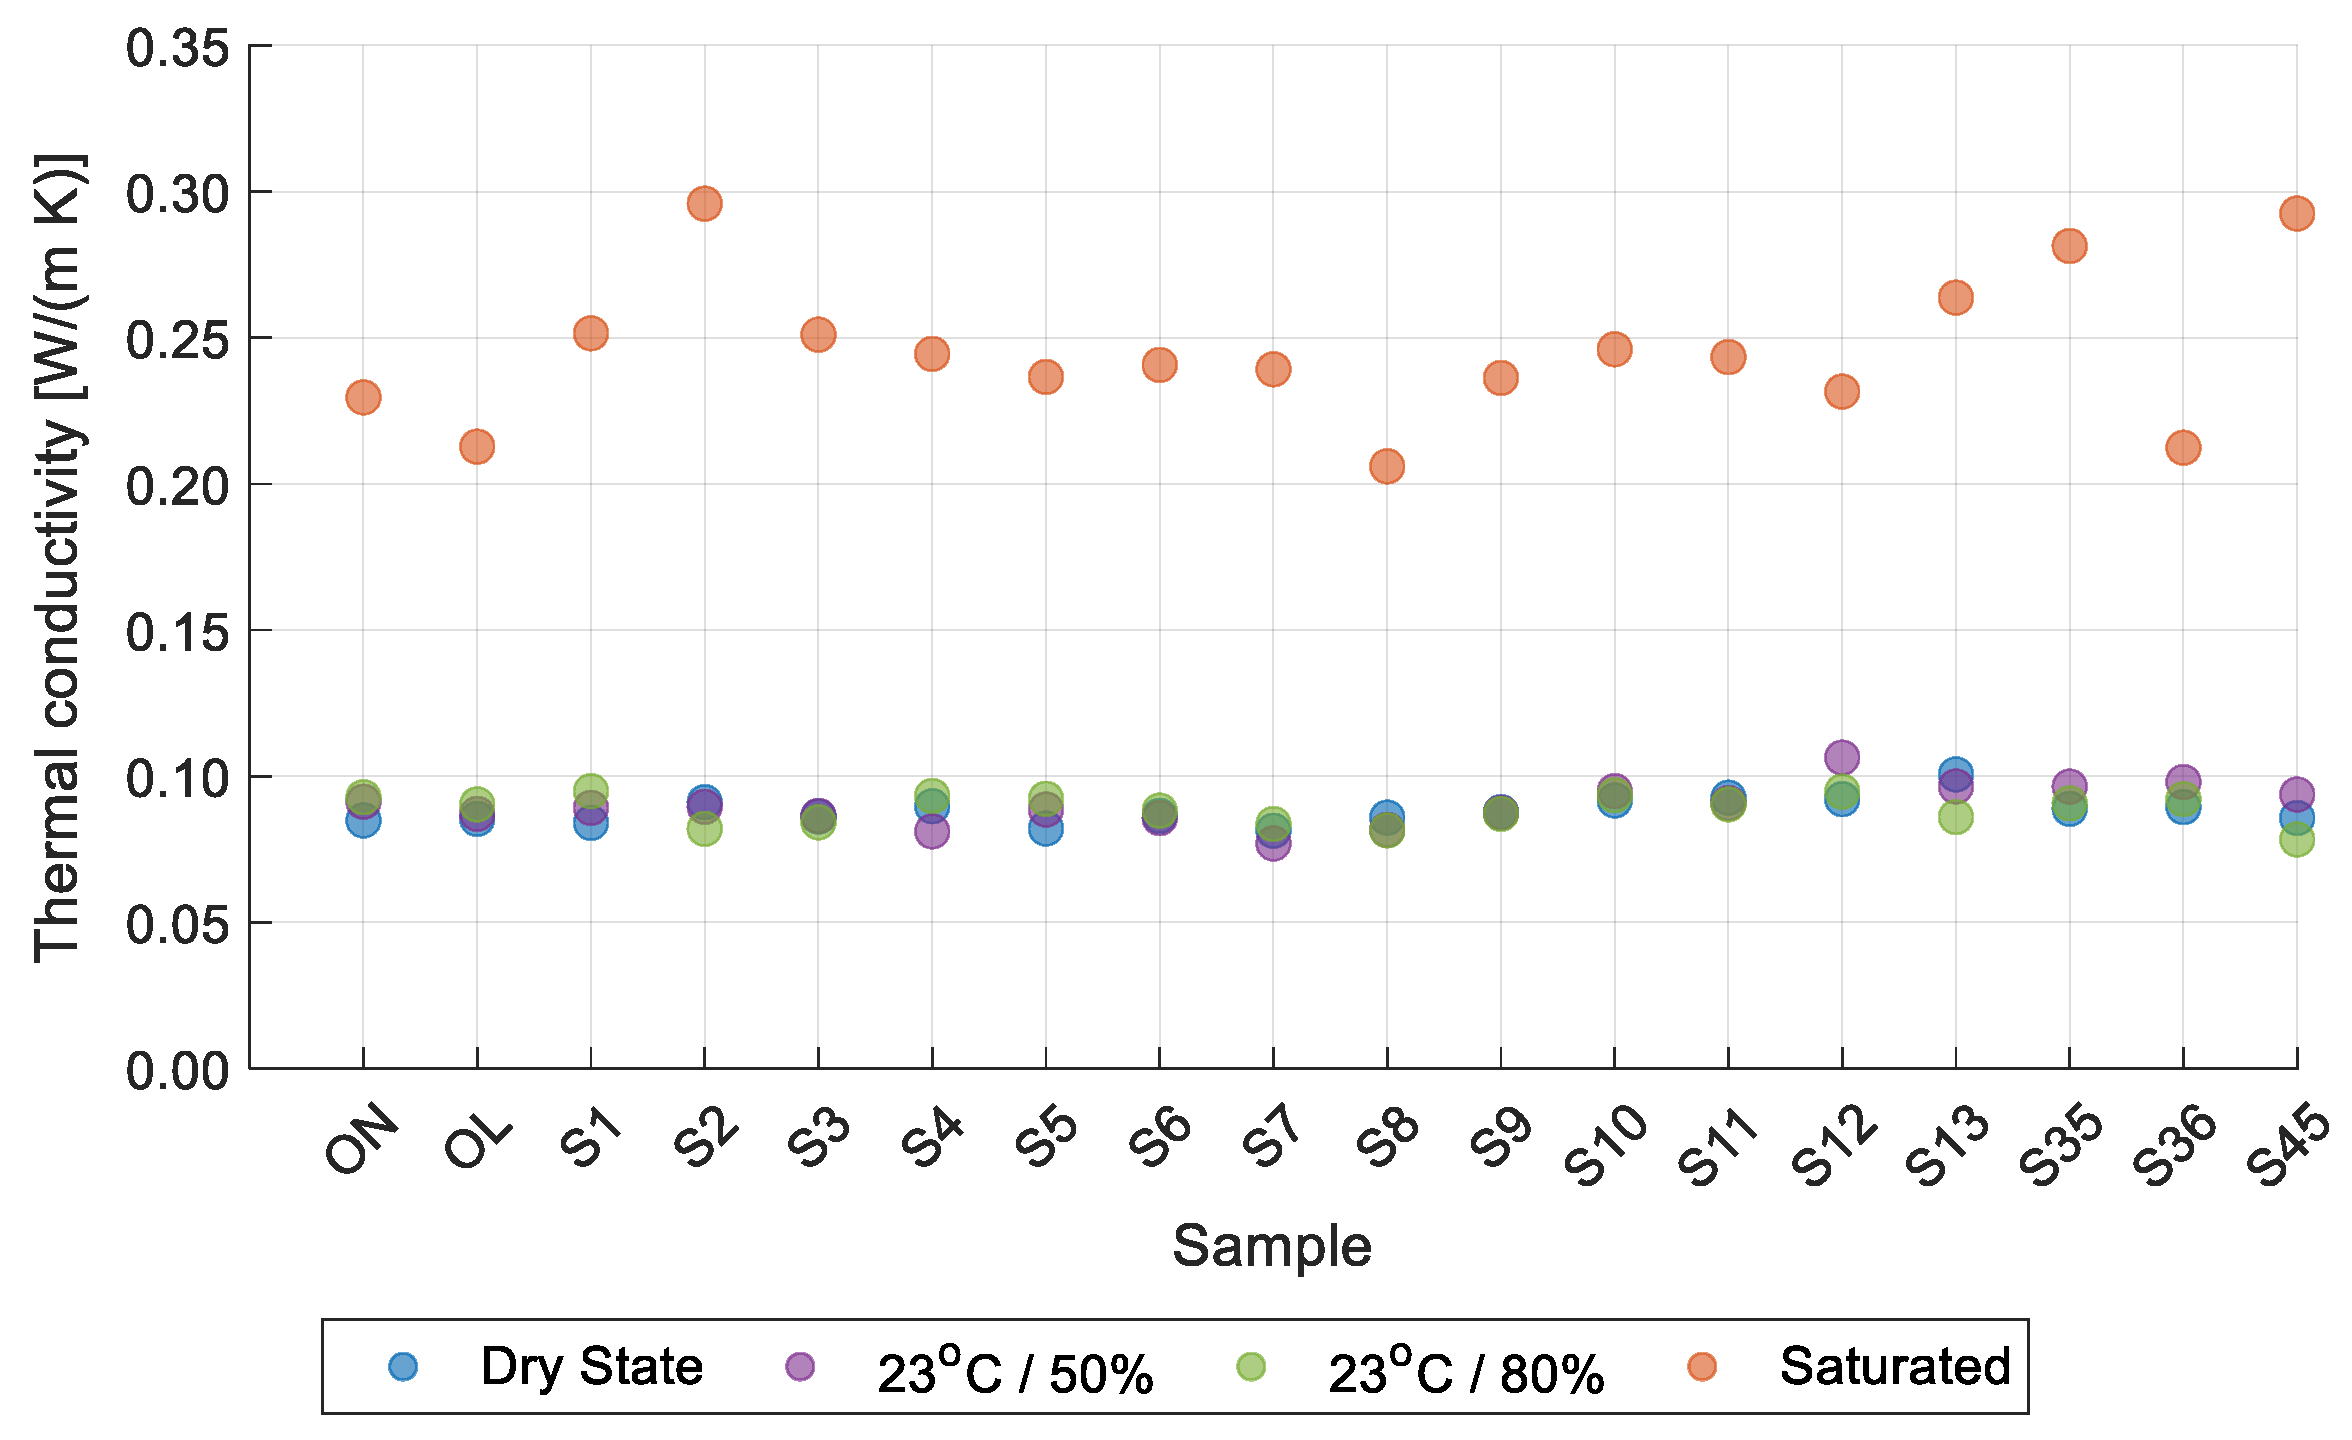
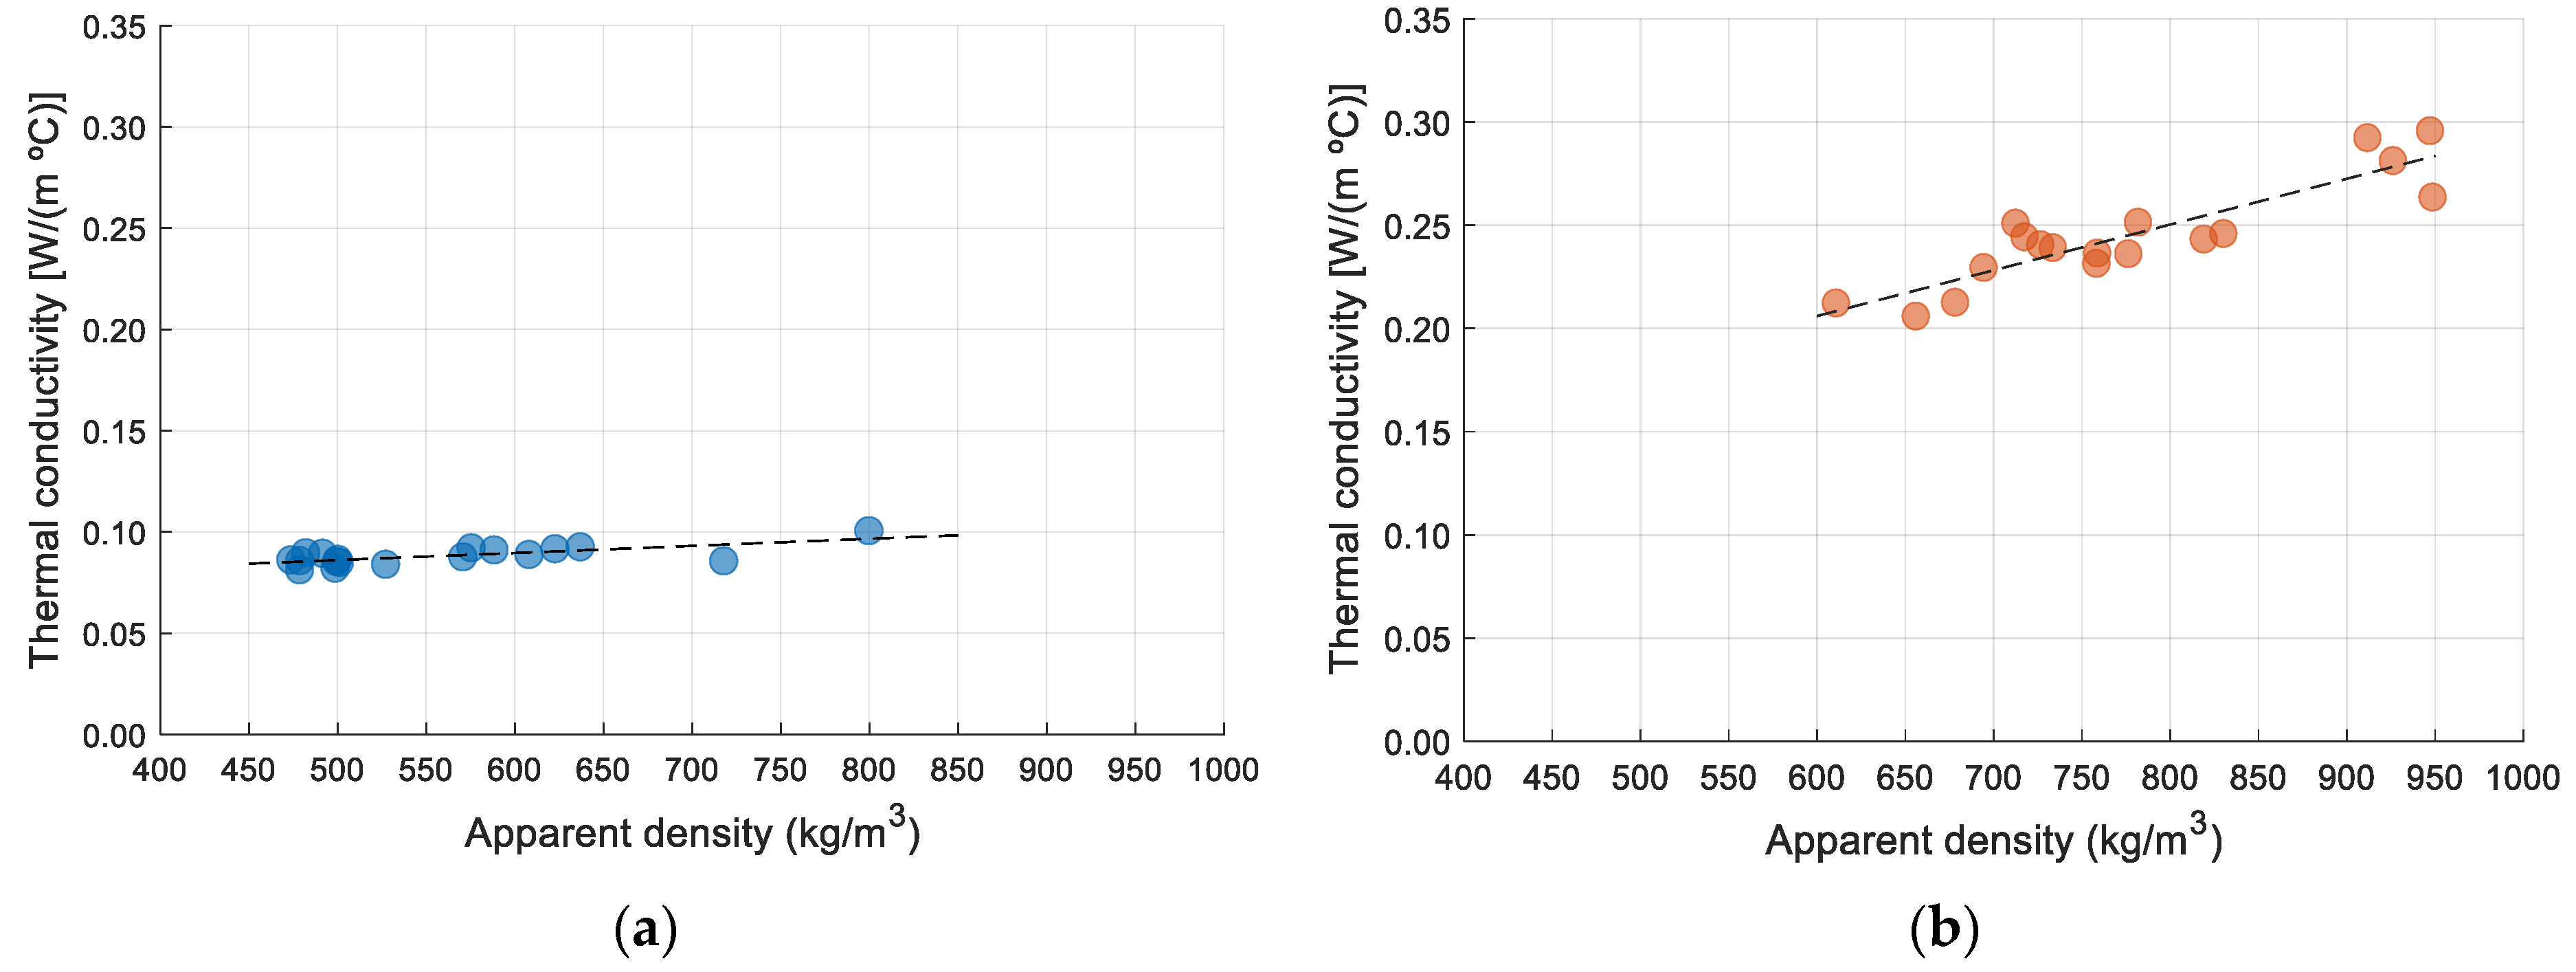
3.1. Thermal Conductivity

As expected, an increase in the thermal conductivity values with the temperature, moisture content, and apparent density was observed, with the moisture content playing a major role. The values obtained for the samples in dry state varied between 0.081 and 0.101 W/(m∙°C) at 10 °C, 0.084 and 0.106 W/(m·°C) at 25 °C, and between 0.088 and 0.109 W/(m·°C) at 40 °C. At the reference state, the thermal conductivity values varied between 0.077 and 0.106 W/(m∙°C) at 10 °C, 0.083 and 0.109 W/(m·°C) at 25 °C, and between 0.086 and 0.113 W/(m·°C) at 40 °C. For the (23 ± 2 °C) air temperature (80 ± 5%) air relative humidity condition, the values of thermal conductivity continued to increase and presented values that varied between 0.082 and 0.095 W/(m·°C) at 10 °C, 0.088 and 0.103 W/(m·°C) at 25 °C, and between 0.092 and 0.110 W/(m∙°C) at 40 °C. However, it was in the saturated state that the greatest increase in the thermal conductivity was observed, with values ranging from 0.206 to 0.293 W/(m·°C) at 10 °C, 0.245 to 0.352 W/(m·°C) at 25 °C, and 0.270 to 0.422 W/(m·°C) at 40 °C.
According to the values obtained, it was concluded that all substrates are technically viable. In relation to the reference substrate ON, it was found that the substrates in general gave similar results. The thermal conductivity results for 10 °C are presented in Figure 8. The maximum increment in thermal conductivity that was obtained in relation to the temperature was 9% in the dry state and 71% in the saturated state. As expected, temperature has a smaller impact on thermal conductivity than it does for the saturated state where there is a substantial increase in thermal conductivity.
Regarding the apparent density, it was concluded that the thermal conductivity increases with the apparent density, as shown in Figure 9.

3.2. Specific Heat Capacity
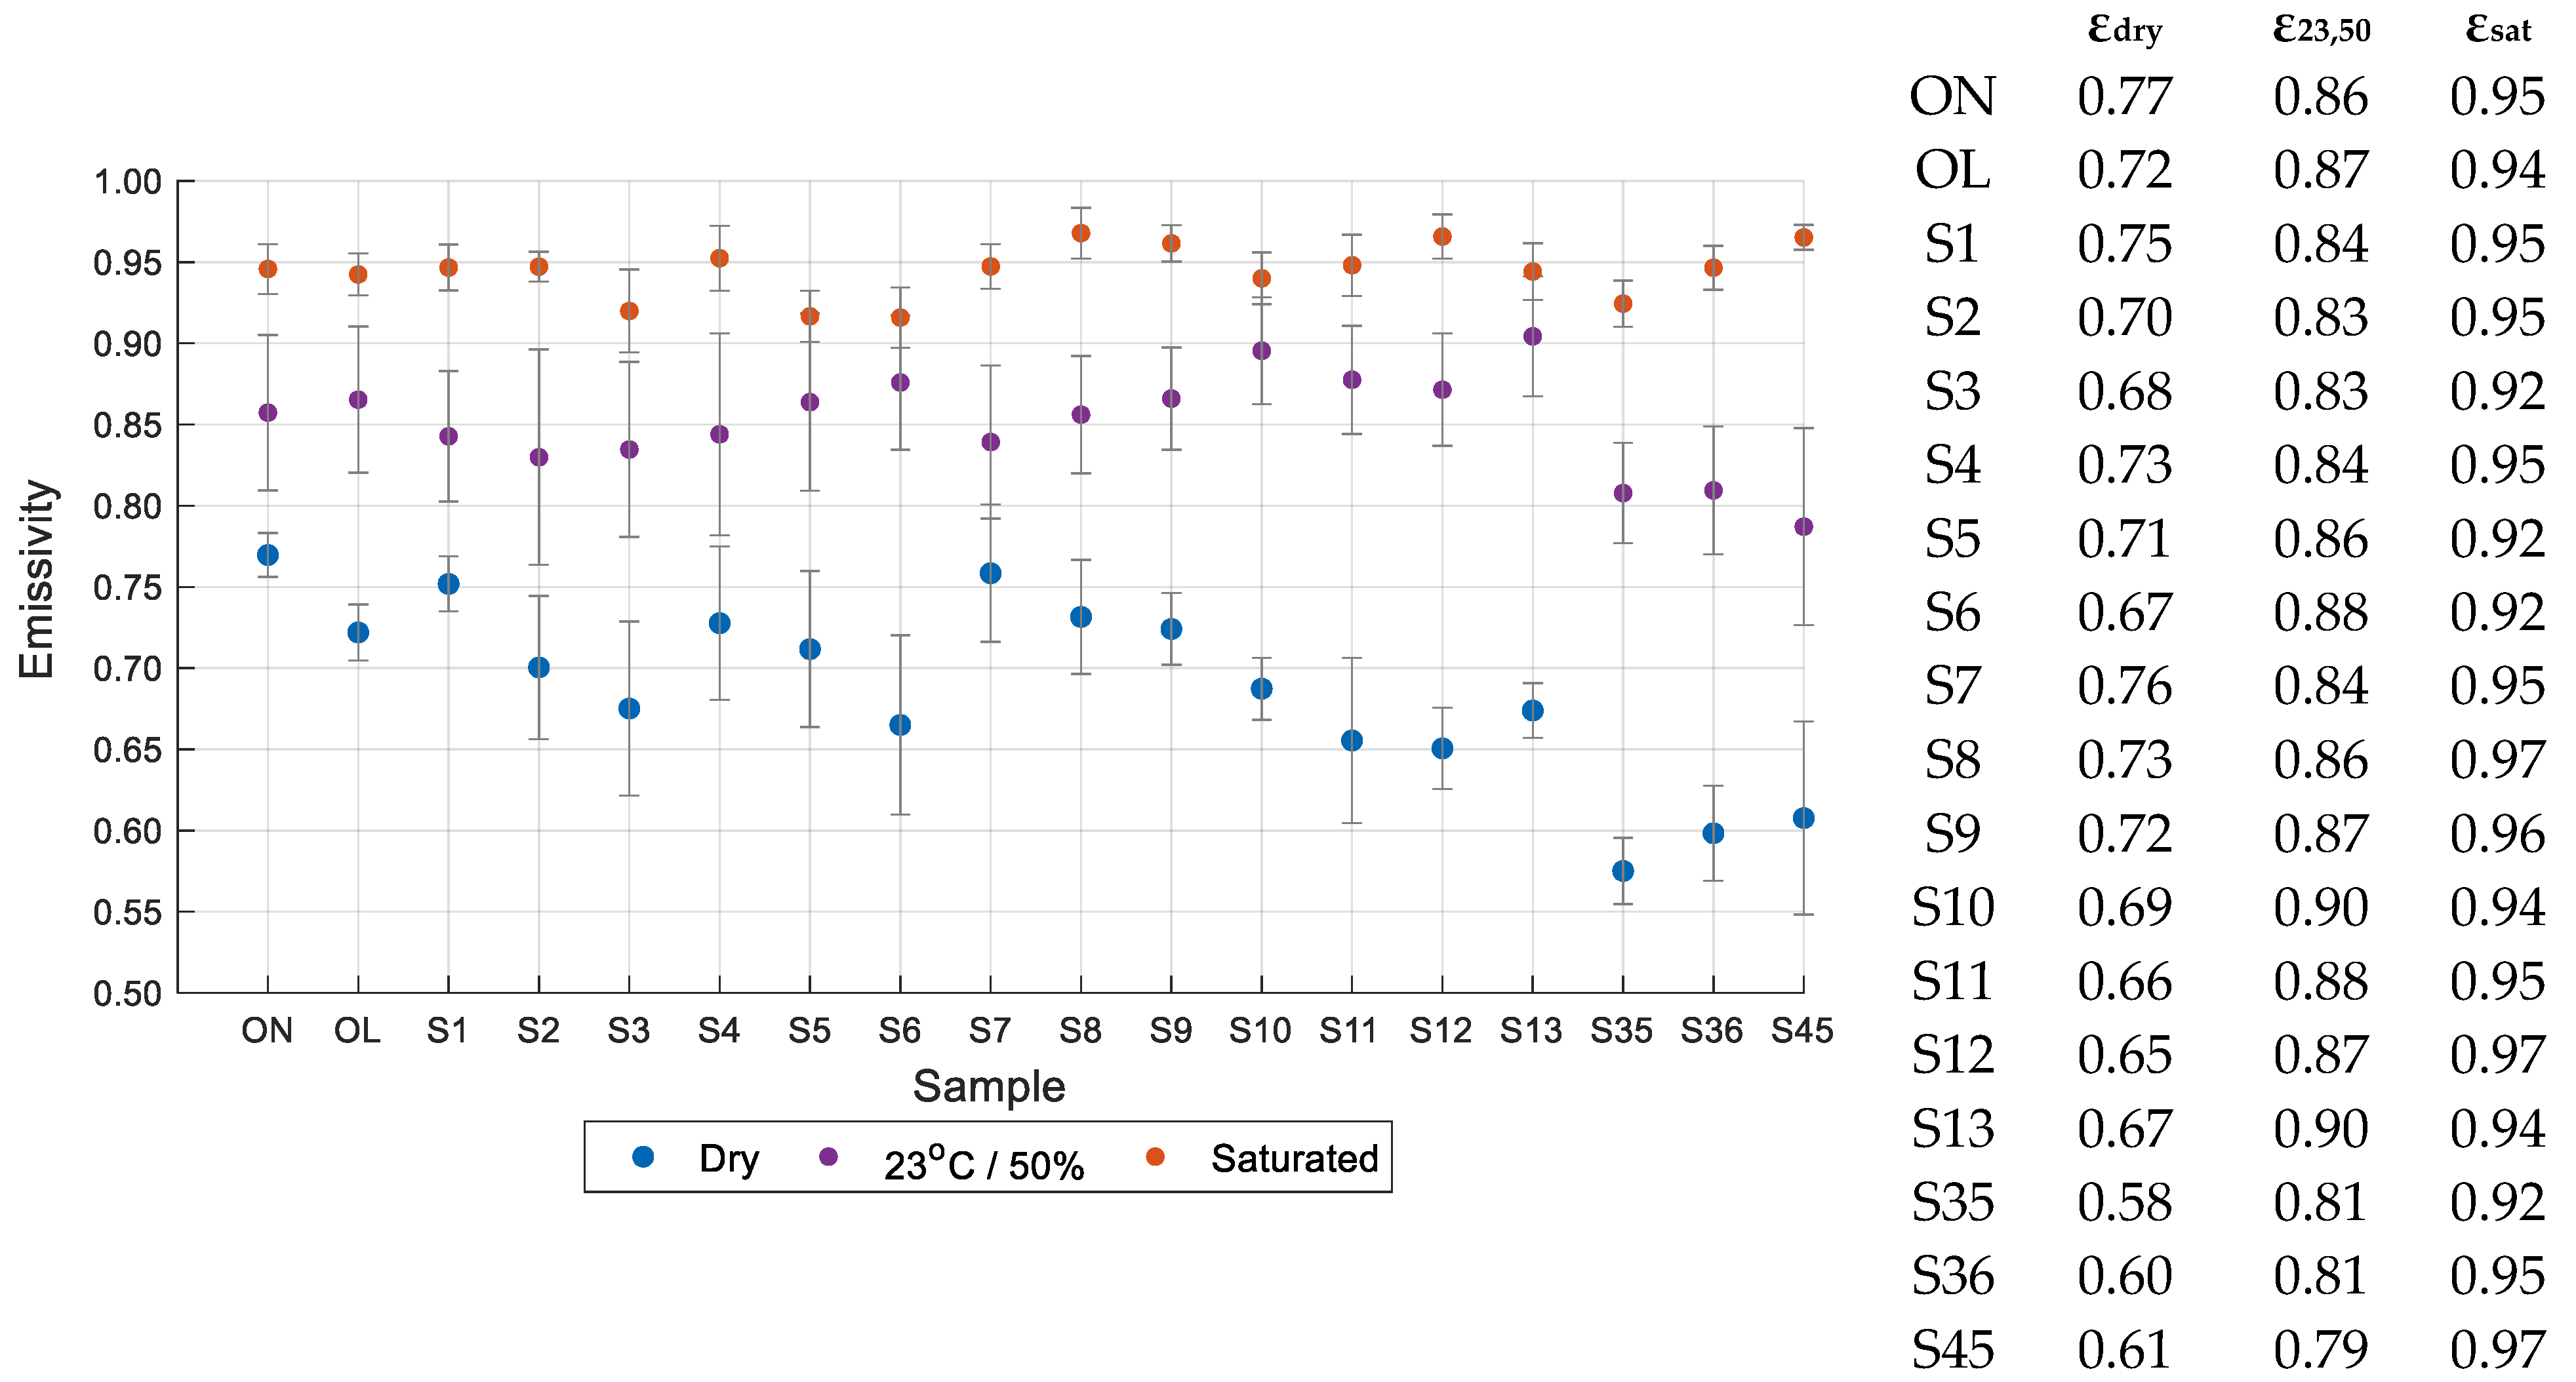
Table 2 summarises the specific heat capacity results of the ON (reference) and S45 (one of the substrates with the lowest value of thermal conductivity in dry state) substrates for dry state and (23 ± 2 °C) air temperature and (50 ± 5%) air relative humidity.
The values obtained confirm the higher specific heat capacity for samples with higher moisture content. The specific heat capacity of water is 4000 J/(kg K) [39], which helps to justify this behaviour. These results can be compared with other building materials used for the thermal protection of roofs. For example, for XPS insulation boards, the specific heat values were found between 1300 and 1700 J/(kg K). Cork, also used as insulation, has specific heat values between 1500 and 1700 J/(kg K). Higher values for the specific heat were also found for natural fibres, up to 2100 (J/(kg K) [40]. Although the results that can be obtained from the substrate samples are variable due to their heterogeneity, they are close to the values of other insulation materials.

3.3. Emissivity

Emissivity is mainly controlled by the physical properties of materials and surface properties. In this case, the samples are non-homogeneous since they have several types of materials in their composition, in addition to their moisture content. The moisture content of a substrate considerably modifies the substrate emissivity because of the high emissivity value of water. Therefore, the emissivity of the water was also determined (≈0.94). Figure 10 presents the average emissivity for the eighteen substrates, considering the following moisture content conditions: dry state, (23 ± 2 °C)/(50 ± 5%), and saturated.
It is observed, as expected, that emissivity values vary with the moisture content present in the substrates. A significant increase in emissivity can be observed for higher moisture content. The lowest emissivity values were obtained with the substrate in the dry state and ranged from 0.58 (S35) to 0.77 (ON), and higher emissivity values were observed for saturated substrate with values between 0.92 (S6) and 0.97 (S8). Emissivity values in saturated state substrates were close to water emissivity. At (23 ± 2 °C)/(50 ± 5%) the emissivity varied between 0.79 and 0.90.

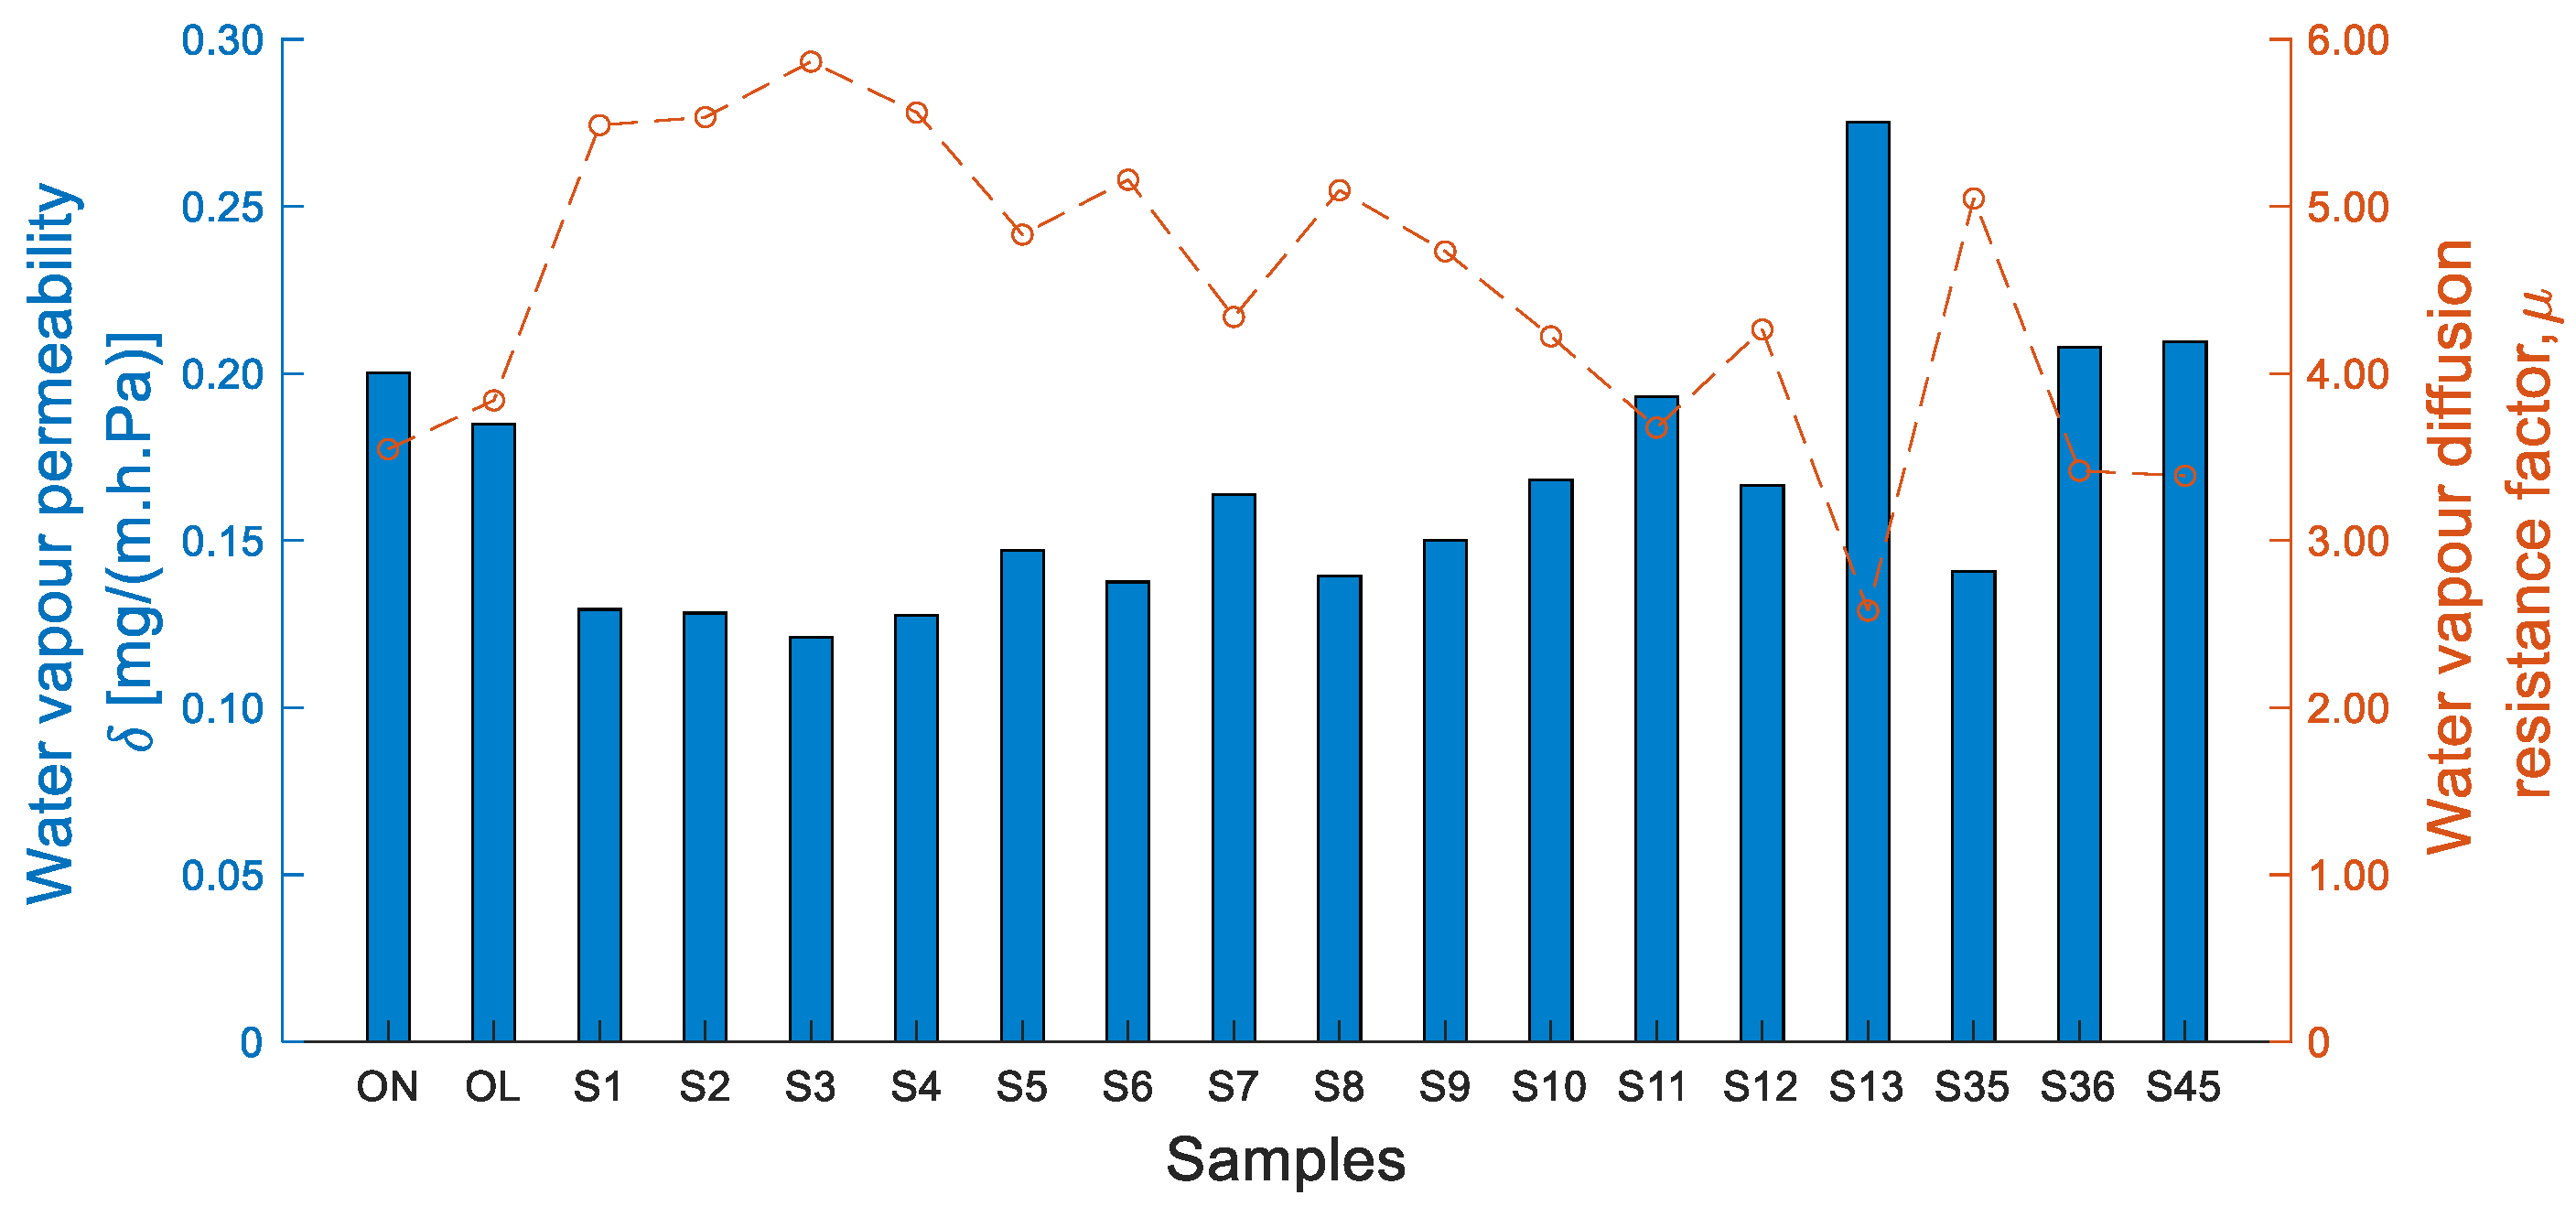
3.4. Water Vapour Transmission

The water vapour permeability results are given in Table 3. Although the substrates generally exhibit similar permeability to water vapour, values ranging from 0.12 mg/(m·h·Pa) (S3) and 0.28 mg/(m·h·Pa) (S13) were recorded.
The graph in Figure 11 shows a comparative analysis of the water vapour permeability results for the set of eighteen substrates.

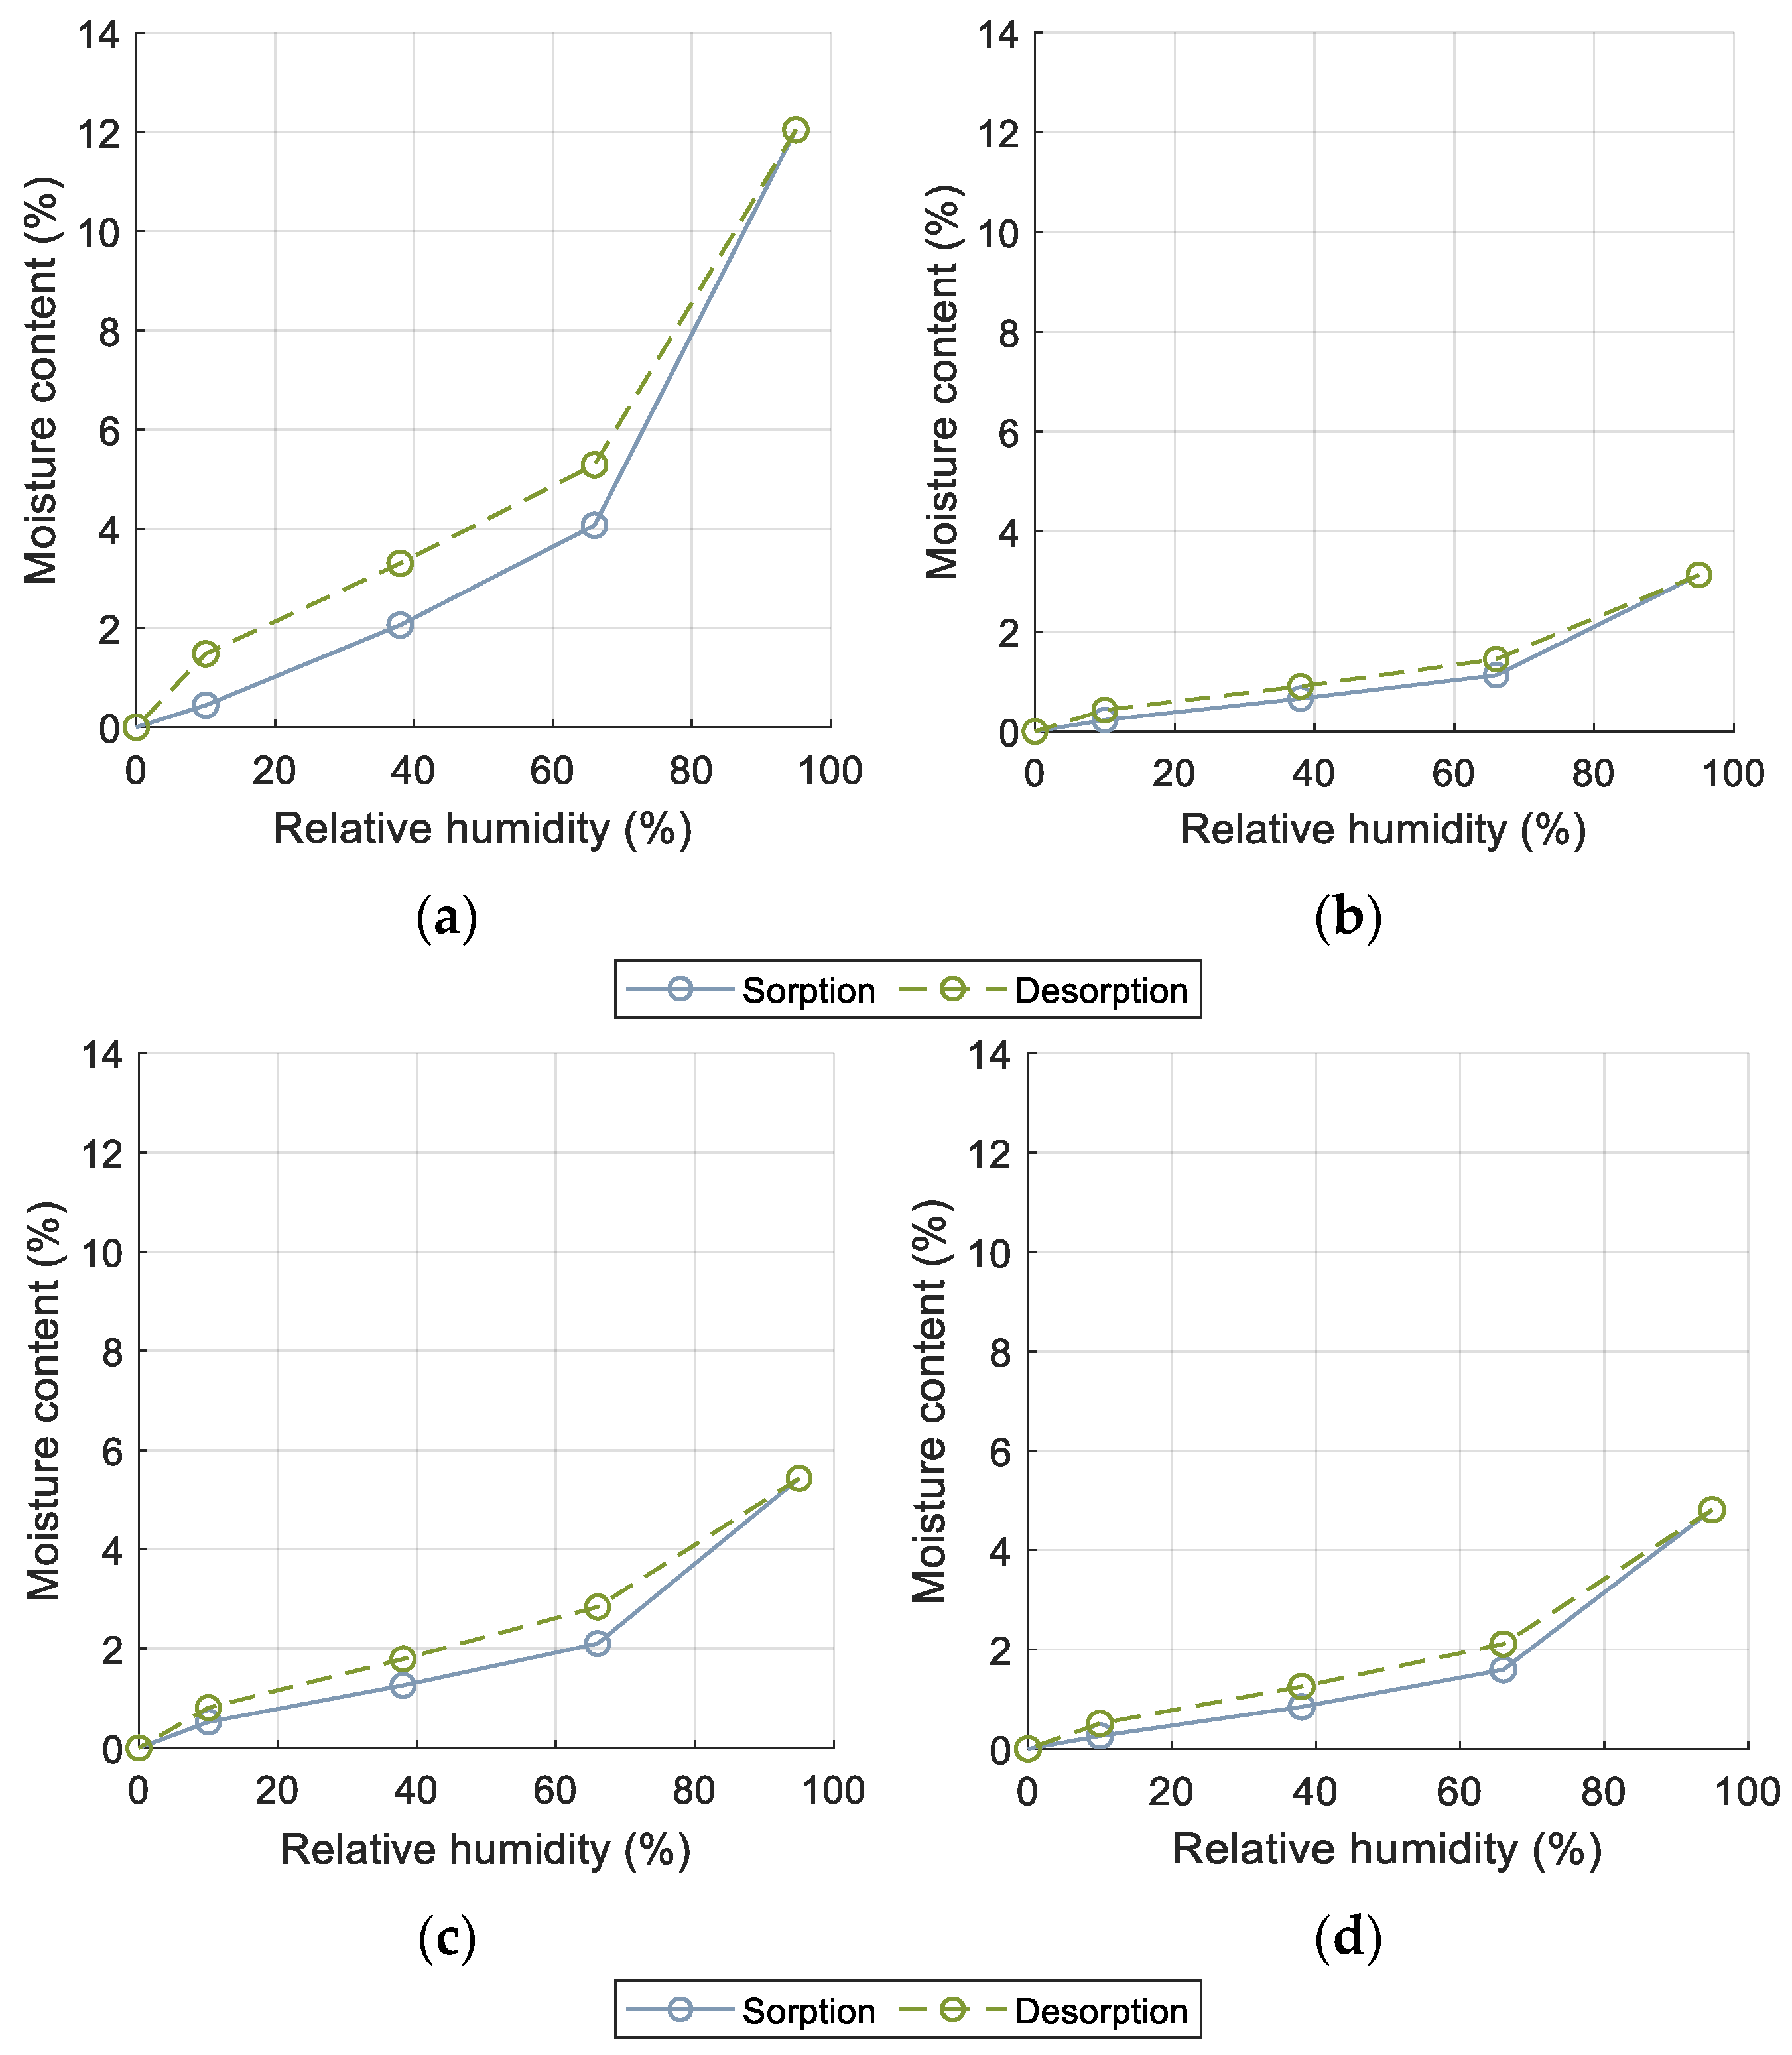
3.5. Hygroscopic Sorption Properties

The four substrate formulations that were selected to the hygroscopic sorption properties and drainage and water retention were those with technical feasibility of production and adequate thermal and water vapour transmission properties: S35, S36, S45, and the reference substrate (Figure 12). Four samples were prepared from each substrate with a mass of at least 200 g. The samples were placed in glass crystallizers with lids to prevent possible losses or gains in mass during the handling of the samples for weighing purposes.
The results obtained for the hygroscopic properties as a function of relative humidity (RH) are presented in Figure 13. For all substrates, there is a progressive increase in the moisture content with the increase in relative humidity. As expected, initially, the moisture is absorbed by monomolecular adsorption which occurs until the level of RH = 38% and, in a second phase, multimolecular adsorption occurs (38% ≤ RH ≤ 66%). Finally, there is a phase of capillary condensation (66% ≤ RH ≤ 95%), which is reflected in the increase in the slope of the curve. As expected, all substrates showed a hysteresis effect, characterised by the distance between the adsorption and desorption curves. Knowing the hysteresis effect can be relevant to predicting the moisture content during the drying process after a cycle of wetting the substrates. In this study, substrates S45 and S35 showed a smaller hysteresis effect, which reveals a lower capacity to retain moisture. This behaviour could be related to the porous structure of the substrate formulation. In a comparative analysis of the adsorption and desorption of the tested substrates, it is possible to confirm that the reference substrate (ON) presented the highest hysteresis effect.

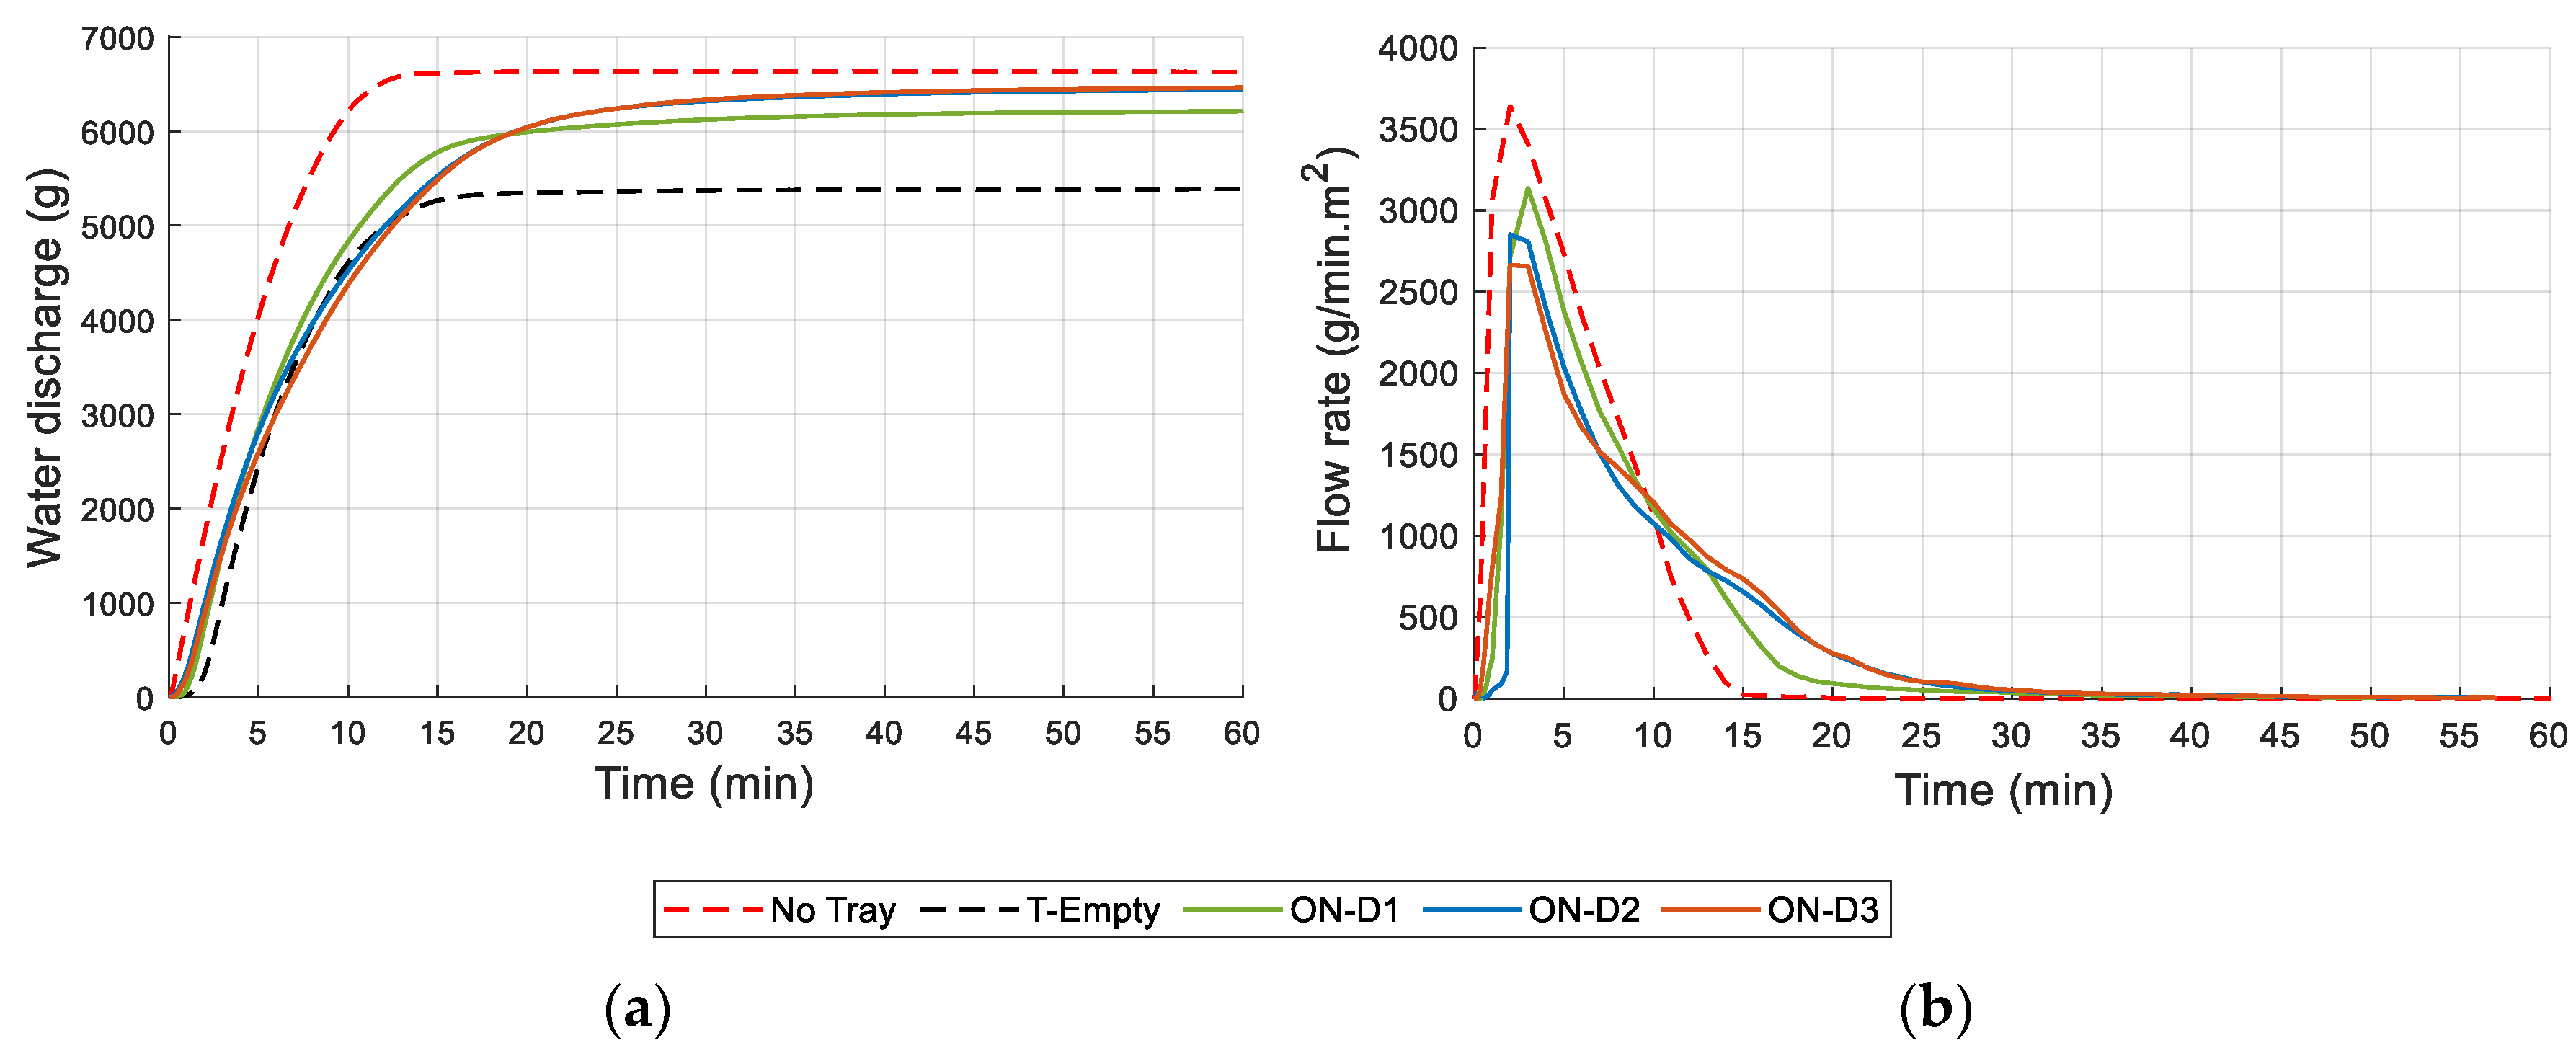
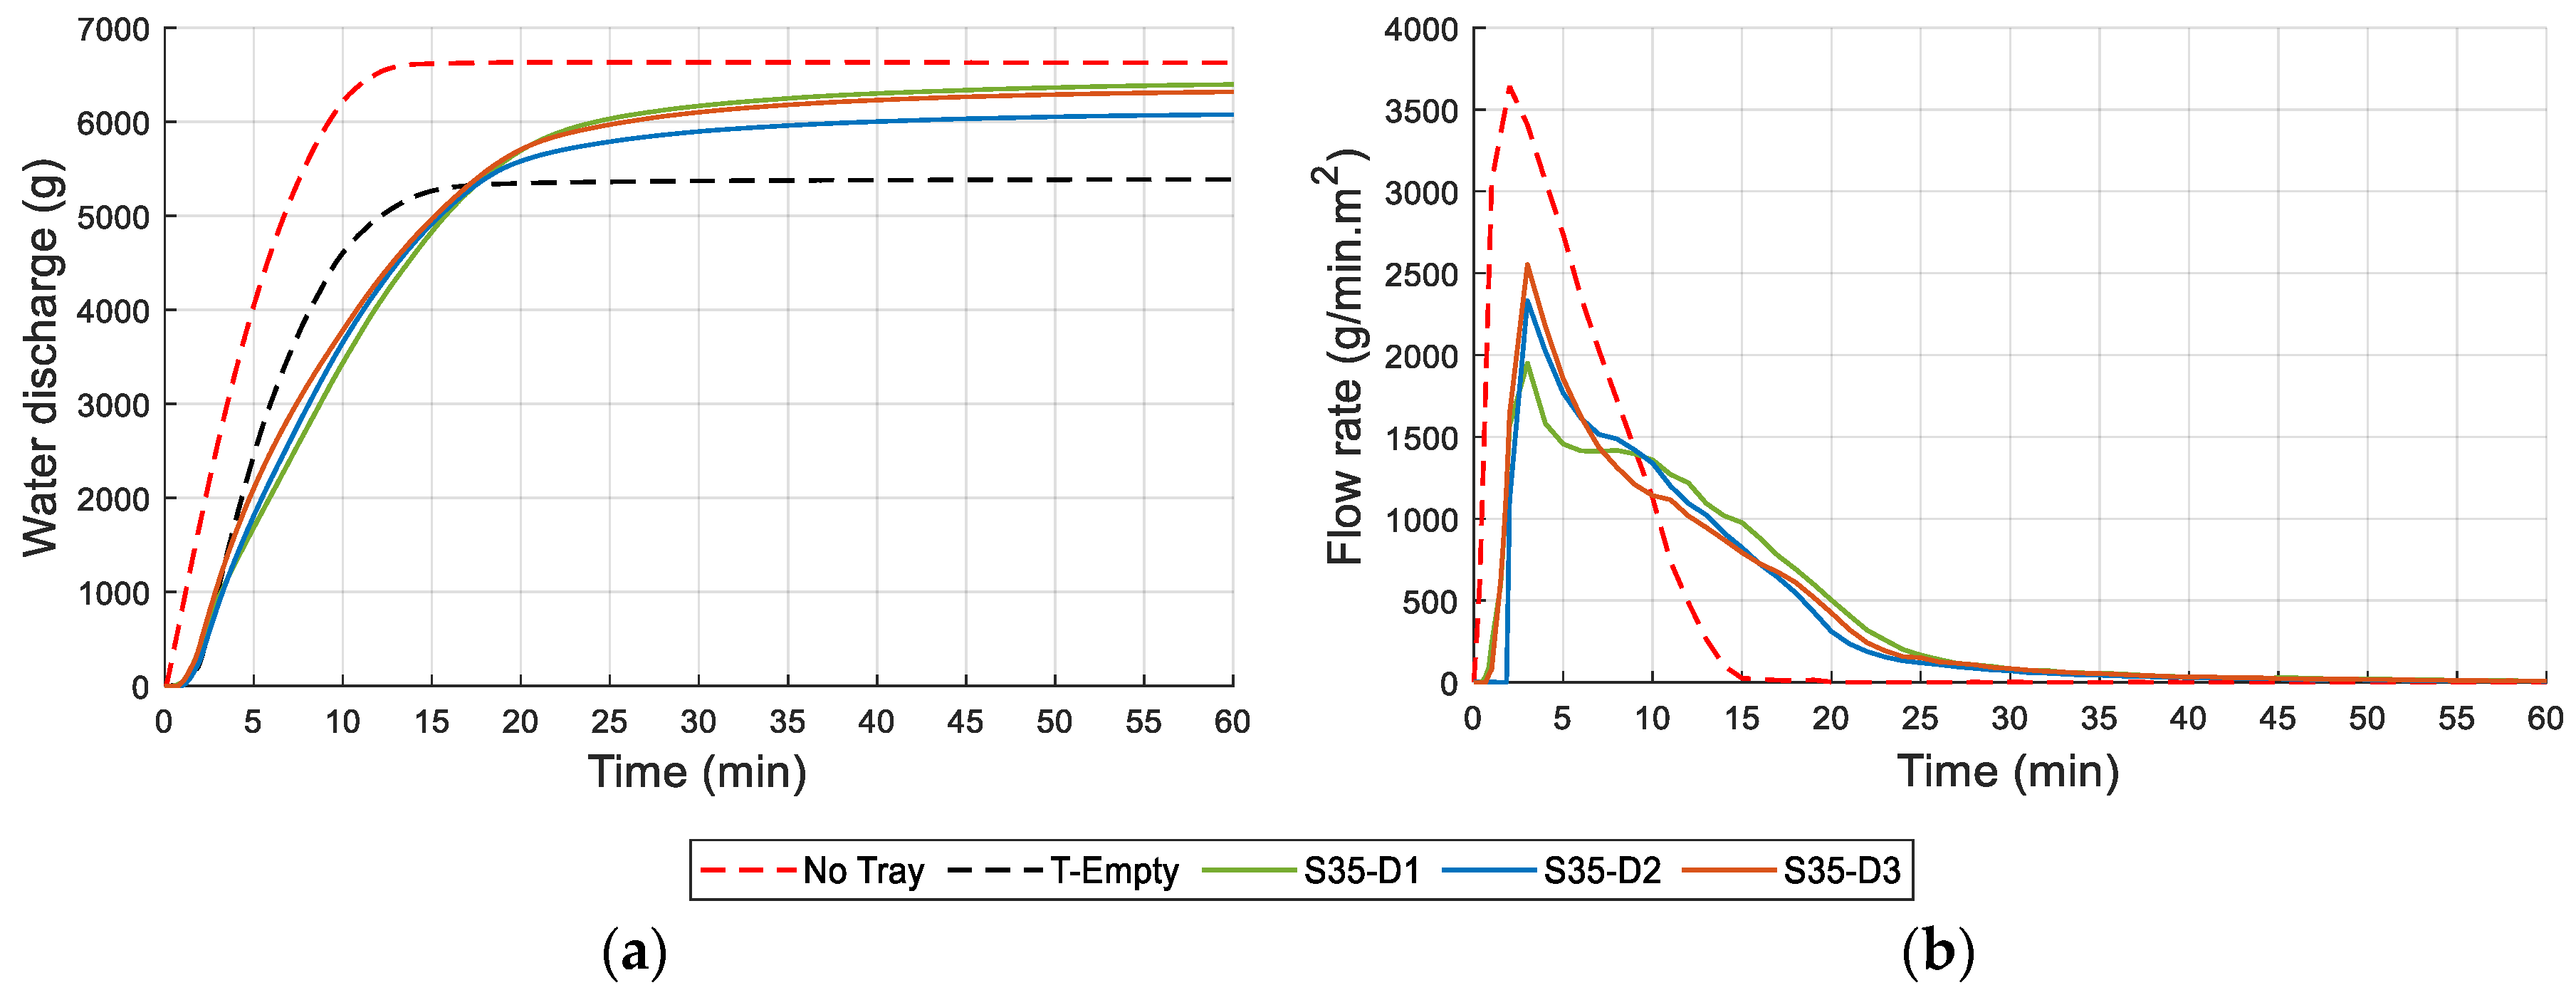
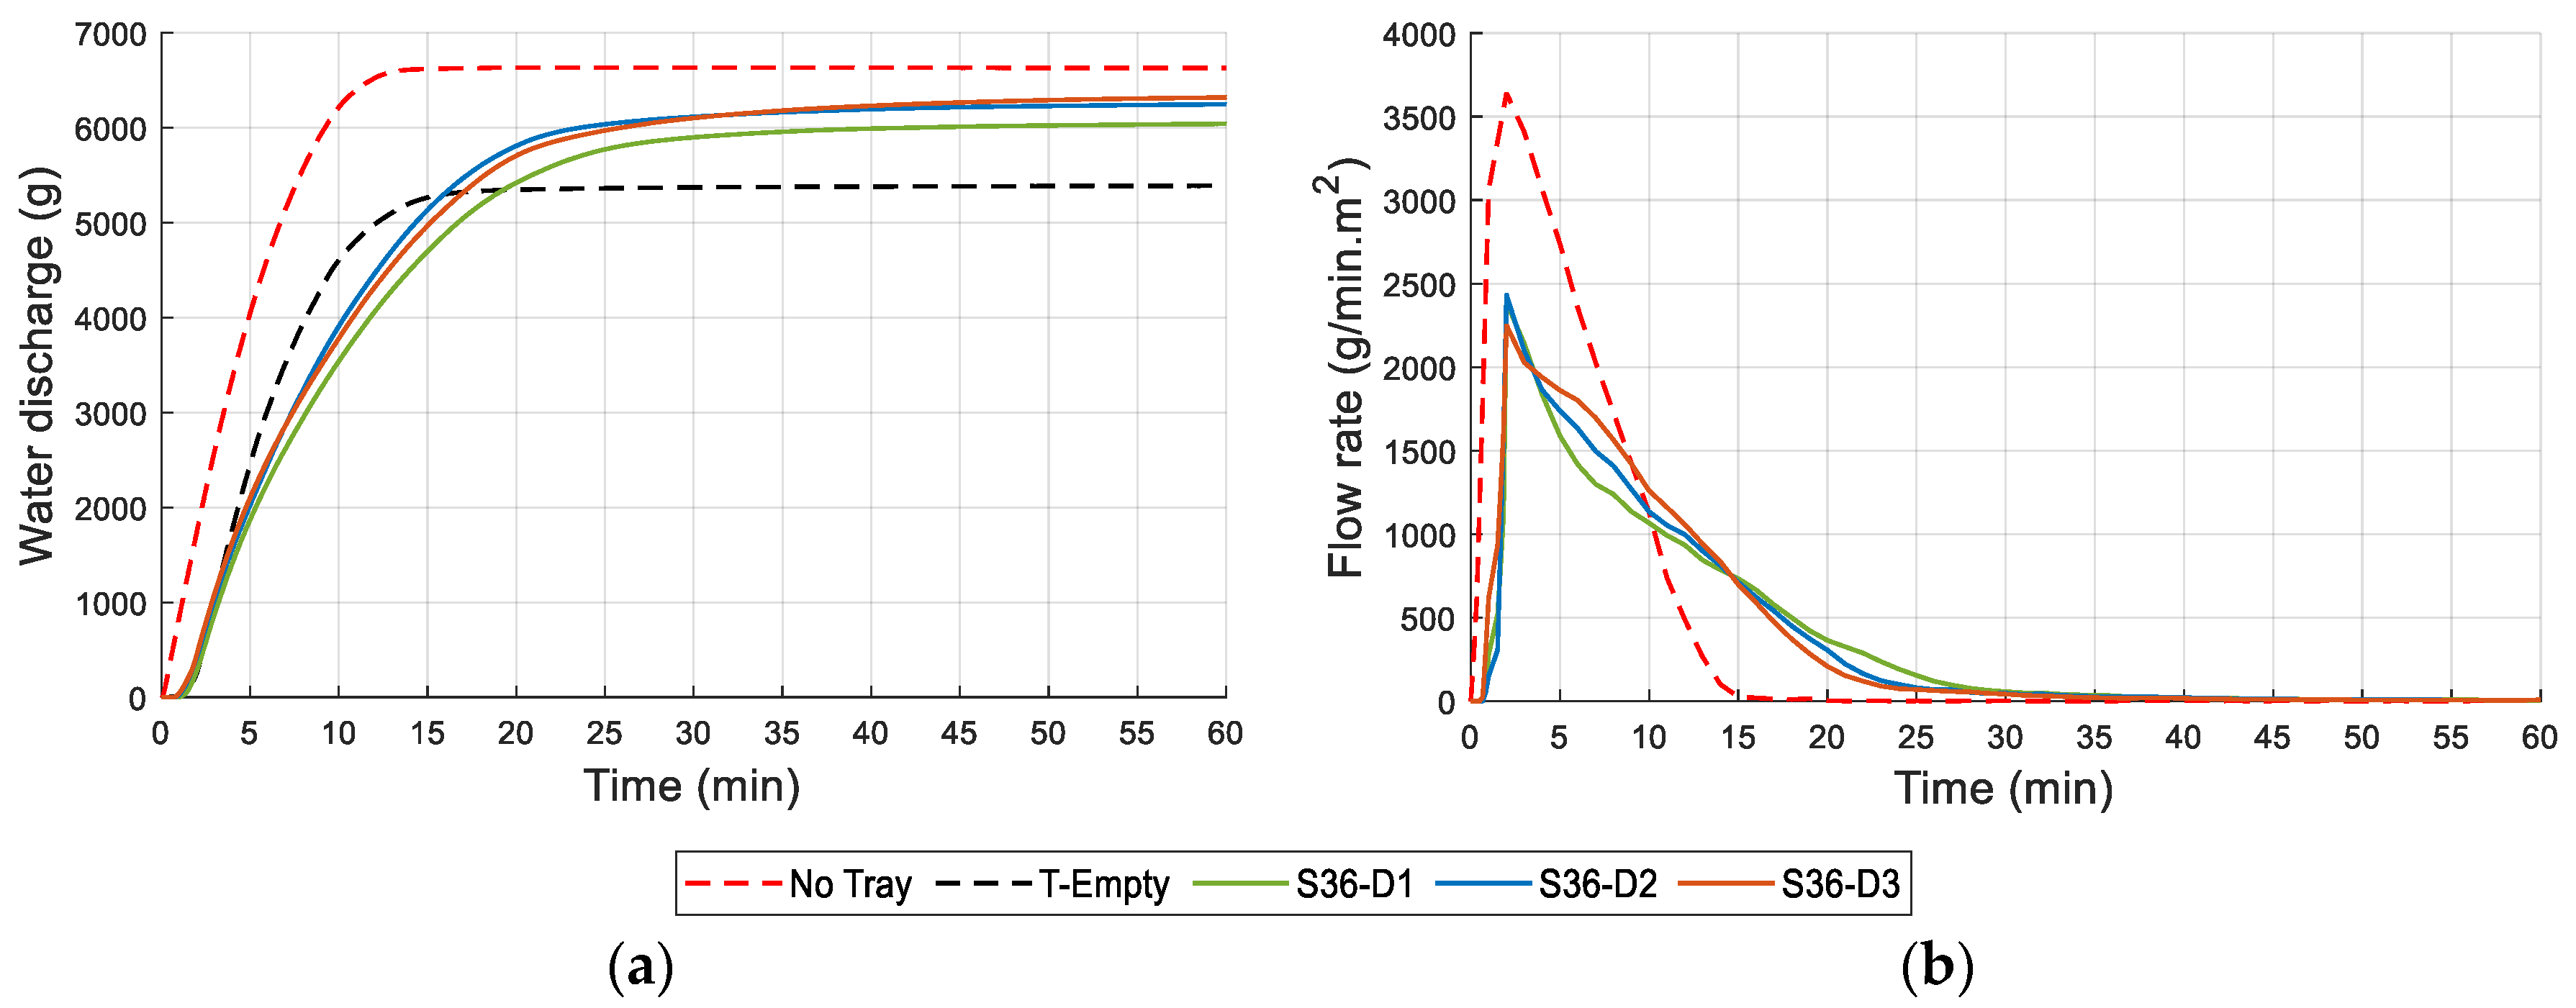
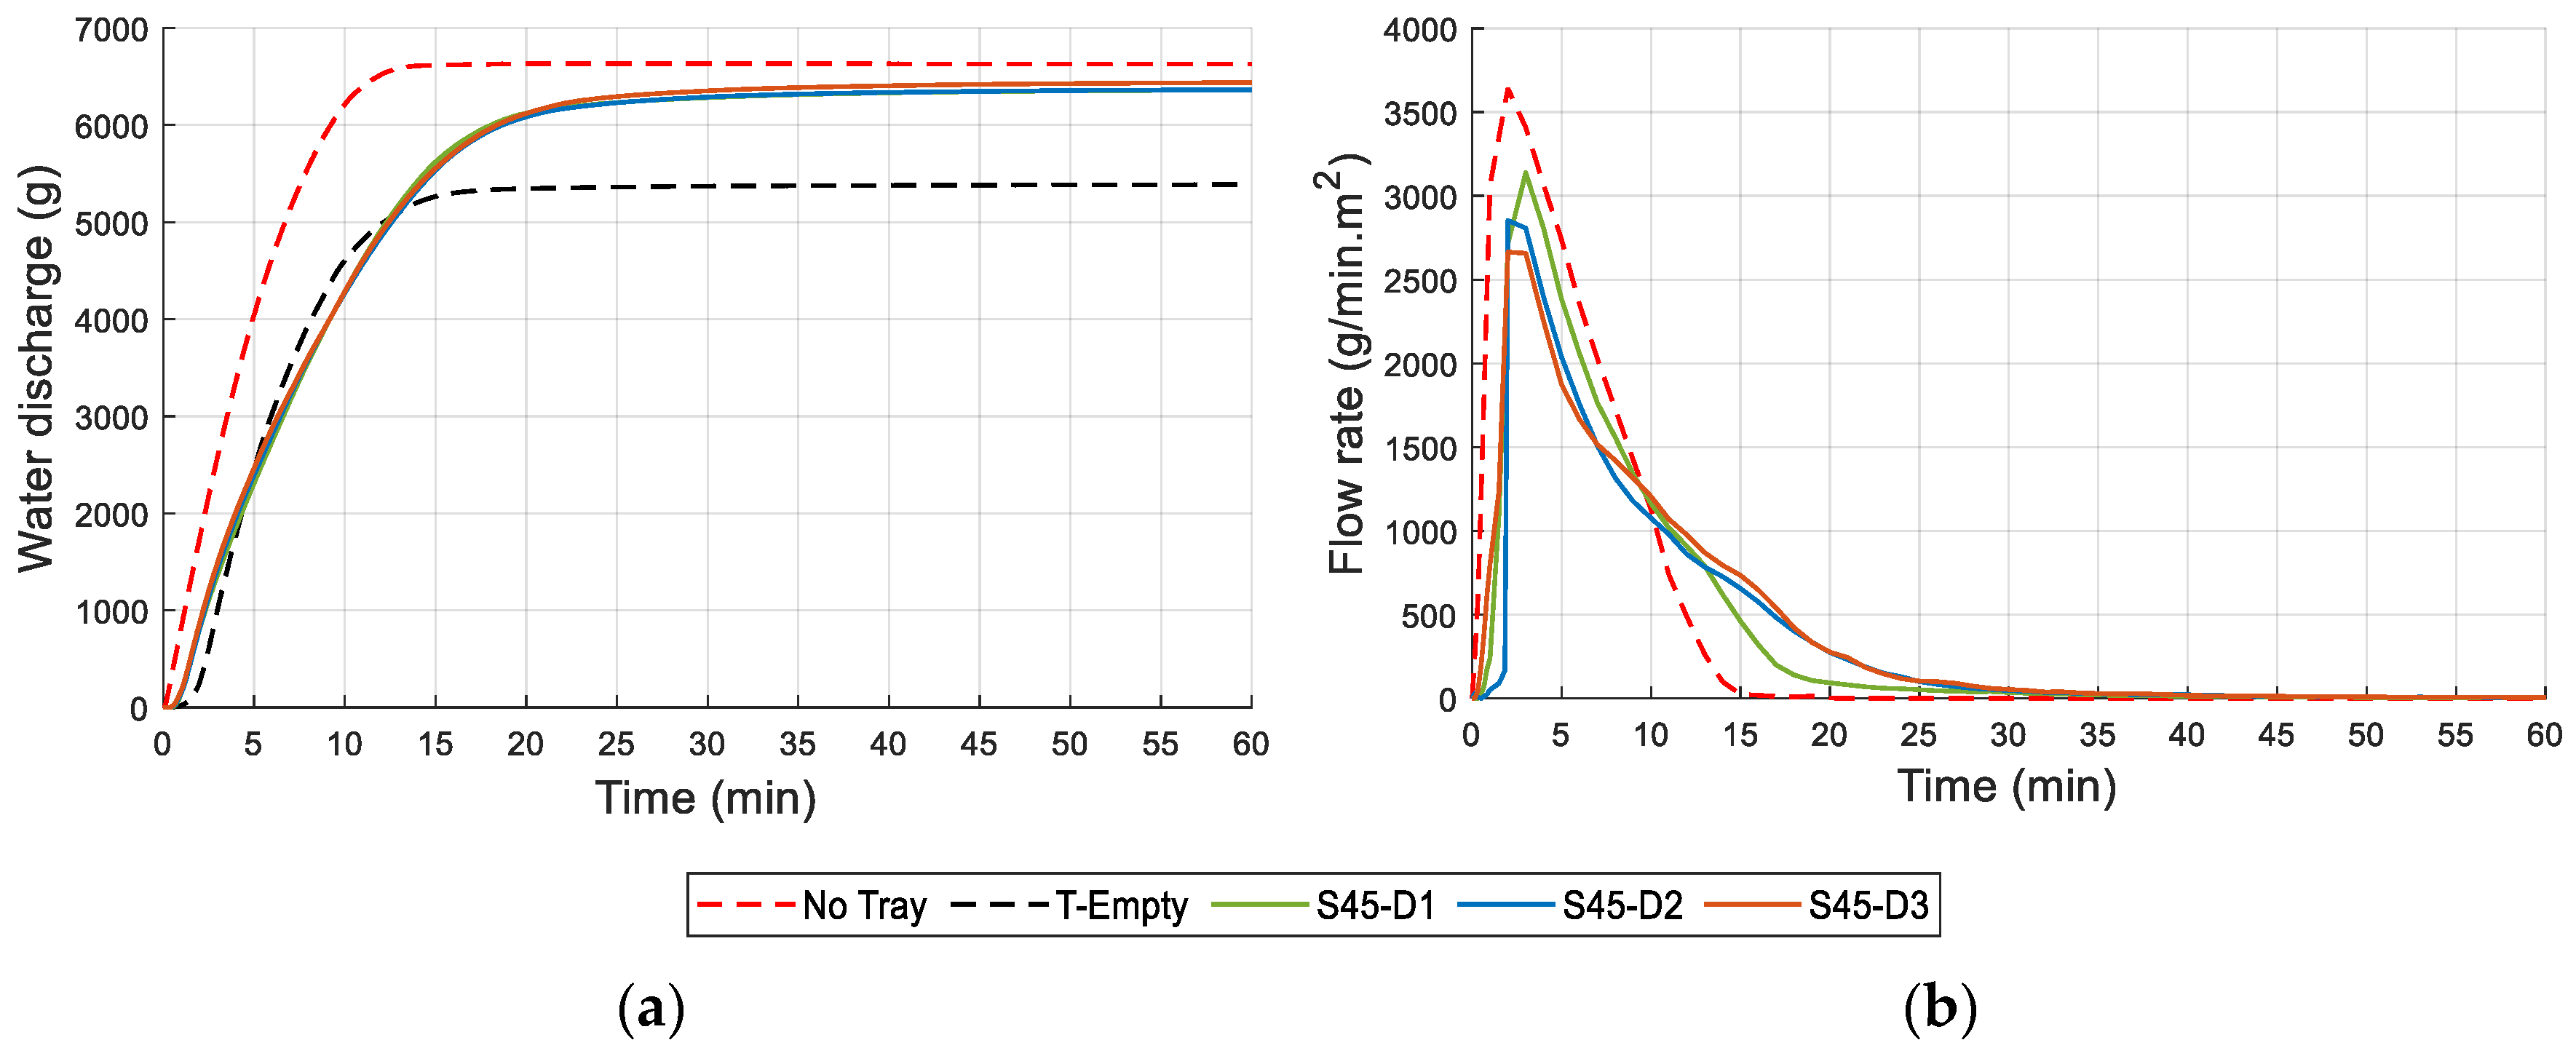
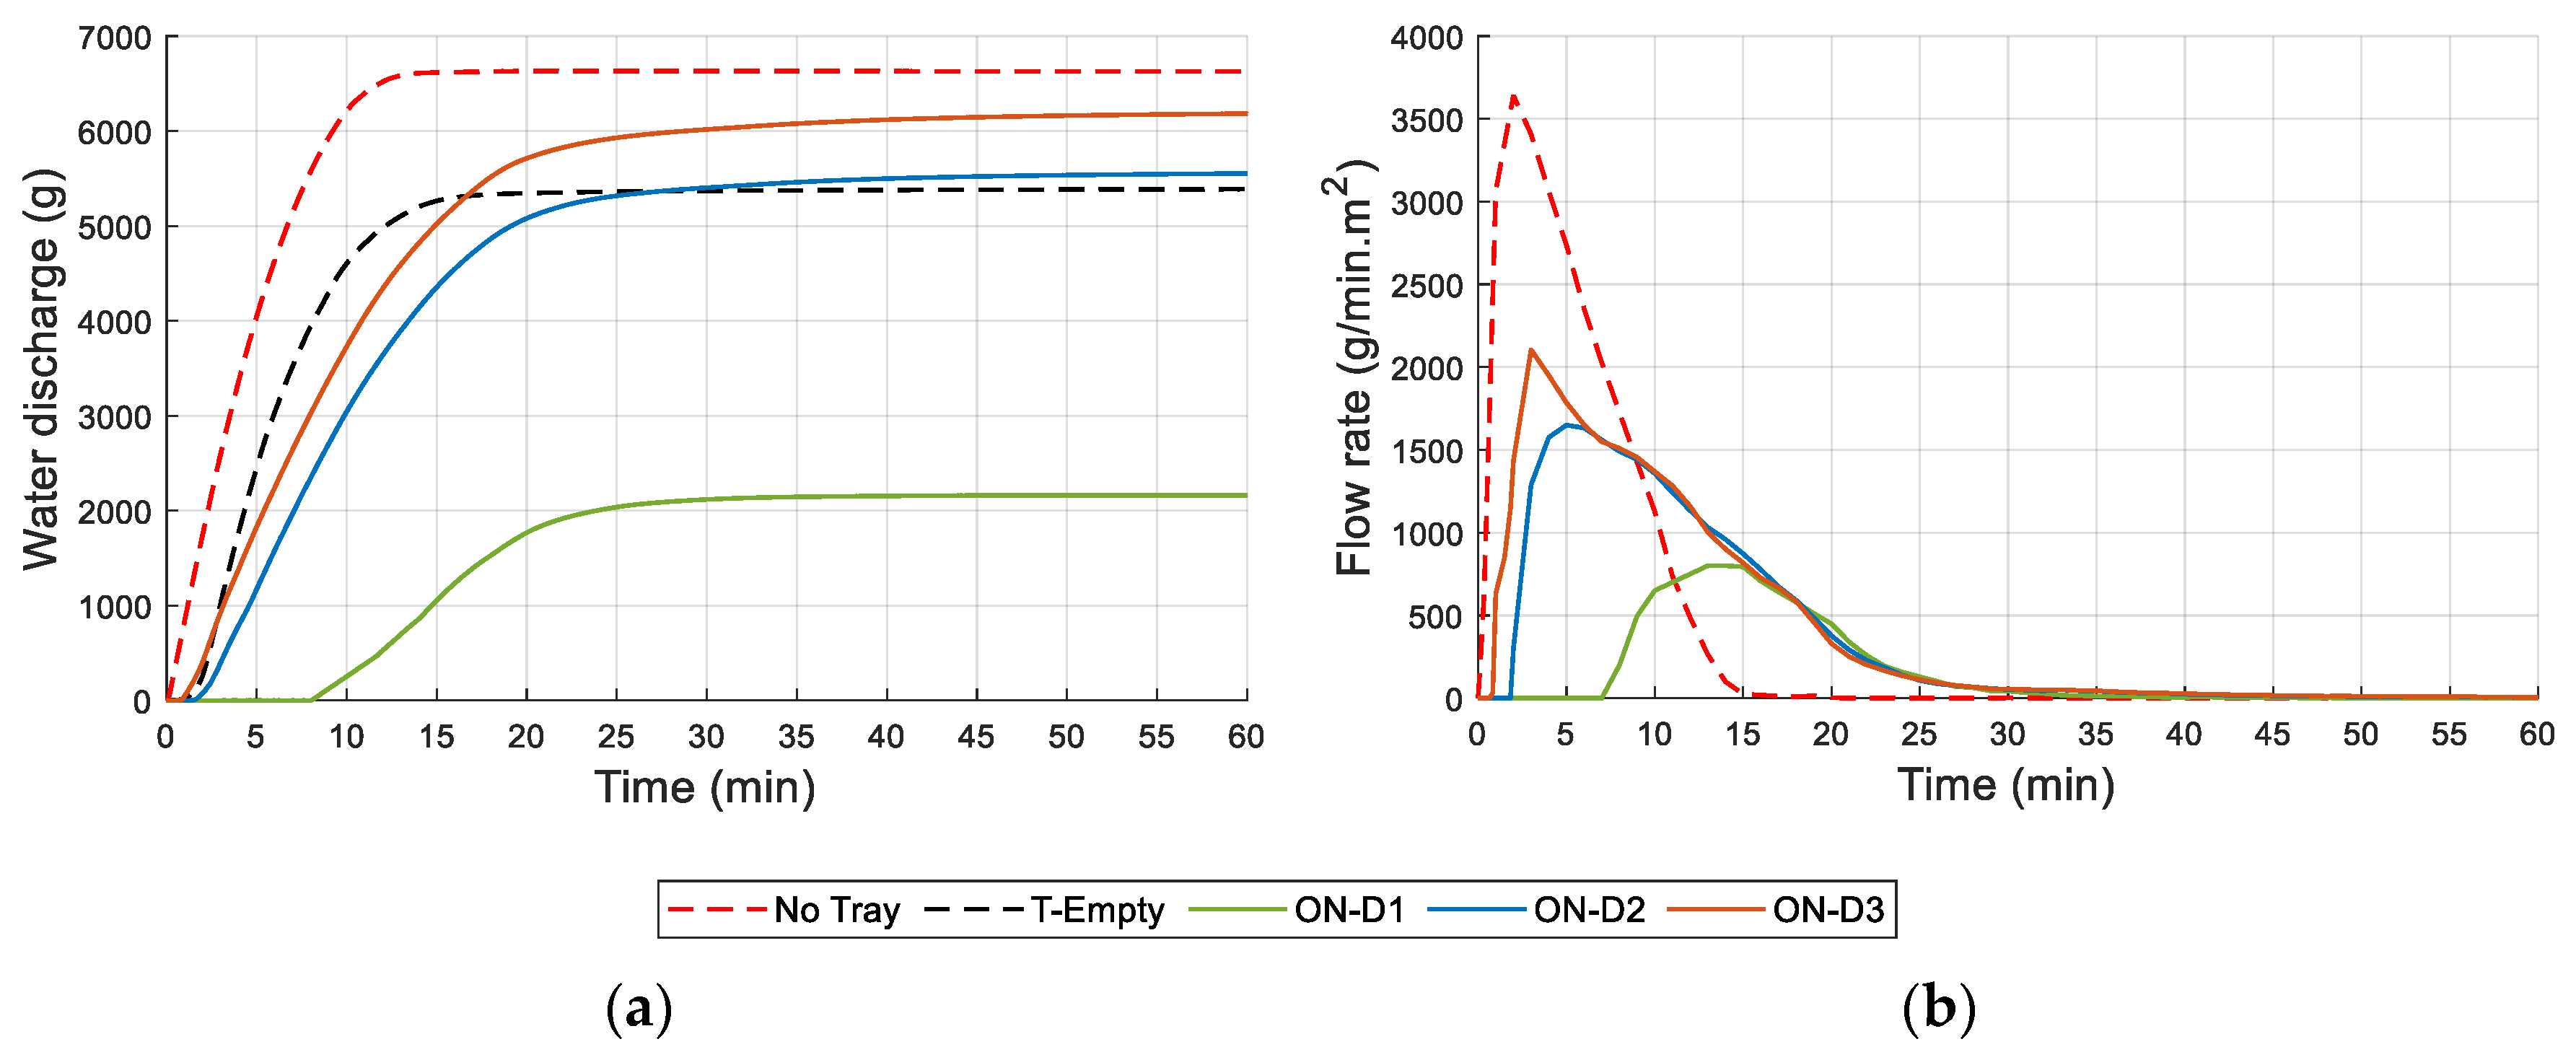
3.6. Drainage and Water Retention

The purpose of this test was to determine the water drainage retention capacity of substrates when subjected to a 15 min water discharge that simulated a rain event. This test was carried out only for the four selected substrates: ON (reference), S35, S36, and S45, which were previously saturated (according to the FLL Guidelines). Figure 14 presents the accumulated drained water and the corresponding flow rate for the reference substrate ON. To compare the accumulated and retained water as a function of time, two reference profiles were used. The red curve represents the discharge without a tray and the black curve corresponds to the discharge with an empty tray (Figure 14a). For the flow rate, a reference curve (black curve) was determined as a function of time, which corresponds to the discharge without a tray (Figure 14b).
In the first discharge, the system drained about 92% of the total water applied, retaining about 8% of the water. In the following discharges, a lower percentage of water retention is noted, around 4% of the total water applied. The high repeatability of the system behaviour is also seen in the similarity of the curves of discharges two and three. Figure 14b) shows that the maximum peak flow rate per square meter of the system is lower than the reference curve, which leads to a delay in the flow. Figure 15 shows the experimental results for the drainage and retention of water for substrate S35. In the first discharge, the system presented a drainage capacity of around 95% of the total water applied and retained about 5%. Contrary to expectations, in the following discharges, a higher percentage of water retention was recorded, around 6% to 10% of the total applied (Figure 15a). For the flow rate, as also happened in the reference substrate ON, the maximum peak flow rate of the system is lower than the reference curve, leading to a delay in the flow.
Figure 16 displays the experimental results for substrate S36. As expected, in the first discharge, the system retained approximately 10% of the water applied. In the following discharges, the retention was lower; this may be due to substrate saturation. In terms of drainage capacity, S36 was able to drain around 89% of the water in the first discharge and over 90% in the remaining ones (Figure 16a). As already observed in the other two substrates (ON and S35), the flow rate remained lower than the reference curve (without tray), reinforcing the peak flow delay (Figure 16b).
Figure 17 presents the experimental results for substrate S45. It is observed that the system presents the same behaviour for the three applied water discharges, which was not verified in the previous substrates (ON, S35, and S36). Based on the results obtained for the total water drained, substrate S45 drained approximately 95% of the applied water (Figure 17a). The results for the flow rate follow what has already been observed for the previous substrates (Figure 17b).
The authors decided to carry out a test on the reference substrate ON for comparison purposes and to evaluate the behaviour of the substrate when subjected to a discharge of water in an almost dry condition. Figure 18 shows the experimental results for the accumulated drained water. As expected, in almost dry conditions, the reference substrate ON had a higher water retention capacity due to its low initial water content. In this case, in the first discharge, the system drained about 32% of the water applied and retained 68%, presenting, as would be expected, a greater water retention capacity. In subsequent discharges, its retention capacity decreased to values between 8% and 18%.

3.7. Final Remarks

For the thermal conductivity, our results point to an increase in thermal conductivity with moisture content, the difference being more evident in substrates in the saturated state. The influence of temperature and apparent density was also evaluated. As expected, thermal conductivity increased slightly with temperature and more with increasing apparent density. For future support of researchers, taking into account the results presented in Section 3.1, the following correlations of thermal conductivity in function to water content can be used in computer simulations:
λ D r y = 4 e 5 · u + 0.0685
λ 23 / 50 = 7 e 5 · u + 0.0534
λ S a t u r a t e d = 2 e 4 · u + 0.073
where λ (W/(m.K)) is the thermal conductivity and u (kg/m3) is the water content.
For the dry state and for the saturated state, the results obtained are lower than those found in the literature review. For example, the literature review showed values between 0.10 and 0.25 W/(m·°C) for the dry state, compared to values lower than 0.10 obtained in this work.
Concerning the dynamic thermal behaviour, specific heat was obtained. The results confirm the influence of the moisture content present in the substrates, with a higher value of specific heat being recorded for the samples with higher moisture content. However, for the substrate S45, a significant difference was observed between the dry state and at (23 ± 2 °C)/(50 ± 5%) condition results, which were 536 J/(kg °C) and 2069 J/(kg °C), respectively, and in line with those found in the literature. This variability, in addition to the presence of water, could also be due to the sample’s heterogeneity.
The measured emissivity values highlighted that the material’s moisture content also has a significant influence on the results. The highest emissivity values were found for substrates in the saturated state, with values close to 1.
The values of water vapour permeability of the studied substrates were generally similar. The highest values of water vapour permeability were found for substrates ON, S13, S35, and S36.
Regarding hygroscopicity, in the test carried out for substrates ON, S35, S36, and S45, it was concluded that the substrate ON has the greatest increase in humidity, of about 12%, in relation to the dry state at (23 ± 0.5 °C).
Finally, regarding the water drainage retention capacity, the authors concluded that the systems have a similar drainage profile, with a higher retention rate in the first discharge, excluding systems with substrates S45 and S35. Based on the results presented, it can be concluded that the flow rate in substrates ON and S45 are similar, with values higher than 2500 g/(min∙m2). Substrates S35 and S36 had flow rate values higher than 1500 g/(min∙m2) and 2000 g/(min∙m2), respectively.
The results do not show any statistical correlation between the composition of the inorganic part and the thermal properties, only indicating a slight increase in thermal conductivity for almost all compositions when compared to the reference substrates.

4. Conclusions

Different ecological substrates for use in green roof systems were developed and characterised with the aim of obtaining relevant parameters to demonstrate the advantages of their application in building solutions. These parameters will also be important when used in numerical models. The use of these ecological substrates composed of organic and inorganic residues can help with waste management, with the additional advantage of bringing benefits to the environment. Regarding thermal conductivity, specific heat capacity, and emissivity, the influence of the moisture content on the behaviour of the substrates should be highlighted, as stated in the previous section.
The results of the experimental characterisation show that the ecological substrates developed can be used in green roofs. Further research should be carried out, taking into consideration the compatibility of plants using the ecological substrates, the life cycle assessment, and economic viability.

Author Contributions

Conceptualisation, J.A. and N.S.; Data curation, K.C.; Investigation, K.C., J.A., F.C., A.R., P.P. and N.S.; Methodology, K.C., J.A. and N.S.; Resources, T.T. and P.P.; Supervision, J.A. and N.S.; Writing—original draft, K.C.; Writing—review and editing, J.A., F.C., A.R., P.P. and N.S. All authors have read and agreed to the published version of the manuscript.

Funding

This work was developed under the EGR (EcoGreenRoof) project (POCI-01-0247-FEDER-033728) and the GREENFUTURE project (POCI-01-0246-FEDER-181322) co-funded by the European Regional Development Fund through Compete2020.

Conflicts of Interest

The authors declare no conflict of interest.

References

  1. United Nations (UB). Global Perspective Human Stories. 2019. Available online: https://news.un.org/pt/story/2019/02/1660701 (accessed on 6 December 2021).
  2. Reuters in Geneva, More than 7000 Extreme Weather Events Recorded Since 2000, Says UN, Guard. 2020. Available online: https://www.theguardian.com/world/2020/oct/12/un-highlights-dramatic-global-rise-in-extreme-weather-since-2020 (accessed on 6 December 2021).
  3. Global Status Report for Buildings and Construction. Towards a Zero-Emissions, Efficient and Resilient Buildings, and Construction Sector. UN Environment Programme. 2021. Available online: https://globalabc.org/sites/default/files/2021-10/GABC_Buildings-GSR-2021_BOOK.pdf (accessed on 6 December 2021).
  4. Zhang, S.; Lin, Z.; Zhang, S.; Ge, D. Stormwater retention and detention performance of green roofs with different substrates: Observational data and hydrological simulations. J. Environ. Manag. 2021, 291, 112682. [Google Scholar] [CrossRef] [PubMed]
  5. Jing, X.; Zhang, S.; Zhang, W.; Wang, Y.; Yue, T. Analysis and modelling of stormwater control volume control performance of rainwater harvesting systems in four climatic zones of China. Water Resour. Manag. 2018, 32, 2649–2664. [Google Scholar] [CrossRef]
  6. Tabatabaee, S.; Mahdiyar, A.; Durdyev, S.; Mohandes, S.; Ismail, S. An assessment model of benefits, opportunities, costs, and risks of green roof installation: A multi criteria decision making approach. J. Clean. Prod. 2019, 238, 117956. [Google Scholar] [CrossRef]
  7. Johnson, D.; Exl, J.; Geisendorf, S. The Potential of Stormwater Management in Addressing the Urban Heat Island Effect: An Economic Valuation. Sustainability 2021, 13, 8685. [Google Scholar] [CrossRef]
  8. Barriuso, F.; Urbano, B. Green Roofs and Walls Design Intended to Mitigate Climate Change in Urban Areas across All Continents. Sustainability 2021, 13, 2245. [Google Scholar] [CrossRef]
  9. Nastran, M.; Kobal, M.; Eler, K. Urban heat islands in relation to green land use in European cities. Urban For. Urban Green. 2019, 37, 33–41. [Google Scholar] [CrossRef] [Green Version]
  10. Park, J.; Shin, Y.; Kim, S.; Lee, S.; An, K. Efficient plant types and coverage rates for optimal green roof to reduce urban heat island effect. Sustainability 2022, 14, 2146. [Google Scholar] [CrossRef]
  11. Korol, E.; Shushunova, N.; Feoktistova, O.; Shushunova, T.; Rubtsov, O. Technical and economical factors in green roof using to reduce the aircraft noise. International Science Conference SPbWOSCE-2017 “Business Technologies for Sustainable Urban Development”, Russia, 20–22 December 2017. In MATEC Web of Conferences; EDP Sciences: Les Ulis, France, 2018. [Google Scholar] [CrossRef] [Green Version]
  12. Connelly, M.; Hodgson, M. Experimental investigation of the sound absorption characteristics of vegetated roofs. Build. Environ. 2015, 92, 335–346. [Google Scholar] [CrossRef]
  13. Renterghem, V. Green roofs for noise reduction: Literature review and new approaches. In 46th International Congress and Exposition on Noise Control Engineering; Inter-Noise: Hong Kong, China, 2017. [Google Scholar]
  14. Lundholm, J. Green roof plant species diversity improves ecosystem multifunctionality. J. Appl. Ecol. 2015, 52, 726–734. [Google Scholar] [CrossRef]
  15. Susca, T. Green roofs to reduce building energy use? A review on key structural factors of green roofs and their effects on urban climate. Build. Environ. 2019, 162, 106273. [Google Scholar] [CrossRef]
  16. Simões, N.; Almeida, R.; Tadeu, A.; Brett, M.; Almeida, J. Comparison between cork-based and conventional green roof solutions. Build. Environ. 2020, 175, 106812. [Google Scholar] [CrossRef]
  17. Young, T.; Cameron, D.; Sorrill, J.; Edwards, T.; Phoenix, G. Importance of different components of green roof substrate on plant growth and physiological performance. Urban For. Urban Green. 2014, 13, 507–516. [Google Scholar] [CrossRef] [Green Version]
  18. Eksi, M.; Rowe, B. Green roof substrates: Effect of recycled crushed porcelain and foam glass on plant growth and water retention. Urban For. Urban Green. 2016, 20, 81–88. [Google Scholar] [CrossRef] [Green Version]
  19. Coma, J.; Gracia, A.; Cháfer, M.; Pérez, G.; Cabeza, L. Thermal characterization of different substrates under dried conditions for extensive green roofs. Energy Build. 2017, 144, 175–180. [Google Scholar] [CrossRef] [Green Version]
  20. Tadeu, A.; Škerget, L.; Almeida, J.; Simões, N. Canopy contribution to the energy balance of a building’s roof. Energy Build. 2021, 244, 111000. [Google Scholar] [CrossRef]
  21. Zhao, M.; Tabares-Velasco, P.; Srebric, J.; Komarneni, S.; Berghage, R. Effects of plant and substrate selection on thermal performance of green roofs during the summer. Build. Environ. 2014, 78, 199–211. [Google Scholar] [CrossRef]
  22. Pianella, A.; Clarke, R.; Williams, N.; Chen, Z.; Aye, L. Steady-state and transient thermal measurements of green roof substrates. Energy Build. 2016, 131, 123–131. [Google Scholar] [CrossRef]
  23. Kazemi, M.; Courard, L.; Attia, S. Water permeability, water retention capacity, and thermal resistance of green roof layers made with recycled and artificial aggregates. Build. Environ. 2023, 227, 109776. [Google Scholar] [CrossRef]
  24. Kazemi, M.; Courard, L.; Hubert, J. Coarse recycled materials for the drainage and substrate layers of green roof system in dry condition: Parametric study and thermal heat transfer. J. Build. Eng. 2022, 45, 103487. [Google Scholar] [CrossRef]
  25. Baryla, A.; Karczmarczyk, A.; Bus, A. Role of substrates used for green roofs in limiting rainwater runoff. J. Ecol. Eng. 2018, 19, 86–92. [Google Scholar] [CrossRef]
  26. Xue, M.; Farrell, C. Use of organic wastes to create lightweight green roof substrates with increased plant-available water. Urban For. Urban Green. 2020, 48, 126569. [Google Scholar] [CrossRef]
  27. Yang, M.; Dong, W.; Cheng, R.; Wang, H.; Zhao, Z.; Wang, F.; Wang, Y. Effect of highly efficient substrate modifier, super-absorbent polymer, on the performance of the green roof. Sci. Total Environ. 2022, 806, 150638. [Google Scholar] [CrossRef]
  28. Giacomello, E.; Gaspari, J. Hydrologic Performance of an Extensive Green Roof under Intensive Rain Events: Results from a Rain-Chamber Simulation. Sustainability 2021, 13, 3078. [Google Scholar] [CrossRef]
  29. Forschungsgesellschaft Landschaftsentwicklung Landschaftsbau e.V. (Landscape Development and Landscaping Research Society). Green Roof Guidelines. Guidelines for the Planning, Construction and Maintenance of Green Roofs; Landscape Development and Landscaping Research Socitety: Bonn, Germany, 2018. [Google Scholar]
  30. EAD 220009-00-0401: 2015-04; Kits for Green Roofs, Edition 03/2021. EOTA European Organisation for Technical Assessment: Brussels, Belgium, 2021.
  31. ISO 8302:1991; Thermal Insulation—Determination of Steady-State Thermal Resistance and Related Properties—Guarded Hot Plate Apparatus. ISO: Geneva, Switzerland, 1991.
  32. European Standard EN 12664:2001; Thermal Performance of Building Materials and Products—Determination of Thermal Resistance by Means of Guarded Hot Plate and Heat Flow Meter Methods—Dry and Moist Products of Medium and Low Thermal Resistance. CEN-CENELEC: Brussels, Belgium, 2001.
  33. Simões, I.; Simões, N.; Tadeu, A. Thermal delay simulation in multilayer systems using analytical solutions. Energy Build. 2012, 49, 631–639. [Google Scholar] [CrossRef]
  34. Marques, B.; Tadeu, A.; Almeida, J.; António, J.; Brito, J. Characterisation of sustainable building walls made from rice straw bales. J. Build. Eng. 2020, 28, 101041. [Google Scholar] [CrossRef]
  35. Gonçalves, M.; Simões, N.; Serra, C.; Flores-Colen, I.; Rottenbacher, K.; Almeidad, F. Study of the edge thermal bridging effect in vacuum insulation panels: Steady and unsteady-state approaches using numerical and experimental methods. Energy Build. 2022, 258, 111821. [Google Scholar] [CrossRef]
  36. Kononogova, E.; Adibekyan, A.; Monte, C.; Hollandt, J. Characterization, calibration, and validation of an industrial emissometer. J. Sens. Sens. Syst. 2019, 8, 233–242. [Google Scholar] [CrossRef] [Green Version]
  37. ISO 12572:2016; Hygrothermal Performance of Building Materials and Products—Determination of Water Vapour Transmission Properties—Cup Method. ISO: Geneva, Switzerland, 2016.
  38. ISO 12571:2013; Hygrothermal Performance of Building Materials and Products—Determination of Hygroscopic Sorption Properties. ISO: Geneva, Switzerland, 2013.
  39. Ferrer, G.; Barreneche, C.; Solé, A.; Martorell, I.; Cabeza, L. New proposed methodology for specific heat capacity determination of materials for thermal energy storage (TES) by DSC. J. Energy Storage 2017, 11, 1–6. [Google Scholar] [CrossRef] [Green Version]
  40. Schiavoni, S.; D’Alessandro, F.; Bianchi, F.; Asdrubali, F. Insulation materials for the building sector: A review and comparative analysis. Renew. Sust. Energ. Rev. 2016, 62, 988–1011. [Google Scholar] [CrossRef]
Figure 1. Substrate samples under study: (a) ON (reference substrate); (b) OL (reference substrate); (c) S1; (d) S2; (e) S3, (f) S4; (g) S5; (h) S6; (i) S7; (j) S8; (k) S9; (l) S10; (m) S11; (n) S12; (o) S13; (p) S35; (q) S36; (r) S45.
Sustainability 15 00575 g001
Figure 2. Thermal conductivity tests: (a) guarded hot plate apparatus; (b) overview of test sample inserted in the insulation frame; (c) dimensions and metering area of the sample.
Sustainability 15 00575 g002
Figure 3. Experimental setup used to determine the specific heat: (a) guarded hot plate inside a climatic chamber; (b) position of thermocouples at system interfaces (red dots).
Sustainability 15 00575 g003
Figure 4. Assembly of the test sample: (a) support structure for the equipment; (b) test sample; (c) complete sample setup; (d) positioning of the emissometer for the test.
Sustainability 15 00575 g004
Figure 5. Sample preparation for water vapour permeability determination: (a) placement of silicone to glue the permeable fabric; (b) bonding the permeable fabric to the frame; (c) metallic cup with silica gel (desiccant); (d) sealing both metallic cups; (e) placement of the substrate sample; (f) complete test sample.
Sustainability 15 00575 g005
Figure 6. Preparation of test samples: (a) propylene tray (500 mm × 500 mm × 100 mm); (b) Lightweight Expanded Clay Aggregate (LECA); (c) geotextile filter; (d) substrate.
Sustainability 15 00575 g006
Figure 7. Experimental apparatus used for water drainage and retention capacity tests.
Sustainability 15 00575 g007
Figure 8. Variation of thermal conductivity of the substrate samples with moisture content at 10 °C.
Sustainability 15 00575 g008
Figure 9. Variation of the thermal conductivity of the substrates with the apparent density at 10 °C: (a) dry state; (b) saturated state.
Sustainability 15 00575 g009
Figure 10. Emissivity for the eighteen substrates considering the different moisture contents: dry state, (23 ± 2 °C)/(50 ± 5%), and saturated. The whiskers represent the standard deviation found in the nine measurements.
Sustainability 15 00575 g010
Figure 11. Comparative analysis of the values for water vapour permeability, δ, and water vapour diffusion resistance factor, μ, for the set of eighteen substrates under study.
Sustainability 15 00575 g011
Figure 12. Substrates used to determine the hygroscopic curves (adsorption and desorption): (a) S35; (b) S36; (c) S45; (d) reference substrate.
Sustainability 15 00575 g012
Figure 13. Sorption curves for substrates: (a) ON (reference); (b) S35; (c) S36; (d) S45.
Sustainability 15 00575 g013
Figure 14. Accumulated water and flow rate for the three discharges (D1, D2, D3) applied within a period of 60 min to reference substrate ON: (a) accumulated drained water; (b) flow rate.
Sustainability 15 00575 g014
Figure 15. Accumulated water and flow rate for the three discharges (D1, D2, D3) applied within a period of 60 min for substrate S35: (a) accumulated drained water; (b) flow rate.
Sustainability 15 00575 g015
Figure 16. Accumulated water and flow rate for the three discharges (D1, D2, D3) applied within a period of 60 min for substrate S36: (a) accumulated drained water; (b) flow rate.
Sustainability 15 00575 g016
Figure 17. Accumulated water and flow rate for the three discharges (D1, D2, D3) applied within a period of 60 min for substrate S45: (a) accumulated drained water; (b) flow rate.
Sustainability 15 00575 g017
Figure 18. Accumulated water for the three discharges (D1, D2, D3) applied within a period of 60 min for reference substrate ON in almost dry conditions: (a) accumulated drained water; (b) flow rate.
Sustainability 15 00575 g018
Table 1. Formulations of the tested substrates with waste-derived materials (in %).
SubstrateCompostForest ResiduesBlond PeatCoco PeatIron SlagSteel SlagRefractoriesGeopolymer
S1205151000050
S22051510400100
S32051510400010
S420515102020100
S520515102020010
S620515101010300
S720515101010030
S82051510003020
S92051510002030
S102051510001535
S112051510003515
S122051510040100
S132051510040010
S3520515102515100
S36205151000500
S45205151010101020
Table 2. Specific heat capacity results for substrates ON (reference) and S45 using the indirect method.
Specific Heat Capacity, Cp, dry Specific Heat Capacity, Cp, (23,50)
[J/(kg °C)][J/(kg °C)]
ON14131658
S455362069
Table 3. Water vapour transmission properties.
Water Vapour Permeance, WWater Vapour Resistance, ZWater Vapour
Permeability, δ
Water Vapour Diffusion
Resistance Factor, μ
[mg/(m2·h·Pa)][(m2·h·Pa)/mg][mg/(m·h·Pa)]-
ON4.000.250.203.55
OL3.700.270.183.84
S12.590.390.135.49
S22.570.390.135.53
S32.420.410.125.87
S42.550.390.135.56
S52.940.340.154.83
S62.750.360.145.16
S73.270.310.164.34
S82.790.360.145.10
S93.000.330.154.73
S103.360.300.174.22
S113.860.260.193.68
S123.330.300.174.26
S135.500.180.282.58
S352.810.360.145.05
S364.160.240.213.42
S454.900.240.213.39
Disclaimer/Publisher’s Note: The statements, opinions and data contained in all publications are solely those of the individual author(s) and contributor(s) and not of MDPI and/or the editor(s). MDPI and/or the editor(s) disclaim responsibility for any injury to people or property resulting from any ideas, methods, instructions or products referred to in the content.

