Article

Experimental Study on the Influence of New Permeable Spur Dikes on Local Scour of Navigation Channel

1
National Engineering Research Center of Port Hydraulic Construction Technology, TIWTE, Tianjin 300456, China
2
China Harbor Engineering Company Ltd., Beijing 100027, China
3
College of River and Ocean Engineering, Chongqing Jiaotong University, Chongqing 400074, China
*
Author to whom correspondence should be addressed.
Sustainability 2023, 15(1), 570; https://doi.org/10.3390/su15010570
Submission received: 24 November 2022 / Revised: 16 December 2022 / Accepted: 23 December 2022 / Published: 29 December 2022
(This article belongs to the Section Sustainable Engineering and Science)

Abstract

:
The depths and areas of the scour holes around spur dikes are the most concerning issues regarding spur dike design. In this study, using a moving bed experiment, the influence of traditional rock-fill spur dikes and new permeable spur dikes with different permeabilities on riverbed scour under unsteady flow was studied, and the spatial characteristics of scour holes at dike heads were analyzed. The results show that with increases in the permeability coefficient of the spur dike, the depth and area of the scour hole at the dike head gradually decreases; however, when the permeability coefficient is more than 17.6%, the depth and area of the scour hole downstream of the dike body increases with an increase in the permeability coefficient. According to comprehensive evaluation, when the water permeability is 17.6%, the stability of the spur dike is at its best. The maximum depth of the scour hole at the dike head is affected by factors such as the spur dike permeability coefficient, effective scouring time, and width bottom protection structure. On this basis, a new formula for calculating the maximum depth of the scour hole at a dike head is proposed. These research results will be beneficial to the reliability of spur dikes and the sustainability of navigation channels.

1. Introduction

A spur dike is a hydraulic structure which is widely used to redirect the flow of water and protect river banks from flow scouring. After a spur dike is arranged in a channel, the original flow characteristics and sediment movement of the channel change, resulting in severe scouring of the riverbed around the dike head. The geometrical characteristics of the scour hole at a dike head are important factors affecting the stability of spur dike structure and navigational safety. From the perspective of science and engineering, it is of great significance to reduce riverbed scouring around spur dikes to maintain the reliability of spur dikes and the sustainability of navigation channels.
Scour occurs due to the erosive action of flowing water [1] and is the main cause of structural failures in spur dikes [2]. The scour depth of a spur dike mainly depends on the length of the spur dike, flow parameters, and sediment characteristics [3,4,5]. Haghnazar et al. [6] and Fazli et al. [7] believe that the discharge and the geometry of spur dikes were important factors affecting channel scour. Increasing the Froude number, the slope of a spur dike, or the length of a spur dike would lead to an increase in the maximum scour depth and scour hole size. Kuhnle et al. [8] showed that the scour amount and the geometry of scour holes around spur dikes are related to the submergence rate of spur dikes. Masjedi et al. [9] studied the influence of time on the local scour of spur dikes under different flow intensities. The research results showed that scour intensifies with increases in flow intensity, and that maximum scour depth highly depends on the test duration. Nasrollahi et al. [10] studied the local scour of spur dikes using physical model tests and found that the scour hole characteristics of spur dikes are related to Froude number, spur dike permeability, the ratio of water depth to dike length, and the ratio of river channel width to dike length.
The permeability of spur dikes is a very important feature for protecting the riverbed from scouring [11]. Zhou et al. [12] and Osman and Saeed [13] studied the flow structure and scouring characteristics of permeable spur dikes and found that, compared with impermeable spur dikes, permeable spur dikes can avoid excessive scouring of the main river channel, reduce the local scouring depth near the spur dikes, and allow for greater safety. Elawady et al. [14] and Nath and Misra [15] studied the influence of spur dike permeability on the depth, width, and length of scour holes around spur dikes. The results showed that the depth, width, and length of scour holes all increase with decreases in permeability. Li and Altinakar [16] studied the impact of permeable hydraulic gate spur dikes on channel scour using a movable bed physical model and measured the maximum scour depth at the head of spur dikes. The test showed that when the relative length of spur dikes was 0.2 and the permeability ratio was 30%, the best efficiency for reducing the scour depth at the head of the dike could be obtained.
According to previous research results, the maximum scour depths of spur dikes depend on several factors, such as riverbed sediment, flow conditions, spur dike geometry, scour time, and spur dike permeability. Many researchers have determined the role of these parameters through field observation, laboratory experiments, and numerical simulation [1,17,18]. Different scholars have obtained different calculation formulas for scour hole depth from their own perspectives. In an early study [19,20,21] into spur dike scour depth calculation formulae, only the influence of incoming flow conditions was considered. Koshla established a formula for spur dike scour depth calculation that includes flow velocity, unit flow, Froude number, and water depth [22]. With the deepening of research, most scholars consider the influences of inflow conditions, riverbed sediment, and spur dike size, such as the formula proposed by Gill, h s h 0   = 8.375 ( d 50 h 0 ) 0.25 ( B B     L ) 6 7 1 [23], in research on the scour depth of a riverbed composed of a natural granular sand mixture. Some researchers [24] believe that the scour hole depth is related to the competent velocity of sediment. Only when the flow velocity near the spur dike exceeds the competent velocity will scour holes appear. Based on this, the scour depth should be related to the current difference between approach velocity and competent velocity, such as in the formula proposed by Ying: h s H 0 = α 1 ( u max     u c gH 0 ) α 2 ( b 0 H 0 ) α 3 [25]. Some researchers believe that the duration of the scouring process is an additional parameter for the formation of scour holes, which is very important for the design of spur dikes. This is considered in the formula proposed by Pandy: d st R L = 0.02 ( F sm ) 1.68 ( l d 50 ) 0.28 ( log   T ) [26]. Kothyari et al. [27] found that erosion rate mainly depends on the difference between the starting point of the total bed shear stress and the critical bed shear stress and proposed a new method to calculate the temporal variation in erosion depth around the breakwater in non-viscous sediments. Recently, artificial intelligence techniques have been used to predict scour depth. Sign et al. [28], in conjunction with experimental studies, considered a new form of multi-level integrated machine learning (ML) to determine the critical shear stress (CSS) of gravel particles in clay–silt–gravel, clay–silt–gravel, and clay–sand–gravel viscous mixtures. Pandey et al. [29] developed three novel machine learning techniques, including a gradient boosting decision tree (GBDT), a cascading forward neural network (CFNN) and kernel ridge regression (KRR), to accurately predict scour depth in the spur dike zones.
The above research [19,20,21,22,23,24,25,26,27,28,29] mainly focuses on the formation mechanism of scour holes at spur dike heads under constant flow. The calculation formula for scour hole depth is mainly applicable to impermeable spur dikes and does not consider the influence of spur dike permeability and bottom protection structure. Spur dike design should not only meet the regulation function of the waterway, but also take into account ecological restoration. Therefore, the influence of permeability on the depth of dike head scour holes needs to be studied emphatically. Based on the overflow weir engineering structure curve of hydraulic engineering, a new type of permeable spur dike structure was designed. Through movable bed tests, the sediment scouring characteristics of existing rock-fill spur dikes and new permeable spur dikes with different permeabilities were studied, the morphological characteristics of the scour holes at dike heads were analyzed, and a formula for calculating the maximum depth of scour holes was proposed.

2. Materials and Methods

The experiment was carried out in a rectangular concrete flume, which was 30 m long and 3 m wide. Natural quartz sand configured according to a natural granular composition with a d50 of 0.15 mm was selected as the model sand. Sand with a length of 15 m and a thickness of 0.3 m was laid in the test observation section. The experiment site and layout are shown in Figure 1.
The experiment used rock-fill spur dike as a comparison group to study the influence of the permeability capacity of spur dikes on the channel scour; therefore, the experimental flow discharge process and the length of spur dikes were fixed, and the inclination of the spur dike with the flow direction remained unchanged at 90°. In the test observation, the position of the dike axis was taken as the observation origin and the flow direction was in the positive direction.

2.1. Rock-Fill Spur Dike Model Design

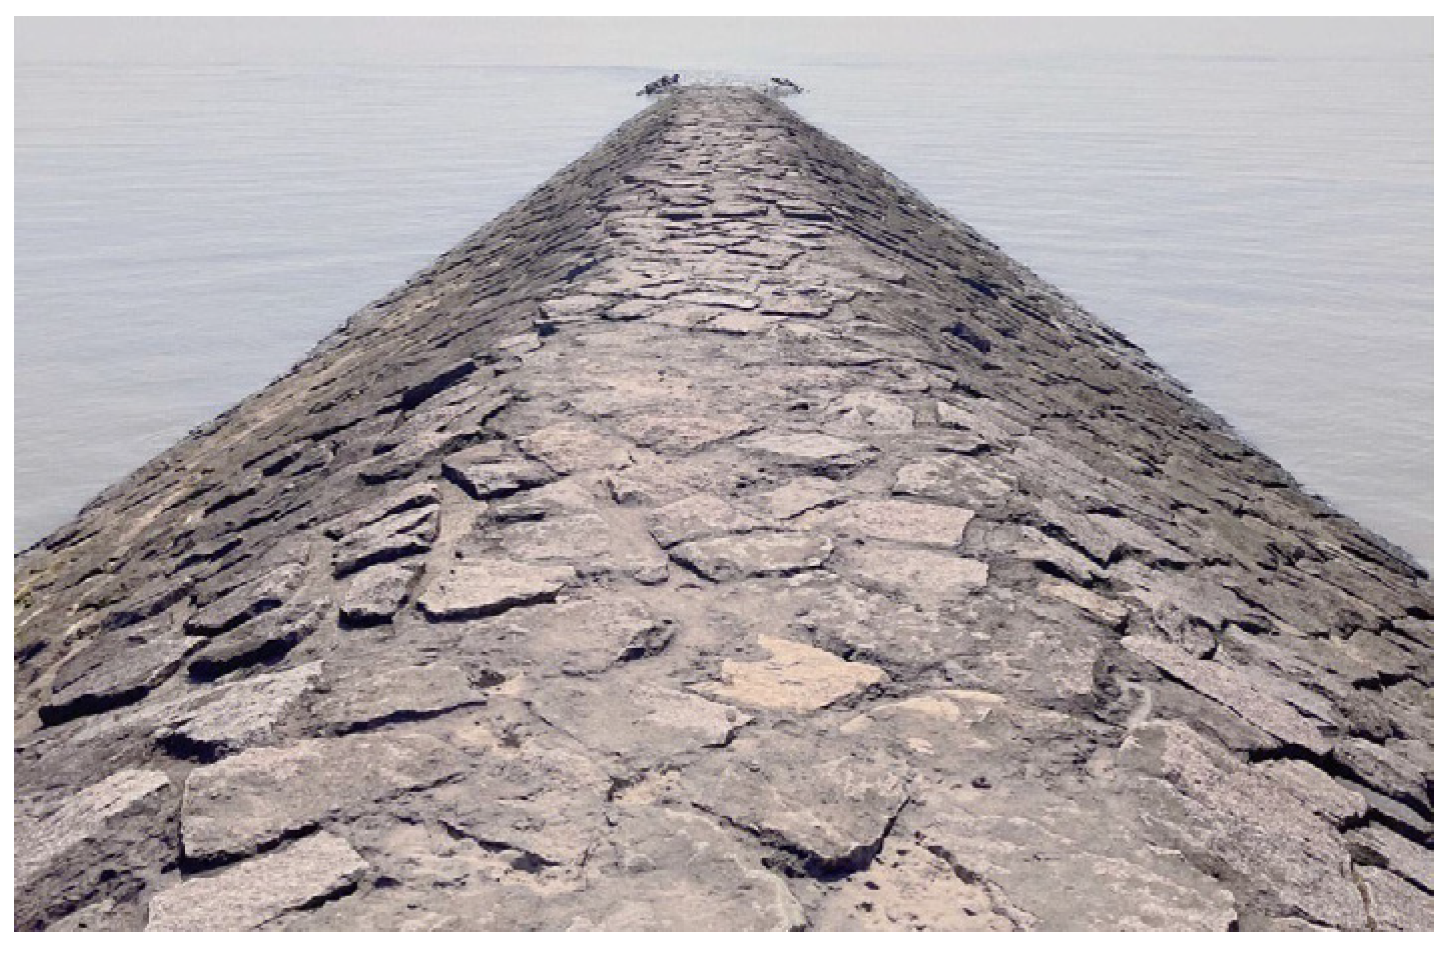
The model spur dike was developed according to the design parameters of the spur dike in the Changjiang River. The average height of the prototype spur dike was 6 m, the top width was 3 m, the upstream slope was 1:1.5, the downstream slope was 1:2, and the longitudinal slope of dike head was 1:3, as shown in Figure 2. The experimental model was designed as a normal one, the width of the flume was 3 m, and the maximum flow discharge was 0.2 m3/s; therefore, according to the experimental conditions, the geometric scale λL was identified as 40. The scale and intensity of the vortex around the dike head were mainly affected by the structure of the dike head; therefore, it was necessary to ensure the model dike head was similar to the prototype. Due to the limitations of geometric scale, the model spur dike could only simulate a portion of the length of some spur dikes with long lengths; however, if the river width compression ratio of the prototype and model was identical, the flow pattern and sediment movement affected by the length of the spur dike could be similar [30,31,32]. The compression ratio μ calculation formula is shown as follows:
μ = L / B = L 1 / B 1
where L is the spur dike length; B is the river width; L1 is the model spur dike length; and B1 is the flume width.
According to the compression ratio range in the Changjiang River remediation project, μ was determined to be 0.3; hence, the model spur dike body length was determined to be 90 cm. The structure of model spur dike is shown in Figure 3.
The common spur dike in the Changjiang River is a rock-fill spur dike. According to the geometric scale, the diameter of the natural graded gravel constituted the model spur dike was 1–2 cm.

2.2. New Permeable Spur Dike Model Design

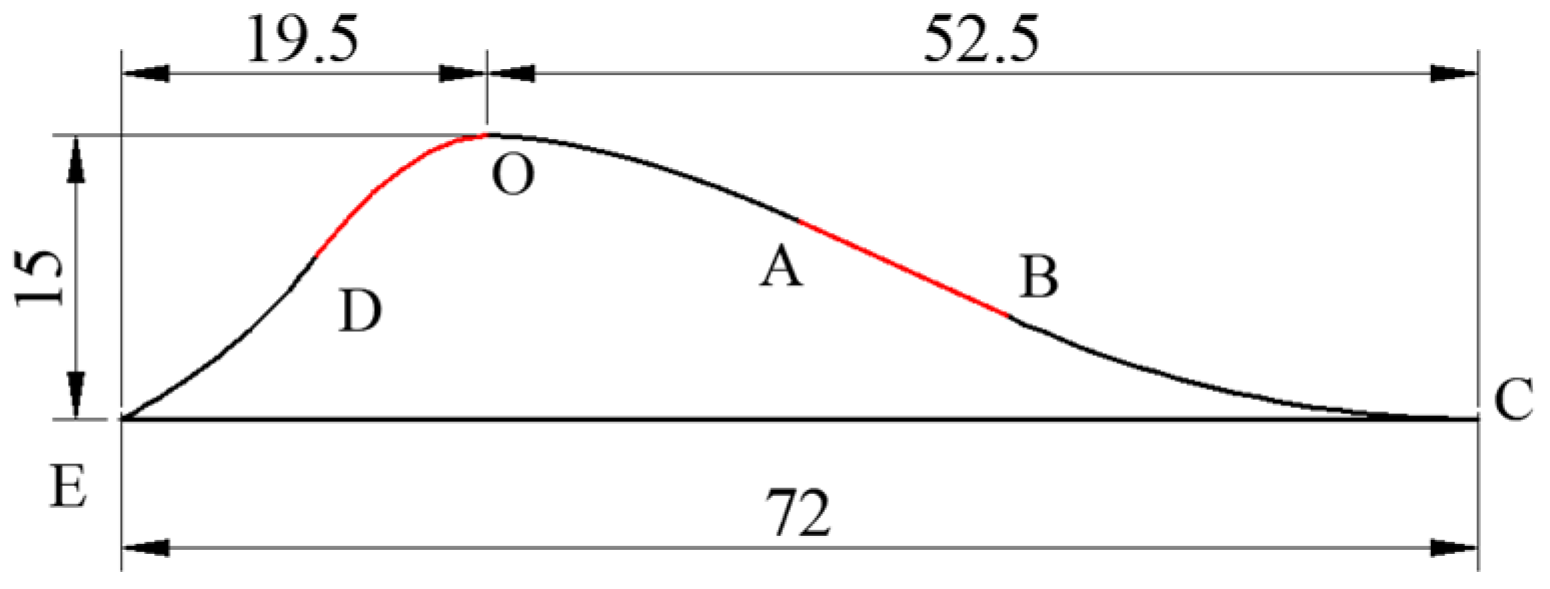
The overflow surface in the water conservancy project was used to smooth the water flow and reduce cavitation damage; therefore, the curve of spur dikes was designed by referring to the structure of the overflow surface. The downstream slope curve of the spur dike consisted of the top curve section (OA), the middle straight-line section (AB), and the tail arc section (BC), while the upstream slope curve of the spur dike consisted of the top curve section (OD) and the tail arc section (DE). The top curve segment was further optimized based on the WES curve. The upstream slope and downstream slope were 1:1.3 and 1:3.5, respectively. The curve of spur dike body is shown in Figure 4. The longitudinal section of the new spur dike is as shown in Figure 5.
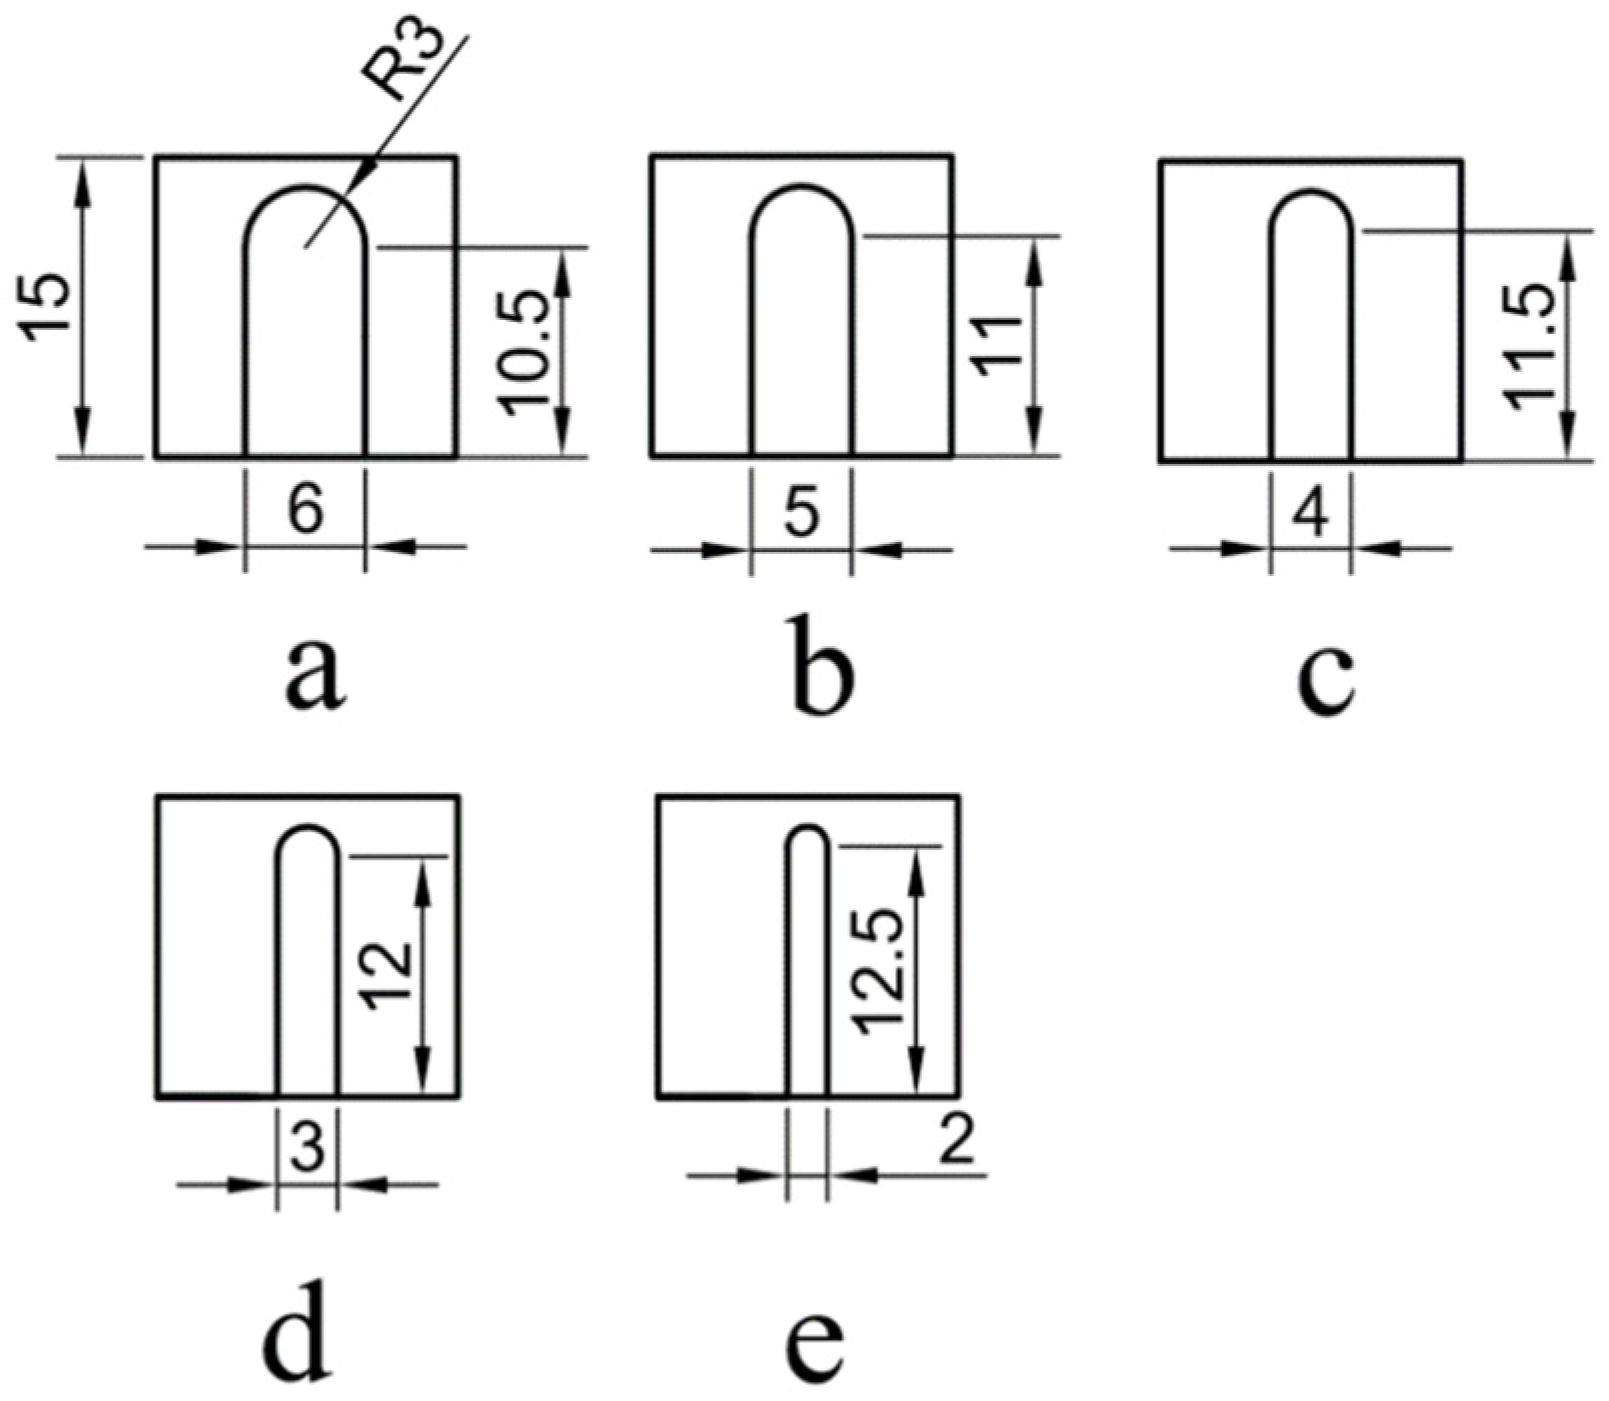
To avoid affecting the waterway regulation effect, permeable spur dikes are an effective measure to protect and restore the river ecology. Maintaining a proper permeability coefficient for the dike body can effectively alleviate strong disturbance of the water around the spur dike and reduce the adverse impact on the river ecology [33]; therefore, the dike body was designed to be permeable, composed of permeable members. In order to determine the optimal permeability coefficient, five types of dike body members with different permeability coefficients were designed. The permeability coefficient α was calculated as follow:
α = S 1 S   ×   100 %
where S1 is the projected area of the water permeable hole and S is the projected area of the impermeable dike body.
The longitudinal sections of the permeable members are shown in Figure 6.
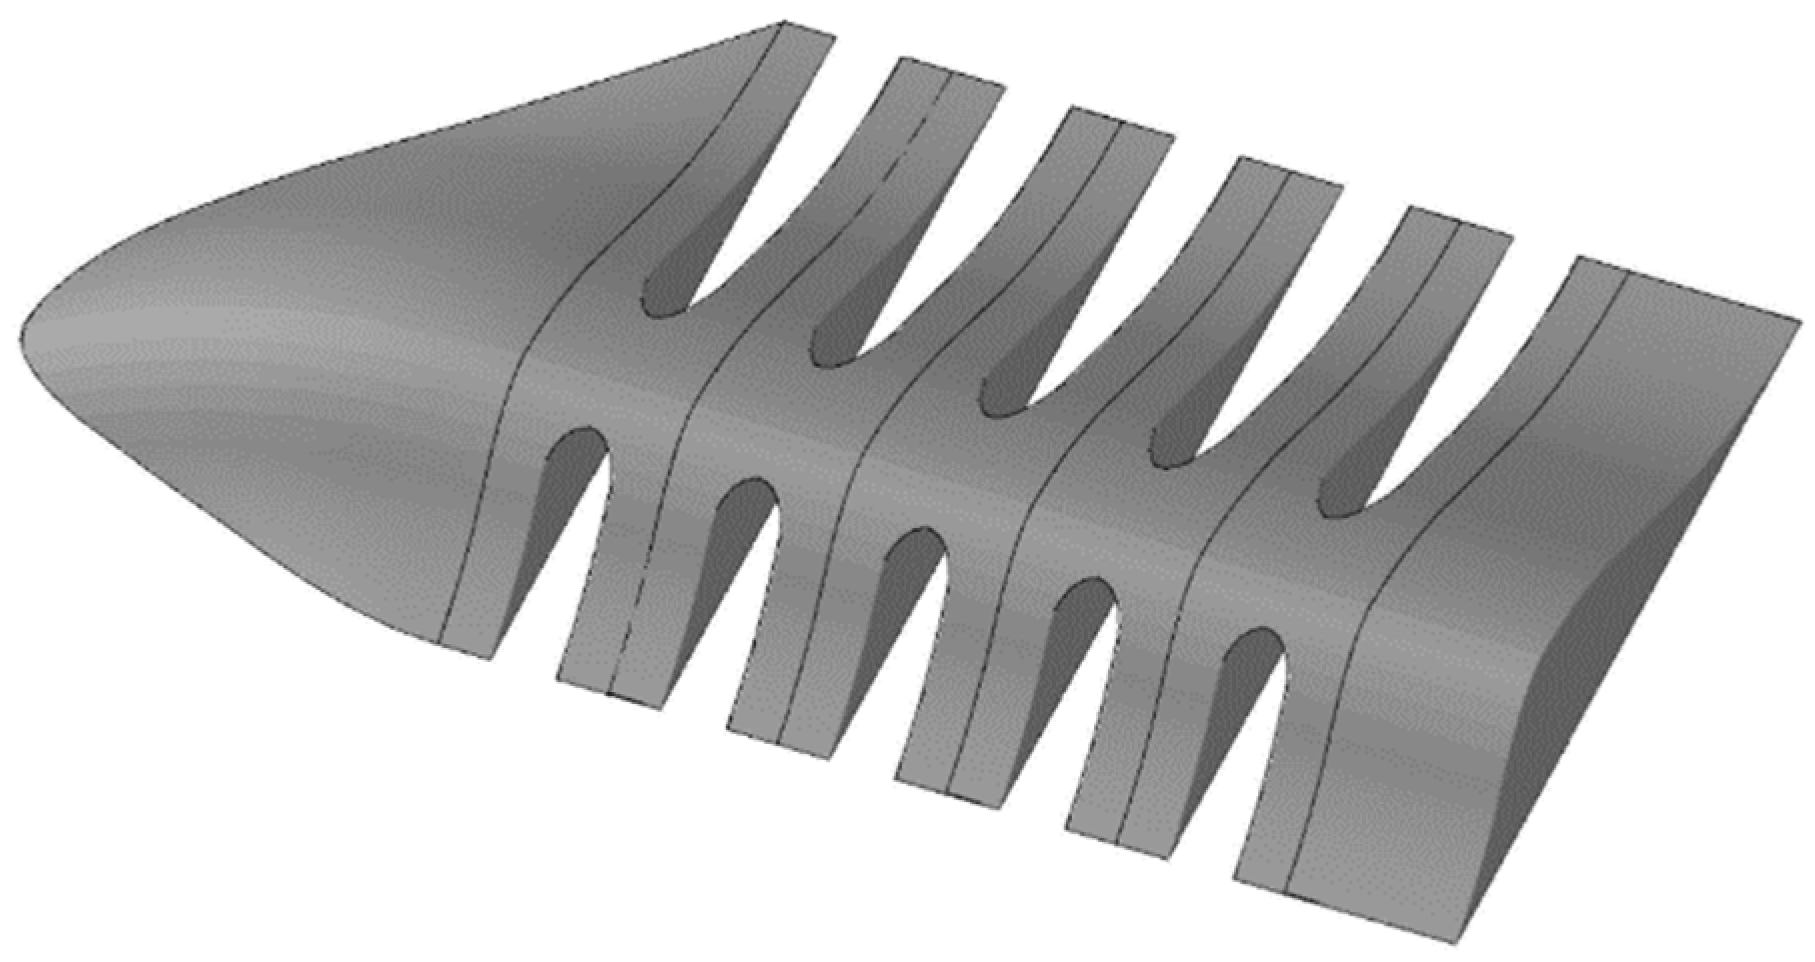
The entire permeable spur dike body was formed of the dike head, dike body, and dike root, and the total length was 1.35 m, which was the same as that of the rock-fill spur dike. The stereogram of a spur dike with a permeability coefficient of 34.3% is shown in Figure 7.
The bottom of the new spur dike was composed of a geomembrane layer, a mortar block stone layer, a stone throwing layer, and a crushed stone layer, from the bottom upwards. In the experimental model, the bottom elevation of the dike was the same as that of the moving bed surface, and the bottom protection range stretched beyond the dike by 15 cm.

2.3. Flow Process Design

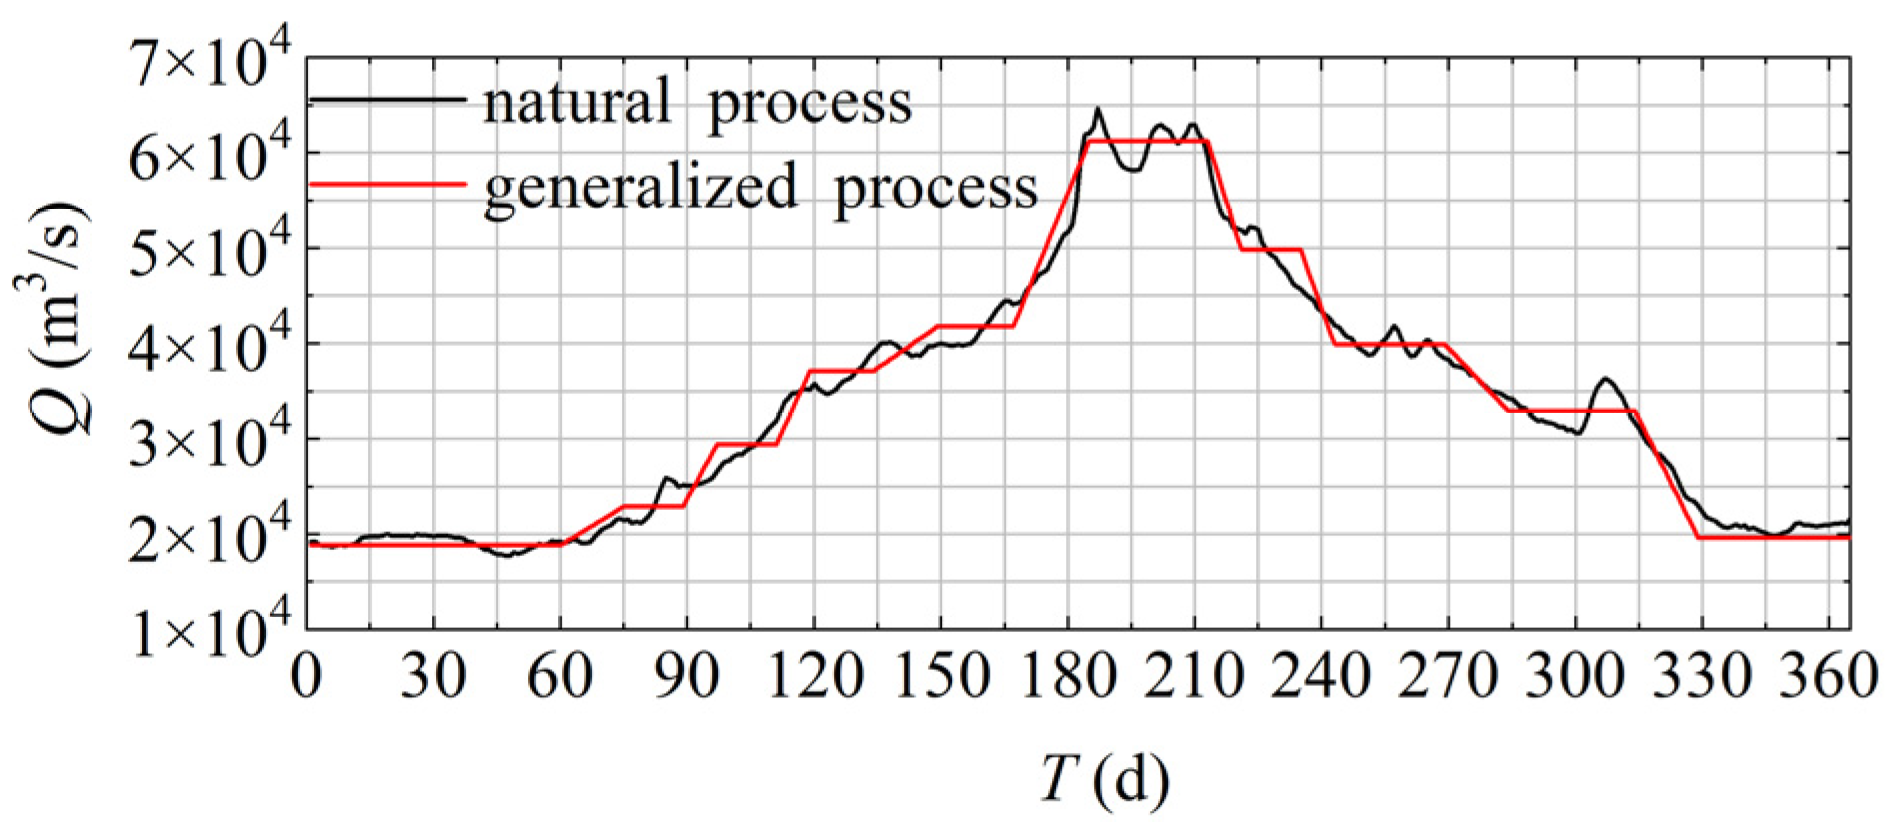
The average annual daily flow in the Hankou section of the middle reaches of the Changjiang river was used as the experimental flow process. Since the joint operation on the Three Gorges cascade reservoir on the Changjiang River in 2010, the maximum flow discharge in the Hankou station has been 64,904 m3/s, and the average flow velocity of the section during the peak period has been 2 m/s. In order to reduce the influence of the time scale distortion of the model, steady flow and unsteady flow were combined to carry out the cascade generalization of the flow process. The slope of the unsteady flow stage of the generalized flow process was the same as that of the prototype, and the total generalized flow volume was the same as the total natural flow volume. A comparison of the generalized flow process with the natural flow process is shown in Figure 8.
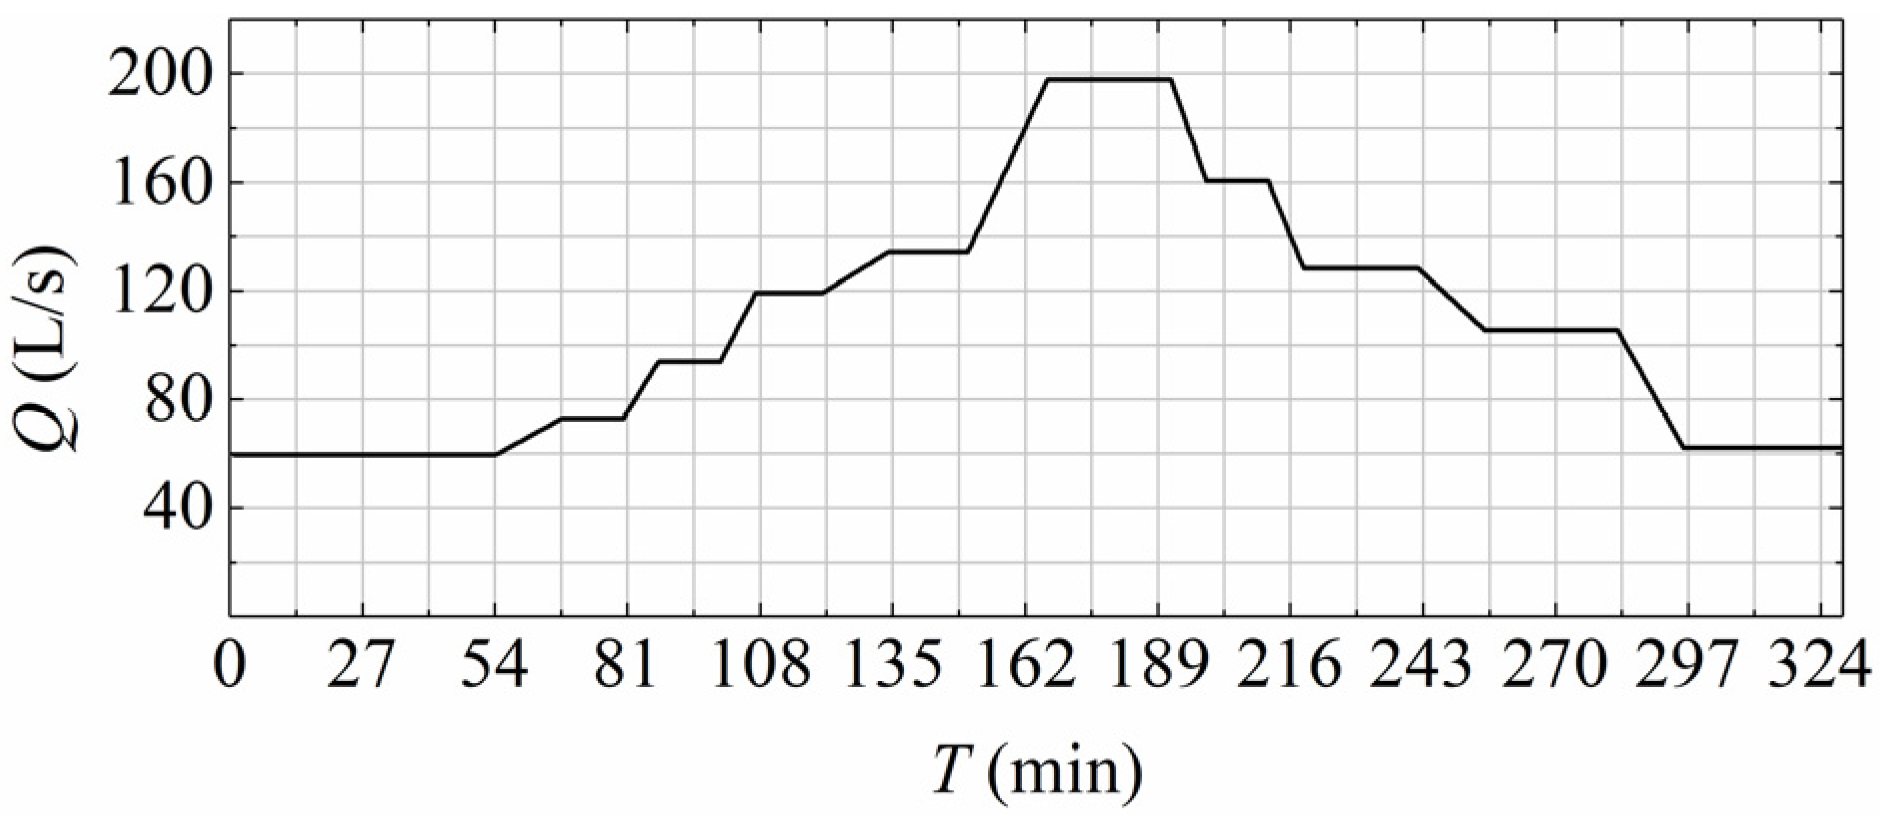
The correlation between the generalized process and the natural process was 0.99. The experimental flow discharge was designed according to the “flow zone method.” The reason for selecting the “flow zone” (fluid within a certain width and a certain depth around the spur dike) was to cover the range of water momentum exchange that may be generated during the scour process. The width of the flume was 3 m, the maximum range of the pump was 200 L/s, and the maximum water depth of the model test was 22.5 cm. According to the geometric scale, the area of the prototype river strip was calculated to be 1080 m2. According to the flow discharge and the average flow velocity of the section of Hankou station in the peak flood period, the area of the section was calculated to be 32,452 m2. As such, the area of the strip selected in the experiment was 1/30 of the entire cross-sectional area. Based on the maximum value of the generalized flow process and the flow discharge scale   λ Q = λ L 5 / 2 , the maximum flow discharge of the model was calculated to be 0.197 m3/s. The duration of the flow process simulated a natural hydrological year cycle, and the time scale was selected according to the resistance similarity λ T = λ L 2 . The duration of model flow process was calculated to be 328 min. The model flow process is shown in Figure 9.
The experiment water flow was controlled by an automatic feedback device, and the energy was dissipated through two energy dissipation nets to make the water flow stable. Furthermore, the Froude number of the flow varied between 0.094 and 0.23.

2.4. Flow Velocity and Topographic Measuring Equipment

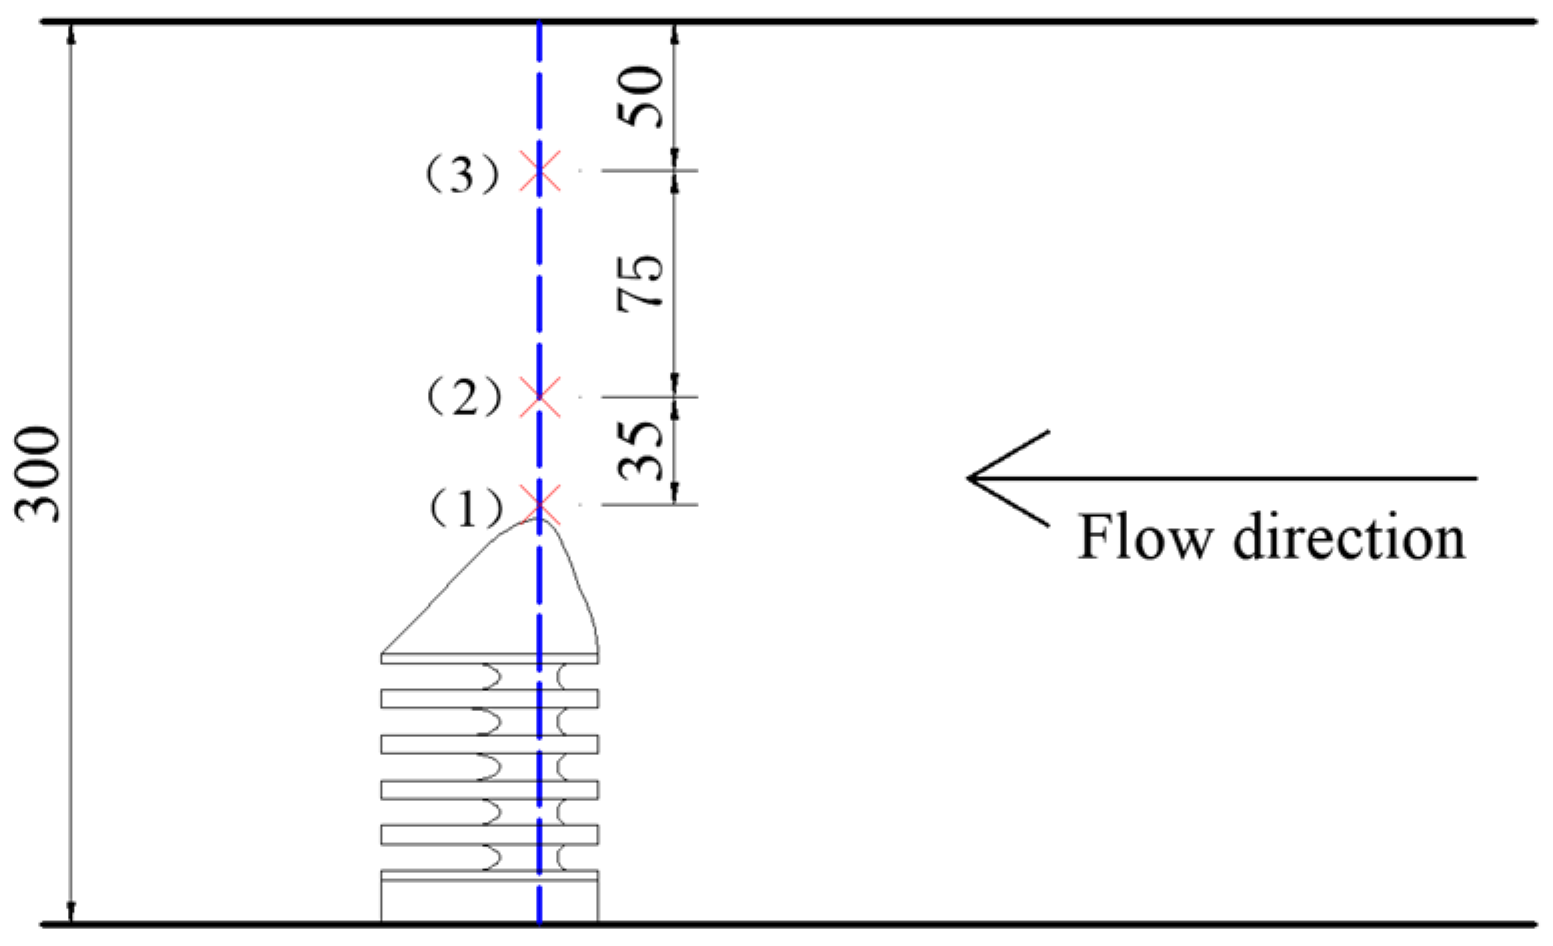
During the experiments, the flow velocity was collected using a Nortek ADV (Vectrino+) equipped with a side-looking head. Along the direction of water depth, the measurements were carried out at 0.2 h, 0.6 h, and 0.8 h, and the average value was calculated as the average velocity of the cross section. For every experiment, the velocity range was set to 1.0 m/s, the sampling rate was maintained at 100 Hz, and the data accuracy was realized at 0.001 m/s. The data accuracy was positively correlated with the signal correlation coefficient (COR) and the signal-to-noise ratio (SNR). The COR and SNR of the measured data were greater than 90% and 18 dB, respectively; thus, the velocity measurement data were proved to be true and reliable. The ADV was used to measure the flow velocity at the dike head and in the mainstream area. The arrangement of flow measurement points is shown in Figure 10.
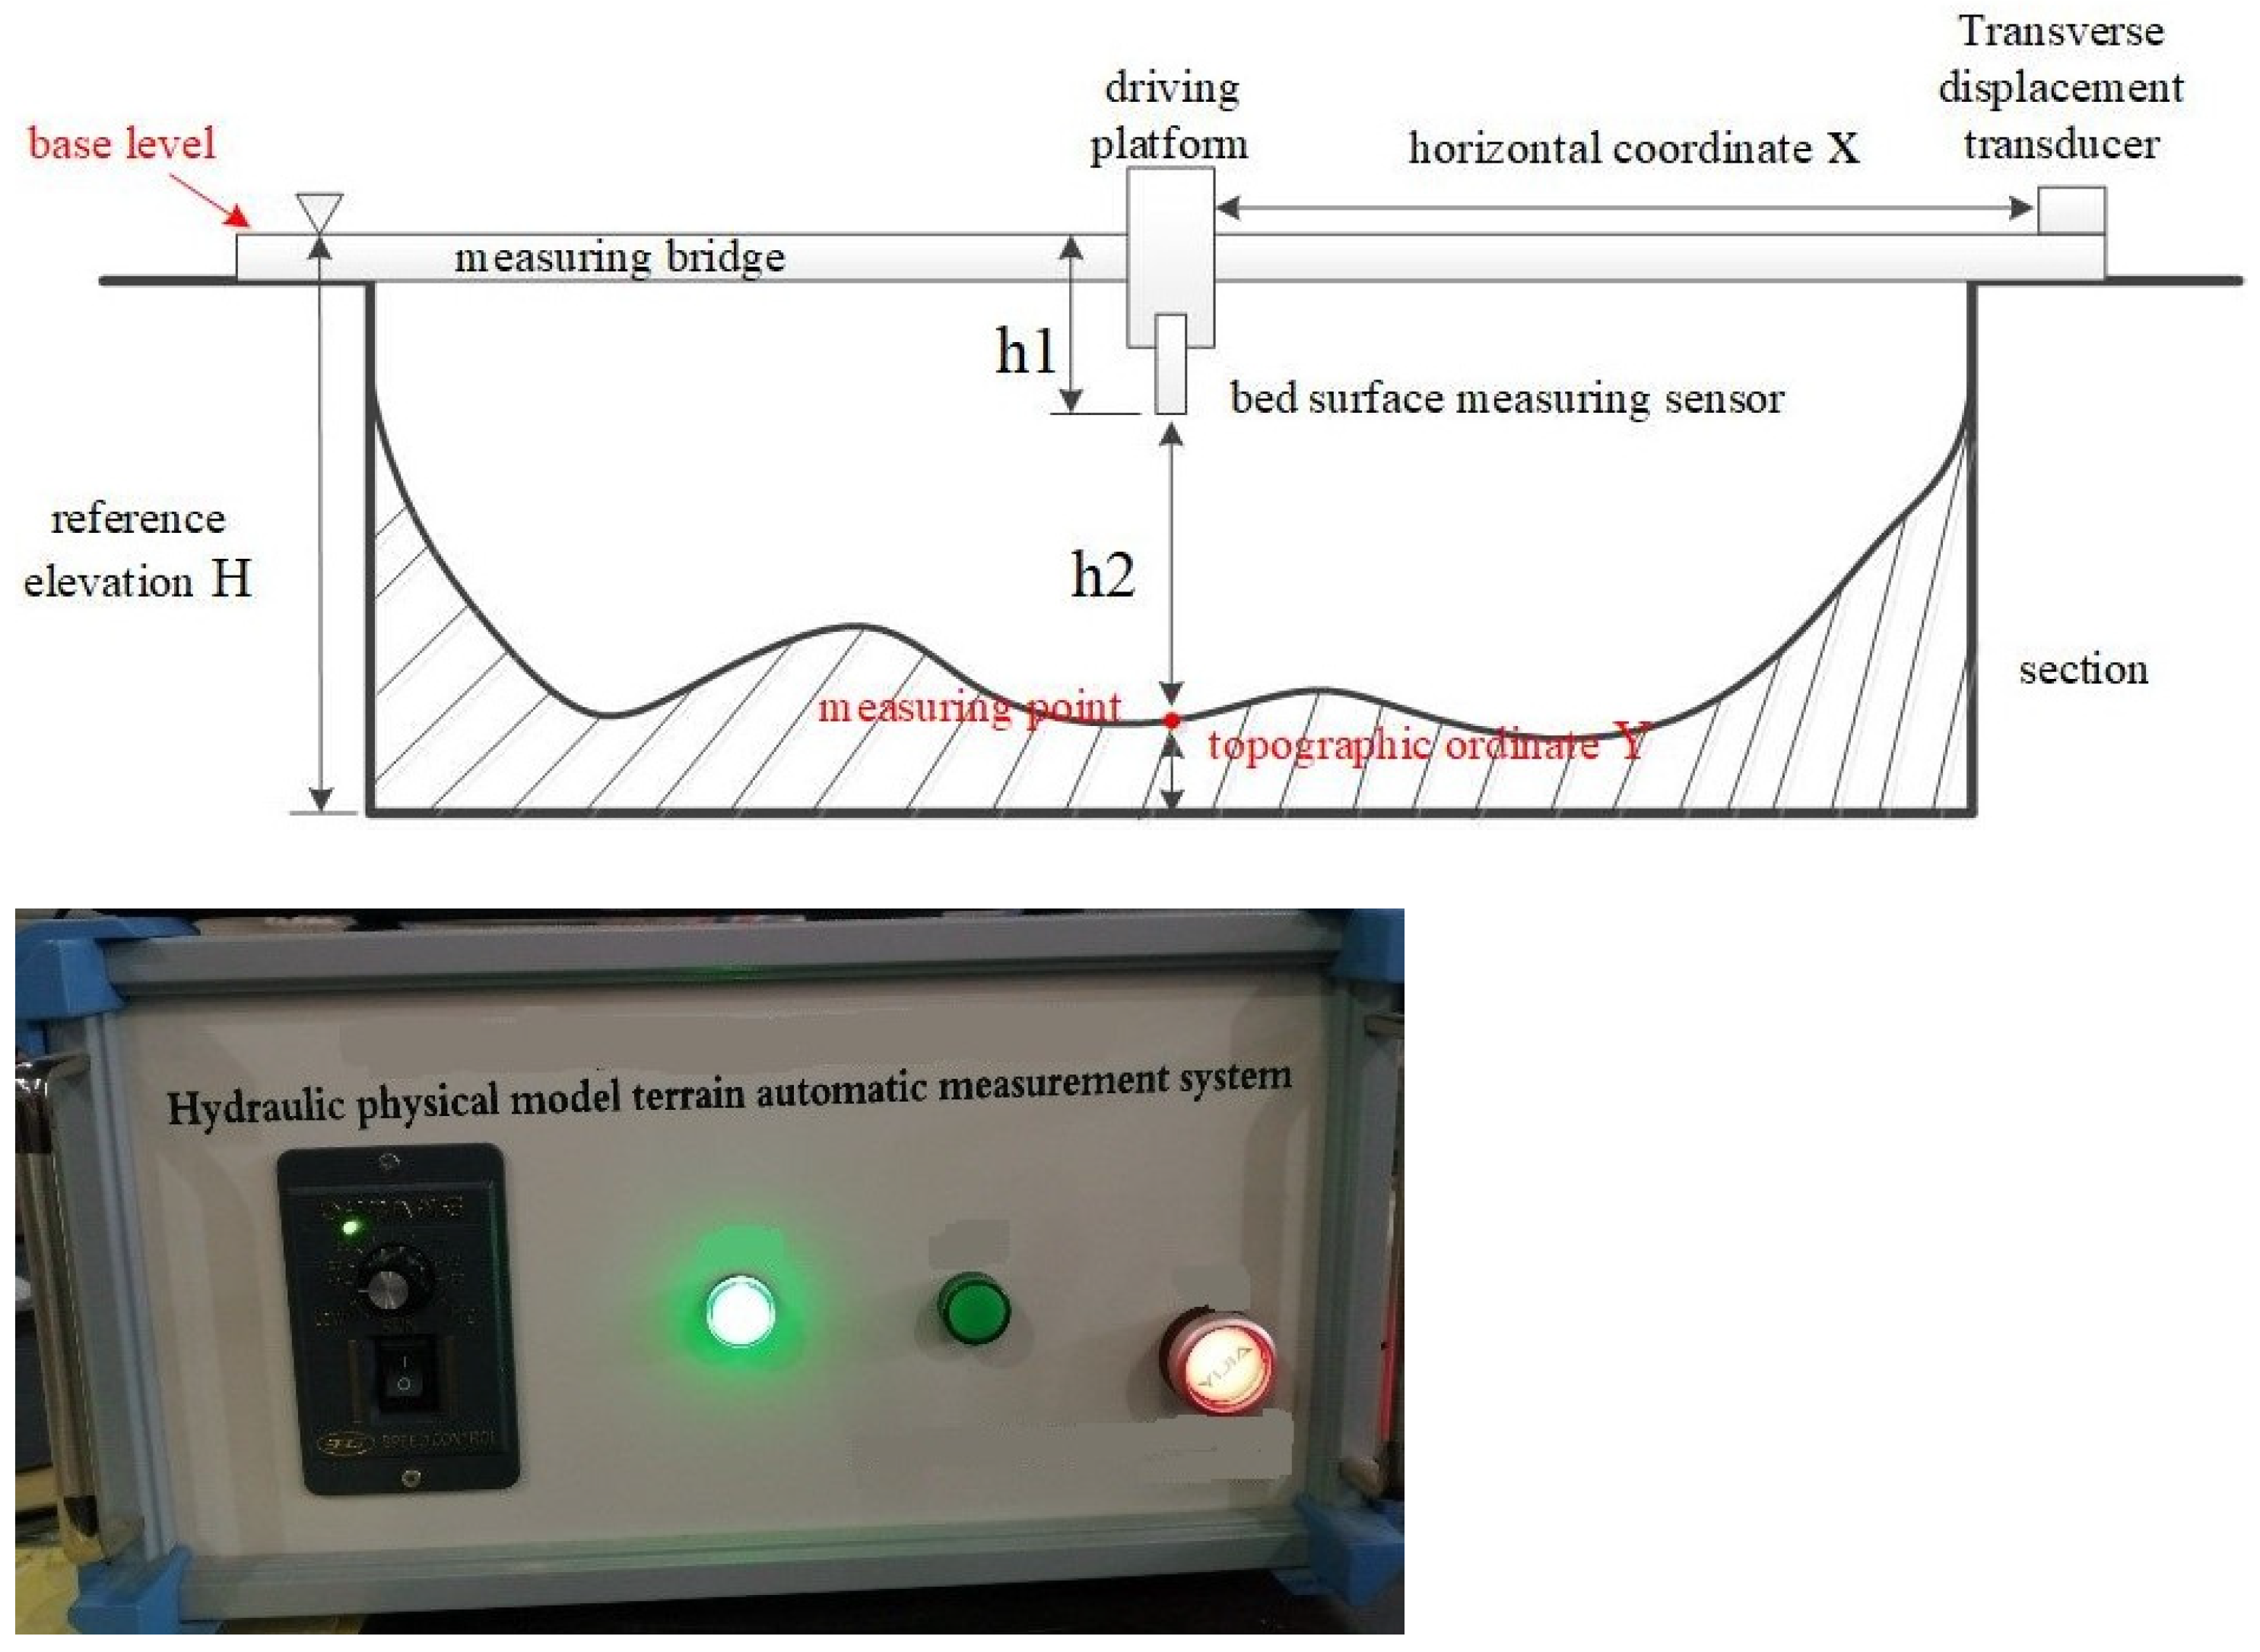
A high-speed laser scanner (hydraulic physical model topography automatic measurement system of Southwest China Institute of Science) was used to collect the topographic data, and the scanning accuracy was 1 mm. Before the experiment begins, the riverbed was kept flat and the topographic data was measured. Then the water in the flume was accumulated slowly to the intended depth. The model flow process was released through the automatic flow feedback device to conduct the scour experiment. After the experiment, the water was drained slowly, and once the riverbed had dried up, the topography of the test section was measured. The topographic changes in the channel were obtained by subtracting the pre-experimental topographic data from the topographic data after the experiment. In order to ensure the accuracy of the data, the elevation of the topographic surveying instrument remained unchanged. The topographic surveying instrument is shown in Figure 11.

3. Results

3.1. Analysis of Channel Scour Characteristics

In order to verify the role of new permeable spur dikes in reducing channel scour compared with traditional spur dikes, the sediment scour characteristics of traditional spur dikes and new spur dikes with different permeabilities were studied. The traditional rock-fill spur dike has a certain impact on the channel riverbed after experiencing a hydrological annual flow process. The channel topography is shown in the Figure 12. Taking the flow direction as the positive X axis, the spur dike axis is 0 point, the upstream is positive, and the downstream is negative. The distance shown in the figure is converted back to the prototype according to the geometric scale.
It can be seen from Figure 12 that the influence of spur dike on channel topography was mainly concentrated within 40 m upstream and 160 m downstream of the spur dike; therefore, the section of the channel beyond 160 m downstream of spur dike, which experienced little topographic change, can be ignored. The local topographic maps of the channels around the new structure rock-fill spur dike and the spur dikes with different permeabilities are shown in Figure 13.
It can be seen from Figure 12 and Figure 13 that the local scour around spur dikes was concentrated in front and downstream of the dike head. The scour depth at the front of the dike head was generally smaller than that downstream of the dike head. The effects of traditional rock-fill spur dike and new structure rock-fill spur dike on scour holes at dike head were basically the same. The two scour holes at the front and downstream of the dike head were combined into a whole, forming a huge scour hole. The scour hole depth of the traditional rock-fill spur dike was nearly 6 m, and the scour hole depth of new structure rock-fill spur dike was nearly 5 m. In addition, the sediment was deposited at the downstream of the scour hole and formed a ridge about 100 m long and 10 m wide, with the highest ridge reaching 3 m.
The depth of the scour hole at the front of permeable spur dike head was generally less than that i downstream of dike head, and sediment deposition occurred at the outer edge of the scour hole and some distance downstream. The maximum depth of the scour hole in downstream of the permeable spur dike head was about 3 m, and the depth of the scour hole at the front of the dike head was about 1.5 m. The length and thickness of sediment deposition at the edge of the scour hole at the downstream of the dike head decreased with increases in the permeability coefficient. When the permeability coefficient was 34.3%, the sedimentation height downstream of the dike was only 0.5 m.
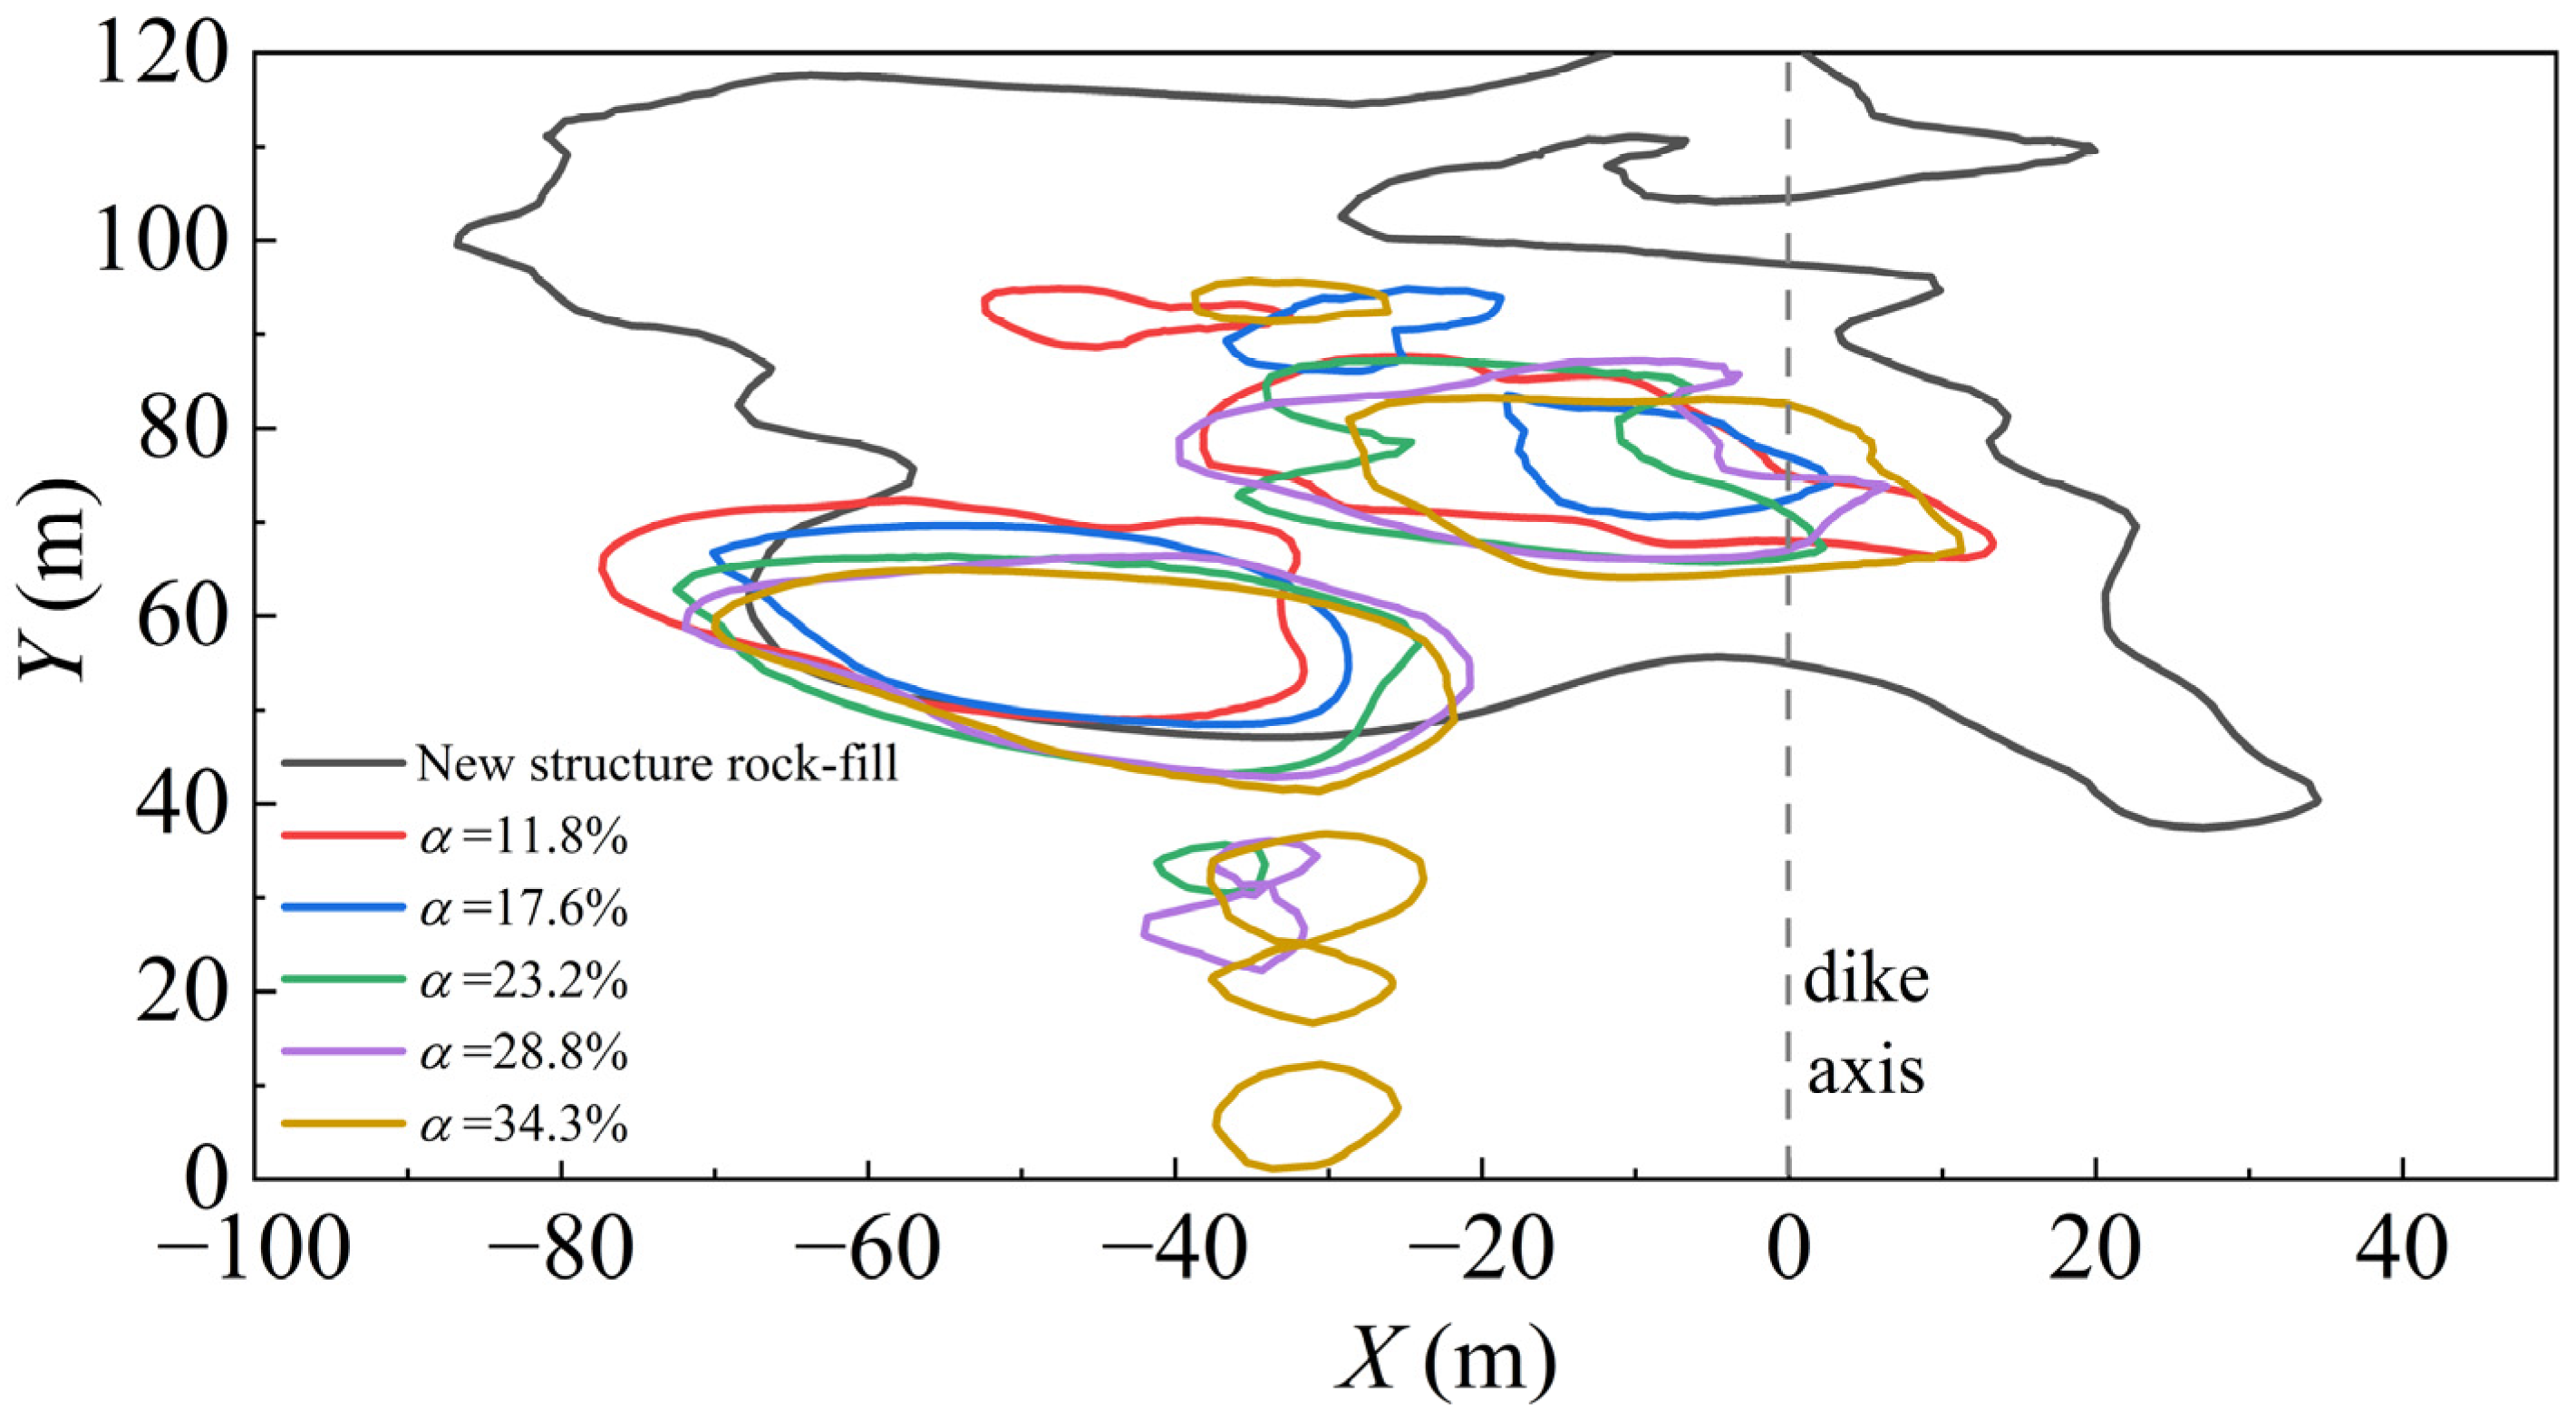
Because the channel scour laws of traditional rock-fill spur dikes and new structure rock-fill spur dikes were basically the same, the new structure rock-fill spur dike was taken as the control group to study the influence of spur dike permeability on the local scour of spur dikes. With the outer edge of scour hole as the boundary, the scour ranges of new structure rock-fill spur dike and spur dikes with different permeability coefficients were drawn, as shown in the Figure 14.
The following results can be obtained from the Figure 14:
(1)
The scouring area around the rock-fill spur dike was much larger than that around the permeable spur dike, because the rock-fill spur dike was composed of rubble, and the permeability coefficient was much smaller than that of the permeable spur dike, resulting in a greatly reduced cross-section of the channel. The flow was concentrated at the front and downstream of the dike head, greatly increasing the flow velocity here, and intensifying the scouring.
(2)
The two scour holes formed at the front and downstream of the permeable spur dike head are independent, and the two scour holes of spur dikes with different permeabilities had scouring in the same location. The area of the scour hole of the permeable spur dike was much smaller than that of the rock-fill spur dike.
(3)
The scour holes occurred downstream of the dike body when the permeability coefficients of spur dikes were 23.2%, 28.8%, and 34.3%. The reason for this was that with an increase in the permeability coefficient, the current through the permeable holes increases, which leads to an increase in the flow velocity downstream of the dike body, intensifying the scour downstream of the dike body and forming scour holes.
(4)
The scour areas around the new structure rock-fill spur dike, the spur dike with a permeability coefficient of α = 11.8%, the spur dike for which α = 17.6%, the spur dike for which α = 23.2%, the spur dike for which α = 28.8%, and the spur dike for which α = 34.3% were 5528 m2, 1457.75 m2, 895.7 m2, 1466.9 m2, 1309.5 m2, and 1618.1 m2, respectively. With an increase in the permeability coefficient, the scour area at the front and downstream of the dike head decreased gradually. However, when the permeability coefficient was greater than 17.6%, the scour area downstream of the dike body increased with an increase in the permeability coefficient. Therefore, the total scour area around the spur dike decreases first and then increases with an increase in the permeability coefficient. When the permeability coefficient was 17.6%, the total scour area was the smallest.

3.2. Analysis of Spatial Characteristics of Scour Holes

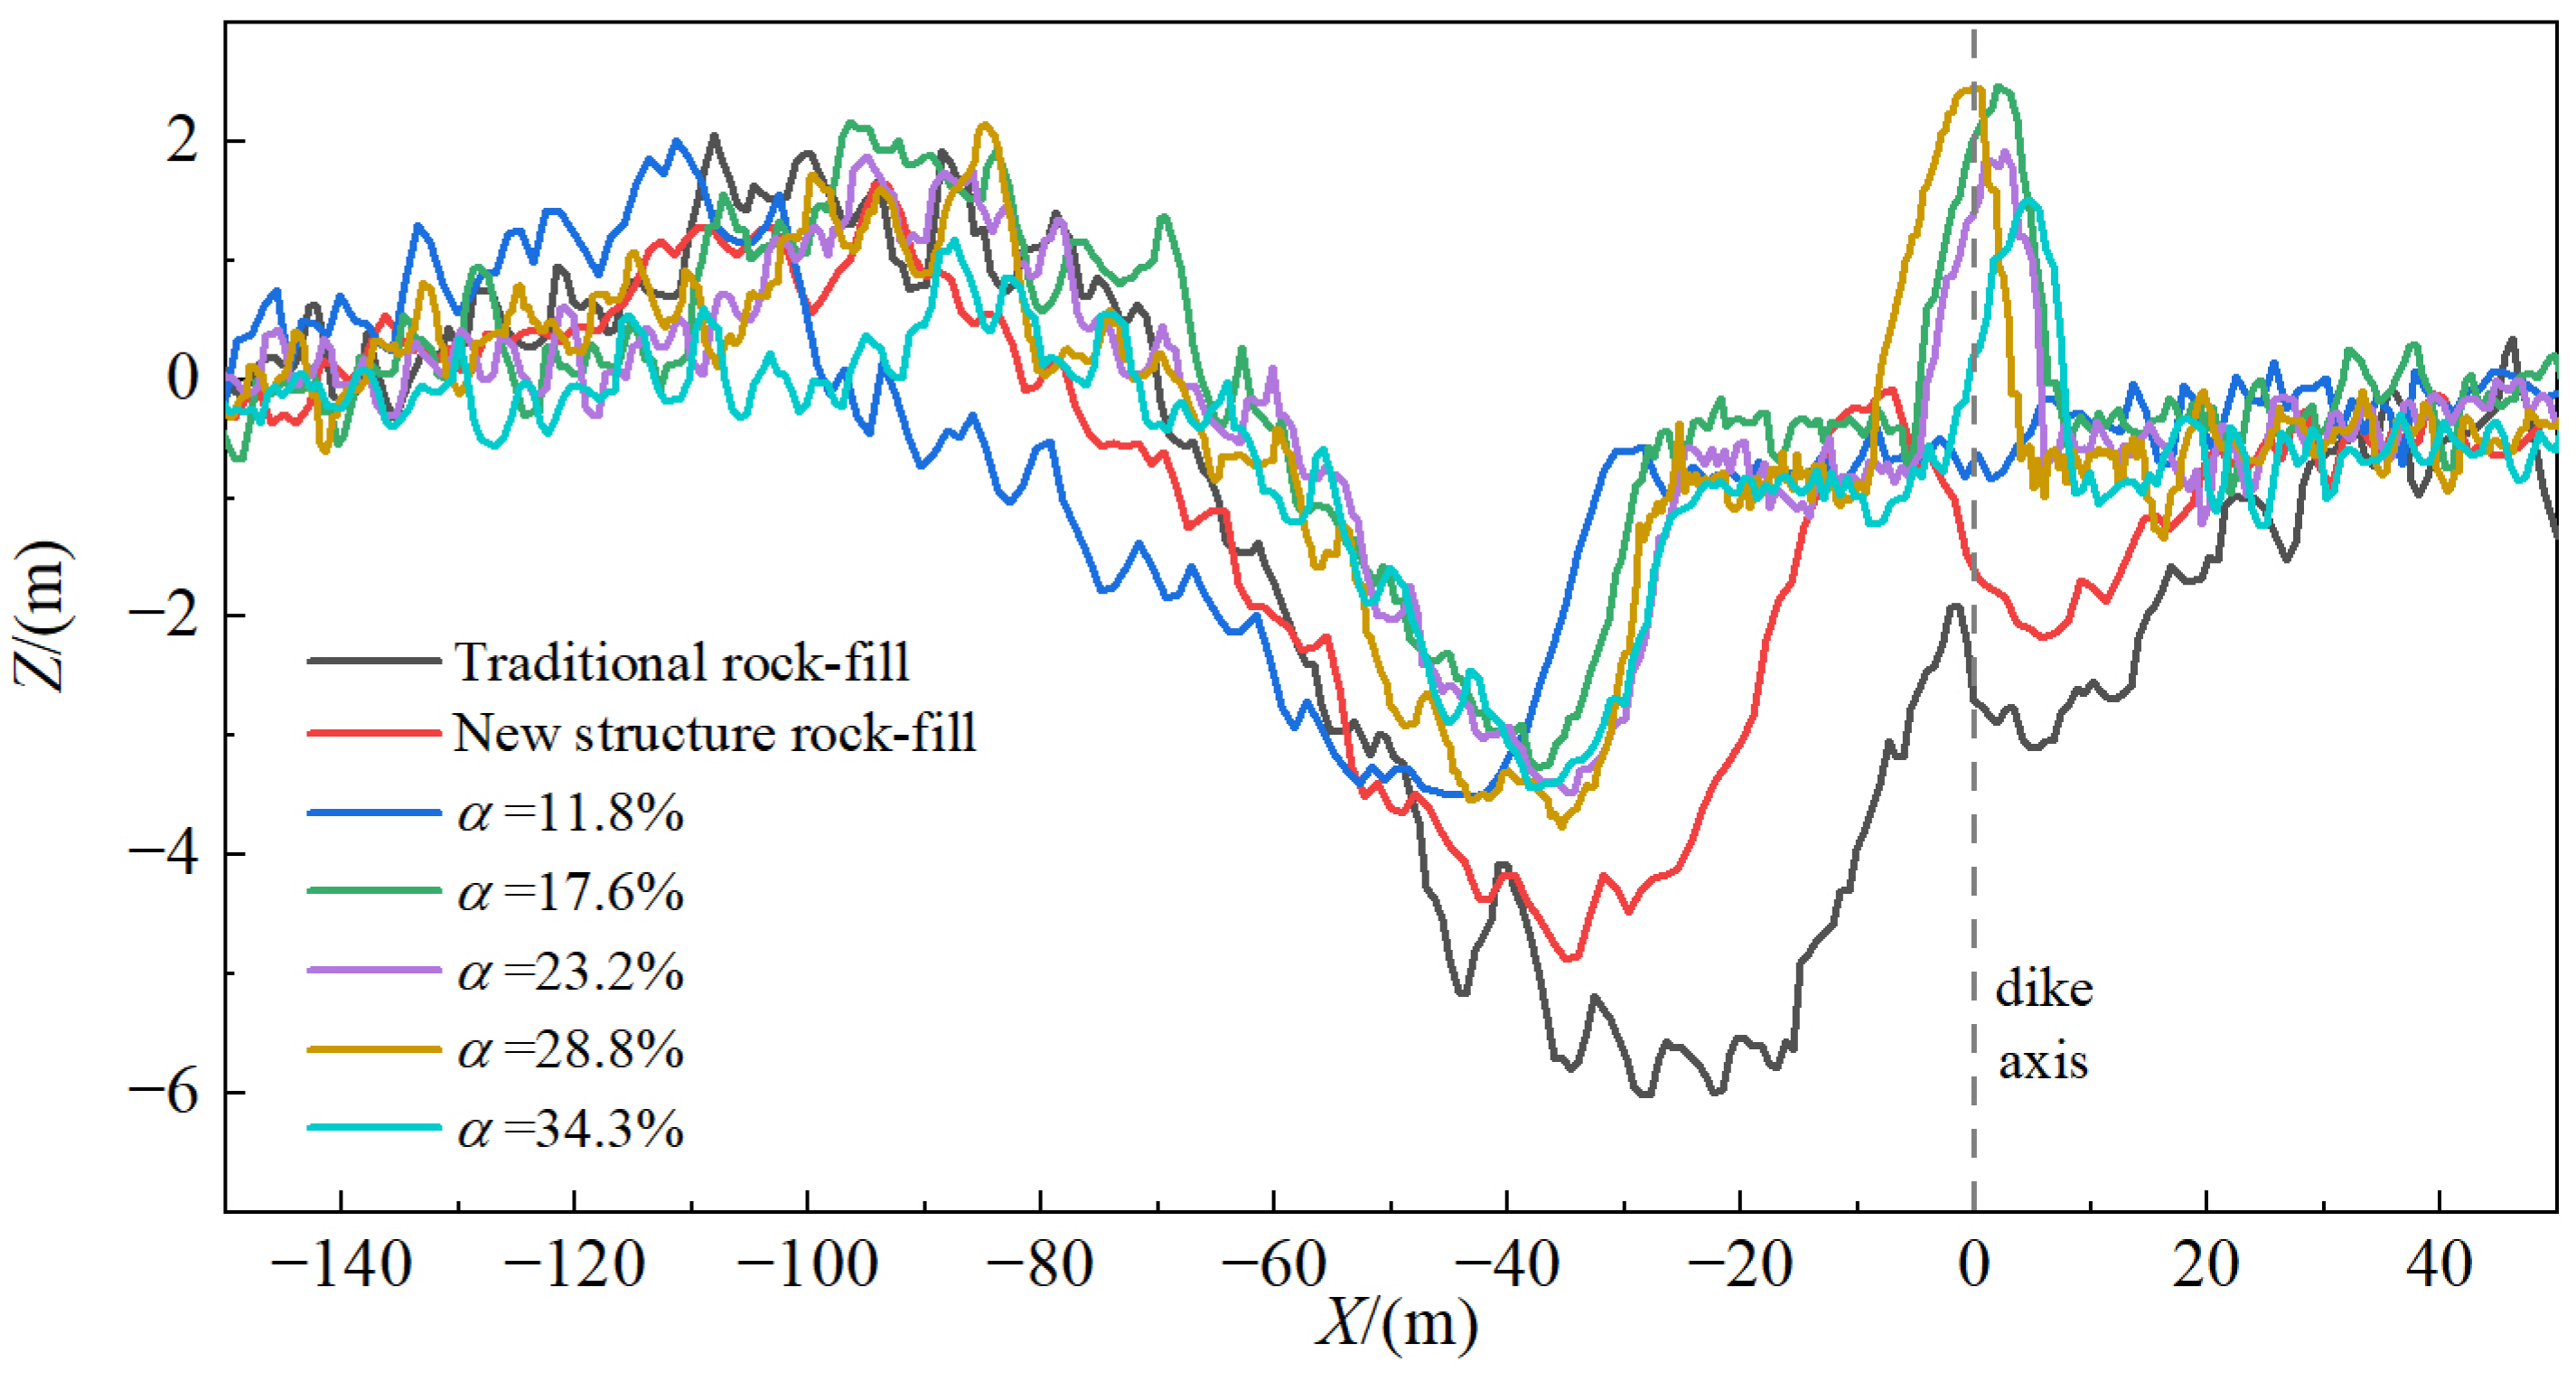
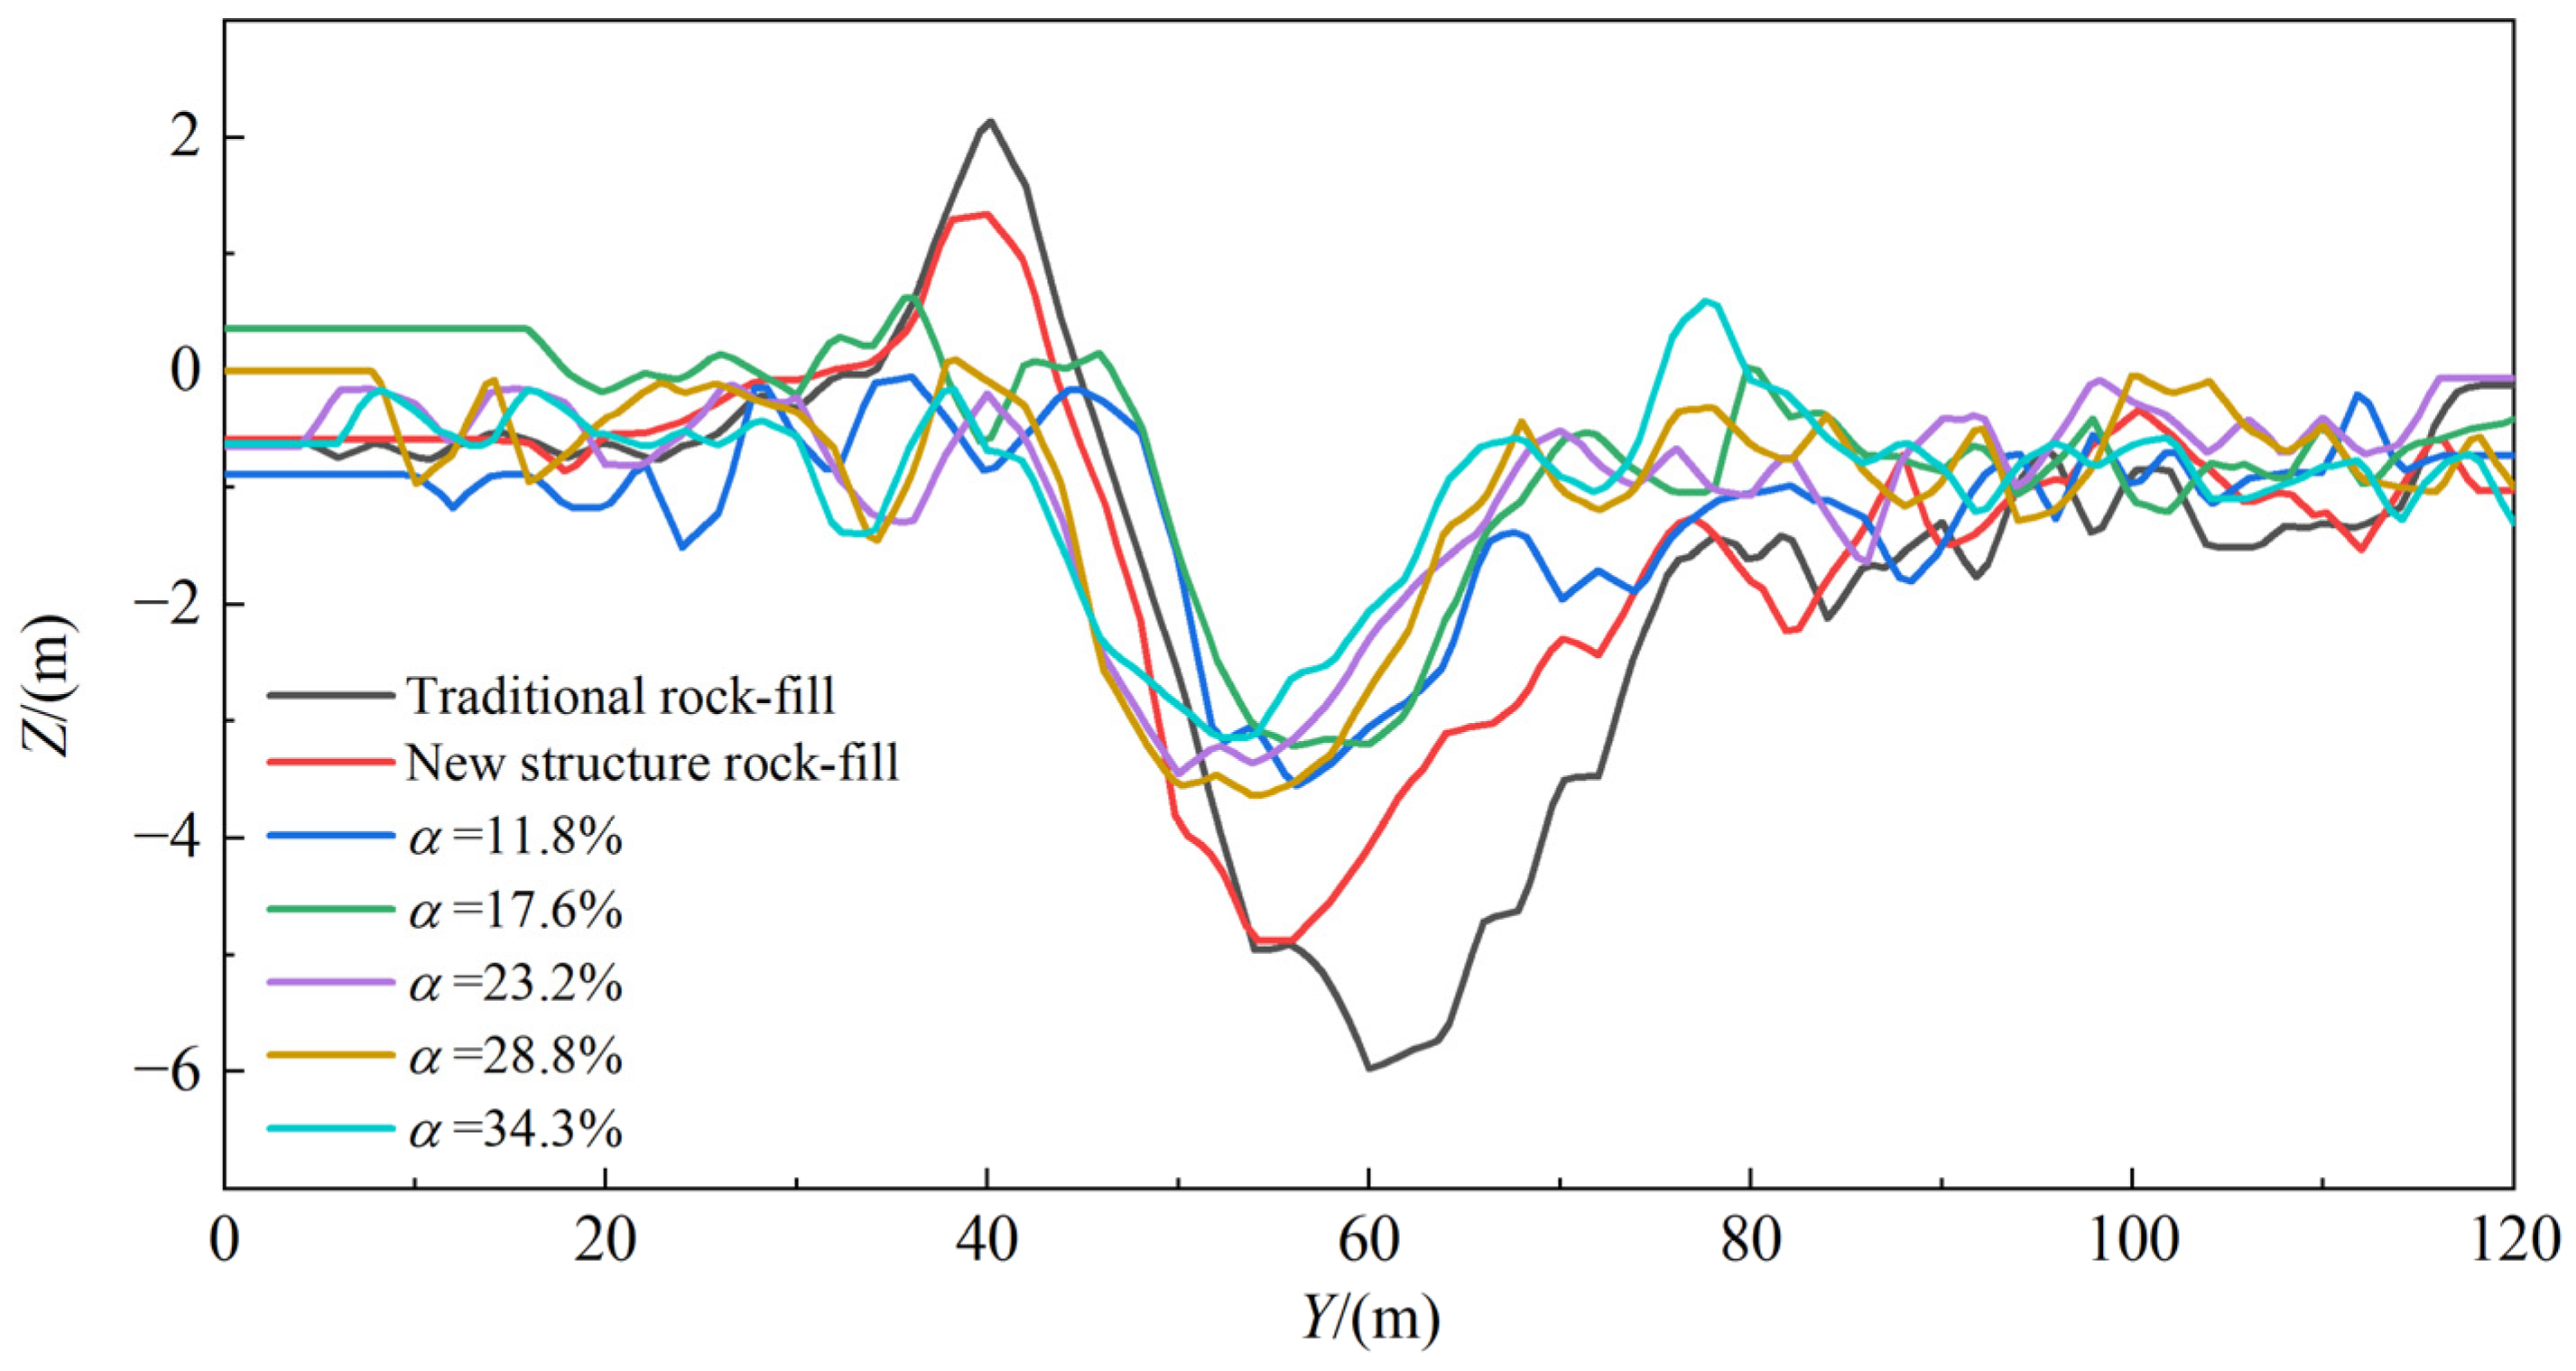
The huge scour hole downstream of the dike head is the main factor that results in spur dike instability. Therefore, it is of great engineering significance to study the spatial characteristics of the scour hole downstream of the dike head. The depth and slope of the scour hole are important morphological parameters. The lateral elevation and the longitudinal elevation of scour holes can reflect the influence of the spur dike on the depth and slope of scour holes. The cross-section (X = −30, Y = 59), where the scour hole depth is at the maximum, was taken as the characteristic cross-section, and the lateral elevation and longitudinal elevation near the spur dike were analyzed. The lateral elevation map took the dike axis as the zero point; thus, the upstream direction was positive, the downstream direction was negative, and the longitudinal elevation map took the dike root as the zero point, as shown in Figure 15 and Figure 16.
By combining Figure 15 and Figure 16, it can be determined that that the positions of the scour holes associated with permeable spur dikes were further away from the dike body than those associated with the rock-fill spur dikes, due to the bottom protection structure. Although the permeability coefficients of these permeable spur dikes were different, the locations of the scour holes were basically identical, which shows that the location of scour hole is independent from the permeability coefficient.
The maximum depths of scour holes at the head of traditional and new structure rock-fill spur dike were 6.02 m and 4.98 m, respectively, and the scour hole of the new structure rock-fill spur dike was smaller than that of the traditional one, which indicates that the curve of new structure spur dikes slows down water scouring. The depths of scour holes in permeable spur dikes were obviously less than those in rock-fill spur dikes, and the maximum depths of scour holes at the head of spur dikes with different permeability coefficients were 3.78 m, 3.52 m, 3.51 m, 3.43 m, and 3.27 m respectively. The maximum depth of scour holes at the dike heads decreased with an increase in the permeability coefficient of spur dikes, but the maximum depth of scour holes was basically around 3.5 m.
The slope of a scour hole can be simplified as the slope of the section at the location of scour hole in the lateral elevation map and the longitudinal elevation map. Through calculation, the slopes on the lateral and longitudinal axes of all scour holes were basically the same, indicating that the slopes of scour holes are almost the same. This is because the formation of a scour hole slope is mainly related to the sediment repose angle [34], so the slopes of scour holes are basically the same when using the same experimental sand.
This study showed that the area and volume of the main scour hole can be predicted according to the maximum scour depth by ignoring the small-depth scour around the main scour hole [35]. The volume of the scour hole is positively correlated with the product of the scour hole area and the maximum scour depth; that is, V ~ S × hmax [36]. There is a positive correlation between the scour hole area and the square of the maximum depth of the scour hole [37], and the ratio of the volume of scour to the cube of the maximum scour depth was found to be well represented by a constant value [38]. The model sand used throughout this experiment was the same, and the shape and slope of all scour holes were similar, so the volume of scour holes is directly related to the maximum depth.

3.3. Analysis of Maximum Depth of Scour Holes

The depth of the scour hole at the dike head is an important factor in studying the influence of the spur dike on channel scour. According to the previous summary and experiment analysis, the scour hole depth at the dike head is related to the current conditions, sediment characteristics, spur dike structure characteristics, and the scour duration of the current experiment. The sediment used in this test was not changed, so the influence of sediment particle size and unit weight were not considered. Only the permeability coefficient changed with regard to the structural characteristics of spur dike, so the permeability coefficient α is considered to be the influencing factor of the spur dike structure.
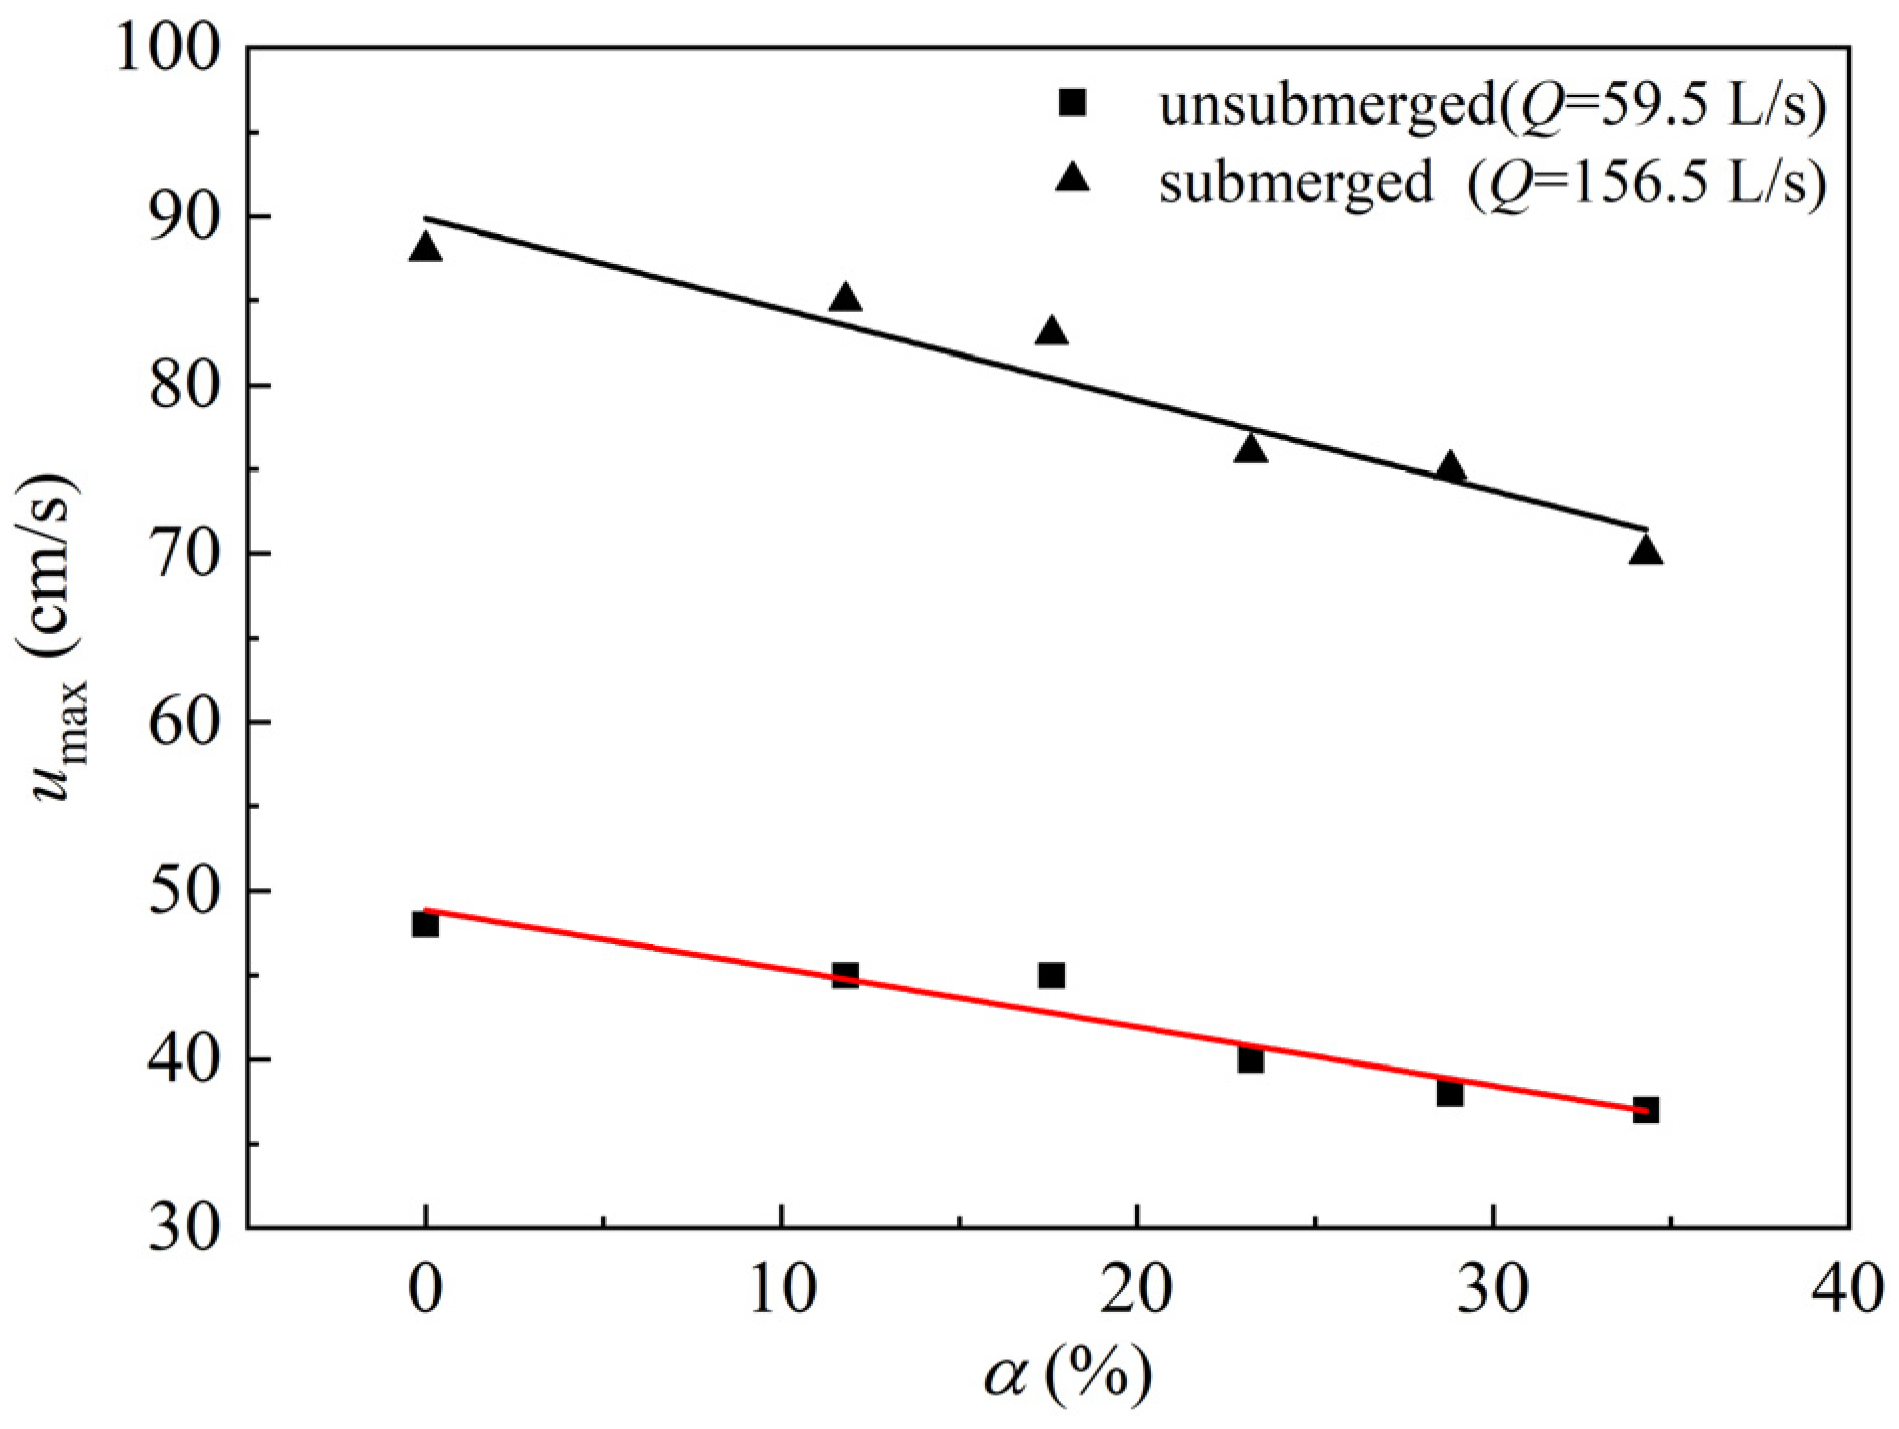
The velocity in the mainstream zone of the channel can reflect the influence of spur dike permeability on the velocity. Through analysis, it was found that the velocity in the mainstream zone of the channel decreased with an increase in permeability. When the spur dike was just unsubmerged (Q = 59.5 L/s) and when the spur dike was submerged for 5 cm (Q = 156.5 L/s), the law of the maximum velocity in the mainstream zone of the channel changing with the permeability coefficient of the spur dike was analyzed. The maximum flow velocity varied with the permeability coefficient, as shown in Figure 17.
It can be seen from the figure that the maximum velocity in the mainstream area decreases with an increase in the permeability coefficient, regardless of whether the spur dike is submerged or not. This is because the dike body is permeable, which reduces the water compression ratio, and some of the water flows into the downstream through the permeable hole, reducing the flow in the mainstream zone, so that the flow velocity in the mainstream zone is decreased.
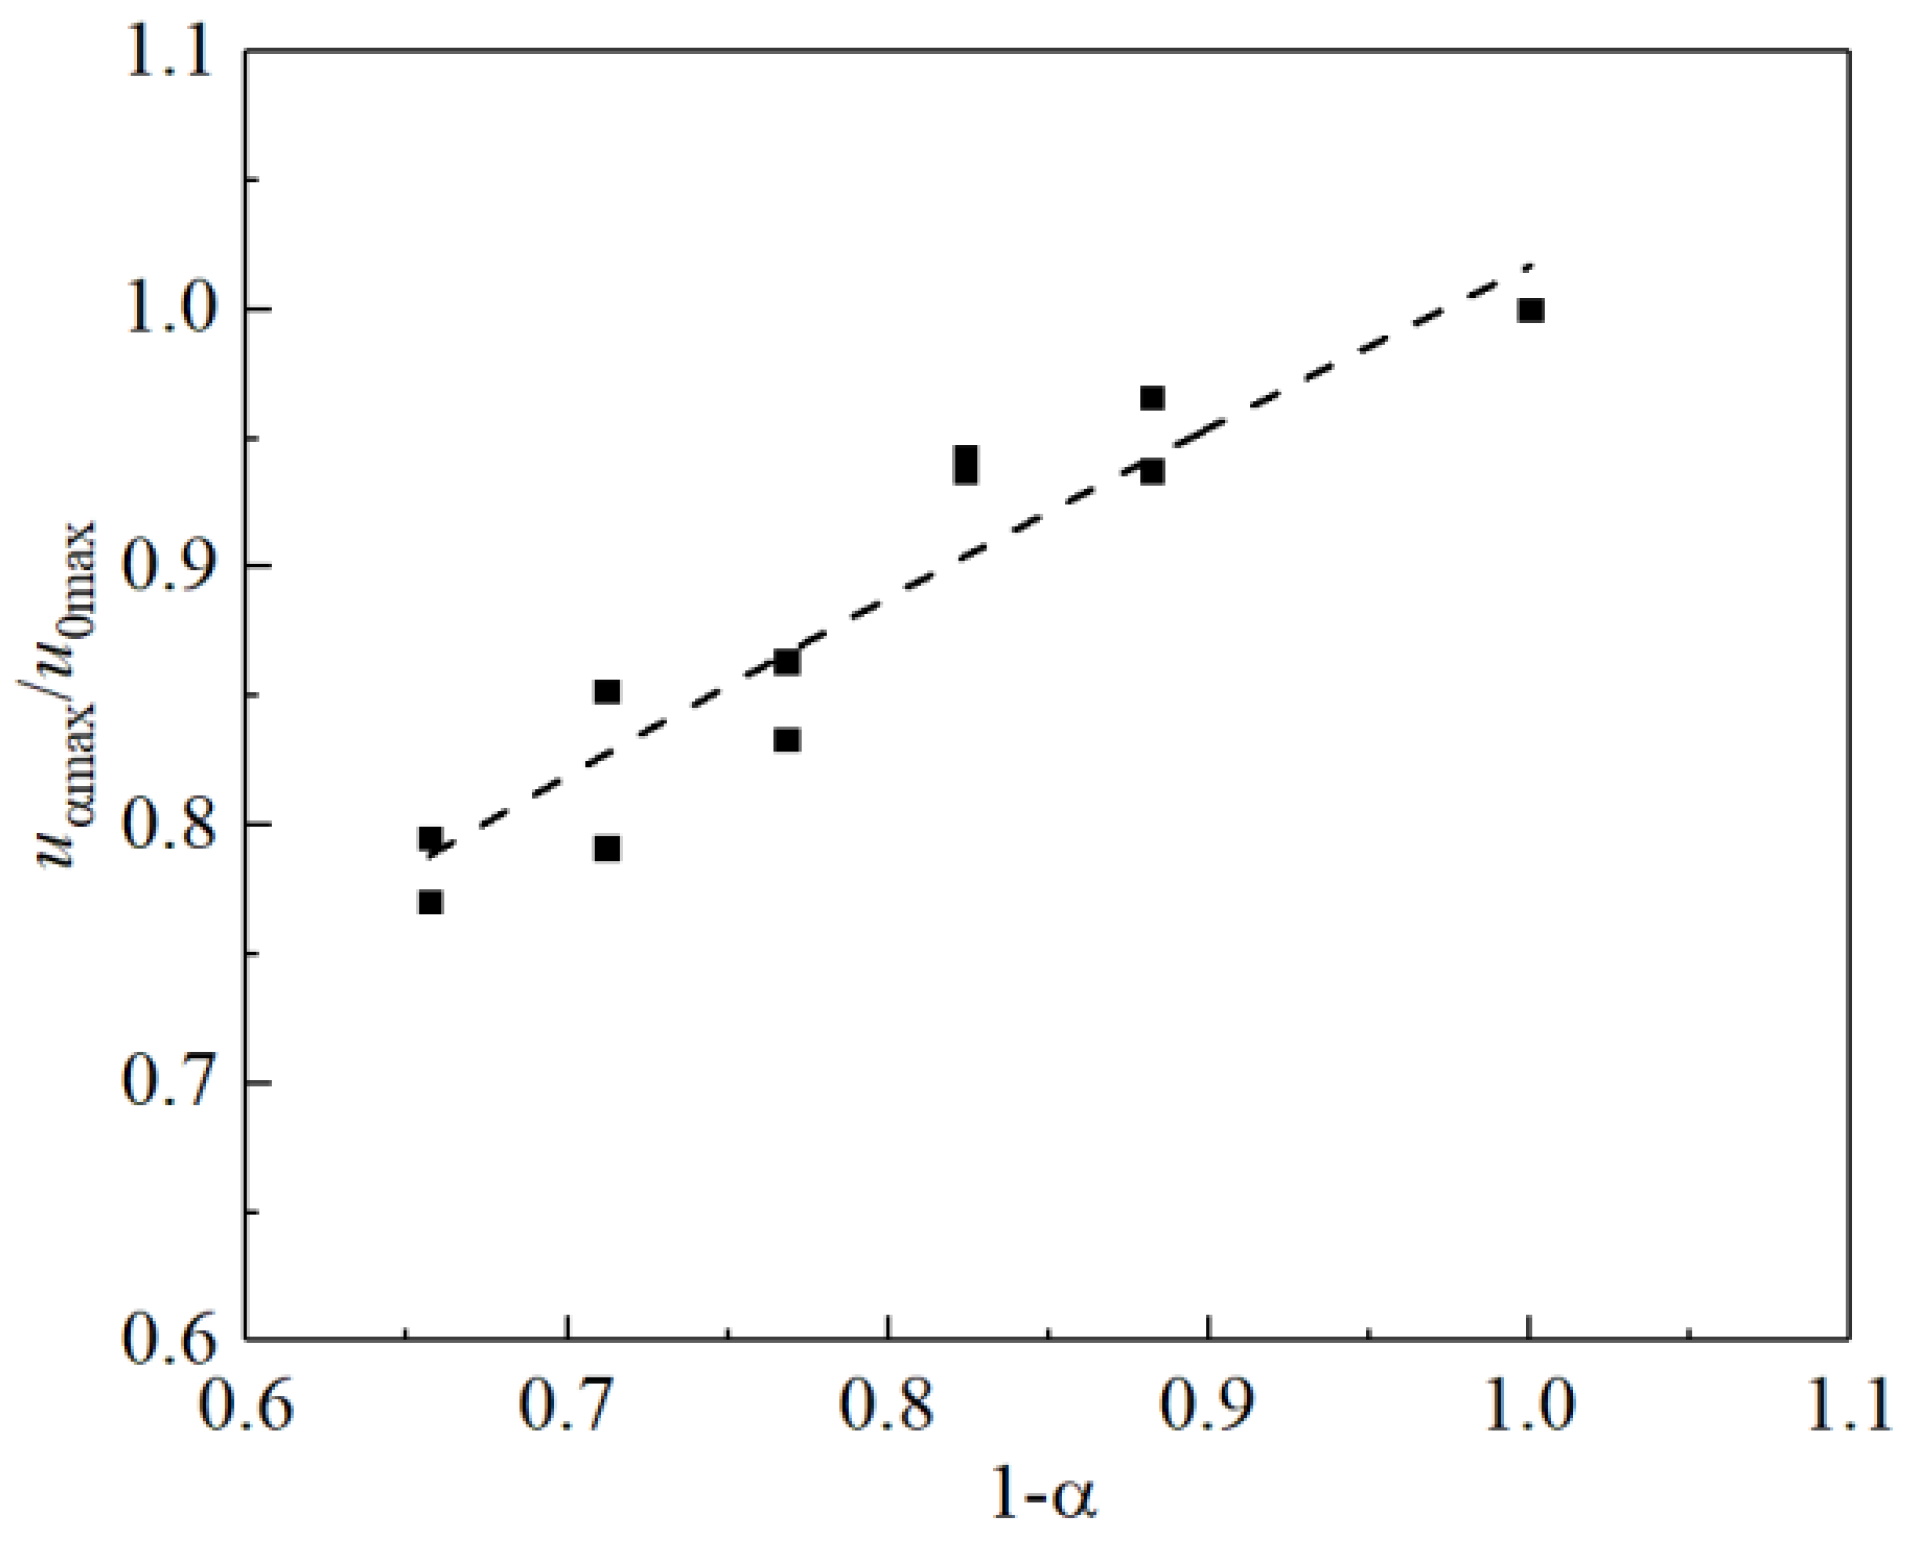
In order to quantify the relationship between the maximum velocity in the mainstream zone and the spur dike permeability coefficient α, the maximum velocity under spur dikes with different permeability coefficient uαmax and the maximum velocity under rock-fill spur dike u0max were compared to obtain the relative maximum velocity uαmax/u0max. The relationship between the relative maximum velocity and the spur dike permeability coefficient is shown in Figure 18.
In this experiment, it was found that when the permeability coefficient of a spur dike was 34.3%, deep scour holes appeared downstream of the dike body, which affects its structural stability. Some scholars have found that the permeable coefficient of a spur dike is generally not any higher than 40%, according to actual engineering and physical model tests run on permeable pile dams [33]. According to the experimental results and previous studies, it can be deduced that when the permeability coefficient of a spur dike is higher than 40%, the spur dike will lose its channel regulation function and the practical significance of building a spur dike will be nullified. Therefore, the permeability of the new permeable groin was set as 0 < α < 40%. The relationship between the maximum velocity in the mainstream zone and the permeability coefficient of the spur dike is as follows:
u α max   = u 0 max ( 1 α ) 0.6   ( 0 < α < 40 % )
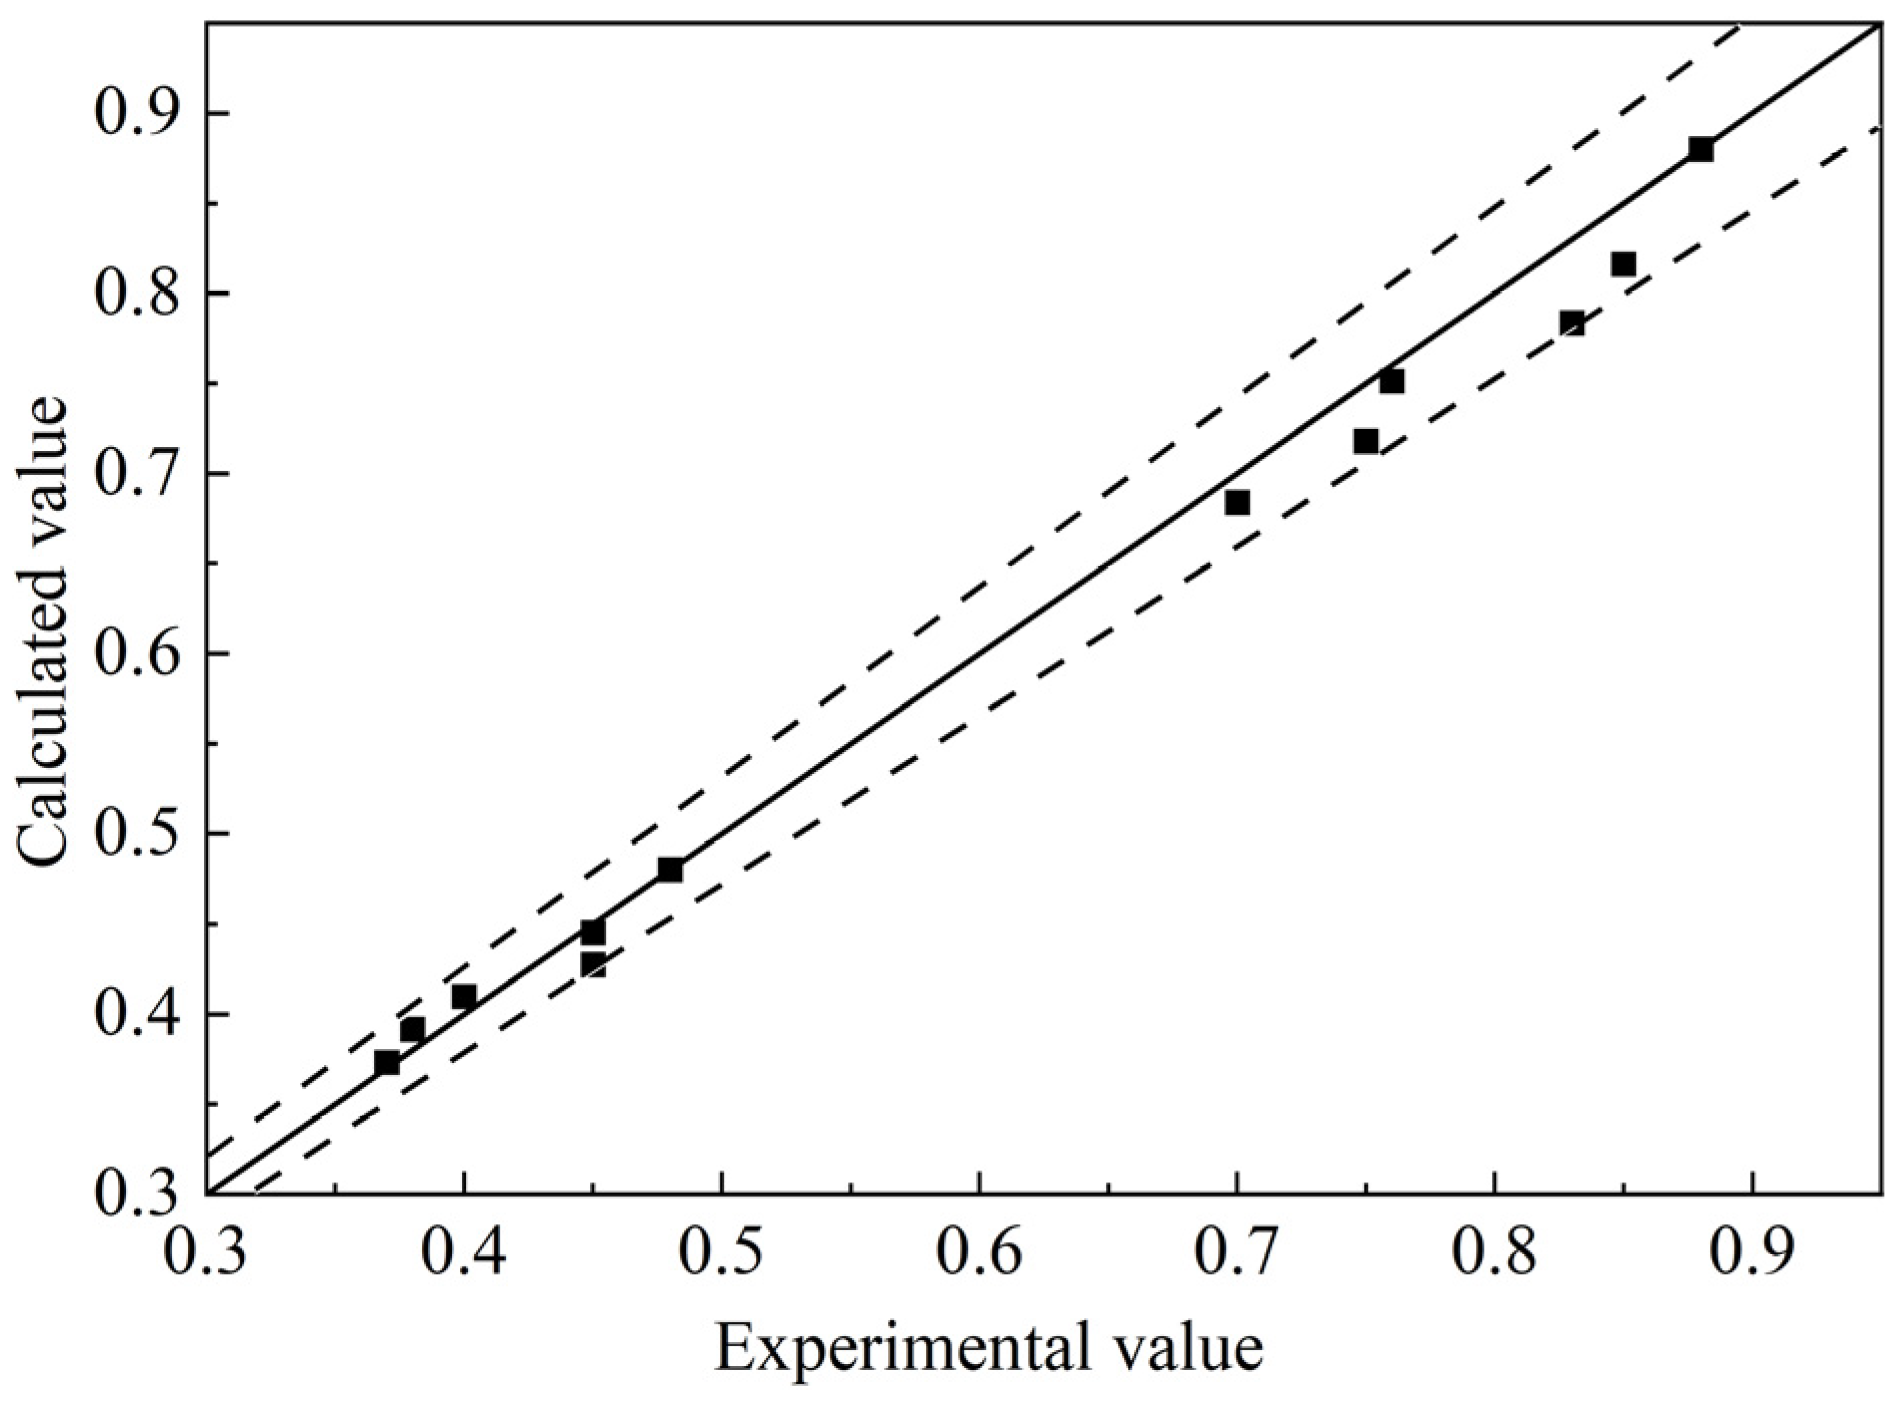
To verify the accuracy of the formula, the calculated value of the relative maximum flow rate was compared with the test value. The dotted line in the Figure 19 is the 95% confidence interval of the data.
It can be seen in the figure that the calculated value is in good agreement with the test value, and the correlation coefficient of the fitting formula is 0.9, indicating that the maximum flow velocity decreases with increases in the permeable coefficient of the spur dike, regardless of whether the spur dike is submerged or not. There is a good quantitative relationship between the maximum velocity uαmax of the channel and the spur dike permeability coefficient, so the spur dike permeability can be reflected by the maximum velocity uαmax of the channel (basically the same as the dike head velocity).
Scouring will start only when the dike head flow velocity uαmax is greater than the sediment competent velocity uc, which is the critical condition for channel scouring. However, scour holes cannot be formed instantaneously; the formation of scour holes is the result of time accumulation. Therefore, the scour hole depth hs is related to the effective sediment scouring time t0. The water release in this test simulated a complete hydrological year process, and the water release time was t. During the experimental process, the flow velocity varied with the flow discharge, and the dike head flow velocity was measured in real time using ADV during the experiment. The total length of time during the experiment when the dike head velocity was greater than the sediment competent velocity is represented by the effective scouring time t0.
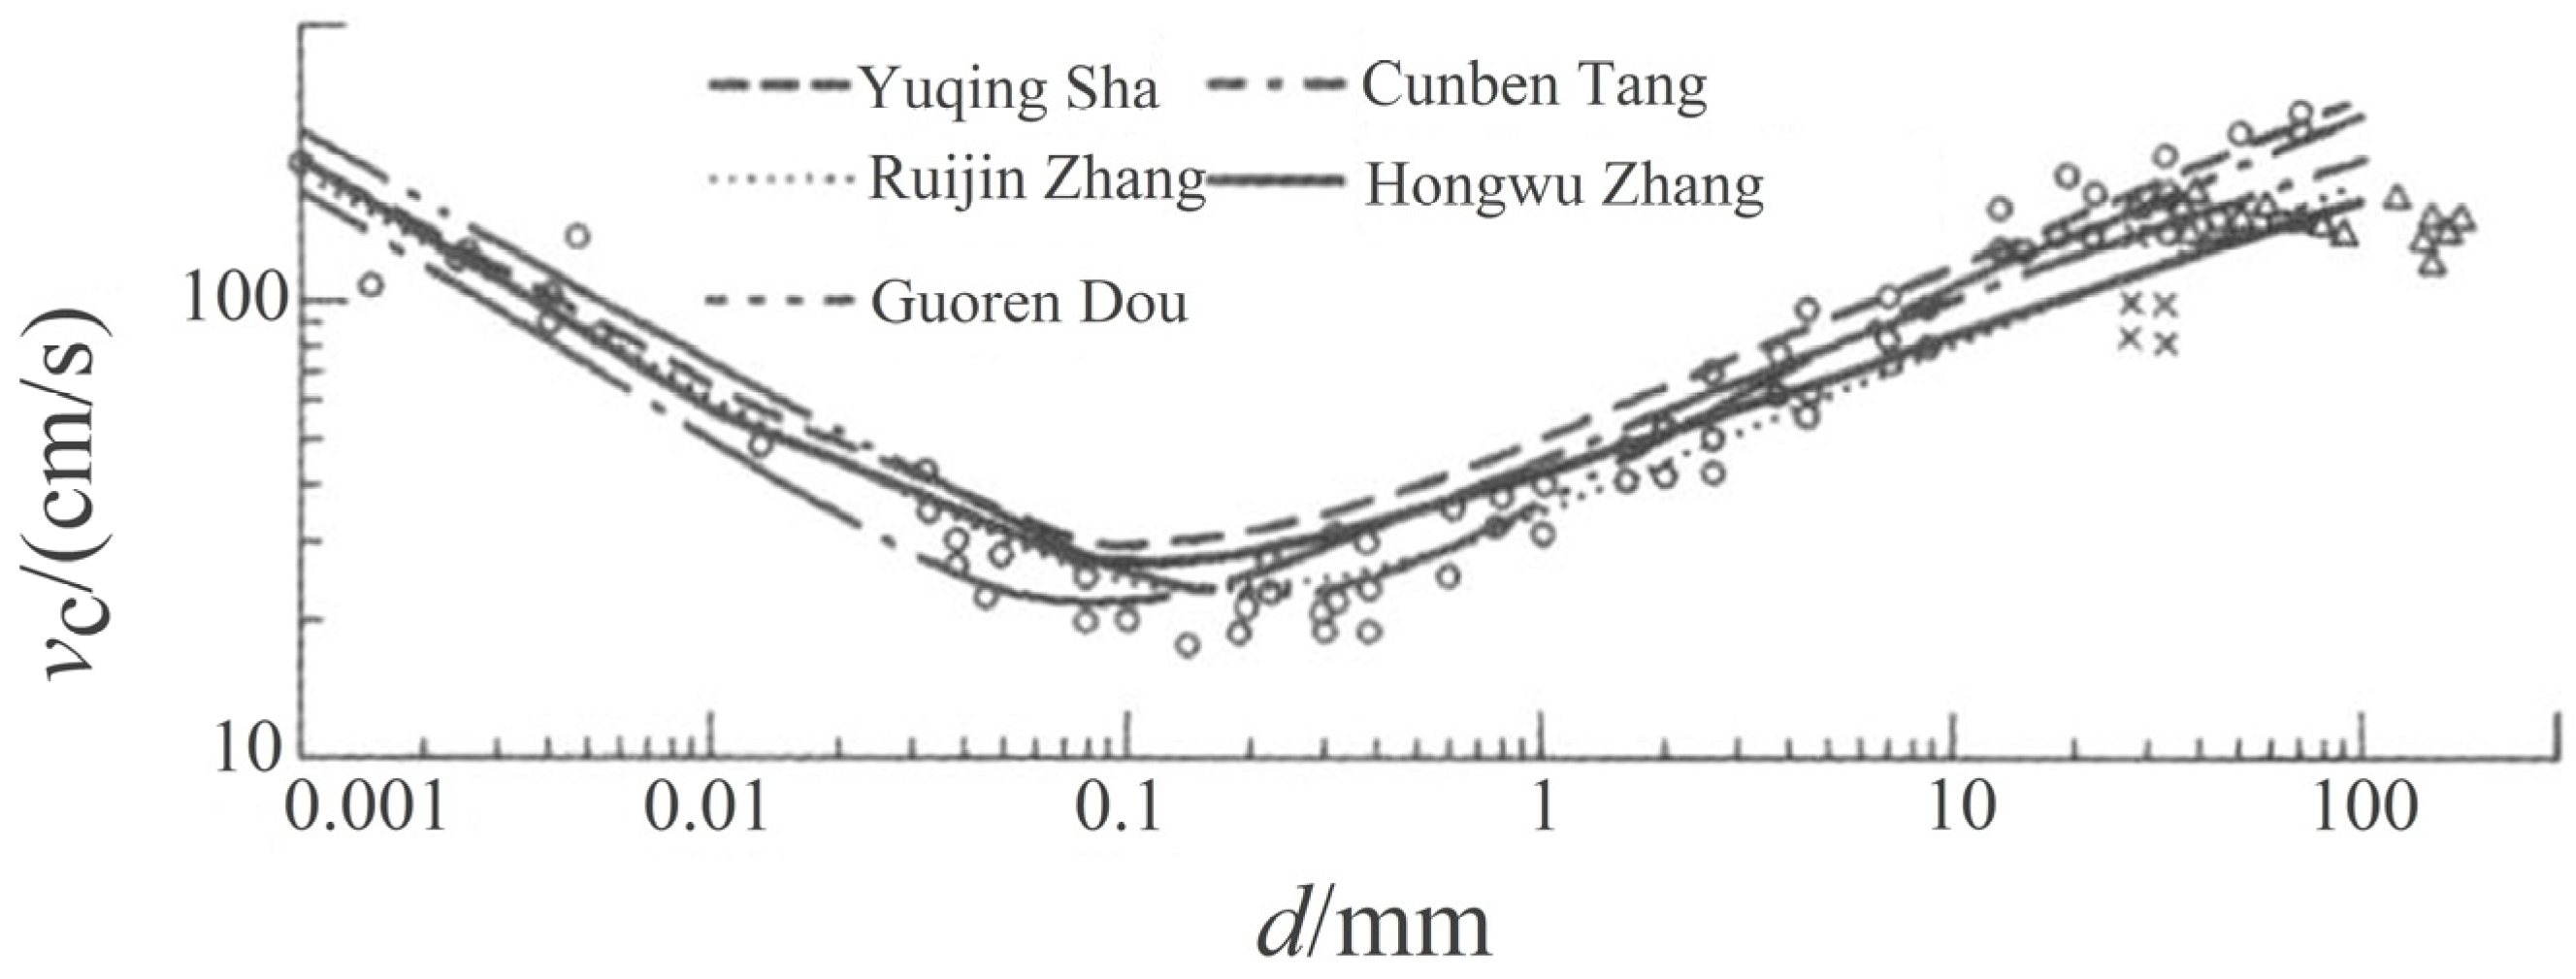
When the grain size of sediment D ≥ 1 mm, gravity is dominant, and the cohesive force can be ignored. When D ≤ 0.01 mm, the cohesive force is dominant, and the gravity can be ignored. When D ≈ 0.1 mm, the interaction between gravity and adhesive force must be considered [28]. The model sand used in this experiment was natural quartz sand for which D50 = 0.15 mm, so it was necessary to consider the gravity and cohesive force of the sediment. The calculation formulas which consider the cohesive force of sediment mainly include the Yuqing Sha formula, the Ruijin Zhang formula, the Guoren Dou formula, the Cunben Tang formula, and the Hongwu Zhang formula (Formulas (4)–(8), respectively).
Yuqing Sha formula:
u c = [ 0.267 ( δ D ) 1 / 4 + 6.67   ×   10 6 ( 0.7 e ) 4 ( δ D ) 2 ] 1 / 2 h 1 / 5 γ s γ γ gD
Ruijin Zhang formula:
u c = ( h D ) 0.14 ( 17.6 γ s γ γ D + 6.05   ×   10 7 10 + h D 0.72 ) 1 / 2
Guoren Dou formula:
u c = 0.32 [ ln ( 11 h K s ) ] ( γ s γ γ gD + 0.19 gh δ + ε k D ) 1 / 2
Cunben Tang formula:
u c = 1   1 + m ( h D ) m ( 3.2 γ s γ γ gD + ( ρ s ρ s 0 ) 10 C ρ D ) 1 / 2
Hongwu Zhang formula:
u c = 1.21 K s ( h D ) 0.2 [ γ s γ γ gD + 2.88 ( γ s γ γ g ) 0.44 ( γ γ c ) 6.6 v 1.11 D 0.67 + 0.000256 ( γ γ c ) 2.5 g ( h 0 + h ) δ ( δ D ) 0.5 / D ] 0.5
The calculation results and measured results of the various formulas are shown in Figure 20 [39].
It can be seen from Figure 20 that the calculation results of various formulas for sediment with a small particle size (D < 1 mm) are relatively close to the test data. By calculating the competent velocity uc of sediment, which in this test was 0.25 m/s, the effective scouring time t0 can be obtained.
According to the analysis in Section 3.2 above, the bottom protection structure will affect the scour hole depth hs at the dike head. The bottom protection structure was not laid for the rock-fill spur dike because the rock-fill spur dike is composed of blocks with different particle sizes, and the bottom of the dike can be seen as the bottom protection structure. The relative width of rock-fill spur dike bottom protection was considered to be one. The permeable spur dike is composed of permeable components, and the bottom protection structure was laid. The bottom protection structure beyond the spur dike range was B1, and the relative width of permeable spur dike bottom protection was 1 + B1/B.
Therefore, in this experiment, the depth of the scour hole at the dike head was affected by the velocity at the dike head uαmax, the sediment competent velocity uc, the bottom protection width B1, and the effective scour time t0. The calculation formula is:
h s = f ( g ,   h ,   u α max ,   u c ,   t 0 ,   t ,   B 1 ,   B )
After dimensionless processing:
h s h = f ( t 0 t , u α max u c gh ,   1 + B 1 B )
where h s is the depth of scour holes; h is the depth of the water; h s h is the relative maximum scouring depth; t0 is the effective scouring time; t is the whole flow process time; t 0 t is the proportion of effective scouring time; uc is the competent velocity of sediment; uαmax is the velocity at dike head; u α max u c gh is the competent motion Fr of dike head sediment; B1 is the width of bottom protection; B is the width of spur dike; and 1 + B 1 B is the relative width of bottom protection structure.
The calculation formula of scour hole depth at dike head is obtained through nonlinear fitting:
h s h = 1.06 ( t 0 t ) 0.11 ( u α max u c gh ) 1 / 2 ( 1 + B 1 B ) 1 / 3
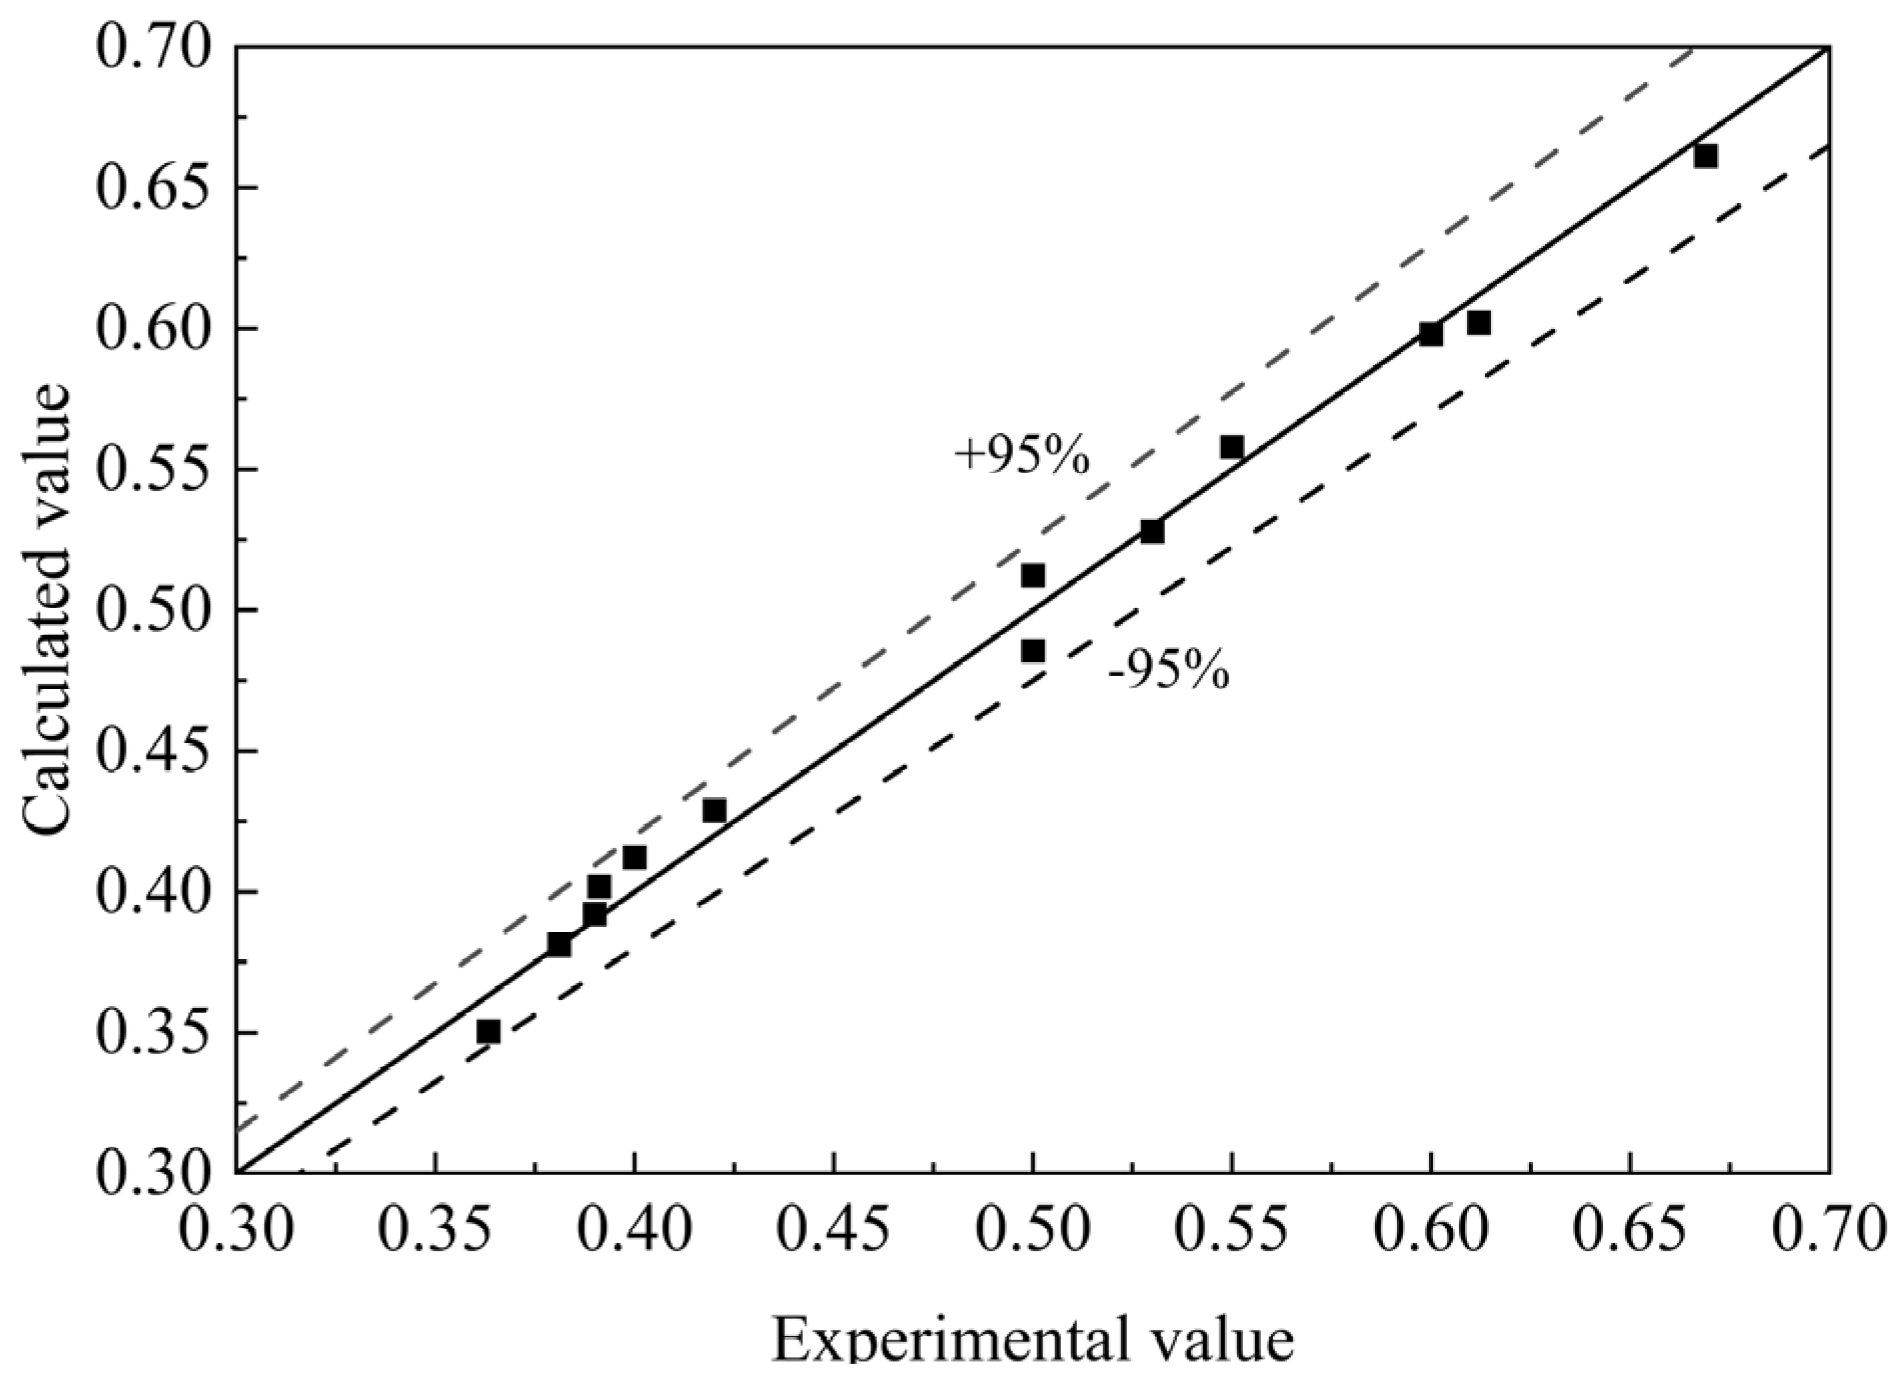
The depth of the scour hole at the dike head calculated using the above formula was compared with the experimental value, as shown in Figure 21. The dotted line in the figure is the 95% confidence interval of the data.
It can be seen from Figure 21 that the calculated value is in good agreement with the experimental value, and the correlation coefficient of the fitting formula is 0.93. According to the above analysis, the scour hole at the dike head is mainly related to the flow velocity at the dike head, the width of bottom protection structure, and the effective scouring time, while the dike head flow velocity is directly affected by the permeability of spur dike. Therefore, the stability of a riverbed and the reliability of a spur dike can be ensured by appropriately increasing the permeability coefficient of the spur dike and strengthening the bottom protection of the spur dike during the waterway regulation and maintenance of spur dikes.

4. Discussion

In this study, the variation laws of the scour areas and the scour depths of the riverbeds around spur dikes were obtained under different permeability coefficients. The test results and those of previous studies [12,13] show that the maximum scouring depth and scouring area at dike head scour holes decrease with increases in the permeability coefficient of the spur dike. This study found that the depth and area of scour holes downstream of the dike body increased with increases in the permeability coefficient of the spur dike. A previous study [12] only showed that the siltation downstream of permeable spur dikes was smaller than that of solid dike but did not quantify the relationship with water permeability. In this study, the scour of the dam head and downstream of the dam body were considered comprehensively, and the relationship between the overall scour area and the permeability was quantified. With an increase in the dike permeability coefficient, the overall scour area showed a trend of first increasing and then decreasing. When the dike permeability coefficient is 17.6%, the overall stability of the spur dike structure is the best.
There are many formulas for calculating the maximum depth of scour holes at the dike head, but most of them are analyzed based on such factors as bed sediment, flow conditions, and the geometric characteristics of the spur dike, and they are mostly analyzed based on solid spur dikes; the influence of the permeability coefficient of the spur dike on the maximum depth of scour holes at the dike head is rarely considered. This study mainly focused on the analysis of permeable spur dikes. Under the same flow discharge, the permeability coefficient directly affected the velocity at the dike head, thus affecting the sediment initiation. By quantifying the relationship between the dike head flow discharge and the velocity at the dike head, the effective scour time with different permeability coefficient was calculated under the same flow process, and then a formula considering the dike head permeability coefficient, effective scour time, and the maximum scour hole depth was established.
Since only the permeability coefficient of the spur dike was altered in this experiment, and the flow process was relatively simple. Factors such as sediment conditions, flow conditions, and the geometry of the spur dike were not taken into consideration. However, this experiment focused on permeable spur dikes, considering factors such as bottom protection structure and effective scouring time. A formula for calculating the maximum depth of scour holes at the head of a permeable spur dike has been put forward, which provides a reference for the design of permeable spur dikes. Subsequently, multi-factor variable experiments can be conducted to further obtain a more widely applicable calculation formula.

5. Conclusions

Movable bed experiments were conducted to study the effects of new permeable spur dikes and the rock-fill spur dike on channel scour, and the following conclusions were obtained:
(1)
The maximum depth and area of scour holes at the head of the spur dike decrease with an increase in the spur dike permeability coefficient. When the permeability is greater than 17.6%, the depth and area of scour holes downstream of the dike body will increase. Overall, the structure is the most stable when the permeability coefficient of the spur dike is 17.6%.
(2)
The maximum depth of the scour hole at the head of a permeable spur dike is mainly affected by the permeability coefficient of the spur dike, the width of the bottom protection structure, and the effective scouring time, among which the permeability coefficient of the spur dike is the most important factor.

Author Contributions

Conceptualization, J.H.; methodology, J.H.; validation, G.W., T.Y. and H.C.; formal analysis, J.H.; investigation, T.Y.; resources, P.W.; data curation, J.H., G.W.; writing—original draft preparation, J.H.; writing—review and editing, J.H.; supervision, P.W. and H.C.; project administration, P.W. and H.C.; funding acquisition, H.C. All authors have read and agreed to the published version of the manuscript.

Funding

This research was funded by the Key project of intergovernmental International Science and Technology Innovation Cooperation (2022YFE0104500), Natural Science Foundation of China (52001149) and the Fund of Tianjin Institute of Water Transport Engineering, Ministry of Transport (TKS20220505).

Institutional Review Board Statement

Not applicable.

Informed Consent Statement

Not applicable.

Data Availability Statement

The data in figures and tables used to support the findings of this study are included herein.

Acknowledgments

We are particularly grateful to Chengyu Yang for assisting on experiments.

Conflicts of Interest

The authors declare that they have no conflict of interest.

References

  1. Pandey, M.; Ahmad, Z.; Sharma, P.K. Scour around impermeable spur dikes: A review. ISH J. Hydraul. Eng. 2018, 24, 25–44. [Google Scholar] [CrossRef]
  2. Singh, U.K.; Ahmad, Z.; Kumar, A.; Pandey, M. Incipient motion for gravel particles in cohesionless sediment mixtures. Iran. J. Sci. Technol. Trans. Civ. Eng. 2019, 43, 253–262. [Google Scholar] [CrossRef]
  3. Azamathulla, H.M.; Ghani, A.A.; Zakaria, N.A.; Guven, A. Genetic programming to predict bridge pier scour. J. Hydraul. Eng. 2010, 136, 165. [Google Scholar] [CrossRef] [Green Version]
  4. Azamathulla, H.M.; Yusoff, M.; Azlan, M. Soft computing for prediction of river pipeline scour depth. Neural Comput. Appl. 2013, 23, 2465–2469. [Google Scholar] [CrossRef]
  5. Pandey, M.; Lam, W.H.; Cui, Y.; Khan, M.A.; Singh, U.K.; Ahmad, Z. Scour around spur dike in sand–gravel mixture bed. Water 2019, 11, 1417. [Google Scholar] [CrossRef] [Green Version]
  6. Haghnazar, H.; Hashemzadeh Ansar, B.; Asadzadeh, F.; Salehi Neyshabouri, A.A. Experimental study on the effect of single spur-dike with slope sides on local scour pattern. J. Civ. Eng. Mater. Appl. 2018, 2, 111–120. [Google Scholar]
  7. Fazli, M.; Ghodsian, M.; Neyshabouri, S.A.A.S. Scour and flow field around a spur dike in a 90 bend. Int. J. Sediment Res. 2008, 23, 56–68. [Google Scholar] [CrossRef]
  8. Kuhnle, R.A.; Alonso, C.V.; Shields, F.D. Geometry of scour holes associated with 90 spur dikes. J. Hydraul. Eng. 1999, 125, 972–978. [Google Scholar] [CrossRef]
  9. Masjedi, A.; Bejestan, M.S.; Moradi, A. Experimental study on the time development of local scour at a spur dike in a 180 flume bend. J. Food Agric. Environ. 2010, 8, 904–907. [Google Scholar]
  10. Nasrollahi, A.; Ghodsian, M.; Neyshabouri, S. Local scour at permeable spur dikes. J. Appl. Sci. 2008, 8, 3398–3406. [Google Scholar] [CrossRef] [Green Version]
  11. Mioduszewski, T.; Maeno, S.; Uema, Y. Influence of the spur dike permeability on flow and scouring during a surge pass. In International Conference on Estuaries and Coasts; ICEC: Irvine, CA, USA, 2003; pp. 380–388. [Google Scholar]
  12. Zhou, Y.J.; Qian, S.; Sun, N.N. Application of permeable spur dike in mountain river training. In Applied Mechanics and Materials; Trans Tech Publications Ltd.: Stafa-Zurich, Switzerland, 2014; pp. 236–240. [Google Scholar]
  13. Osman, M.A.; Saeed, H.N. Local scour depth at the nose of permeable and impermeable spur dykes. Univ. Khartoum Eng. J. 2012, 2. [Google Scholar] [CrossRef]
  14. Elawady, E.; Michiue, M.; Hinokidani, O. Movable bed scour around submerged spur-dikes. Proc. Hydraul. Eng. 2001, 45, 373–378. [Google Scholar] [CrossRef]
  15. Nath, D.; Misra, U.K. Experimental study of local scour around single spur dike in an open channel. Int. Res. J. Eng. Technol. IRJET 2017, 4, 2728–2734. [Google Scholar]
  16. Li, Y.; Altinakar, M. Effects of a Permeable Hydraulic Flashboard Spur Dike on Scour and Deposition. In World Environmental and Water Resources Congress; ASCE: New York, NY, USA, 2016; pp. 399–409. [Google Scholar]
  17. Ezzeldin, R.M. Numerical and experimental investigation for the effect of permeability of spur dikes on local scour. J. Hydroinformatics 2019, 21, 335–342. [Google Scholar] [CrossRef]
  18. Pandey, M.; Ahmad, Z.; Sharma, P.K. Estimation of maximum scour depth near a spur dike. Can. J. Civ. Eng. 2016, 43, 270–278. [Google Scholar] [CrossRef] [Green Version]
  19. Dey, S.; Barbhuiya, A.K. Time variation of scour at abutments. J. Hydraul. Eng. 2005, 131, 11–23. [Google Scholar] [CrossRef]
  20. Froehlich, D.C. Local scour at bridge abutments. In Hydraulic Engineering; ASCE: New York, NY, USA, 1989; pp. 13–18. [Google Scholar]
  21. Nagy, H.M. Maximum depth of local scour near emerged vertical wall spur dike. Alex. Eng. J. 2004, 43, 819–829. [Google Scholar]
  22. Patel, M. Scour Control at Skew Bridge Abutments by the Use of Spur Dikes, a Report for CE 406-Special Problems in Civil Engineering. By MS Patel, Submitted to JB Herbich. 1961. Available online: https://core.ac.uk/download/pdf/228624277.pdf (accessed on 23 November 2022).
  23. Gill, M.A. Erosion of sand beds around spur dikes. J. Hydraul. Div. 1972, 98, 1587–1602. [Google Scholar] [CrossRef]
  24. Lauchlan, C.S.; Melville, B.W. Riprap protection at bridge piers. J. Hydraul. Eng. 2001, 127, 412–418. [Google Scholar] [CrossRef]
  25. Ying, Q. Formula Type of Local Scour Depth on Spur Dike Nose. In Applied Mechanics and Materials; Trans Tech Publications Ltd.: Stafa-Zurich, Switzerland, 2014; pp. 271–274. [Google Scholar]
  26. Pandey, M.; Valyrakis, M.; Qi, M.; Sharma, A.; Lodhi, A.S. Experimental assessment and prediction of temporal scour depth around a spur dike. Int. J. Sediment Res. 2021, 36, 17–28. [Google Scholar] [CrossRef]
  27. Kothyari, U.C.; Hager, W.H.; Oliveto, G. Generalized approach for clear-water scour at bridge foundation elements. J. Hydraul. Eng. 2007, 133, 1229–1240. [Google Scholar] [CrossRef]
  28. Singh, U.K.; Jamei, M.; Karbasi, M.; Malik, A.; Pandey, M. Application of a modern multi-level ensemble approach for the estimation of critical shear stress in cohesive sediment mixture. J. Hydrol. 2022, 607, 127549. [Google Scholar] [CrossRef]
  29. Pandey, M.; Jamei, M.; Ahmadianfar, I.; Karbasi, M.; Lodhi, A.; Chu, X. Assessment of scouring around spur dike in cohesive sediment mixtures: A comparative study on three rigorous machine learning models. J. Hydrol. 2022, 606, 127330. [Google Scholar] [CrossRef]
  30. Ambari, A.; Gauthier-Manuel, B.; Guyon, E. Backflow effect in model sedimentation experiments. Phys. Fluids Fluid Dyn. 1993, 5, 2061–2063. [Google Scholar] [CrossRef]
  31. Azinfar, H.; Kells, J. Backwater effect due to a single spur dike. Can. J. Civ. Eng. 2007, 34, 107–115. [Google Scholar] [CrossRef]
  32. Wang, H. Impact Distance of Spur Dike Head on Navigable Flow Conditions; Changsha University of Technology: Changsha, China, 2010; (In Chinese with English abstract). [Google Scholar]
  33. Zhou, Y.; Liu, H.; He, C. Rational Selection of Design Parameters for Pervious Spur Dikes. J. Water Resour. Water Eng. 2006, 17, 42–45, (In Chinese with English abstract). [Google Scholar]
  34. Kothyari, U.C.; Garde, R.C.J.; Ranga Raju, K.G. Temporal variation of scour around circular bridge piers. J. Hydraul. Eng. 1992, 118, 1091–1106. [Google Scholar] [CrossRef]
  35. Fael, C.M.S.; Simarro-Grande, G.; Martín-Vide, J.P.; Cardoso, A.H. Local scour at vertical-wall abutments under clear-water flow conditions. Water Resour. Res. 2006, 42. [Google Scholar] [CrossRef] [Green Version]
  36. Zhang, L.; Wang, P.; Yang, W.; Zuo, W.; Gu, X.; Yang, X. Geometric characteristics of spur dike scour under clear-water scour conditions. Water 2018, 10, 680. [Google Scholar] [CrossRef] [Green Version]
  37. Rodrigue-Gervais, K.; Biron, P.M.; Lapointe, M.F. Temporal development of scour holes around submerged stream deflectors. J. Hydraul. Eng. 2011, 137, 781–785. [Google Scholar] [CrossRef] [Green Version]
  38. Kuhnle, R.A.; Alonso, C.V.; Shields, F.D., Jr. Local scour associated with angled spur dikes. J. Hydraul. Eng. 2002, 128, 1087–1093. [Google Scholar] [CrossRef]
  39. Zhang, H. Unified formula for incipient velocity of sediment. J. Water Conserv. 2012, 43, 1387–1396, (In Chinese with English abstract). [Google Scholar]
Figure 1. Experiment arrangement (unit: cm).
Sustainability 15 00570 g001
Figure 2. Example of spur dike engineering.
Sustainability 15 00570 g002
Figure 3. Sectional view of spur dike (unit: cm).
Sustainability 15 00570 g003
Figure 4. Curve of the spur dike body (unit: cm).
Sustainability 15 00570 g004
Figure 5. The longitudinal section of the new spur dike (unit: cm).
Sustainability 15 00570 g005
Figure 6. Longitudinal profile of permeable member: (a) a permeability coefficient of 34.3%, (b) a permeability coefficient of 28.8%, (c) a permeability coefficient of 23.2%, (d) a permeability coefficient of 17.6%, (e) a permeability coefficient of 11.8% (unit: cm).
Sustainability 15 00570 g006
Figure 7. Stereogram of a permeable spur dike.
Sustainability 15 00570 g007
Figure 8. Flow process comparison.
Sustainability 15 00570 g008
Figure 9. Model flow process.
Sustainability 15 00570 g009
Figure 10. Layout of velocity measuring points.
Sustainability 15 00570 g010
Figure 11. Topographic surveying instrument.
Sustainability 15 00570 g011
Figure 12. Channel topography map of the area around the traditional rock-fill spur dike.
Sustainability 15 00570 g012
Figure 13. Local scour topographic map of channel: (a) new structure rock-fill spur dike, (b) the spur dike for which α = 11.8%, (c) the spur dike for which α = 17.6%, (d) the spur dike for which α = 23.2%, (e) the spur dike for which α = 28.8%, (f) the spur dike for which α = 34.3%.
Sustainability 15 00570 g013
Figure 14. Scour range map.
Sustainability 15 00570 g014
Figure 15. Lateral elevation.
Sustainability 15 00570 g015
Figure 16. Longitudinal elevation.
Sustainability 15 00570 g016
Figure 17. Diagram showing the relationship between the maximum flow velocity in the mainstream zone and the permeability coefficient of the spur dike.
Sustainability 15 00570 g017
Figure 18. Relation diagram of relative maximum velocity and spur dike permeability coefficient.
Sustainability 15 00570 g018
Figure 19. Comparison between calculated value and test value.
Sustainability 15 00570 g019
Figure 20. Comparison diagram of calculation results and measurement results of various formulas.
Sustainability 15 00570 g020
Figure 21. Comparison between calculated value and experimental value.
Sustainability 15 00570 g021
Disclaimer/Publisher’s Note: The statements, opinions and data contained in all publications are solely those of the individual author(s) and contributor(s) and not of MDPI and/or the editor(s). MDPI and/or the editor(s) disclaim responsibility for any injury to people or property resulting from any ideas, methods, instructions or products referred to in the content.