Article

Identifying Market Segment for the Assessment of a Price Premium for Green Certified Housing: A Cluster Analysis Approach

1
Department of Architectural and Urban Studies, Graduate School of Industry, University of Ulsan, Ulsan 680-749, Republic of Korea
2
Department of Architectural Engineering, School of Architecture, University of Ulsan, Ulsan 680-749, Republic of Korea
*
Author to whom correspondence should be addressed.
Sustainability 2023, 15(1), 507; https://doi.org/10.3390/su15010507
Submission received: 16 November 2022 / Revised: 6 December 2022 / Accepted: 22 December 2022 / Published: 28 December 2022

Abstract

:
While the literature confirms the existence of a green premium, various researchers have acknowledged the importance of homogeneity in the dataset used for premium assessment. This study developed a systematic approach to extract a sales subsample containing transactions from green-certified apartments and their most similar counterparts based on cluster analysis. The study applied k-means and PAM clustering algorithms to split an extensive sales sample of 81,605 transactions into sales subsamples. A sales subsample containing transactions from green-certified apartments and their peers was extracted and used for green premium estimation. The results indicate that through cluster analysis, a market segment containing above 80% of the total housing transactions from green-certified apartments could be identified. Through the hedonic model, a green premium of 26.2% was identified from the entire sales sample (no market segmentation). However, this value was reduced to 12.2 and 17.8% when estimated from a sales subsample extracted through k-means and PAM clustering, respectively. These findings have implications for the close assessment of green certification impact on the sale prices. In addition, they can also serve as an indicator of housing categories that need extra effort to promote green practices in that particular market segment.

1. Introduction

The building sector is one of the major energy consuming sectors worldwide. For instance, it is reported that commercial and residential buildings alone consume about 40% of the total primary energy and are responsible for around 38% of greenhouse gas emissions [1]. For decades, the amount of energy consumed in buildings has been on the rise, highlighting the need for effective measures to promote building sustainability. In fact, according to the IEA (International Energy Agency), the building sector’s energy consumption is predicted to rise by 50% by 2050 if no effort is made to actively encourage building energy efficiency [2].
Building energy codes and standards started as an effort to transform how buildings were designed, constructed, and operated with the aim to reduce building energy use and the resulting environmental load. In order to evaluate a building’s performance, it is necessary to have a set of measuring tools and a rating system that can assess whether, and how well, a given building or construction project has met particular standards, upon which a green certification is issued. From a practical viewpoint, green building certification systems are developed as instruments to promote green practices in the building sector by giving recognition to sustainable buildings and providing buyers with third-party verification of the building performance. Although the overall structure and rating of green building certification systems differ among different nations and organizations, the main and common advantage of green-certified buildings is that they offer improved indoor quality with relatively low energy consumption. Given the expected benefits of green buildings, buyers are willing to pay more for certified buildings, which eventually generates the so-called “green price premium”. Nonetheless, despite this green premium and other government incentives (e.g., tax reduction), building stakeholders are often hesitant to invest in green building, mainly due to concerns that the additional costs required to acquire green certification may erode the financial benefits of green buildings [3]. According to building developers, “going green” can increase a construction project’s cost by 0.9% to 29% [4], and hence it is often perceived as a delicate investment. To prove the economic viability of green buildings, studies have analyzed the relationship between green certification and price on the real estate market. The majority of these studies share a common method: (1) a green premium is estimated from a sales sample containing transactions from a given real estate market; and (2) regression is applied to quantify the influence of each building attribute (including green certification) on the price.

1.1. Green Certification and Real Estate Market

Through the literature, a relationship between the sale or rental price and green labels from mature rating systems such as BREEAM (Building Research Establishment Environmental Assessment Method) in the United Kingdom, LEED (Leadership in Energy and Environmental Design), and Energy Star [5,6,7] in the United States have been extensively analyzed and stand in contrast with the relatively small number of investigations involving recently developed green certification programs such as G-SEED (Green Standard for Energy and Environmental Design) in South Korea [8]. Although in some case studies the findings are inconclusive, most of the studies have reported that green-certified buildings are sold or rented at a higher price than non-certified buildings. Nonetheless, the magnitude of this green premium varies greatly even when similar methodologies are used. A literature review on the real estate market transformation toward green [9] argued that a large discrepancy in the reported green premium might be among the reasons for a slow diffusion of green practices in the building sector.
While some studies have tended to link the variation in the green premium to local climate characteristics, others have argued that it could equally be an issue of the improper control of variables, the real estate market structure, or the homogeneity of the sale sample used. For instance, the Bio Intelligence Service [10] analyzed the impact of EPBD (Energy Performance of Building Directive) in several cities in Austria, Belgium, France, and the United Kingdom (UK). Apart from the spatial variation in green premium caused by differences in the energy efficiency schemes and climate types, the authors highlighted that for some cities such as Oxford in the UK, the estimated negative relationship between housing price and energy rating could be a result of a lack of consideration of the real estate characteristics in the city where mansions in good locations are sold at a higher price despite their age and energy rankings. The authors acknowledged that a market segmentation would control the impact of such particular real estate characteristics, hence allowing for more precise green premium estimations.
On a similar note, some case studies have investigated whether the green effect is homogenous across the real estate market by carrying out market-segment-based analysis. For most of these studies, univariate segmentation of the sales dataset was conducted considering variables such as typology, age, size, or the location of the buildings. Based on a quantile regression approach, McCord et al. [11] found that the price premium of energy certified buildings varied across the house pricing distribution in Ireland and highlighted that only buildings in the upper quantiles showed a significant green premium. Similarly, Wilhelmsson [12] combined a hedonic model and quantile regression technique to estimate green premiums from across the price distribution and spatial framework in Sweden. His findings indicate that while energy certified buildings are capitalized in colder regions, their price premium is not homogenous across the price distribution.
In keeping with the role of market segmentation, the authors in [13] investigated whether the impact of energy rating on housing sales in Barcelona was the same. Their results suggest that for new homes with luxurious features and are of high quality, energy ratings have no influence on their real estate market. In contrast, cheaper homes, usually located in low-income areas, indicated a higher green premium. In a similar vein, Kim [14] reported that the green premium for apartment complexes in South Korea varied from 18.3% for small complexes to 54.6% for large complexes, highlighting discrepancies in the green premium across market segments.

1.2. Research Contribution

The existing body of research clearly shows persuasive evidence that determining the correlation between green building certification and real estate market value is a complex task. Large variations in market characteristics, building attributes, pricings, and the buyers’ priorities may be behind the discrepancies in the reported green premium. As such, to ensure the most precise estimation of the relationship between green certification and building price, it is crucial to consider the uniformity of the transactions to be analyzed. The purpose of this study was to develop a systematic approach to control for potential biases that could affect the findings of earlier studies.
The study addresses concerns of homogeneity in a sales sample by extracting a sales subsample with balanced covariates in both groups (green-certified buildings and their non-certified counterparts). In this context, rather than dissecting the sales sample based on univariate segmentation, machine learning techniques can be applied to form different subsamples of housing sales based on a combination of major factors influencing the sale prices in the real estate market. Unlike the studies reviewed, this study takes into consideration the fact that segments of the real estate market are the result of the combination of multiple attributes representing building and location features.
Considering that most ordinary home buyers do not have specialized knowledge of building greenness, for developers to achieve economic viability of a green project, it is important to ensure that a building maximizes all of the attributes of a good home for market recognition. In fact, Wilkinson and Sayce [15] reported that in the real estate market, the visible characteristics of a building (e.g., size, age, neighborhood attributes) can be more important in determining its value than any certification. A price mismatch in the anticipated value (by the project developer) and the buyer’s perceived value can arise if a green-certified building cannot credibly present its “greenness” to potential buyers. Therefore, this study hypothesizes that from a housing sales sample containing all apartment complex transactions, natural data-driven subsamples exist, and transactions from certified apartments are constituted in a sales subsample characterizing high-quality housing from both green-certified and ordinary apartment complexes. We add to the existing literature by developing a methodology to improve the homogeneity of a sales dataset to be used for the evaluation of the green effect. First, we demonstrate how cluster analysis, one of the widely used unsupervised machine learning techniques, can be applied to extract a subsample of housing transactions from certified apartments and their counterparts by considering multiple attributes influencing the housing price on the real estate market. Second, we analyze the existence and magnitude of a green premium within a group of housing units with similar attributes, hence providing more accurate and credible information for developers and other parties involved.

2. Methods

Figure 1 illustrates the methodological framework of the study. First, the achieved housing sale transactions in Seoul, South Korea for a period of one year were collected and cleaned. Second, clustering algorithms were applied to extract a sales subsample comprising housing transactions from green-certified apartments and their counterparts, non-certified apartments. Third, a green price premium was assessed from the extracted sales subsample through a hedonic model. In this section, we provide details on the sales data used, the variables and algorithms for cluster analysis, and the hedonic model applied in this study.

2.1. Data Collection and Cleaning

This study used housing transactions that occurred during 2018 in all twenty-five districts of Seoul, the capital city of South Korea. The city was selected as the study area due to the dynamism of its real estate market, which is characterized by a low percentage of owner-occupancy (below 50%). In addition, despite the city accounting for only 10% of the country’s geographic area, it hosts around 50% of the country’s population, resulting in a constant high housing demand [16]. The study analyzed the green effects on the residential market with a focus on apartments, as more than 60% of Koreans live in apartment complexes. A total of 81,605 housing transactions that took place during 2018 in all apartment complexes in the city was drawn from the housing transaction price system maintained by the Korean Ministry of Land, Infrastructure, and Transport. For each of the transactions, we collected information regarding the housing attributes, neighborhood attributes, and the green certification status of the apartment involved in the transaction.
Housing attributes were selected based on the factors identified as influencing apartment pricing in South Korea in the literature [17]. Accordingly, the floor size of the housing unit, floor level, age of the apartment, and the size of the complex (i.e., the total number of housing units in the apartment complex) were selected as variables defining the housing attributes. Regarding the neighborhood attributes, accessibility to public transport, educational, and commercial facilities were considered as major factors that influence housing price in large cities like Seoul. The information regarding the distance from a given apartment to the nearest subway station, elementary, or middle school, and a supermarket or shopping mall was obtained from retch.or.kr, the largest real estate platform of apartments in South Korea. Here, it is noteworthy to mention that despite the existence of a comprehensive public transportation system in Seoul, the subway is the preferred means of transport due to traffic congestion [18], hence only accessibility to subway station was considered in this study.
The attribute for green certification, which was the focus of this study, was defined based on the local green building evaluation system, Green Standard Energy and Environmental Design (G-SEED). The G-SEED rating system was initiated in 2000 by the Ministry of Land, Infrastructure, and Transport (MOLIT) together with the Ministry of Environment (MOE). The system started as a voluntary scheme for new buildings with only two certification levels (Green 1 and Green 2), but was gradually updated to the current evaluation system with nine credit categories and four certification levels: Green 1 (best), Green 2 (excellent), Green 3 (good), and Green 4 (normal). Through continuous revision of the rating system and green incentives, the Korean government has succeeded in promoting sustainable buildings, as indicated by the number of green-certified apartments significantly increasing by up to 70% from 2013, when the Korean green rating system was vastly extended from four to seven evaluation categories, reaching a total of 3571 G-SEED certified apartment complexes in 2018 [19]. The surge in Korean green apartments makes an interesting case to investigate whether the rising awareness of green building is reflected in the current housing market. Like most cities with an early-stage green rating system, the green status of buildings is often not displayed on the market platform, hence in this study, the green certification status of each apartment in the sales sample was defined by referring to a list of G-SEED certified buildings obtained from the Korean Environmental Industry Technology Institute [19].
Prior to empirical analysis, the sales sample was first cleaned by removing all transactions that lacked complete information and transactions involving commercial–residential mixed apartment complexes, as they are likely to have different pricing from ordinary apartments. In addition, outliers or housing units sold at unusual prices were identified using the interquartile range (IQR). For each housing transaction, a price per square meter (price/m2) was calculated and any housing unit sold at a price/m2 higher than the upper fence (1.5 IQR above the third quartile) or less than the lower fence (1.5 IQR below the first quartile) was considered to be an outlier and was removed from the sample. The cleaning process produced a sales sample of 63,173 housing transactions, among which 1983 transactions were from G-SEED certified apartments. Table 1 presents a summary of the sales sample analyzed. As expected, the descriptive statistics shows a large variation in the sample, suggesting that the characteristics or attributes of housing in the dataset are very distinctive.

2.2. Cluster Analysis

Cluster analysis is an unsupervised machine learning technique designed to systematically identify natural groupings or clusters of data objects existing in a given dataset. The essence of cluster analysis is the classification of data objects according to the nearest location. The process of cluster analysis is carried out in such a way that the characteristics of data objects within a cluster are very similar to each other, but different from data objects belonging to other clusters. In the analysis, each cluster is defined by its objects and center or centroid, which is the average of the cluster’s data objects [20].
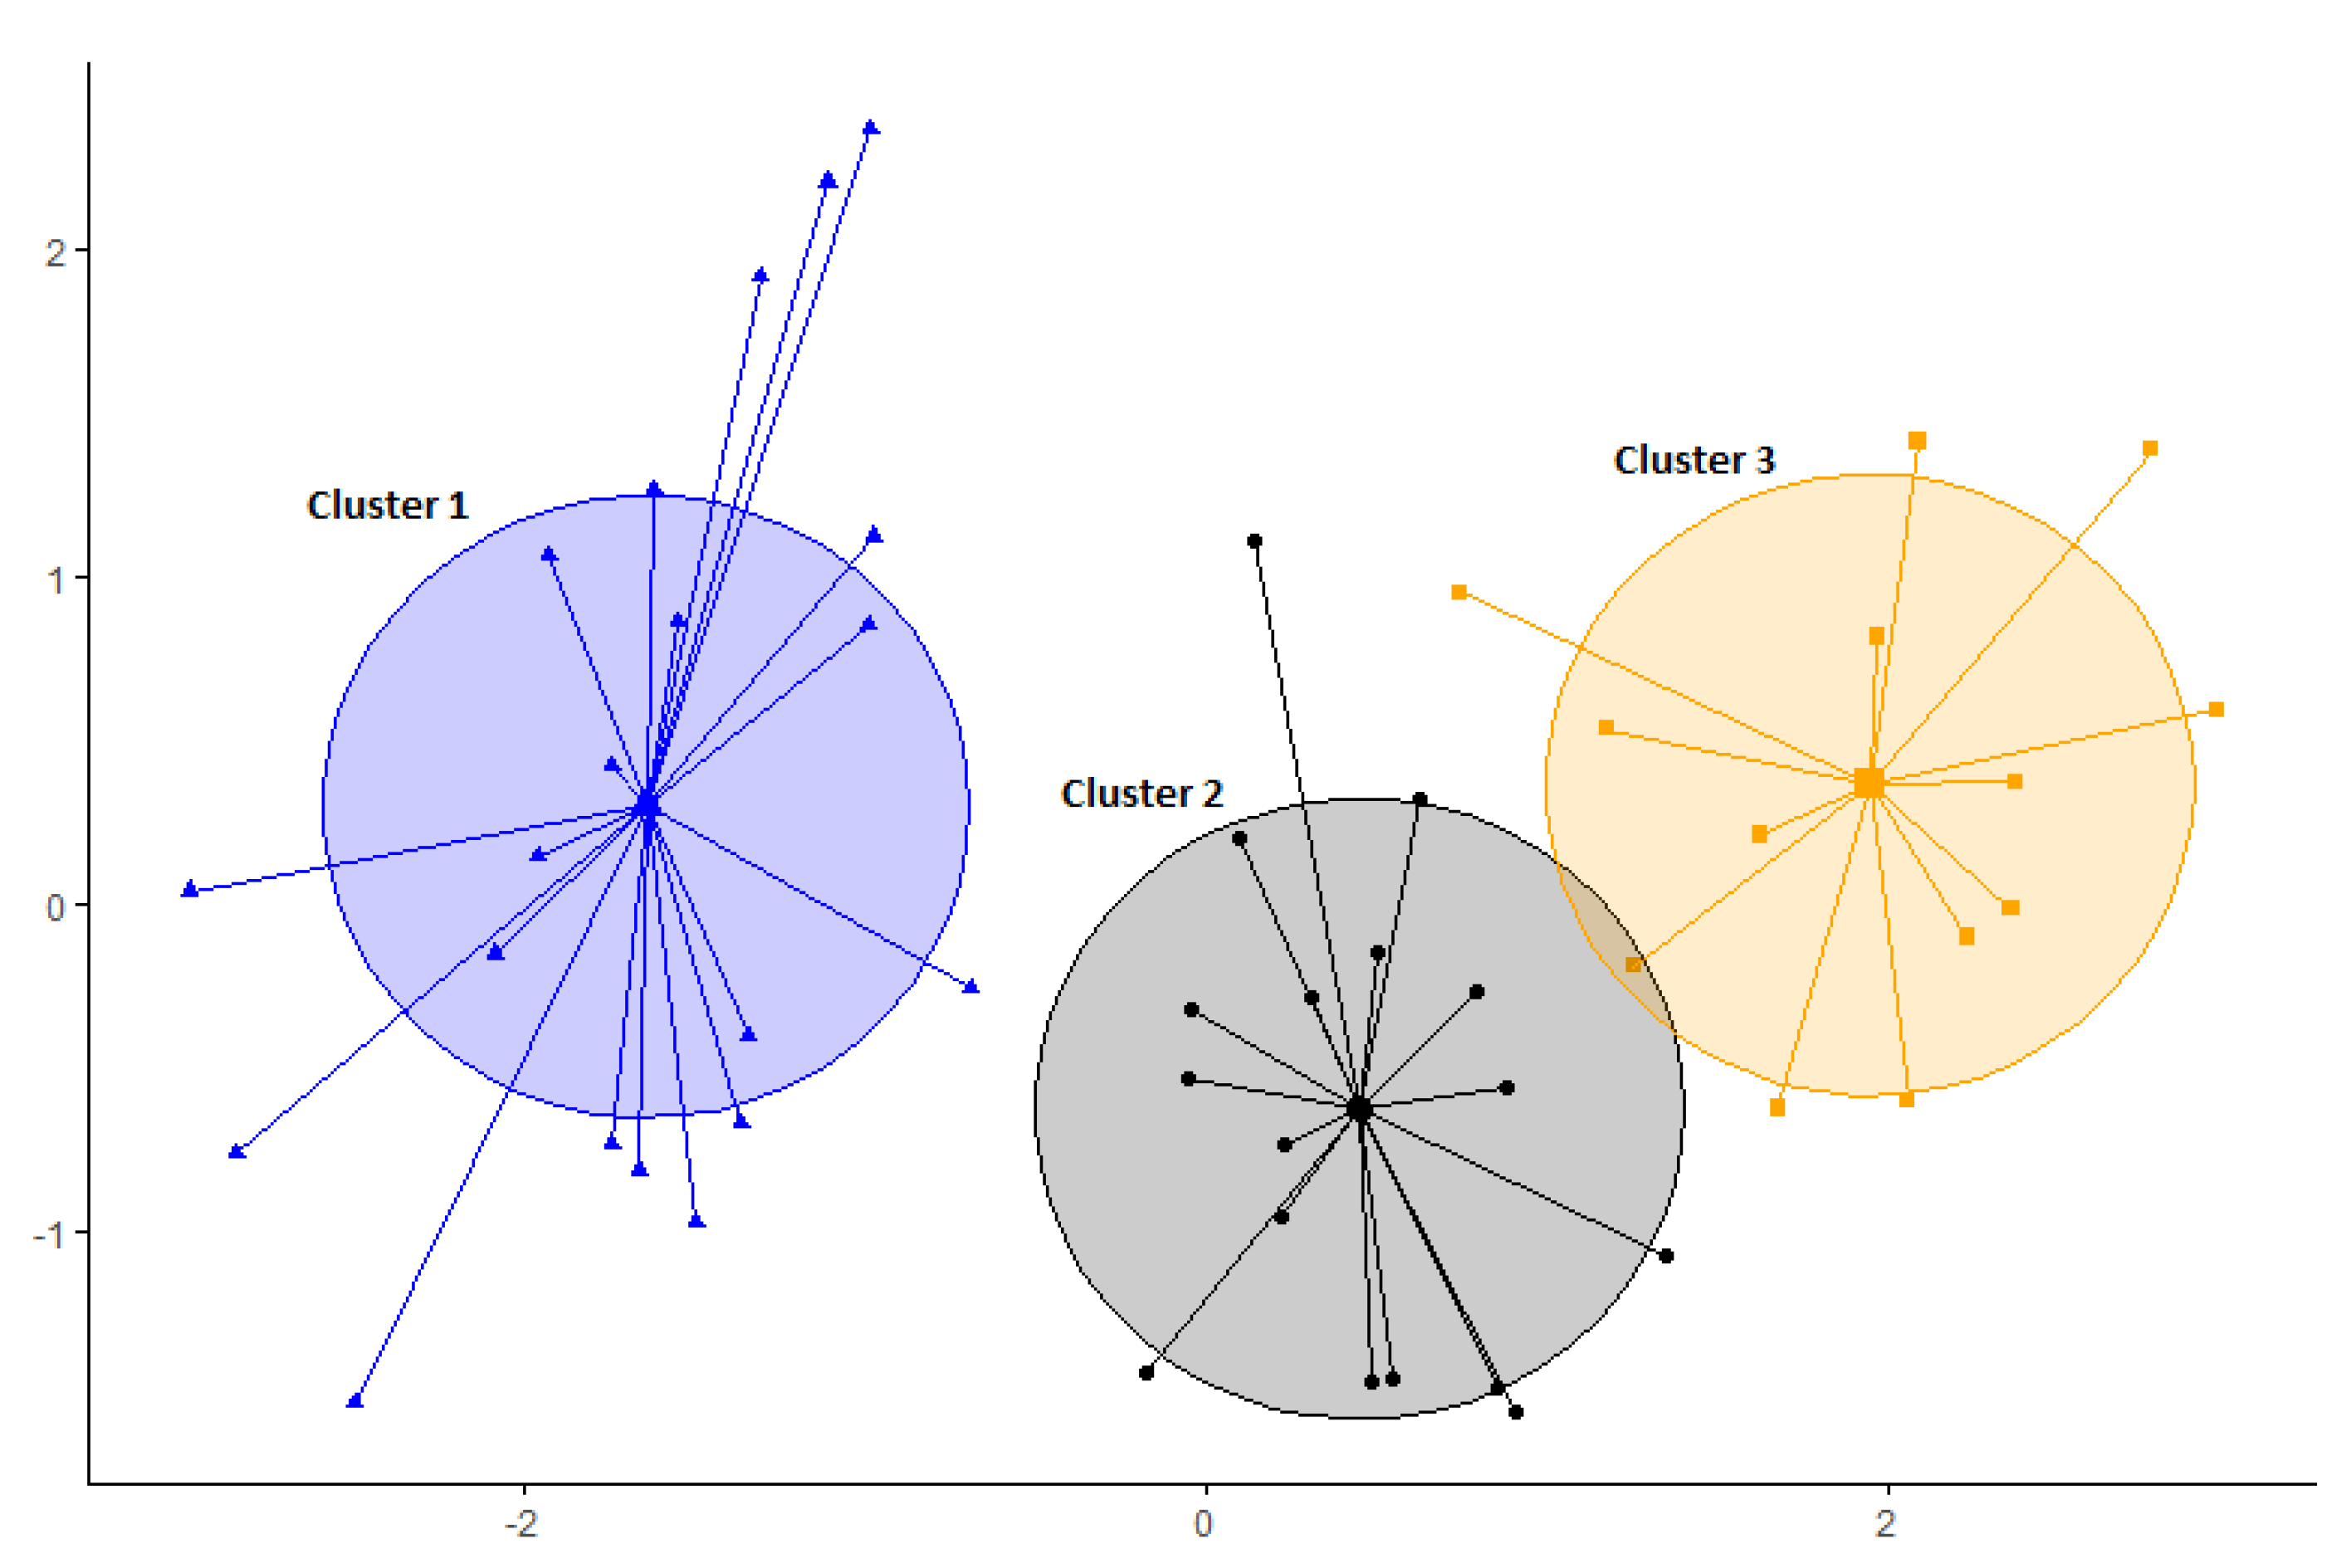
Hierarchical and partitioning clustering are the most popular clustering methods. For the purpose of this study, two algorithms of partitioning clustering, namely k-means and k-medoids, commonly known as PAM (partitioning around medoids) cluster, were used. K-means cluster, first introduced in 1967 by James MacQueen [21], is generally applied to partition a given dataset (or a sample) into a set of k clusters (i.e., k subsamples). The algorithm starts by randomly selecting the cluster’s centers or centroids, and each data object is assigned to its closest centroid to form a cluster. After the cluster assignment step, centroids are updated by calculating the mean value from data objects belonging to the cluster. With the new centroids, all data objects are reassigned to their nearest centroid, and the process is repeated until no data object changes its cluster (i.e., convergence is achieved). Figure 2 illustrates a clustering example where a dataset is split into three clusters. As shown in the figure, each data element is assigned to the nearest cluster based on the distance to the cluster’s center.
One of the drawbacks of k-means cluster is its sensitivity to outliers, as centroids are defined based on the mean value of the data objects in the cluster. This can sometimes result in locally centered clusters rather than a global one. To mitigate this issue, the study also applied the PAM clustering algorithm, with which a cluster is defined by one of its data objects called the “medoid”, corresponding to the most centrally located data object in the cluster. The use of medoids rather than the mean values (as in the case of k-means cluster) makes the PAM clustering algorithm more robust to noise and outliers.
In this study, the Euclidean distance, a commonly used distance measure, was applied to measure the distance between data objects and the centroid or medoid of a cluster. The distance is defined as follows:
d e u c x , y = i = 1 n x i y i 2  
where x and y are data objects represented as vectors of length n .
In regard to this study, each transaction in the sales sample was defined as a vector of eight dimensions representing the variables for housing and neighborhood attributes (explained in previous subsection) and through cluster analysis, we wanted the transactions of housing units with similar characteristics to be grouped together to form a sales subsample. Given that the eight considered variables are measured in different scales, the raw data were first standardized prior to cluster analysis to avoid the formation of clusters that are governed by large scale variables such as the price or size of an apartment complex. The essence of this approach is that when housing merits of transactions in a given dataset are relatively similar, then their sales prices can be accurately compared to further understand the underlying reason of the differences between housings. Furthermore, it is anticipated that the developers of green buildings will seek to maximize the factors characterizing a good building to gain the market recognition necessary for a high sale price. In light of this, the k-means and PAM cluster analysis were applied to extract a sales subsample containing most of the transactions from green-certified apartments and their counterparts. The extracted subsample can then be used to estimate the price premium of green-certified apartments through the hedonic regression model. It is important to note that the attribute of green certification was not included among the clustering variables. R programming was used to carry out cluster analysis in this study.

2.3. Hedonic Model

Some of the benefits from green buildings include reduced energy consumption, lower maintenance costs, and improved occupant health, comfort, and productivity. Therefore, certified buildings are expected to have an increased market value as buyers are willing to pay more for green buildings. This price difference between the sale or rental prices of green certified buildings and their non-certified counterparts is commonly known as a green premium, and it is generally assessed by analyzing the price formation in a given real estate market.
For investigations involving the real estate market, the hedonic regression model has been widely applied to evaluate the price and value determinants of properties. The model is primarily based on the concept that the price of property is a function of both its features and external attributes [22]. In the context of the housing market, a hedonic regression model allows the estimation of housing prices based on multiple variables representing housing’s physical characteristics, locational attributes, and environmental aspect. Through the analysis of regression coefficients, the importance of a given variable and its influence on the market value of a housing unit is determined. In this way, it is possible to estimate the contribution of green certification to the overall price of a housing unit (green premium).
In this study, a semi-log hedonic model was used to formulate a functional relationship between the price and housing characteristics. Among the many different forms of hedonic regression, the semi-log was selected for two reasons: (1) the form takes into consideration possible nonlinear correlations between dependent and independent variables, and (2), it minimizes the problem of heteroskedasticity, a situation where residuals are not constant over a range of variables, in the regression [23].
As previously explained, housing and neighborhood attributes and green certification status are considered as factors influencing the housing price, and hence they were included in the hedonic model. In addition to these attributes, regional and temporal price indices were added to the model to account for variations in housing prices across the city and different time periods. For each of the twenty-five districts, a housing price index was obtained from the Korean real estate agency platform (reb.or.kr) [24], indicating the average price of a house in the area. To account for variations in the real estate market across the year, quarterly house price index in 2018 was used and a temporal price index was assigned to each transaction in the sales sample based on the date when the transaction occurred. Table 2 summarizes the variables used for the hedonic model and their expected relationship to the dependent variable. The hedonic regression model built based on the above explained variables take the form below:
L n P r i c e = c + b 1 A R E A + b 2 F L + b 3 A G E + b 4 H U + b 5 S B W + b 6 S C H + b 7 S P K + b 8 R P I + b 9 T P I + b 10 G S E E D + ε
where c and ε represent the intercept and uncontrolled error term of the function, respectively, and b n is the coefficient of the independent variables.
The value of the regression coefficient indicates the impact of a given variable on housing price given that other factors are controlled. For instance, b 10 , a coefficient of our major interest, indicates the price increase of G-SEED certified housing compared to non-certified housing when considering that the other building characteristics and neighborhood attributes are the same. The regression for the hedonic model was executed in RStudio, and the findings are described in the following section.

3. Results and Discussion

The results are presented under two sections. The first section explains the sales subsamples obtained through cluster analysis. The second section explores the estimated green premium from subsamples containing housing transactions from green-certified apartments and their counterparts.

3.1. Cluster Analysis Results: Sales Subsamples

As previously explained, the purpose of cluster analysis was to split housing transactions from the sales sample based on housing and neighborhood attributes. Clustering was eight dimensional as eight variables were used to cluster the housing transactions. In other words, the goal was to identify clusters of housing units with similar features (sale price, housing and neighborhood attributes). For the applied k-means and PAM algorithms, the number of clusters needed to be prespecified prior to the analysis. To determine the optimal number of clusters, the elbow method was employed. In this method, a cluster algorithm is run for different number of clusters and for each run, the sum of squared error (SSE) is calculated. The optimal number of clusters is selected as that with a lower value of SSE and beyond, where the increase in the number of clusters results in no significant reduction in SSE. For more details about the elbow method, see [25]. The applied elbow method indicated that the division of our sales sample into three clusters was the optimum, hence for both k-means and PAM cluster analysis, the sales sample was segmented into three clusters (sales subsamples in this case).
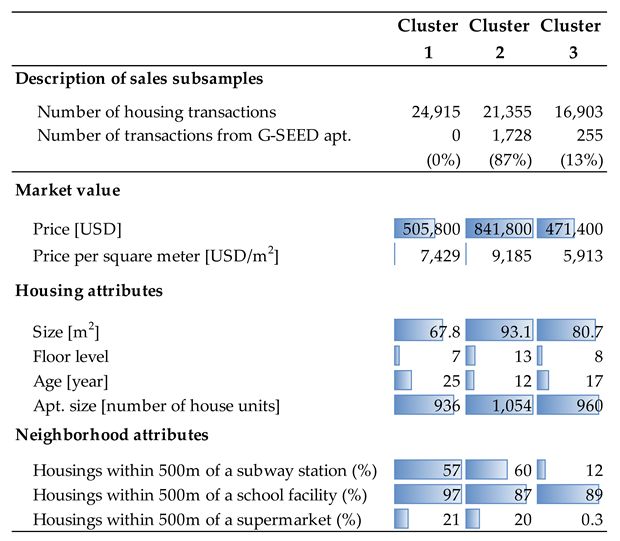
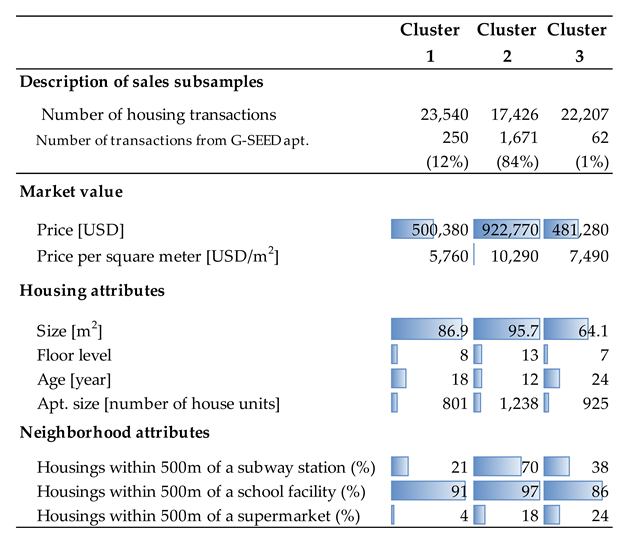
Table 3 and Table 4 summarize the main features of the obtained sales subsamples through the k-means and PAM cluster analyses, respectively. The characteristics of a subsample were evaluated based on the average sale price and housing attributes of the housing units constituting the subsample. Regarding the neighborhood attributes, a facility was considered to be accessible to a given apartment if it was located within 500 m (5 min walking distance) from the apartment [26]. Therefore, for each subsample, the percentage of housing units within 500 m from everyday life facilities such as subways, schools, and supermarkets was calculated.
According to the k-means cluster, the analyzed transactions were split into three subsamples with the main variation in the housing market value (expressed both in absolute and unitary price), floor size, and the size of apartment complex. As for the neighborhood attributes, only one subsample (cluster 3 in Table 3) showed a notable difference in accessibility to public transport (subway) and shopping facilities compared to the remaining two subsamples. This particular market segment constitutes housing units of medium floor size and age, sold at a relatively low price due to their unfavorable location. It is interesting to note that around 87% of all transactions from G-SEED certified apartments were within one sales subsample (cluster 2 in Table 3), characterized by larger housing units from larger and newly constructed apartment complexes, and hence the most expensive.
Based on the PAM cluster analysis, our sales dataset was segmented into three subsamples with differences mainly in housing price, floor size, size of apartment complex, and accessibility to subway stations. The main sales subsample of interest to this study (cluster 2 in Table 4), containing 84% of all the transactions from G-SEED certified apartments, was made up of expensive, large housing units from large, newly constructed, and well-located apartment complexes.
Although the results in Table 3 and Table 4 showed a similar pattern of market segmentation compared to the k-means cluster, variations in the formed sales subsamples were well defined for the PAM cluster analysis. The distinction between the overall characteristics of the sales subsamples from the k-means and PAM cluster was most noticeable in the neighborhood attributes. A higher dispersion in the variables’ values for the neighborhood attributes (especially the distance to subway station and supermarket as can be seen in Table 1) is one reason for the difference in the cluster results. As previously explained, k-means is more sensitive to higher variations in the dataset compared to the PAM cluster, hence it is expected to obtain some differences in the resulting clusters, especially for those variables with high variability.
The findings indicate that cluster analysis can be applied to extract a sales subsample containing housing transactions from green buildings and their peer non-certified buildings. It is interesting to note that despite a slight difference in clustering results from the two algorithms, more than 80% of the transactions from G-SEED certified apartments were contained within higher-rated (larger, newer, better accessibility to public transport, and high-priced) housing units. A possible explanation could be that for a dynamic market such as Seoul’s real estate, green certification alone is not sufficient to gain market recognition of the best quality housing for potential buyers. This could be an indication of shallow environmental concerns among the general population in Korea. In fact, according to a particular survey among residents of G-SEED certified apartment complexes in Korea [27], 72.7% of them were not aware of the certification status of their apartments. In addition, this was confirmed by the fact that while other attributes regarding building characteristics and location are displayed on real estate platforms for apartments in South Korea, sustainability-related features such as green certification status or other efficiency ratings are often not displayed, suggesting that the latter are less of a concern to most buyers. This lack of interest in building sustainability can hinder the ability of developers from all market segments to perceive the economic viability of green investment. The findings of this study can serve as a reference for related parties to develop effective strategies to promote green practices equally across all categories of building projects.
In brief, the clustering results verify the study’s hypothesis that in order to achieve the necessary market recognition, developers in green projects tend to carefully consider not only green-certification-related issues, but also other factors of a good building in a given local context. In light of this, the actual green premium can be best estimated based on that particular category of good or high-quality buildings. Hence, in this study, a hedonic regression model was applied to estimate the G-SEED price premium from sales subsamples from the k-means and PAM cluster analysis separately. The results are explained in the following section.

3.2. Hedonic Results: Green Premium

The G-SEED price premium was evaluated in three scenarios through the hedonic regression model. The first scenario (model 1) depicts the case when the premium is assessed from all the transactions without sample segmentation. The second and third scenarios illustrate the cases when a green premium is estimated from a sales subsample containing transactions from G-SEED certified apartments and their peer apartments extracted through k-means cluster (model 2) and PAM cluster (model 3). As shown from the regression results in Table 5, the analyzed models had high explanatory power as their adjusted R-square values were around 0.7, meaning that the models could explain 70% of the variation in the dataset. In addition, all explanatory variables were statistically significant at a significance level of 1%, except for the distance to school in model 1.
Among the housing attributes, our findings indicate that the size of the apartment complex (HU) had a greater positive influence on the housing price in the real estate market of Seoul. In other words, the sale prices in bigger apartment complexes are higher compared to those in small apartment complexes. One explanation for this tendency is that larger apartment complexes are mostly constructed by high-ranking construction companies, and these complexes generally provide more amenities and services. The other most influential features of housing were the floor area and the age of the apartment. As expected, the results show that the larger the housing unit, the higher the sale price per square meter. In the case of apartment age, the negative sign on the coefficient indicates that the sale price of a housing unit decreases as the apartment age increases. For instance, according to hedonic model 1, for every one-year increase in the apartment age, its housing sale price was reduced by 0.7%.
Coefficients for neighborhood attributes were slightly different for the three models. Based on the full sales sample (model 1), distance to subway station was the most influential factor for the housing sale price with housing in apartment complexes closer to a subway station being sold at a higher price (a positive coefficient). For the sales subsample extracted based on k-means cluster analysis (model 2) and PAM cluster analysis (model 3), distance to school showed the biggest impact on the housing sale price. Although the coefficient values were rather different, they indicate some common relationships between apartment accessibility and its market value, reflected by the sale price of its housing units. Most of the influence of neighborhood attributes is expected and show a similar trend with previous studies. For instance, Chin and Foong [28] reported that the travel time to a primary school as well as its quality highly influenced the decision to buy a given apartment in Singapore. Kim and Kim [29] investigated the correlation between the level of walkability (accessibility to nearby facilities) and housing prices in Seoul. The study revealed that the housing price rises by 0.2% for each one-point upgrade in its walkability score. Unlike models 2 and 3 (for sales subsample), the coefficient for distance to the nearest supermarket of model 1 indicated an inconclusive (negative) correlation with the housing sale price, which could be a result of a high variation within the dataset (non-segmented market).
A further significant factor was the regional housing price index (RPI). Seoul, being one the most densely populated cities, exhibits housing prices that vary greatly across its twenty-five districts. For example, Kang and Yuh [8] reported that in December 2013, the average housing unit price in an apartment located in Gangnam-gu (one of the most expensive districts in Seoul) was about USD 912.8 per square meter while a similar housing unit in the northern and southwestern region (areas with lower housing price indices) was sold at around USD 435.5 per square meter. Therefore, a high coefficient value for regional housing index is not surprising, but rather a reflection of the real estate market variability across the city. In addition, a positive coefficient for the temporal housing index price index highlights a continuous rise in the housing price in Seoul, which has been among the major issues in real estate for years. For instance, it was reported that the housing price in Seoul rose by 10.5% from the first quarter of 2014 to the second quarter of 2017 [30]. According to the results in this study, the sale price for housing units increased by 2.6% (model 3), 3.6% (model 2), and 4.1% (model 1) from the first to the fourth quarter of 2018.
Last but not least, the results from the hedonic regression models showed that the green certified status is among the significant factors (1% significance level) of housing price on the real estate market. As indicated in Table 5, the relationship between G-SEED certification and housing sale price was positive, which confirmed the existence of a green premium in real estate. An examination of the G-SEED coefficients clearly demonstrated that the magnitude of the green premium was not constant across the entirety of the sales sample and subsamples. According to model 1, the hedonic model based on the full sales sample, G-SEED certification displayed a statistically significant effect on sale price with a coefficient of 0.262. This implies that in general, a housing unit from a G-SEED-certified apartment complex is typically sold at a 26.2% higher price than a housing unit in a non-certified apartment complex. Considering the disparity in the characteristics of different buildings, models 2 and 3 examined the magnitude of this green premium between housing units of relatively similar features influencing their market values. Based on the sales subsamples extracted through the k-means (model 2) and PAM (model 3) cluster analysis, a housing unit from a G-SEED-certified apartment complex was 12.2 and 17.8% more expensive than its counterpart in a non-certified apartment complex, respectively.
To further understand the possible reasons for the difference in the price premium predicted from the two models, we looked into the characteristics of housing transactions in the subsamples used for hedonic models 2 and 3. Considering the difference in clustering approach for the k-means and PAM cluster analysis, we expected to find some housing transactions that were in a subsample from k-means but not in the subsample identified by PAM cluster analysis. Overall, around 77% of the transactions in the produced subsamples matched (i.e., those transactions are in both subsamples). By examining the features of housing units from each subsample, we ascertained that the sales subsample extracted through PAM cluster analysis was in the upper price distribution compared to the subsample by k-means. The average prices per square meter (USD/m2) in the sales subsample identified by k-means and PAM cluster analysis were 9185 and 10,290, respectively. In light of this price difference among subsamples, the higher green premium from model 3 in comparison to model 2 (Table 5) is in line with the existing, although limited, body of literature assessing the green premium variation across market segments. One study [8] analyzed the uneven green certification impact on different housing segments and highlighted that while it was evident that green-certified housing units were sold at a higher price than non-certified units, this green effect was not homogenous. In addition, McCord et al. [11] reported that green buildings were valued differently across the Belfast real estate market in Northern Ireland. In fact, through quantile regression, the study indicated that properties in the upper quantile range displayed an 11.4% green premium while properties in the lower quantiles showed a reduced green effect (about 6.3% price premium).

4. Conclusions

Due to the complexity of the real estate market, understanding and quantifying the relationship between green certification and property value is not straightforward. To evaluate the green certification impact on the building market value, the difference in price of a green-certified building and an ordinary building must be analyzed. However, due to the fact that prices on the real estate market are influenced by multiple correlated factors, identifying the source of price differences between buildings with different characteristics is often a challenge. Previous studies have tried to improve the precision of green premium estimation through univariate market segmentation. Considering that natural segments in a real estate market are formed based on a combination of building attributes that determine the unit values, this study addressed the homogeneity of a sales dataset for green premium evaluation by developing a systematic procedure to extract a sales subsample containing housing transactions from green-certified apartments and their counterparts. This analysis is relevant since the identification of such a subsample allows for the most precise green premium estimation on the basis of housing units with similar attributes.
A sales sample containing 81,605 housing transactions from all twenty-five districts of Seoul during 2018 was obtained from the largest housing transaction database in South Korea. The sales sample was analyzed and split into subsamples through cluster analysis considering both the housing and neighborhood attributes. To evaluate the applicability of this market segmentation approach, two clustering algorithms, k-means and PAM clustering, were applied. For each clustering algorithm, a sales subsample consisting of transactions from G-SEED-certified apartments and their most similar peers from non-certified apartments was obtained. Finally, a green price premium was estimated from the extracted subsample through the hedonic regression model.
The results from the k-means cluster indicate that 87% of the total housing transactions from G-SEED-certified apartments were constituted in a sales subsample characterized by the most expensive housing units with bigger floor size, and from newer and larger apartment complexes. The extracted sales subsample by PAM clustering contained 84% of the housing transactions from G-SEED-certified apartments and their counterparts. The subsample was characterized by the most expensive housing units with a large floor size and from newer apartments with better accessibility to public transport and education facilities. On average, the prices per square meter (in USD/m2) of the extracted sales subsample by k-means and PAM clustering were 9185 and 10,290, respectively.
A correlation between G-SEED certification and housing price was estimated first from the entire sales sample and the extracted subsamples. Based on the whole sales sample, the results from the hedonic regression model indicate that a housing unit in a G-SEED-certified apartment is sold at a 26.2% higher price than an ordinary apartment. These results are in line with previous studies on the influence of G-SEED certification on real estate price in Seoul [8,14]. Nonetheless, the predicted premium holds only if the variations in market segments are not considered. Based on a sales subsample extracted through k-means, the price of a housing unit in a G-SEED-certified apartment was 12.2% higher than a housing unit of similar attributes in a non-certified apartment. According to the hedonic model from a subsample by PAM clustering, the results indicated that G-SEED certification exhibited a 17.8% market premium. The difference in the estimated G-SEED price premium was a result of different market segmentation obtained from the two clustering algorithms. PAM clustering was able to extract the housing transactions in the higher market segment than k-means. In some cases, from previous studies that applied a univariate market segment, researchers have argued that the green effects on housing price are greater for the higher-tier market segment as buyers from higher socioeconomic classes are willing to pay even more for green housing as an indicator of a high-quality product. As such, it is justifiable that the identified green premium from a subsample extracted by PAM clustering was slightly higher than that of k-means.
The overall conclusion is that the findings of this study support previous findings that a green premium exists, but the estimation of its magnitude is greatly influenced by the quality of the dataset used. If differences in local climates, the structure of the real estate market, and possibly, public environmental awareness contribute to discrepancies in the reported green premium from different countries and cities, there is a reason to consider that the homogeneity in the transactions used to define a green premium is a key factor to allow for precise estimations. The developed methodology is straightforward and less computationally demanding; hence it can be adopted in other investigations involving the real estate market.
This study considered that the architectural and neighborhood attributes were the major factors contributing to price formation in the real estate market. However, depending on particular characteristics of a given market, it is possible that other features such as interior finishings and special property management services could have an influence on the housing price. Although the developed method is applicable to other case studies, it is necessary to first analyze the structure of the local market. Additionally, this research assessed the relationship between the housing sale prices and G-SEED certification status rather than the influence of each major G-SEED evaluation criteria because detailed information regarding certification results is not publicly available in our case due to confidentiality reasons. The authors acknowledge the importance of understanding the source of a green premium, and future work will be extended by collecting the required information from the apartment level.

Author Contributions

D.H.K. carried out the conceptualization and review of the study; A.I. developed the research methods and conducted the manuscript writing. All authors have read and agreed to the published version of the manuscript.

Funding

This research received no external funding.

Institutional Review Board Statement

Not applicable.

Informed Consent Statement

Not applicable.

Conflicts of Interest

The authors declare no conflict of interest.

References

  1. International Energy Agency. Energy Efficiency, 2017. Available online: https://www.nrcan.gc.ca/sites/www.nrcan.gc.ca/files/energy/energy-resources/Energy_Efficiency_Marketing_Report_2017.pdf (accessed on 13 May 2022).
  2. International Energy Agency. Energy Technology Perspectives, 2020. Available online: https://www.iea.org/topics/energy-technology-perspectives (accessed on 24 April 2022).
  3. Fuerst, F.; Kontokosta, C.; McAllister, P. Determinants of Green Building Adoption. Environ. Plan. B Plan. Des. 2014, 41, 551–570. [Google Scholar] [CrossRef]
  4. Bartlett, E.; Howard, N. Informing the decision makers on the cost and value of green building. Build. Res. Inf. 2000, 28, 315–324. [Google Scholar] [CrossRef]
  5. Kahn, M.E.; Kok, N. The capitalization of green labels in the California housing market. Reg. Sci. Urban Econ. 2014, 47, 25–34. [Google Scholar] [CrossRef]
  6. Chegut, A.; Eichholtz, P.; Kok, N. Supply, Demand and the Value of Green Buildings. Urban Stud. 2013, 51, 22–43. [Google Scholar] [CrossRef] [Green Version]
  7. Eichholtz, P.; Kok, N.; Quigley, J.M. Doing Well by Doing Good? Green Office Buildings. Am. Econ. Rev. 2010, 100, 2492–2509. [Google Scholar] [CrossRef] [Green Version]
  8. Kang, B.R.; Yuh, O.K. Analysis of the impact of G-SEED on real estate price focused on apartment house. Geogr. J. Korea 2014, 48, 79–92. [Google Scholar]
  9. Zhang, L.; Wu, J.; Liu, H. Turning green into gold: A review on the economics of green buildings. J. Clean. Prod. 2018, 172, 2234–2245. [Google Scholar] [CrossRef]
  10. European Commission. Available online: https://ec.europa.eu/energy/sites/ener/files/documents/20130619-energy_performance_certificates_in_buildings.pdf (accessed on 29 August 2022).
  11. McCord, M.; Haran, M.; Davis, P.; McCord, J. Energy performance certificates and house prices: A quantile regression approach. J. Eur. Real Estate Res. 2020, 13, 409–434. [Google Scholar] [CrossRef]
  12. Wilhelmsson, M. Energy Performance Certificates and Its Capitalization in Housing Values in Sweden. Sustainability 2019, 11, 6101. [Google Scholar] [CrossRef] [Green Version]
  13. Marmolejo-Duarte, C.; Chen, A. The Uneven Price Impact of Energy Efficiency Ratings on Housing Segments. Implications for Public Policy and Private Markets. Sustainability 2019, 11, 372. [Google Scholar] [CrossRef] [Green Version]
  14. Kim, D.H. The assessment of green premium variation across different development scales: Case of apartment complexes in Seoul, South Korea. J. Asian Arch. Build. Eng. 2022. [Google Scholar] [CrossRef]
  15. Wilkinson, S.; Sayce, S. Energy Efficiency and Residential Values: A Changing European Landscape; 2019; pp. 1–35. Available online: http://hdl.handle.net/10453/131081 (accessed on 18 July 2022).
  16. Hwang, S.J.; Suh, H. Analyzing Dynamic Connectedness in Korean Housing Markets. Emerg. Mark. Financ. Trade 2019, 57, 591–609. [Google Scholar] [CrossRef]
  17. Kim, K.H.; Jeon, S.-S.; Irakoze, A.; Son, K.-Y. A Study of the Green Building Benefits in Apartment Buildings According to Real Estate Prices: Case of Non-Capital Areas in South Korea. Sustainability 2020, 12, 2206. [Google Scholar] [CrossRef] [Green Version]
  18. Kang, C.-D. Spatial Access to Metro Transit Villages and Housing Prices in Seoul, Korea. J. Urban Plan. Dev. 2019, 145, 05019010. [Google Scholar] [CrossRef]
  19. Korea Environmental Industry Technology Institute. Available online: https://www.gbc.re.kr (accessed on 17 June 2021).
  20. Kassambara, A. Practical Guide to Cluster Analysis in R: Unsupervised Machine Learning; Sthda: Scotts Valley, CA, USA, 2017; Volume 1. [Google Scholar]
  21. MacQueen, J. Classification and analysis of multivariate observations. 5th Berkeley Symp. Math. Statist. Probab. 1967, 5, 281–297. [Google Scholar]
  22. Rosen, S. Hedonic Prices and Implicit Markets: Product Differentiation in Pure Competition. J. Politi-Econ. 1974, 82, 34–55. [Google Scholar] [CrossRef]
  23. Sirmans, G.S.; Macpherson, D.A.; Zietz, E.N. The composition of hedonic pricing models. J. Real Estate Lit. 2005, 13, 3–43. [Google Scholar] [CrossRef]
  24. Korea Real Estate Statistics. Available online: https://www.reb.or.kr/r-one/statistics/statisticsViewer.do?menuId=TSPIA_43100 (accessed on 16 August 2021).
  25. Cui, M. Introduction to the k-means clustering algorithm based on the elbow method. Account. Audit. Financ. 2020, 1, 5–8. [Google Scholar] [CrossRef]
  26. Hui, E.C.M.; Tse, C.-K.; Yu, K.-H. The Effect of Beam Plus Certification on Property Price in Hong Kong. Int. J. Strat. Prop. Manag. 2017, 21, 384–400. [Google Scholar] [CrossRef] [Green Version]
  27. Lee, J.; Shepley, M. Analysis of human factors in a building environmental assessment system in Korea: Resident perception and the G-SEED for MF scores. Build. Environ. 2018, 142, 388–397. [Google Scholar] [CrossRef]
  28. Chin, H.C.; Foong, K.W. Influence of School Accessibility on Housing Values. J. Urban Plan. Dev. 2006, 132, 120–129. [Google Scholar] [CrossRef]
  29. Kim, E.J.; Kim, H. Neighborhood Walkability and Housing Prices: A Correlation Study. Sustainability 2020, 12, 593. [Google Scholar] [CrossRef]
  30. Nijskens, R.; Lohuis, M.; Hilbers, P.; Heeringa, W. The Korean Housing Market: Its Characteristics and Policy Response. In Hot Property: The Housing Market in Major Cities; Springer Nature: London, UK, 2019; pp. 181–194. [Google Scholar]
Figure 1. Methodology and steps flowed in this study.
Sustainability 15 00507 g001
Figure 2. Illustration of the cluster structure constituting of a cluster’s center and its data elements.
Sustainability 15 00507 g002
Table 1. Descriptive statistics of the sales sample.
VariableUnit Descriptive (n = 63,173)
Min.Max.MeanStd. Dev.
Housing attributes
Price [USD/m2]185415,92176172712
Size [m2]12.5245.479.827.8
Floor level[Floor number]16996
Apartment age[year]052199
Size of the complex[housing units]1611,378989897
Neighborhood attributes
Distance to:
Subway station[m]404656634421
School [m]112120275144
Supermarket[m]545401172420
Table 2. Description of the hedonic model variables and their correlation with housing price.
Attribute AbbreviationDefinitionExpected Relationship
Dependent variable LnPriceHousing transaction price in natural log form
Explanatory variable
Housing attributesAREAFloor area of the house [m2]Positive
FLFloor levelPositive
AGEAge of the apartment from its construction year to 2018 [years]Negative
HUTotal number of housing units in the apartment Positive
Neighborhood attributesSBWDistance to the nearest subway station [km]Negative
SCHDistance to the nearest school [km]Negative
SPKDistance to the nearest commercial facility [km]Negative
Location and time price variationRPIHousing price index of the district Positive
TPITemporal price index: 2018 quarterly housing price indexPositive
Green certificationG-SEEDDummy variable: 1 if the apartment is G-SEED certified; 0 otherwisePositive
Table 3. Characteristics of sales subsamples from the k-means cluster analysis.
Sustainability 15 00507 i001
Table 4. Characteristics of the sales subsamples from the PAM cluster analysis.
Sustainability 15 00507 i002
Table 5. Estimated variables’ coefficients from the hedonic regression models.
Model 1
(Full Sales Sample)
Model 2
(Subsample from k-means)
Model 3
(Subsample from PAM)
Intercept17.35 ***15.28 ***12.86 ***
Housing attributes
AREA0.010 ***0.009 ***0.010 ***
FL0.002 ***−0.009 ***−0.002 ***
AGE−0.007 ***−0.005 ***−0.005 ***
HU0.060 ***0.054 ***0.064 ***
Neighborhood attributes
SBW0.142 ***0.029 ***0.111 ***
SCH0.0010.084 ***0.212 ***
SPK−0.031 ***0.071 ***0.025 ***
Locational and temporal variation in housing market
RPI0.135 ***0.103 ***0.059 ***
TPI0.041 ***0.035 ***0.026 ***
G–SEED certification attribute
G–SEED0.262 ***0.122 ***0.178 ***
Dataset: n631732135517426
Adjusted R–square0.7030.6240.705
F–statistic1497035414161
p–value<2.2 × 10⁻¹⁶<2.2 × 10⁻¹⁶<2.2 × 10⁻¹⁶
Note: *** significant at 1% level.
Disclaimer/Publisher’s Note: The statements, opinions and data contained in all publications are solely those of the individual author(s) and contributor(s) and not of MDPI and/or the editor(s). MDPI and/or the editor(s) disclaim responsibility for any injury to people or property resulting from any ideas, methods, instructions or products referred to in the content.