Article

Study on the Construction of the Ecological Security Pattern of the Lancang River Basin (Yunnan Section) Based on InVEST-MSPA-Circuit Theory

1
College of Landscape Architecture and Horticulture Science, Southwest Forestry University, Kunming 650224, China
2
Southwest Landscape Engineering & Technology Center of National Forestry and Grassland Administration, Kunming 650224, China
*
Author to whom correspondence should be addressed.
Sustainability 2023, 15(1), 477; https://doi.org/10.3390/su15010477
Submission received: 9 November 2022 / Revised: 14 December 2022 / Accepted: 22 December 2022 / Published: 27 December 2022

Abstract

:
Optimizing the pattern of land space development and protection as well as improving regional ecological security are significant tasks in the construction of an ecological civilization. The Lancang River Basin is a significant ecological barrier in Southwest China, and its ecological security is critical to the Natural World Heritage Site of “Three Parallel Rivers” and even to Southeast Asia. In this study, the InVEST model and MSPA method were used for the identification of the ecological sources; the resistance surface was corrected by the night light coefficient; and the ecological linkages, pinch points, obstacles, and ecological breakpoints were extracted using the circuit theory to construct the ecological security pattern of the Lancang River Basin. The major study results indicated that: (1) A total of 23 ecological sources were identified in the watershed, covering an area of 9019.56 km2, mostly large-scale irregular patches. (2) A total of 39 ecological corridors were identified in the study area; 15 key corridors, 17 important corridors, and 7 general corridors were extracted based on the gravity model, which together formed a ecological security network for the watershed. (3) Sixteen ecological pinch points, one primary ecological improvement area, twelve secondary improvement areas, and twenty-nine ecological breakpoints were identified in this study. The ecological protection and restoration of different important ecological areas are conducive to the protection of biodiversity and the construction of the ecological security pattern in the Lancang River Basin.

1. Introduction

Optimizing the patterns of land space development and protection, as well as enhancing regional ecological security, are important tasks in ecological civilization construction [1,2]. The 15th meeting of the Conference of the Parties to the Convention on Biological Diversity (CBD COP15) was held in Yunnan in October 2021 to promote the conservation of biodiversity and the sustainable utilization of its components. In May 2022, the Yunnan provincial government released the document “The Pioneer Plan of Ecological Civilization Construction in Yunnan Province (2021–2025)”, which proposed the construction of the southwest ecological security barrier. Yunnan Province is in a critical phase of social and economic development, and the construction of ecological civilization can alleviate the dual pressures of economic development and ecological protection [3,4]. Constructing an ecological security pattern (ESP) is an important strategy to guarantee regional ecological security [2]. Effective connection of fragmented habitat patches by building an ecological network can improve the quality of the ecosystem and conserve biodiversity [5,6].
Many scholars have conducted a lot of research on the assessment of habitat quality. Early research on habitat quality mainly obtained relevant parameter indicators through field surveys of single or a few types of habitats. This method has advantages in terms of accuracy, but field surveys are time-consuming and labor-intensive and are only suitable for small-scale sample point surveys, which are difficult to achieve at the watershed and regional scales and cannot effectively obtain long-term monitoring [7]. With the development of geographic information technology, the InVEST model, based on remote sensing information, has been widely used in habitat quality assessment, which provides an opportunity for watershed- and regional-scale habitat quality assessment and ecological source identification [8]. For example, Wang Lirong and Hao Yue used the InVEST model to assess habitat quality and determine ecological sources based on land use types [9,10]. In summary, the InVEST model has high accuracy and convenience in evaluating habitat quality at different scales and can comprehensively reflect the impact of land use change on habitat quality.
MSPA is an image processing method to measure, identify, and segment the spatial patterns of raster images based on mathematical morphology principles such as erosion, expansion, opening operation, and closing operation. It can more accurately distinguish the type and structure of the landscape [11]. Its working principle is to divide the binary raster data into foreground and background, and then use a series of image processing methods to divide the foreground into seven non-overlapping categories according to morphology, so as to identify the landscape types that are important for maintaining connectivity. The core area is the larger habitat patch in the foreground pixel. It can provide a larger habitat for species, which is of great significance to the protection of biodiversity, and increase the scientific selection of ecological sources [12].
At present, the construction of ESPs is a well-defined research topic, and ESP construction is currently carried out through the basic paradigm of “identifying ecological sources-constructing resistance surfaces-extracting corridors” [2,13]. Some researchers have also considered “ecological pinch points” and “ecological breakpoints” for the construction of ESPs [14,15,16]. There are mainly two kinds of identification of ecological sources in existing studies: one is to directly take scenic forest or nature reserves as ecological sources; the second is to identify ecological sources mainly from the quality of a single habitat quality or landscape connectivity. However, comprehensive consideration of habitat quality and landscape structure plays a pivotal role in the effective identification of ecological sources. To connect ecological sources, an ecological network is formed by the cross-connection of nodes and corridors. The energy, material, and information flows among different landscape elements are carried out through the network [2]. The minimum cumulative resistance model is widely used for the extraction of ecological corridors. This model can instantaneously identify and map the optimal path of ecological flow but cannot identify the scope and key nodes of the corridors. McRae integrated circuit theory into landscape ecology and predicted the uncertainty of species flows with the help of the random walk property of currents across a surface providing resistance [17]. At present, circuit theory is mostly used in studies on ecological corridor extraction and ESP because it can quantify the movement in the corridor system and estimate the relative importance of nodes using the current intensity between sources. Moreover, it can identify the specific locations of key nodes and the width of the ecological corridors, thereby providing a scientific basis for the construction of ecological corridors and their habitat suitability [18]. For example, scholar Zhou Lang constructed the ecological corridor of a mountain city to ensure its ecological sustainable development [19]. Li Jiulin used circuit theory to identify the ecological network and important areas of Anqing City and put forward targeted ecological restoration strategies [20]. Graph theory, gravity models, ant colony models, centrality mappers, and other models are used to evaluate the importance of ecological corridors. Most studies on the construction of ESPs are based on administrative units [21,22], which makes it difficult to maintain a completely natural geographical pattern, resulting in an incomplete and one-sided ESP [2].
In their study of ecological security patterns, scholars Zhang Mufeng and Zheng Qunming directly took nature reserves and national parks as ecological sources to construct ecological networks, which is highly subjective [23,24]. On the research scale, it mainly focuses on the province, city, and county. There is little research on the ecological security patterns of river basins. These studies are primarily focused on the Yangtze River [25] and the Yellow River Basin [26], and not much attention is paid to the river basins in Southwest China.
A watershed is a typical complex ecosystem that forms an integral part of natural ecosystems. Taking the river basin as the research area is more in line with the distribution characteristics of natural geographical ecological patterns and avoids the incompleteness of natural geographical patterns caused by taking the administrative unit as the research unit [2]. The Lancang River Basin contains several nature reserves, which are essential for biodiversity protection, soil and water conservation, and other functions. In this study, the Lancang River Basin (Yunnan section) was considered as the research area of interest, and the InVEST model and morphological spatial pattern analysis (MSPA) were used to identify the ecological sources. The analytic hierarchy process (AHP) was used to comprehensively consider the natural environment, human society, and the patterns of landscape elements to construct the resistance surface, and the night light data were used to correct it. The ecological corridor and key nodes were extracted using circuit theory, and the importance of the potential corridor was quantified by a gravity model. The research results provide a scientific basis for ecological protection and related planning of the Lancang River Basin (Yunnan section). This method can provide a reference for the construction of regional ESPs.

2. Overview and Data Sources of the Research Area

2.1. Overview of the Research Area

The Lancang River Basin, located at 94–102° E and 21–34° N, is the longest north-south river in China, with a total length of 2162 km. Generally, the terrain of the basin is high in the northwest and low in the southeast and distributed in bands from north to south. The major stream of the Lancang River in Yunnan Province is 1247 km long. The basin has diverse climate types, numerous nature reserves, and abundant animal and plant resources [27], all of which play essential roles in the construction of ecological security barriers in Southwest China. The Lancang River in China is known as the Mekong River outside China and is an important link between China and Southeast Asia.

2.2. Data Sources

The land use data for 2020 was obtained from the Institute of Geographic Sciences and Natural Resources Research, Chinese Academy of Sciences. The data on roads and residential areas was obtained from the national basic geographic information database of the national geographic information center at a scale of 1:1 million (https://www.webmap.cn/commres.do?method=result100W, accessed on 13 October 2022). The spatial distribution data of nature reserves were obtained from the National Earth System Science Data Center (http://www.geodata.cn/, accessed on 26 April 2022). The elevation data were obtained from EARTHDATA (https://search.asf.alaska.edu/#/, accessed on 26 April 2022). The night light data were obtained from the National Qinghai-Tibet Plateau Scientific Data Center (http://data.tpdc.ac.cn, accessed on 13 October 2022), and the water system data was obtained from the Data Registration and Publishing System of Resources and Environmental Sciences (http://www.resdc.cn/DOI, accessed on 19 October 2022).

3. Research Methods

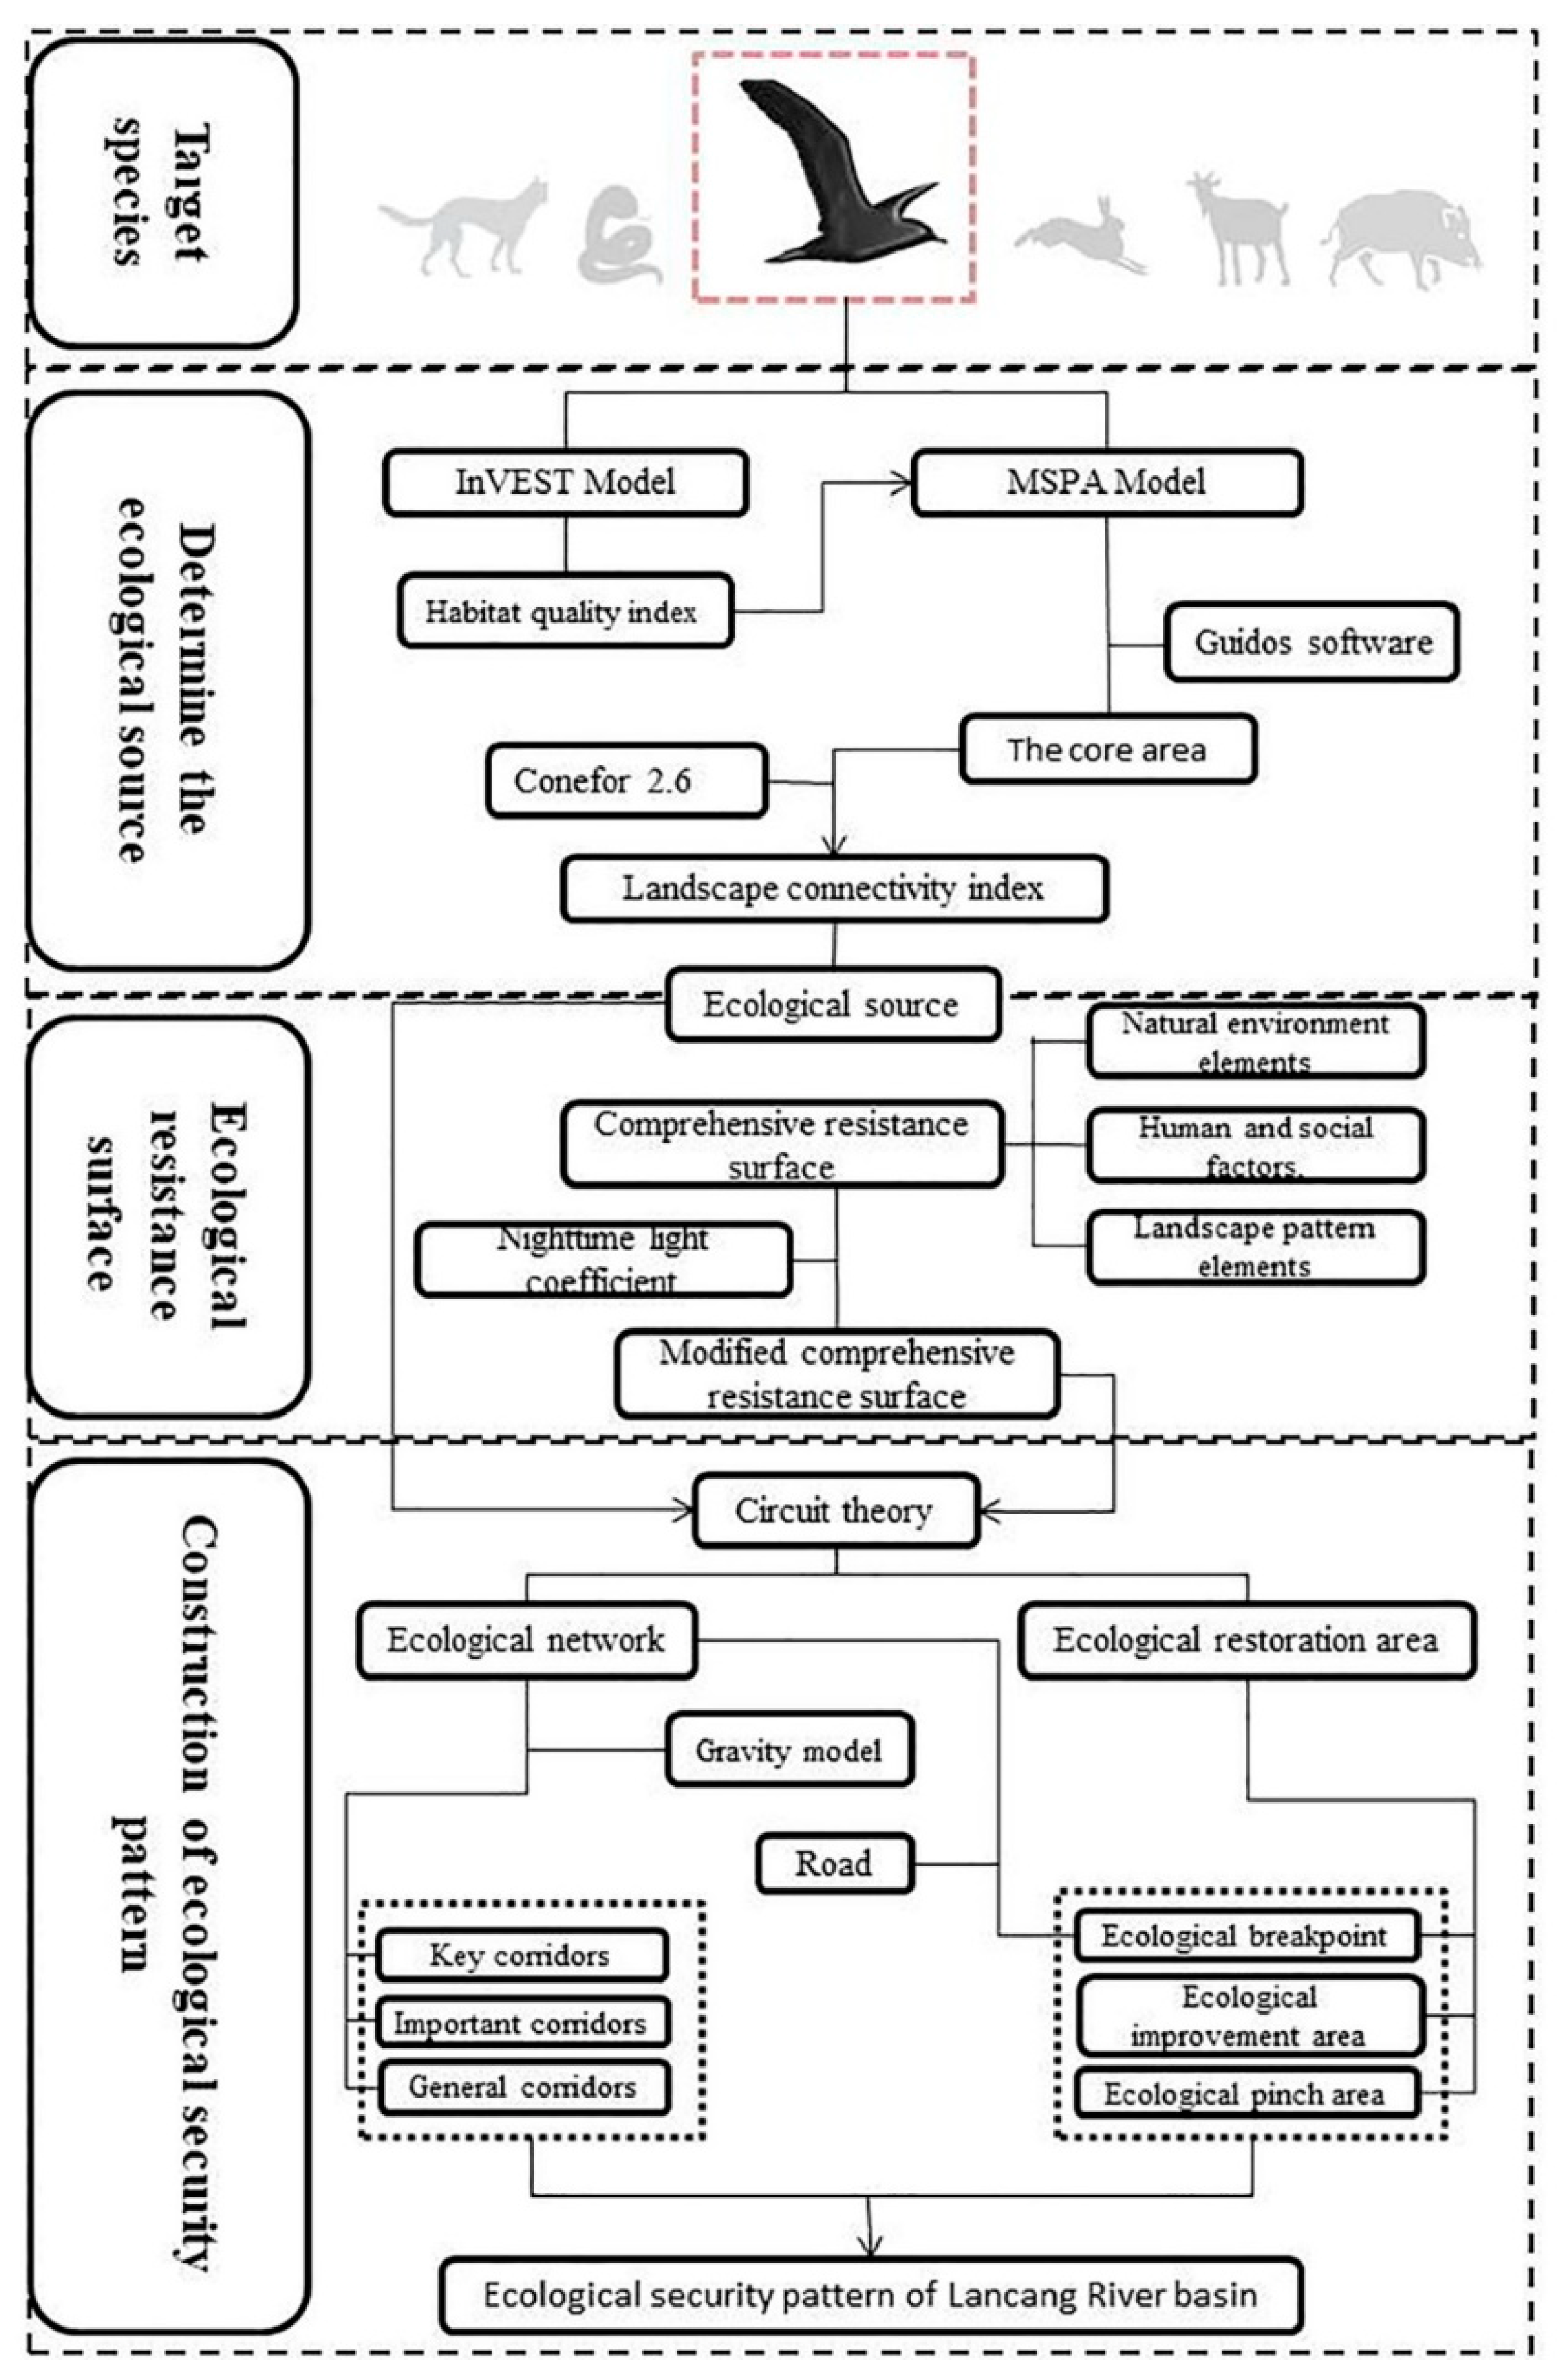
3.1. Research Framework

As shown in Figure 1, the step-by-step framework for the construction of the ecological network in this study is as follows: (1) The target species were determined, followed by extraction of the land use types in the study area. Furthermore, the data were analyzed based on MSPA using InVEST model and Guidos 3.1 software (European Commission Joint Research Centre (JRC), Brussels, Belgium, https://forest.jrc.ec.europa.eu/en/activities/lpa/gtb/, accessed on 9 October 2022) to extract 7 model classes, determine a certain amount of core patches at the source area, and analyze their connectivity to determine the final ecological source. (2) The natural, social, and landscape pattern elements were comprehensively to construct the resistance surface, and the night light data were applied for correction. (3) The potential ecological corridor was first extracted according to circuit theory. Then, the cumulative current density values were mapped and the pinch points, obstacle points, and ecological fault points were identified based on the potential ecological corridor. (4) The gravity model was used to evaluate the importance of ecological corridors and construct an ecological safety network to provide a reference for land spatial planning, the construction of the ESP, and the ecological restoration of the Lancang River Basin (Yunnan section).

3.2. Target Species Selection

The target species used to design the habitat network should have certain regional mobility, observability, and high habitat quality, and improvement in their habitat should meet all the habitat conditions the species along the food chain need to survive. Therefore, birds, fish, amphibians, reptiles, and small mammals can be selected as target species [28,29]. In this study, birds were selected as the target species because of their high mobility, high dispersal ability, and ability to simulate a larger network. It is important to note that birds are often used as indicators for monitoring biodiversity [30] and habitat restoration [31], thereby making ecological networks more universal.

3.3. Methods

3.3.1. Identification of the Ecological Sources

Evaluation of Habitat Quality Based on the InVEST Model

Habitat quality highlights the quality of natural resources that regional ecosystems can provide for the survival and continuation of animals and plants in the ecosystem [26], and the biodiversity functions are evaluated according to the quality of habitats [32,33]. The habitat quality module of the InVEST model was used to quantitatively evaluate the river habitat quality, and the plate functional attribute was used to guide the source identification. This study combined InVEST 3.12.0 (The Natural Capital Project, Palo Alto, CA, USA, https://naturalcapitalproject.stanford.edu/, accessed on 30 September 2022) and the MSPA for the identification of ecological sources. The model parameters were set based on the InVEST model user manual, relevant literature, and the present situation of the study area. The Equation for calculating the habitat quality index in the model is provided below:
Q x j = H j 1 D x j z D x j z + k z
where Qxj is the habitat quality index of grid x in j land type; Hj is the habitat suitability of j land type, falling within the range of 0–1; k is a semi-saturation constant, which is considered as 0.5; and z is the default parameter of the model. Dxj is the degree of habitat degradation of grid x in j land type, which indicates the degree of habitat degradation after stress. Dxj is given by [31]:
D x j = r = 1 R y = 1 Y r ω r / r = 1 R ω r r y i r x y β x S j r
where R is the number of stress factors; Yr represents the total number of grids of stress factors; ωr is the weight; ry is the number of stress factors on the grid unit; βx represents the accessibility level of grid x; Sjr represents the sensitivity of land type j to stress factors and has a value between 0 and 1; and irxy is the influence distance of stress factors, which is calculated according to the linear and exponential decline models, as given below:
i r x y = 1 d x y d r m a x
i r x y = exp 2.99 d r m a x d x y
where dxy is the direct linear distance between grid x and y and drmax represents the maximum value of threat factor R.
The operation of the model requires three steps: obtaining habitat stress source data, determining the habitat sensitivity matrix, and generating habitat quality maps. Habitat stress source data include determining threat source, maximum threat distance, weight, and spatial attenuation type. Then the habitat type and ecological sensitivity are determined according to the land use type to form a habitat sensitivity matrix. Finally, the above relevant data are input into the InVEST model for calculation to obtain the habitat quality results of the study area. The major input parameters to the model include land use maps, habitat threat factors, threat factor weights, influence distances, and the relative sensitivity of land use types to threats [26,29,34,35,36,37]. The model parameters in this study were set according to the InVEST mode user manual, related literature, and the present situation of the study area (Table 1 and Table 2).

Ecological Source Identification Based on MSPA and Landscape Connectivity Index

MSPA is a method that emphasizes structural connectivity which can identify seven landscape types that are important for maintaining connectivity at the pixel level and is less affected by the spatial scale. Based on the habitat quality result generated by the InVEST model, we used the natural breaks method to select a high-habitat-quality area. A habitat quality index greater than 0.8 was selected as the alternative ecological source and the basis for MSPA analysis. The data obtained were converted into TIFF format binary raster files, and seven non-overlapping landscape types were obtained by eight neighborhood analysis methods using the Guidos 3.1 software (European Commission Joint Research Centre (JRC), Brussels, Belgium, https://forest.jrc.ec.europa.eu/en/activities/lpa/gtb/, accessed on 9 October 2022). The core area can provide habitats for species, thereby playing a crucial role in the protection of biodiversity. The study of Hinsley and Uezu pointed out that the minimum forest area satisfying bird breeding requirements is 25 hm2, and only habitats with an area of no less than 60 hm2 can ensure the stable existence of species [29]. Larger areas with better habitat quality are more suitable as ecological sources. Therefore, a core area with more than 100 km2 was extracted for the landscape connectivity analysis.
The level of landscape connectivity can quantitatively characterize whether a particular landscape type is conducive to species migration within the source patches, and the probability of connectivity (PC, Equation (5)) is widely used for the evaluation of landscape connectivity [38,39]. Based on the previous literature, the landscape connectivity index (dpc) of the core area was calculated by selecting the landscape PC using Conefor 2.6 software (Developed by Santiago Saura and Josep Tornéat at Universidad Politécnica de Madrid, Madrid, Spain, http://www.conefor.org, accessed on 22 October 2022), and the patches of the core area with dpc > 0.5 were selected as the final ecological sources:
d p c = i = 1 n j = 1 n P i j · a i · a j A L 2
where dpc is the landscape connectivity index; AL is the total area of the regional landscape; n represents the total number of patches in the landscape; ai and aj are the areas of patches i and j, respectively; and Pij* is the maximum probability of species spreading directly in patches i and j.

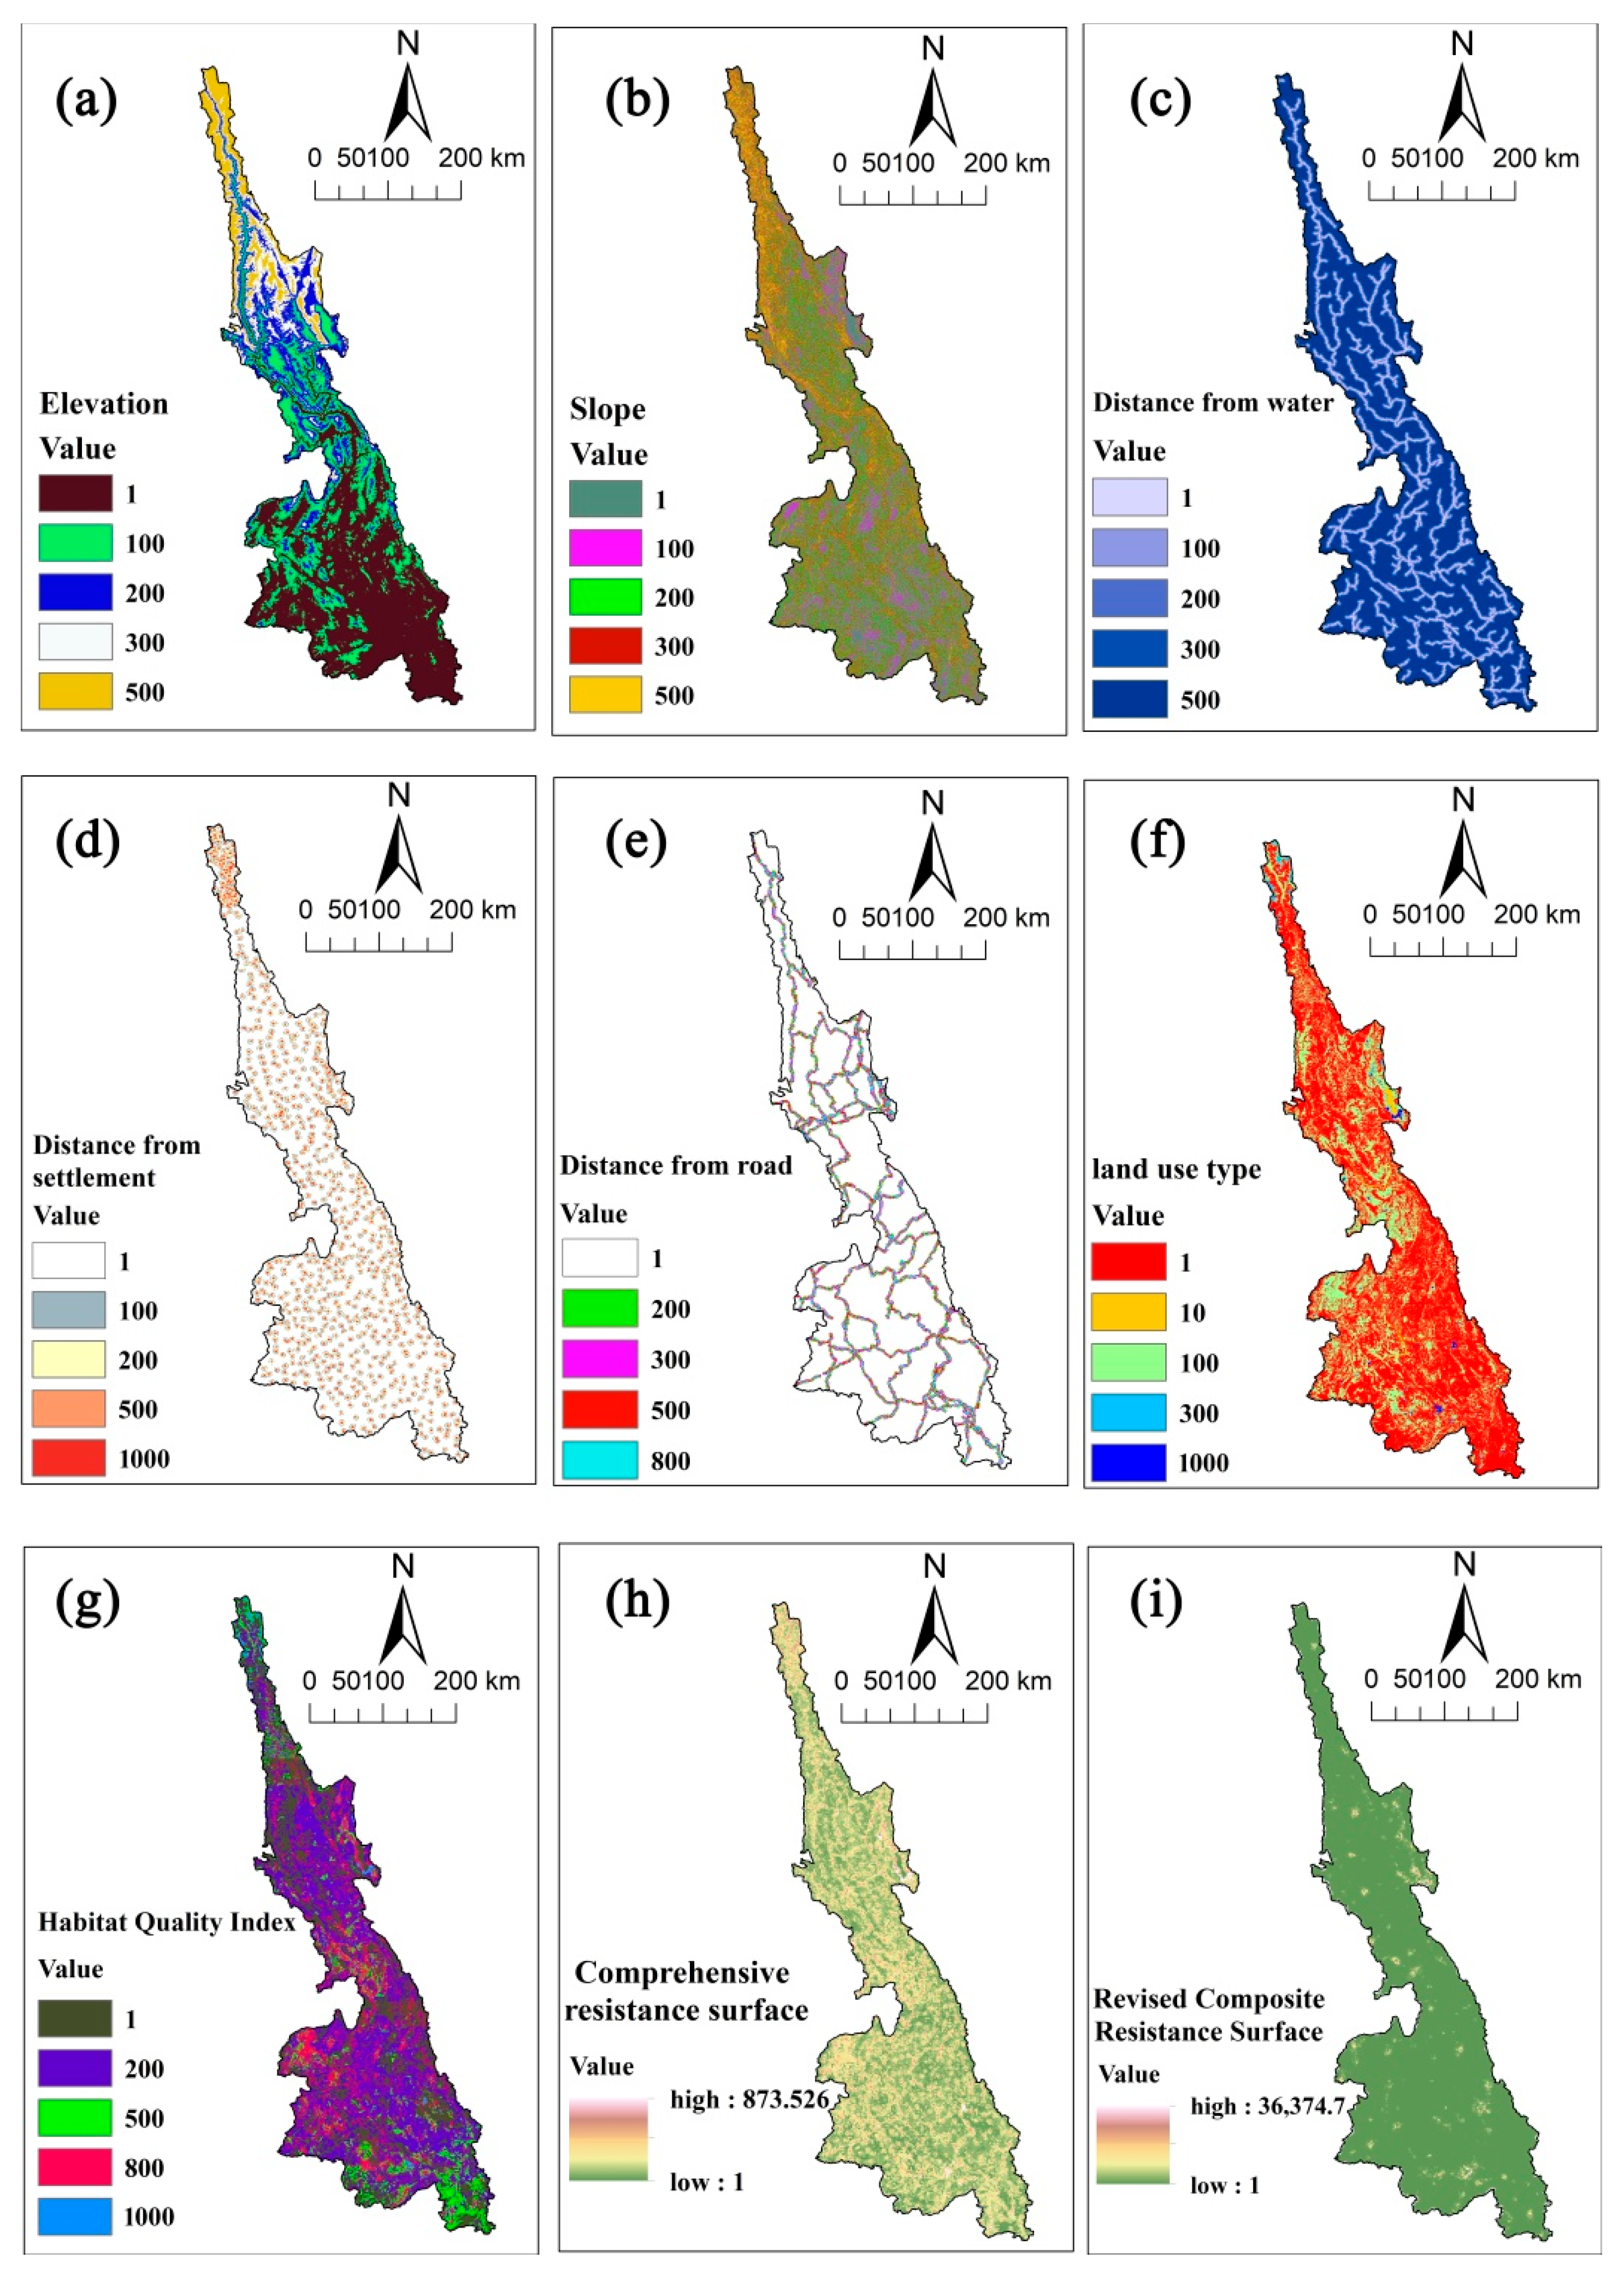
3.3.2. Construction of the Resistance Surfaces

In this study, resistance surface refers to different landscape types assigned relatively low or high resistance values based on whether they promote species migration and diffusion [13]. As indicated in the previous studies [40,41,42], the present study adopted AHP and comprehensively considered the natural environmental, social, and landscape pattern elements for constructing the resistance surface (Table 3). As human interference is one of the important resistances to species migration and diffusion, this study selected the night light index to correct the ecological resistance coefficient [40], as given by Equation [43] below:
R = T L I i T L I a × R
where R’ is the ecological resistance coefficient of the grid after correction based on the night light index; TLIi represents the night light coefficient of grid i; TLIa is the average night light value of grid i; and R is the basic resistance value of grid i.

3.3.3. Extraction and Evaluation of the Ecological Network

Circuit theory links the “random walk theory” with behavioral ecology in the connectivity evaluation model, and this makes it effective in the prediction of the path of the random migration of species and population diffusion probability [38]. The connectivity evaluation model is expressed as follows:
I = V R  
where I is the current, V is the voltage, and R is the effective resistance. The corresponding landscape ecological meaning [38] is presented in Table 4.
The ecological network of the Lancang River Basin (Yunnan section) was constructed based on the circuit theory using Circuitscape software to obtain the current density map representing the degree of landscape connectivity. The Linkage Pathways Tool of the Linkage Mapper Toolbox (The Nature Conservancy, Arlington, VA, USA, https://linkagemapper.org/, accessed on 14 October 2022) was used to generate a low-resistance ecological corridor with an ecological source directly transferring ecological flows and energy flows, thereby forming a potential ecological network. The gravity model can reflect the interaction intensity between ecological sources [43]. Therefore, the gravity model was used to quantify the potential value of the ecological corridor to the ecological network and reduce the ecological resistance to species migration and diffusion. The Equation for the interaction intensity is given as follows:
G a b = N a N b D a b 2 = L m a x 2 ln S a ln S b L a b 2 P a P b
where Gab is the direct interaction intensity between the ecological sources a and b (the importance of ecological corridor); Na and Nb represent the weight values of sources a and b, respectively; Dab is the standardized value of potential corridor resistance between sources a and b; Pa and Pb represent the average resistance values of sources a and b, respectively; Sa and Sb are the areas of sources a and b, respectively; Lab represents the corridor resistance value between sources a and b; and Lmax is the maximum value of the minimum cumulative resistance in the area.

3.3.4. Identification of Important Nodes of the Ecological Network

The current density maps generated by Circuitscape 4.0.5 software (Brad McRae, https://circuitscape.org/, accessed on 14 October 2022) indicated the possibility and selection frequency of species passing through this area in landscape ecology. A higher current density value indicates a greater probability of species passing along this area. Therefore, current density maps were used to identify important areas in the ecological network [38]. Using the Pinchpoint Mapper function of the Linkage Mapper Toolbox (The Nature Conservancy, Arlington, VA, USA, https://linkagemapper.org/, accessed on 14 October 2022), each source node was given a current value of 1 A, the cost-weighted distance of the corridor was set to its default value, and, finally, the “all to one” mode was selected for iterative calculations. The plaques with high current density and strong irreplaceability located in corridor bottleneck points and narrow points were identified as “pinch points”. An obstacle indicates the area with high resistance to the movement of species between the source areas. The Barrier Mapper tool was used to determine the barriers affecting the quality of the existing corridors. The improved scoring model was used for the identification of obstacles and calculation of the recovery value of the accumulated current after obstacle removal. A larger recovery value indicates a significant improvement in the landscape connectivity after obstacle removal or repair. This model was primarily used to identify the areas affecting the ecological flow. From the ecological point of view, the existing traffic lines in the study area greatly influenced or hindered the migration and flow of species. In this study, the spatial superposition analysis of railways, national highways, provincial highways, and ecological corridors was performed to identify the ecological breakpoints in the watershed ecological network for ecological restoration.

4. Results and Analysis

4.1. Construction of the Ecological Security Pattern of the River Basin

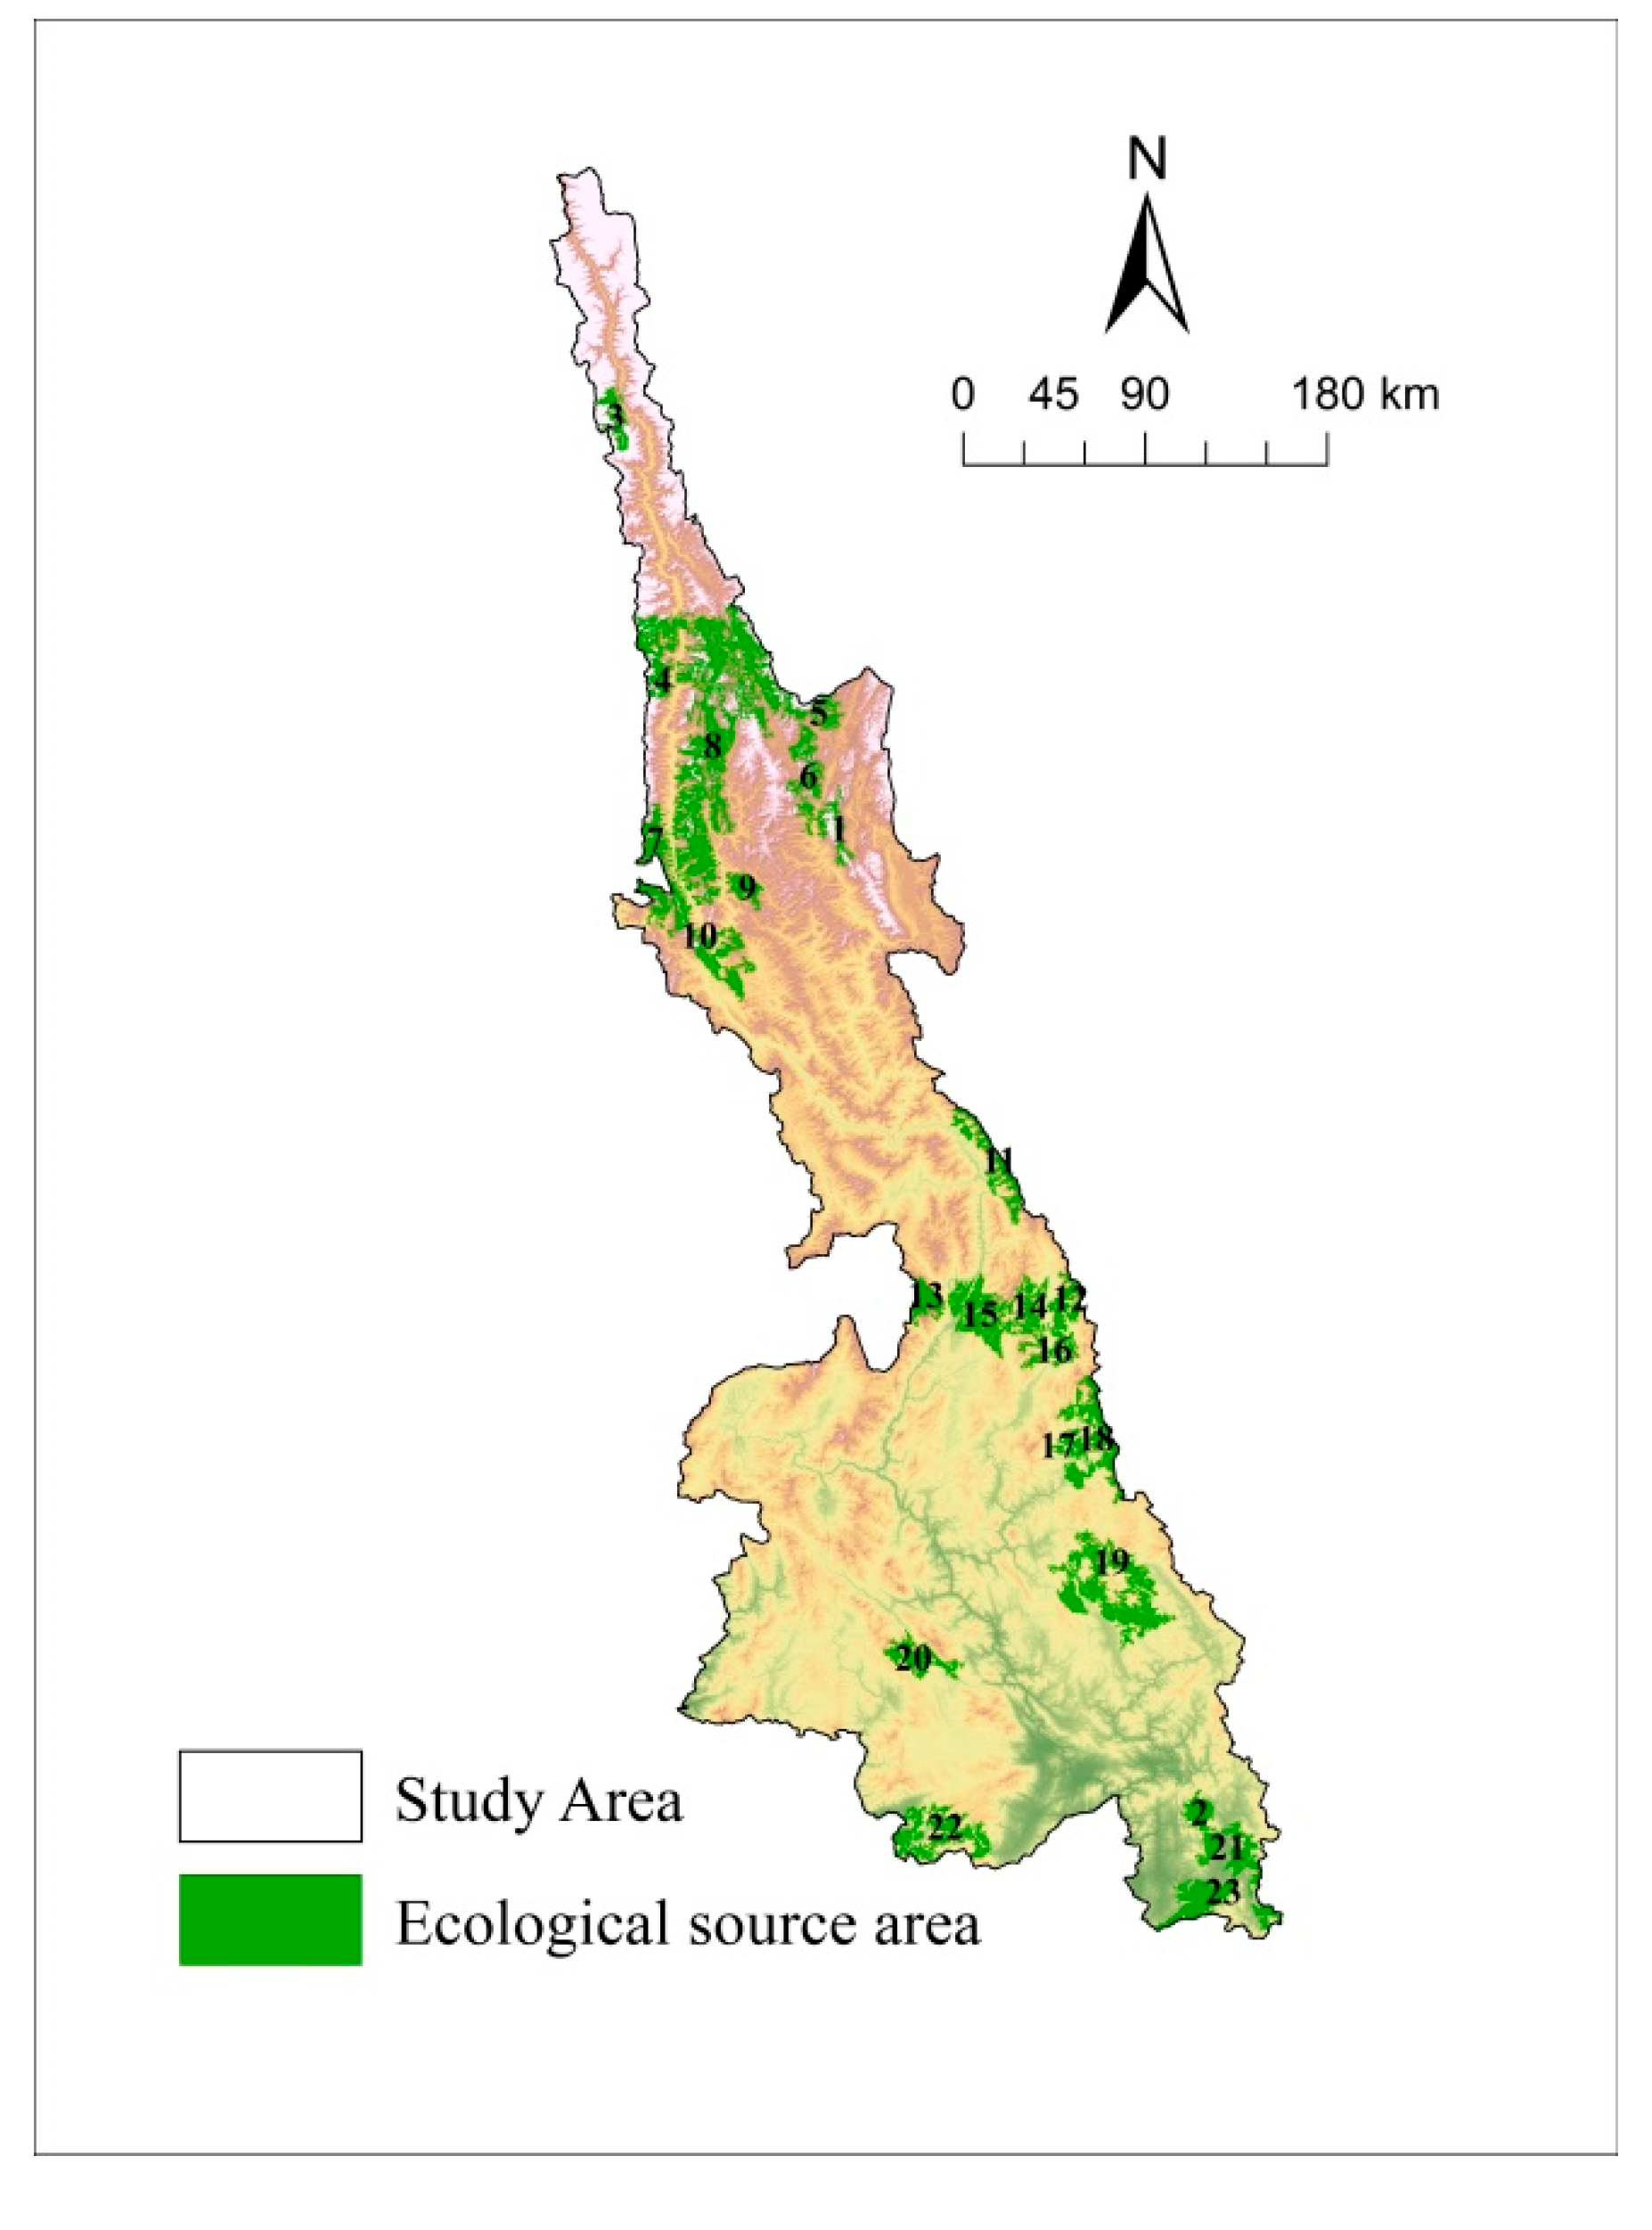
4.1.1. Identification of the Ecological Sources

Figure 2 shows that the Lancang River Basin is mostly mountainous terrain with a large area covered by forest land. The overall habitat quality of the basin is good, but the degree of fragmentation is high, and the areas with high habitat quality are scattered. The MSPA results (Table 5) indicated that the core area was 21,972.6 km2, accounting for 23.80% of the total area and 83.84% of the seven landscape types. Furthermore, the core areas greater than 100 km2 were analyzed for landscape connectivity, and patches with dpc greater than 0.5 were selected as the final ecological sources (Table 6). A total of 23 ecological sources with a total area of 9019.56 km2 and a maximum patch area of 2478.22 km2 were obtained, mostly large-scale irregular patches, including Baima Snow Mountain, Yunling, Yunlong Tianchi, Wuliang Mountain, Cangshan Erhai, Xishuangbanna, and several other nature reserves. The land use analysis revealed that the area of ecological lands such as forestland, grassland, and open water accounted for 96.62% of the land area, while cultivated land, construction land, and unused land accounted for only 3.38%, indicating the high ecological value of the land.

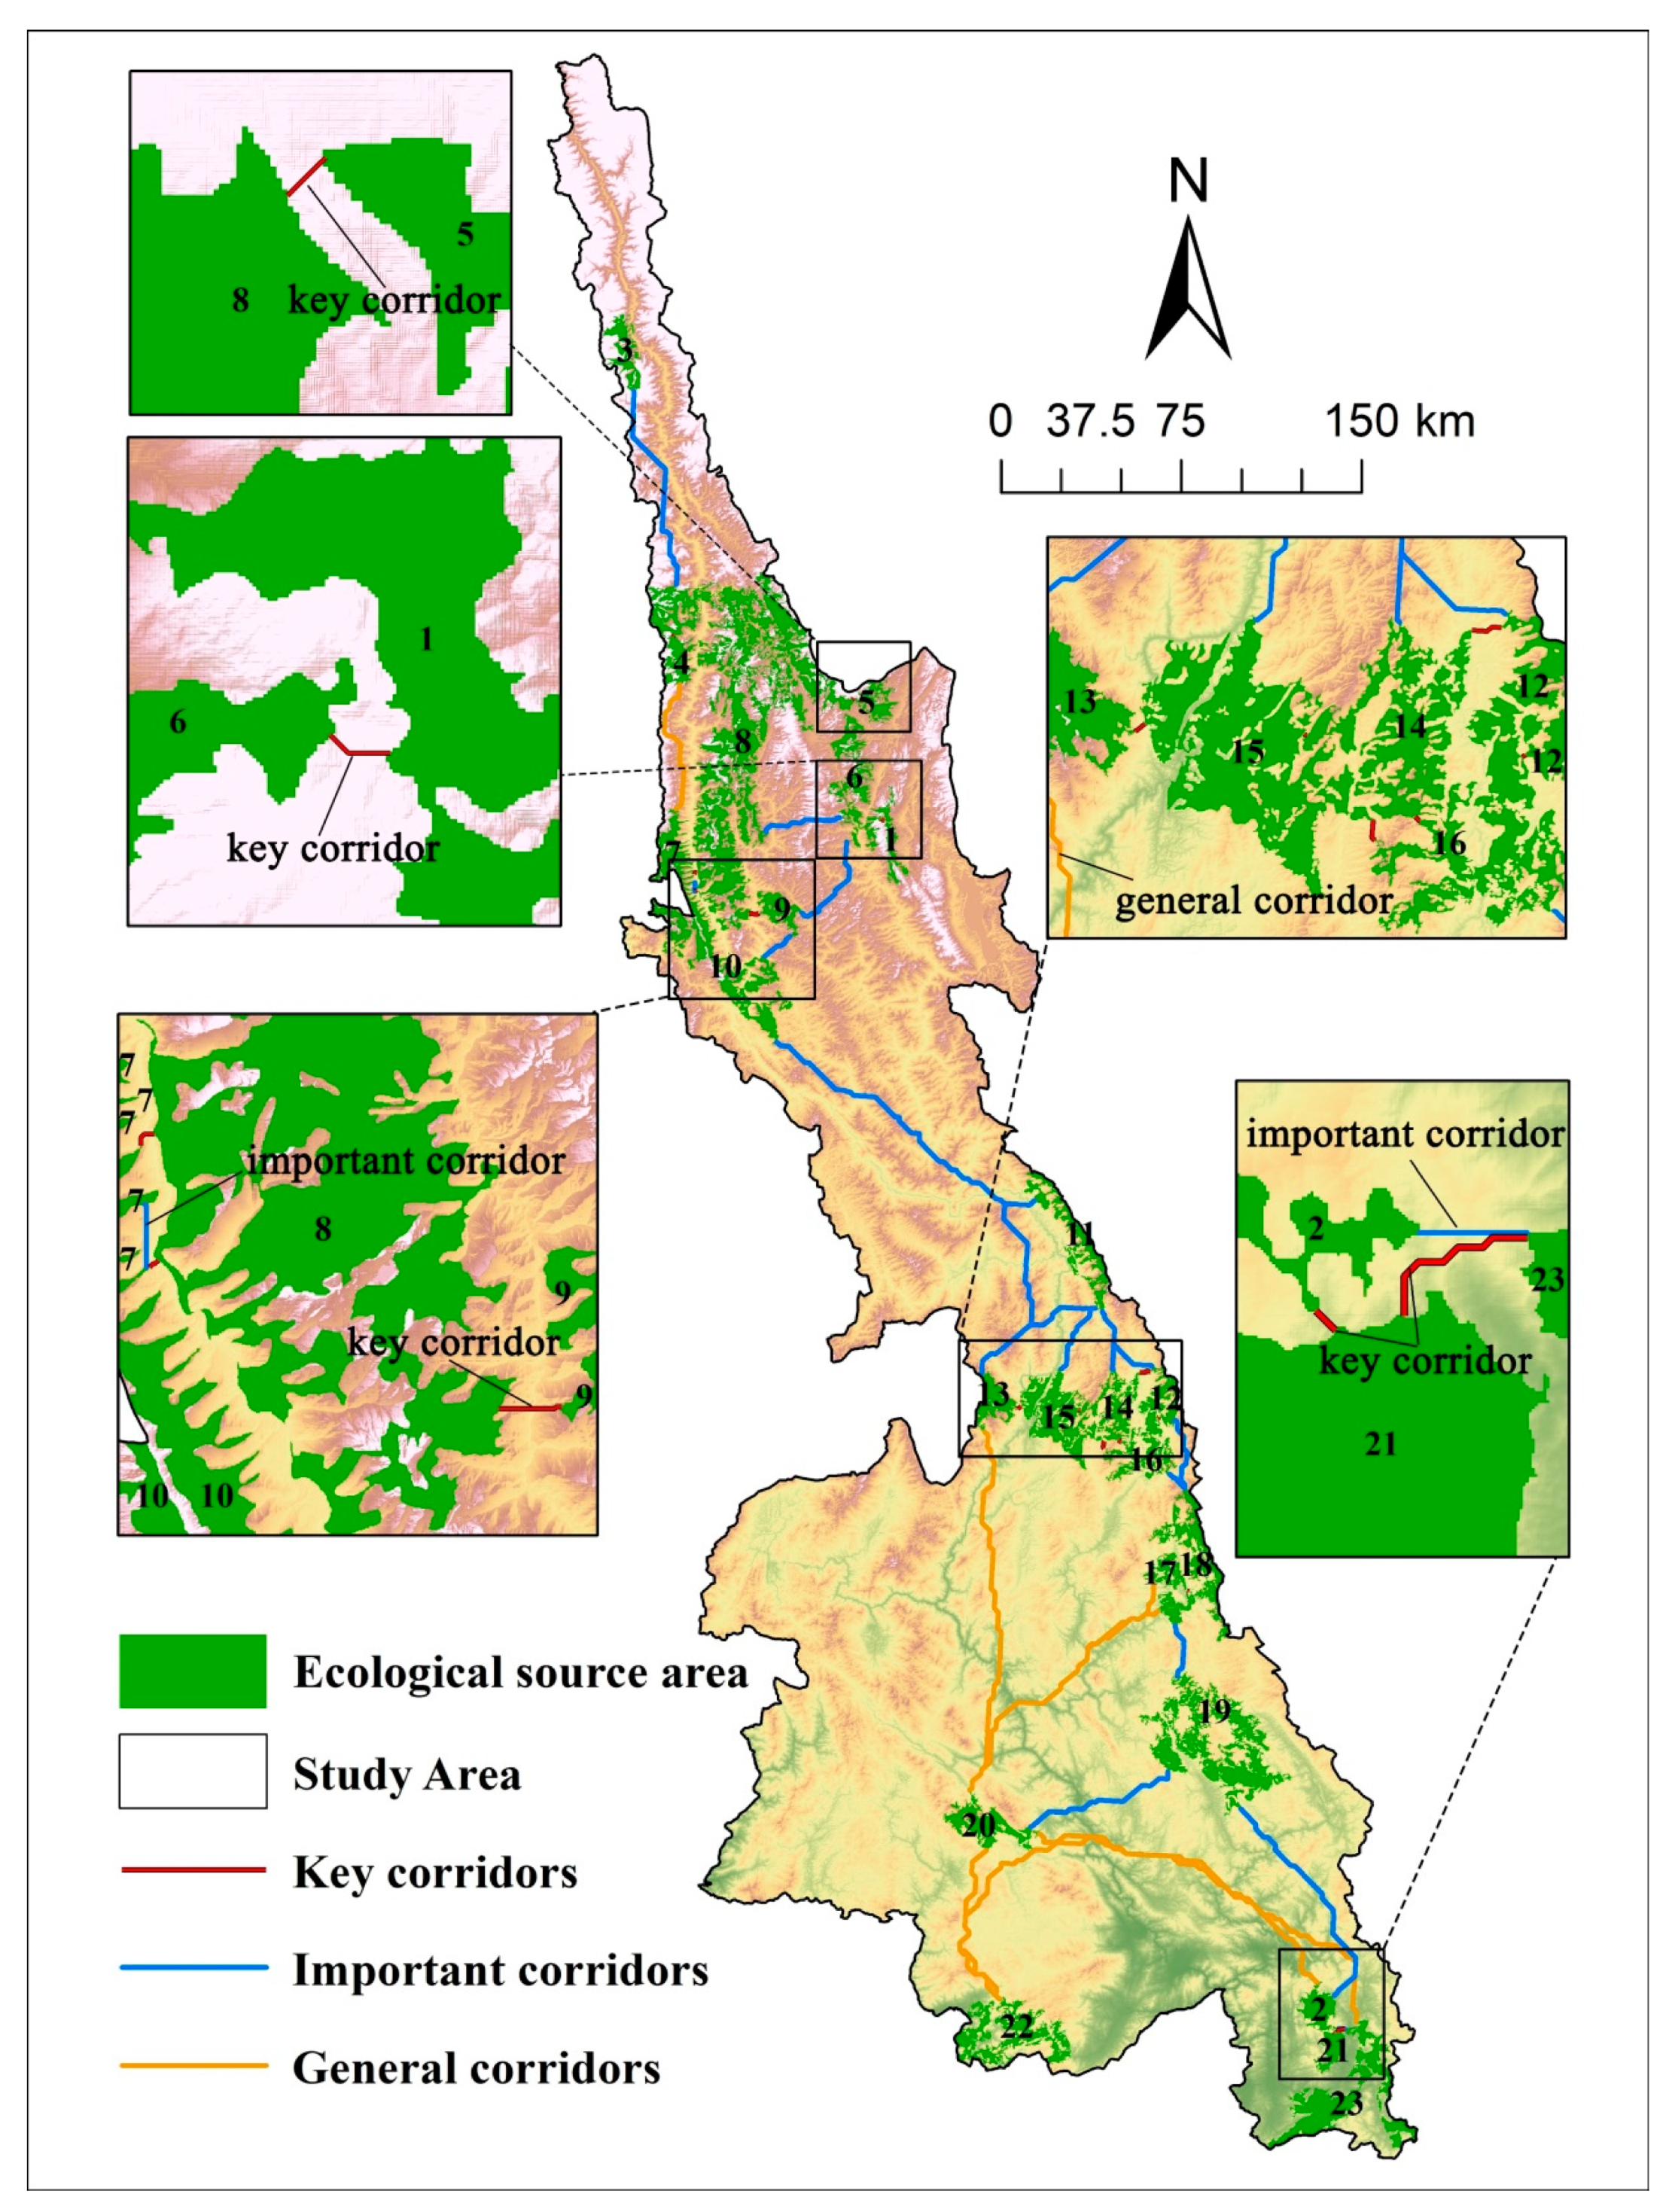
4.1.2. Evaluation of Corridor Importance and Construction of the Ecological Network

The results of the resistance assessment indicated that the basic resistance values in the study area were evenly distributed between high resistance values and ground resistance values. After night light coefficient correction was applied to the resistance values, the maximum comprehensive resistance value in the study area reached 363,746,875, and the areas with high resistance values showed a clumped distribution, which is consistent with the distribution of areas with active human activities (Figure 3). A total of 39 ecological corridors were extracted in the study area (Figure 4), with lengths ranging from 0.48–264.38 km and a total area of 1873.17 km2. Fewer corridors in the south of the study area had longer lengths, while many corridors in the middle and north of the study area had shorter lengths. The average corridor length of the basin was 48.03 km, and short-distance corridors below the average length accounted for 66.67% of the area, mostly distributed in the central and northern areas of the study area. That is because the central and northern parts are mostly tall mountains, with large forest and grassland coverage, good habitat quality, proximity to the source areas, low resistance, and strong connectivity. The terrain in the south area is relatively flat, with high human activity intensity and high resistance values. Currently, the southern sources are far away from each other, and no habitat is suitable for the species to inhabit or travel through the middle. Therefore, the ecological corridors identified in this study are few and large. In this study, the gravity model was used to quantify the importance of the corridor by analyzing the interaction strength between the sources. In total, 15 key corridors (Gij > 3000), 17 important corridors (1 < Gij < 3000), and 7 general corridors (0 < Gij < 1) were extracted to form an ecological corridor network, which can increase the probability of species migration and diffusion.

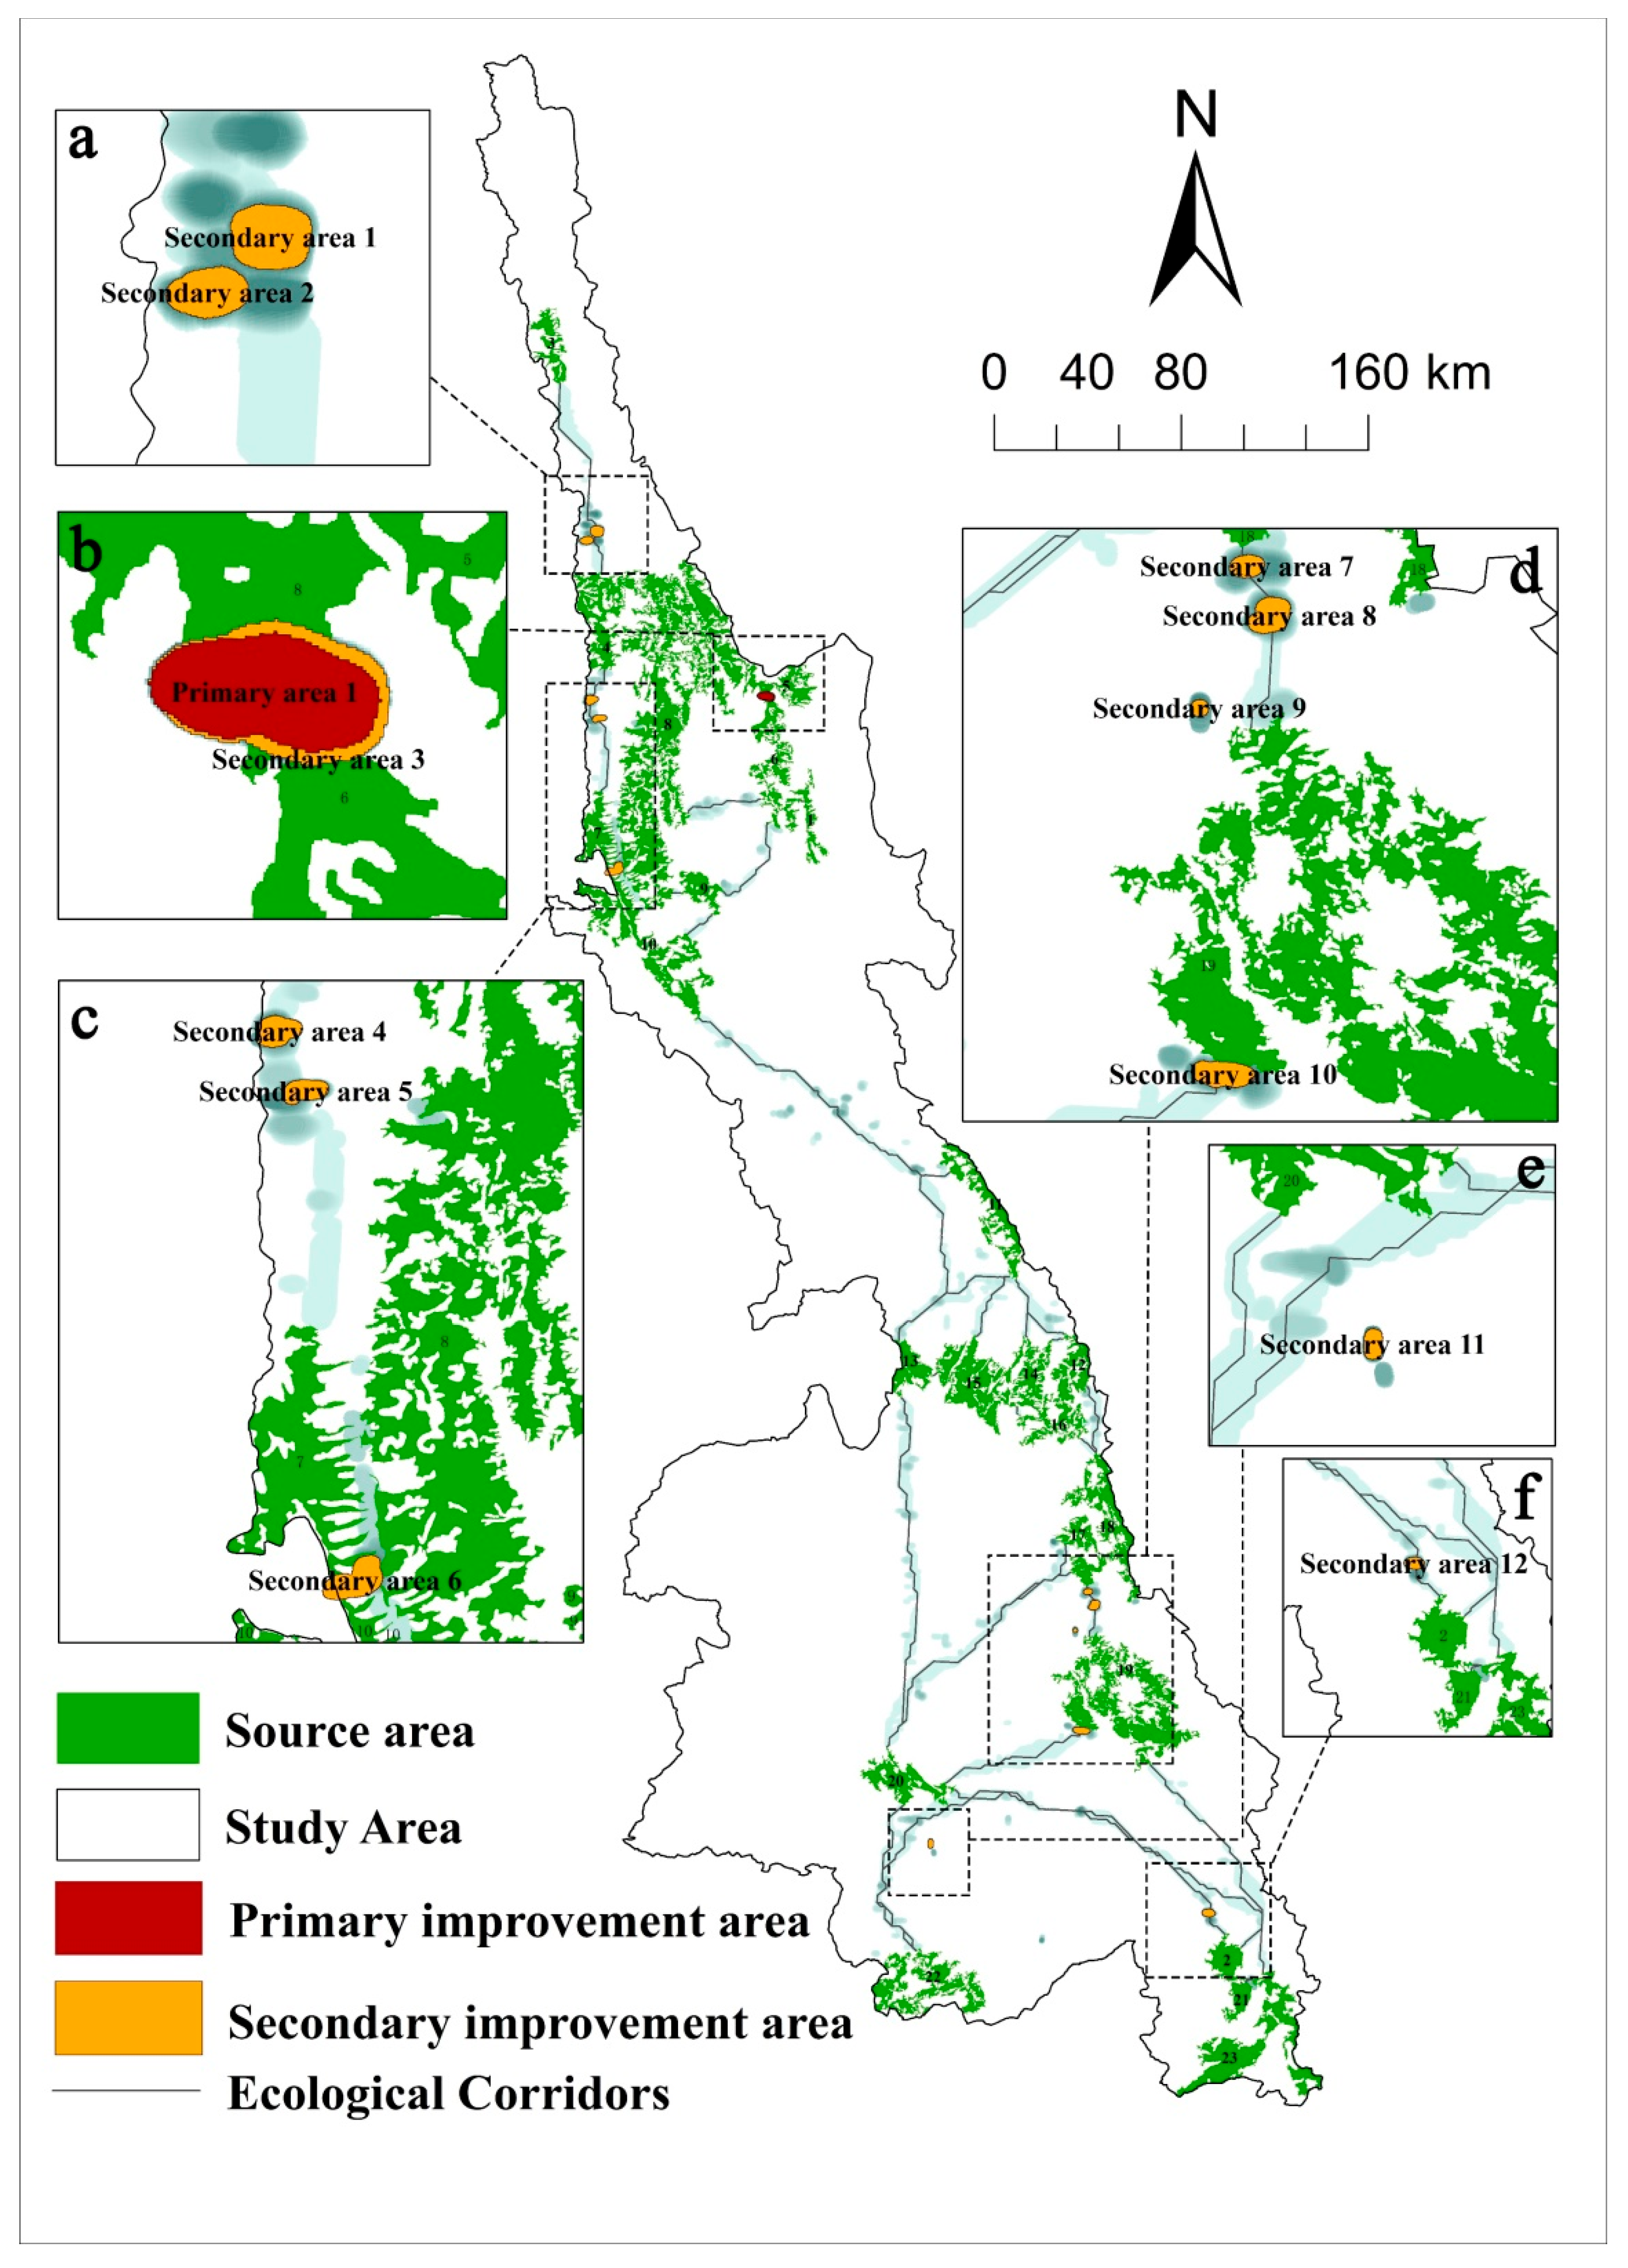
4.1.3. Identification of the Ecological Restoration Areas

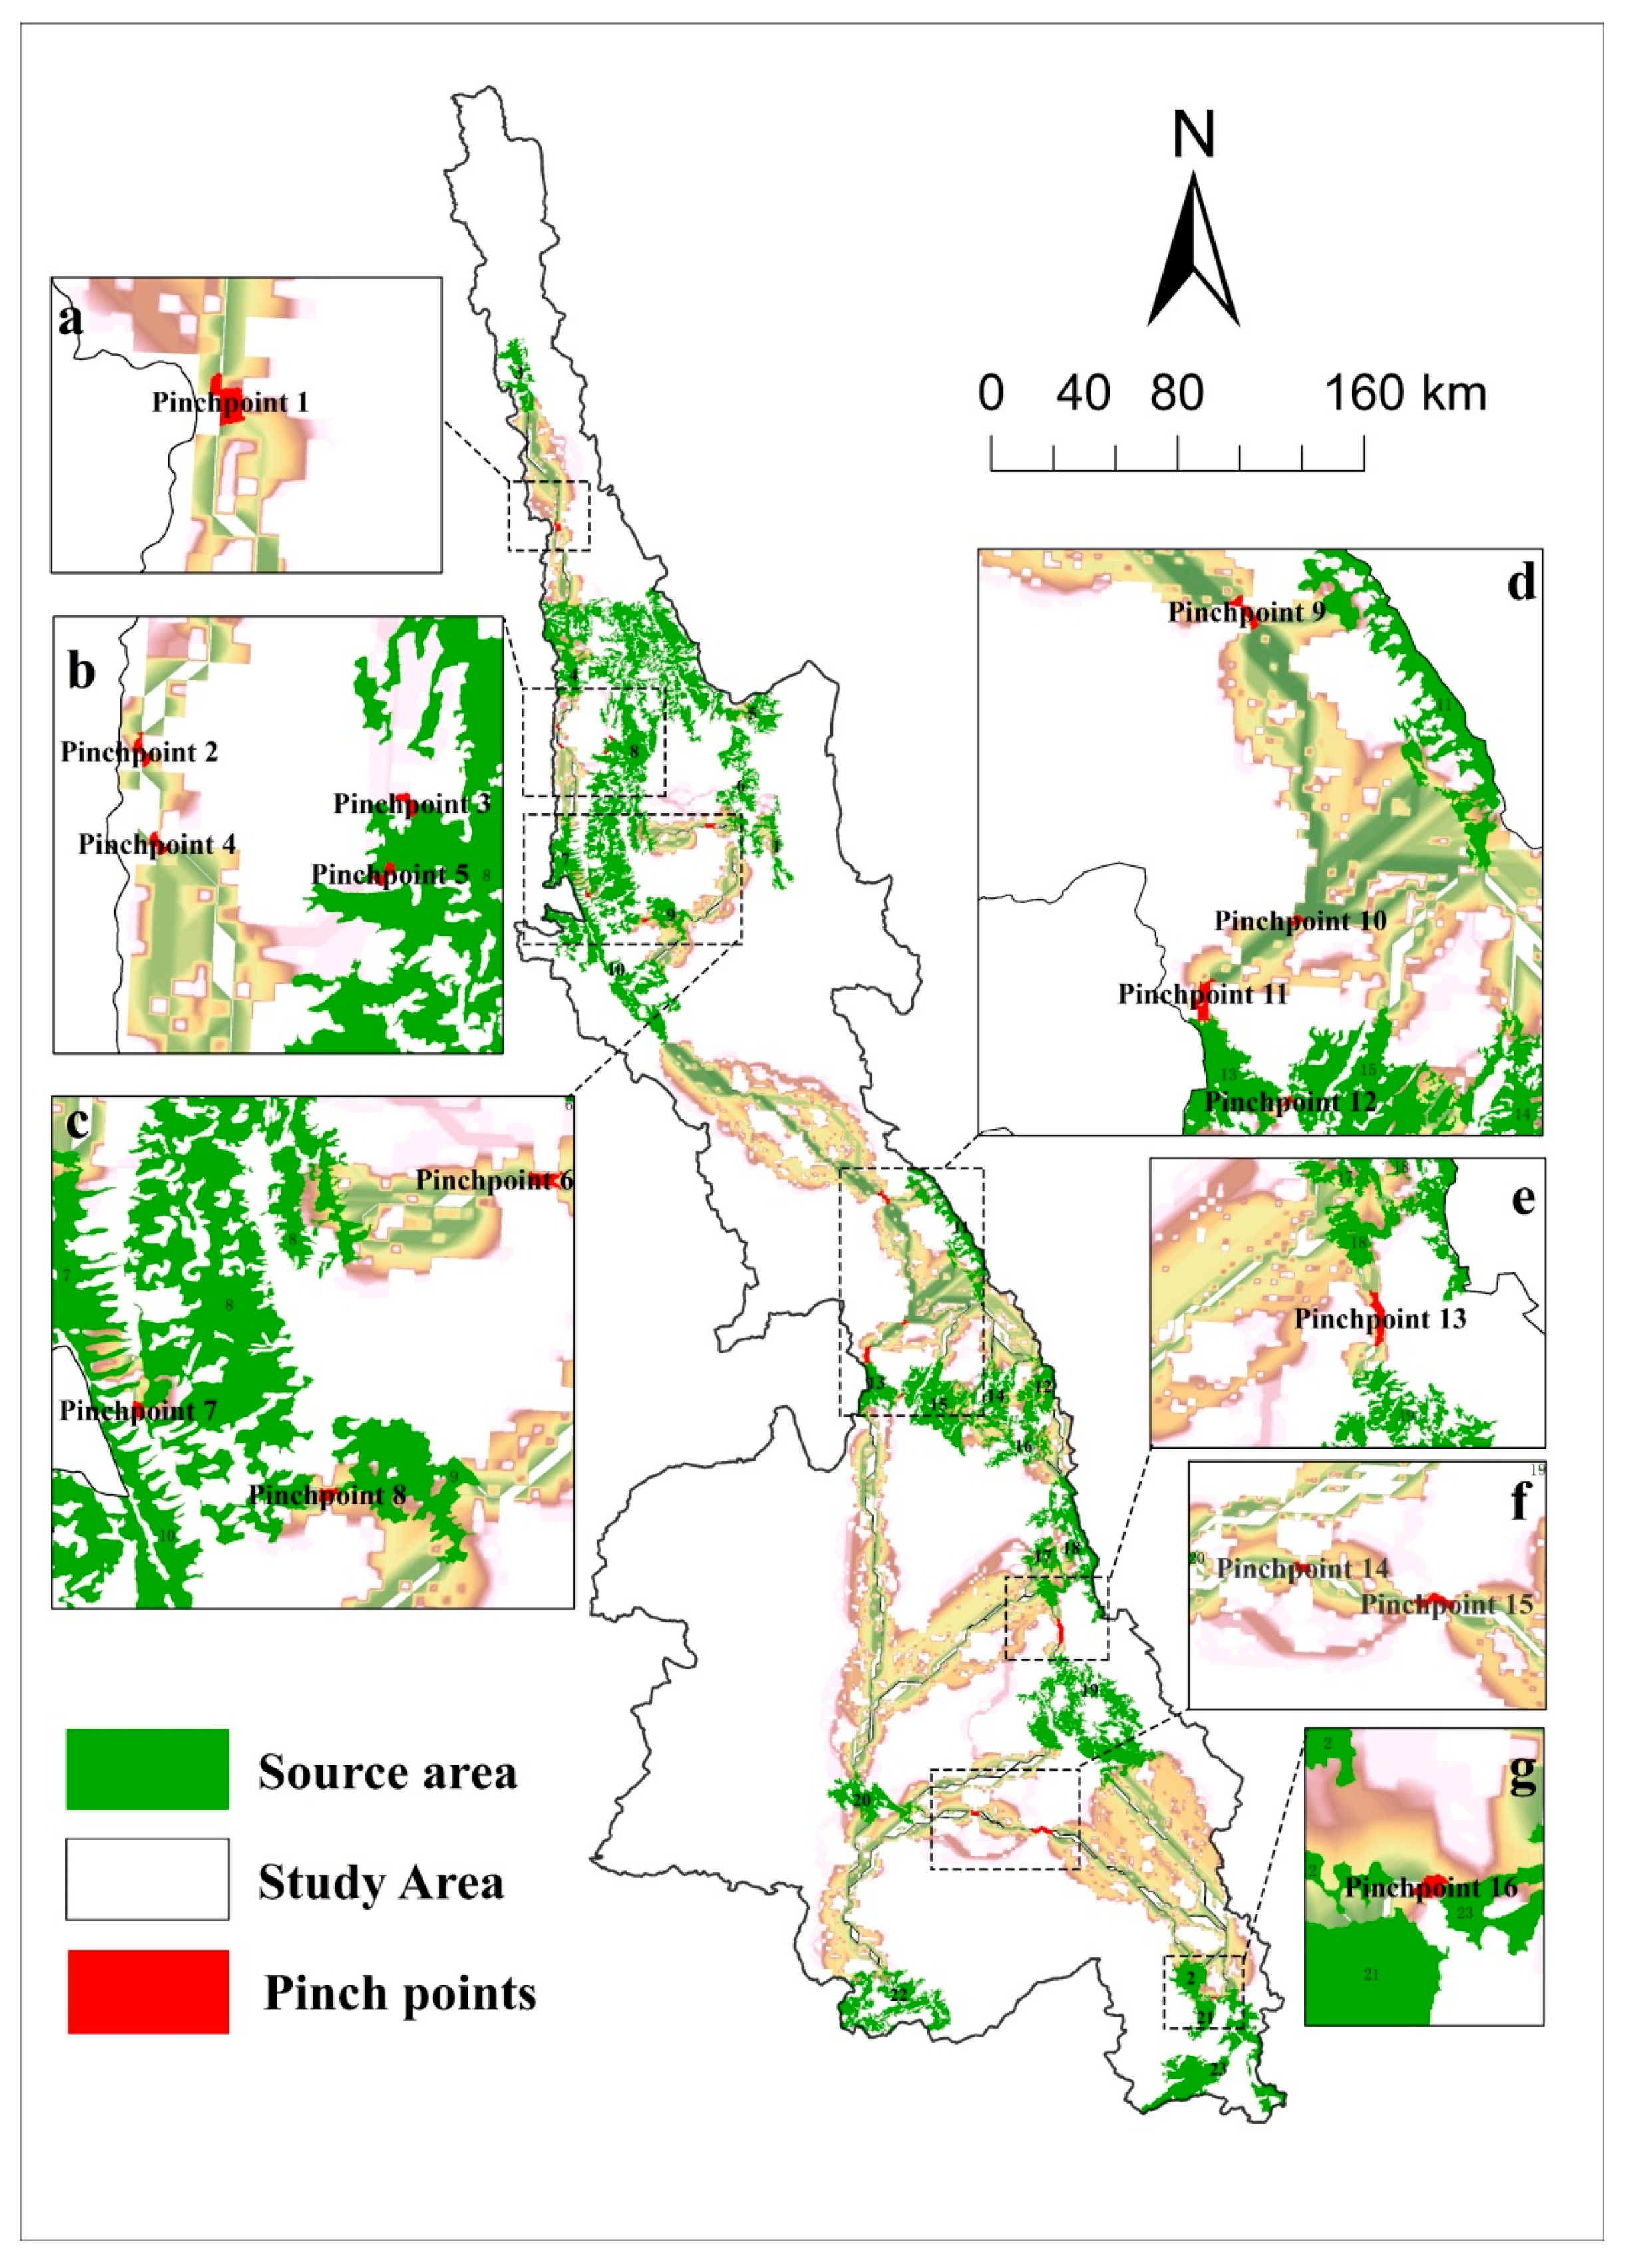
Identification of the Ecological Pinch Points and Obstacles

A pinch point is the most active area between ecological sources and plays an important role in maintaining the connectivity between these sources. The current intensity was divided into four grades, and the area with the highest current density was considered the ecological “pinch point”. Thus, 16 ecological pinch points were identified (Figure 5) with an area of 76.58 km2, mainly distributed as strips. The largest “pinch point” was in the north–south direction, located in the west of Ning’er County, with an area of 15.19 km2. This area connects Ning’er County with Pu’er City in Simao District, connects the No. 18 source area with Laiyang River Nature Reserve (No.19 source area), and coincides with the important No. 34 ecological corridor. In addition, four key corridors coincide with this pinch point. These areas are important for ESP construction and have extremely high ecological value. The other 15 pinch points are mainly distributed in Lanping County (4), Yunxian County (3), Jinghong City (2), and Yunlong County (2). Thus, several pinch points are observed in Lanping County, and the ecological flow in this region is found to be large. Therefore, particular attention should be paid to the safety of the ecological network by considering the system as a whole.
The analysis of obstacles in the ecological network indicated that the areas identified as inner obstacles in the watershed have scope for ecological improvement (Figure 6). These areas were divided into primary improvement areas and secondary improvement areas. Among them, one primary improvement area is 18.28 km2, with an improved score of 10.78–17.73.
There are 12 secondary improvement areas, covering 161.19 km2, of which 158.12 km2 is located along the ecological corridor, indicating that the expansion of the ecological corridor is either blocked or that it is difficult to maintain ecological stability. Removing or improving obstacles is extremely important for regional landscape connectivity. There is an urgent need for ecological restoration in primary improvement areas, as significant ecological restoration measures can lead to substantial effects. For example, ecological restoration in this area can directly improve the overall efficiency of the ecological network connectivity of watersheds. The secondary improvement areas are widely distributed, and the effects of restoration measures on these areas are relatively slow, indicating that a long-term restoration strategy is required for these areas.

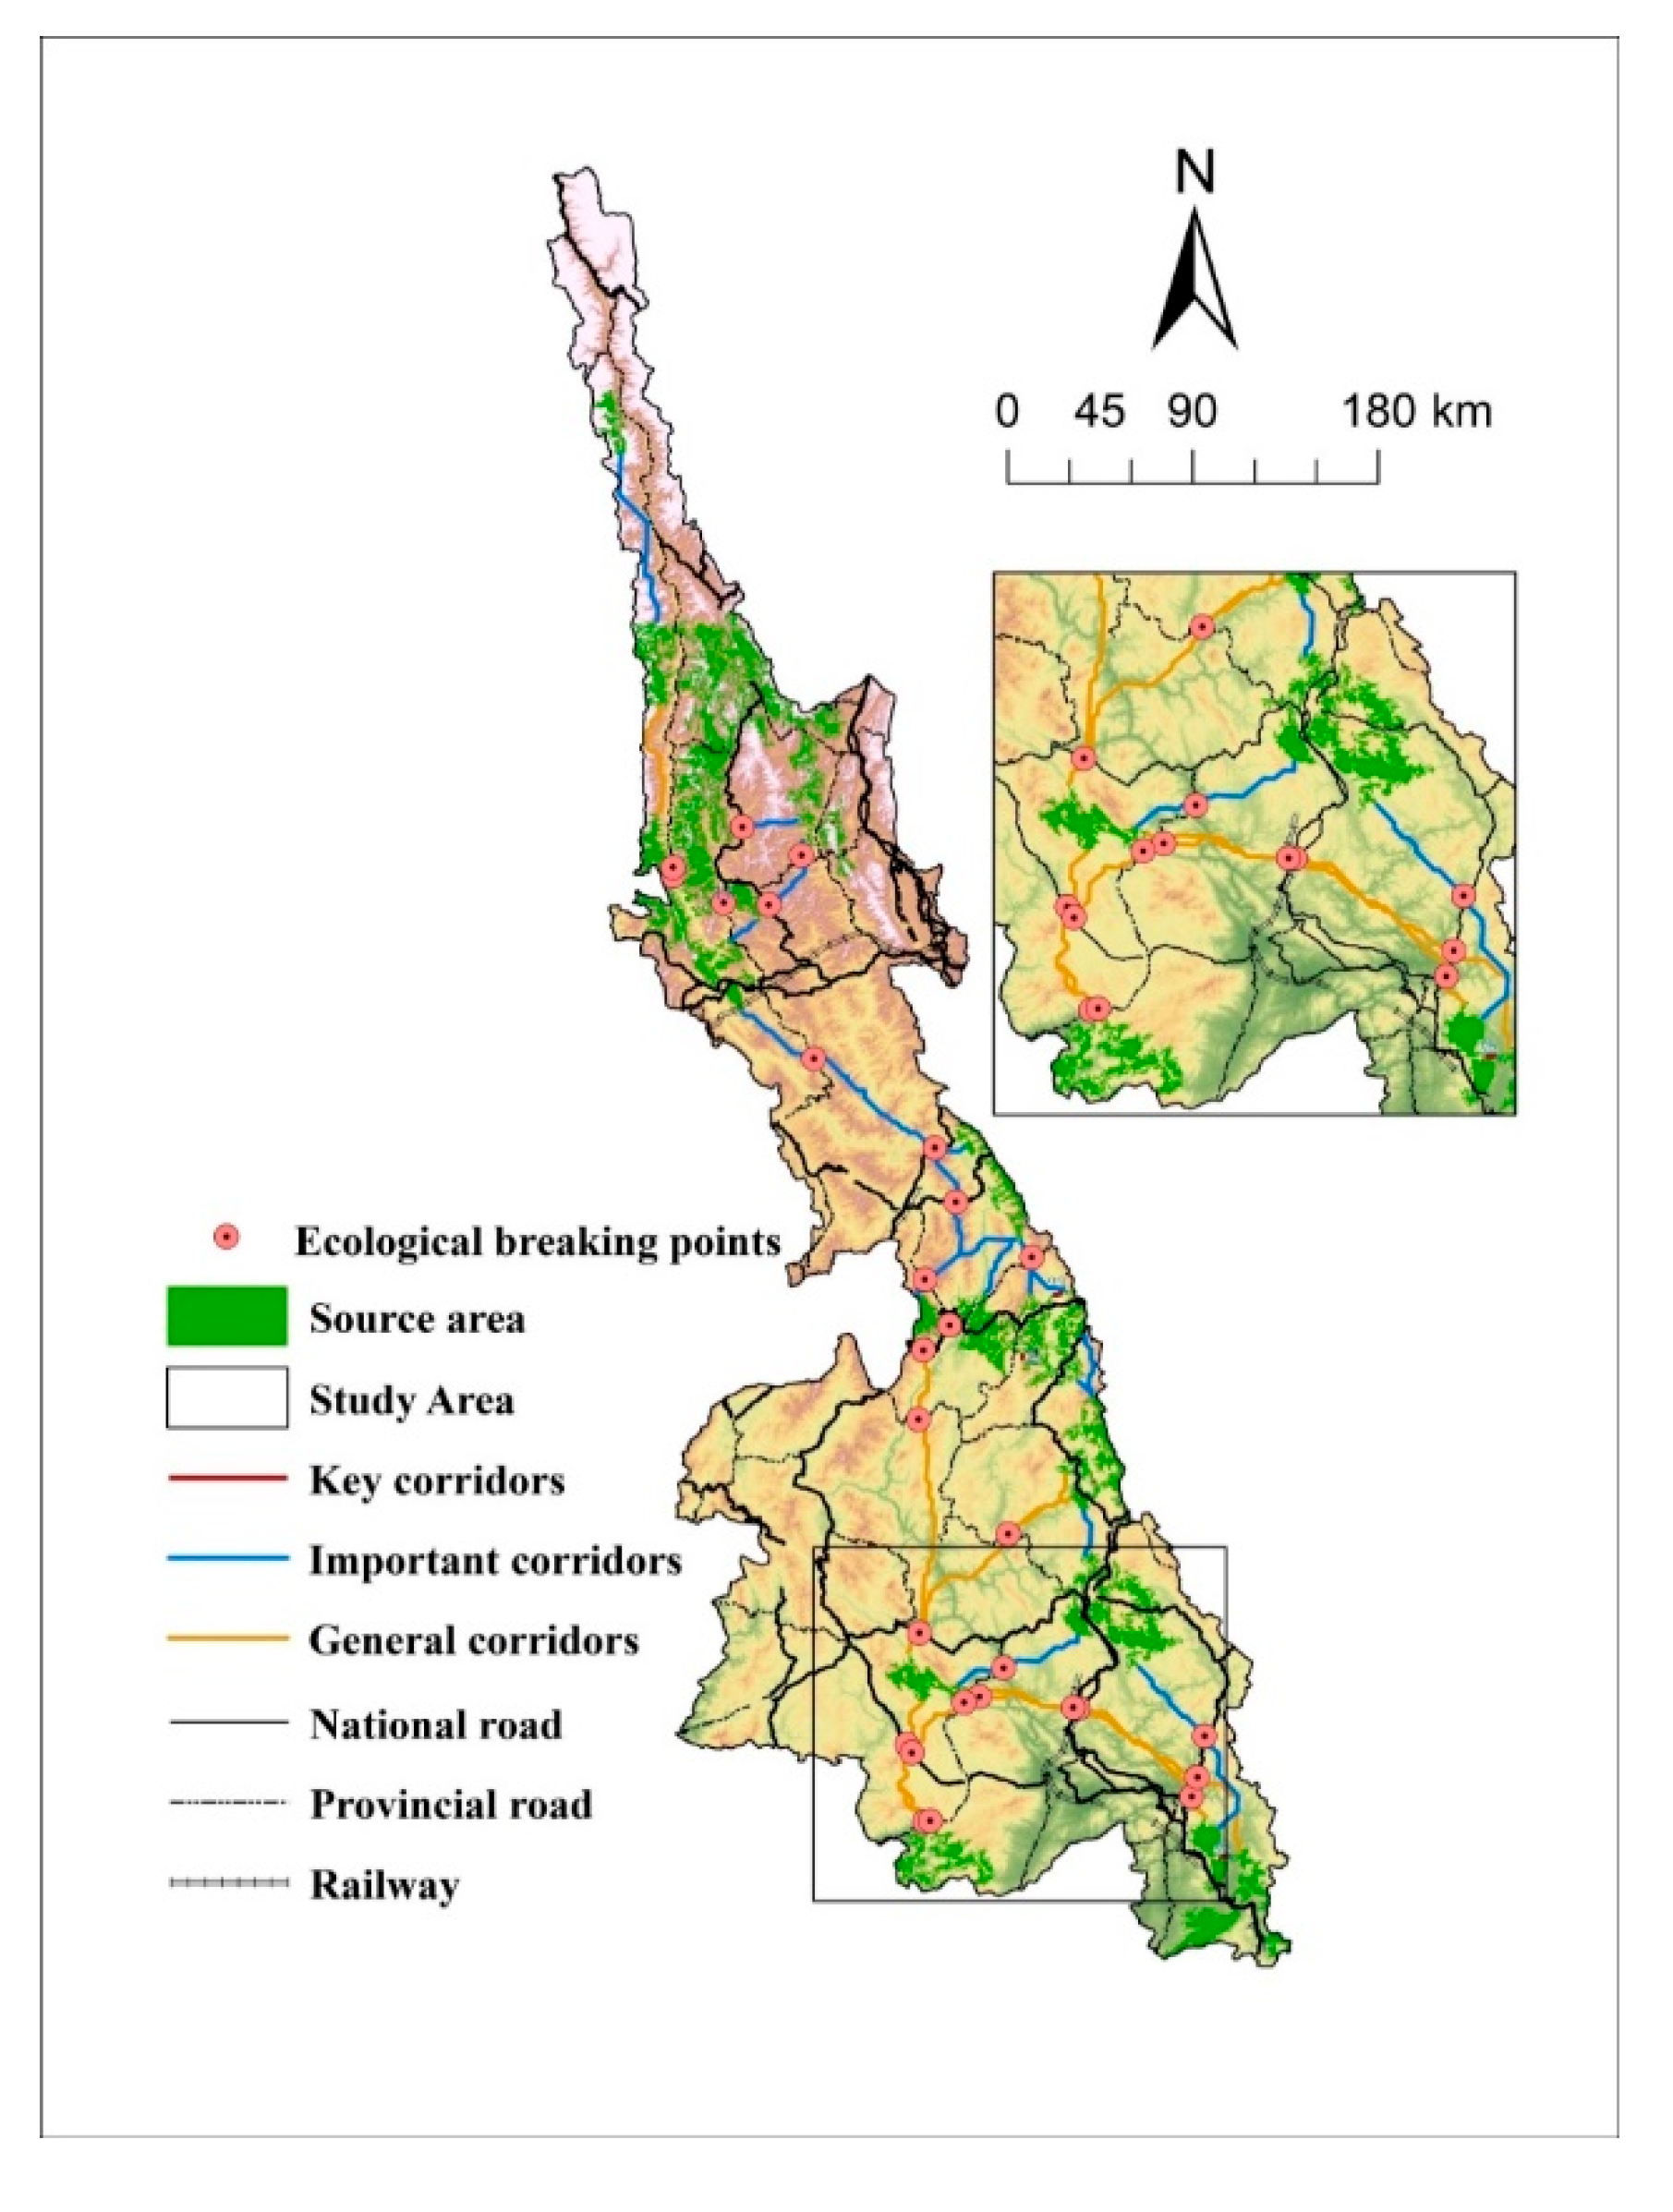
Identification and Restoration of the Ecological Breakpoints

The ecological breakpoint is the intermittent point of discontinuity on the corridor, which is mainly caused by the disruption of the ecological corridor due to traffic lines. The existing ecological breakpoints will significantly increase the difficulties in the migration of species between different ecological sources and obstruct the exchange and diffusion of species [44]. In this study, 29 areas where railways, national highways (including expressways), provincial highways, and ecological corridors intersect are identified as ecological breakpoints (Figure 7), with Yumo Railway identified as one breakpoint, national highways contributing to 14 breakpoints, and provincial highways contributing to the remaining 14 breakpoints. Railways, national highways, and provincial highways constitute important transportation facilities, which cannot be directly cleared. Therefore, wildlife passages for animals, such as culverts, under bridges, flyovers, and underground passages, should be set up in the ecological breakpoints based on the local conditions.

4.1.4. Protection and Restoration Strategies Based on the Key Ecological Elements

Protection and restoration measures are proposed based on the identification and spatial distribution of the ecological network, pinch points, obstacles, and ecological breakpoints in the Lancang River basin. Firstly, there is no doubt that for the protection of ecological patches, i.e., ecological source areas, including Baima Snow Mountain, Yunling, Yunlong Tianchi, Wuliang Mountain, Cangshan Erhai, Xishuangbanna, and several other nature reserves, ecological conservation measures must be strictly implemented, and ecological conservation projects, such as returning farmland to forests and closing off mountains for afforestation must be undertaken to improve forest coverage. It was observed that the key ecological corridors and important ecological corridors have good connectivity to the source area. There should be a focus on planning and protecting the corridors with better habitat suitability based on the ecological corridor identification results and terrain, vegetation, food resources, and other factors related to the ecological corridor. Trees should be planted on both sides of the roads in the primary improvement areas and ecological breakpoint areas for ecological restoration. Meanwhile, safe passages for wildlife should be established and monitored regularly. In addition, wildlife warning signs should be installed and maintained properly. The major land types in the secondary improvement areas are cultivated land and forest land. The area of cultivated land should be strictly controlled, and the conversion of farmland to forests should be carried out in a timely manner in areas that are unsuitable for cultivation. The ecological restoration of forest land can involve reasonable control over logging, strengthening forest management, and proper economic considerations in forest plantations, such as the cultivation of Chinese herbal medicine and mushrooms. Country parks can be set up in areas close to cities and towns, and the development of the forest fruit industry, vacation and leisure industry, and tourism can promote the economic development of the area while also maintaining ecological integrity.

5. Discussion

A proper ecological security pattern can improve the fragmentation of regional habitats, enhance the mobility of species between patches, and protect biodiversity. The overall habitat quality in the Lancang River basin is good, but the degree of fragmentation is high. The ecological network constructed and ecological nodes identified in this study can improve the overall connectivity of the ecological patches for overcoming the above shortcomings. In this paper, the habitat quality index and landscape connectivity are used as important bases for ecological source identification, and circuit theory is used to construct an ecological network. The research realizes the organic unity of the InVEST model, the MSPA model, and circuit theory, which is a new idea for the study of ecological security patterns. The ecological source is the basis for the construction of ecological security patterns. Previous studies have used wetlands, forest parks, and natural reserves as ecological sources, which is highly subjective. However, this study used the InVEST, MSAP, integrated habitat quality index, and landscape connectivity index to identify ecological sources, which makes this study more scientific. For example, scholar Wu Jiansheng integrated habitat quality assessment and landscape connectivity to construct an ecological source identification system in Shenzhen [45]. Zhou Jing integrated the InVEST and MSPA models to scientifically identify the ecological source of the Kaidu River Basin [16]. The research method of this paper is supported by existing studies. Through InVEST and MSPA models, high-quality ecological source areas can be screened. The resistance surface was constructed by comprehensively considering the natural environment, human society, and landscape pattern elements, and night light data were used to modify the resistance surface. The final resistance surface was the result of the combined action of the natural substrate and human influence. This study established a comprehensive resistive surface with objectivity and logic. The application of circuit theory to construct the ecological network has the following advantages: (1) simulating species movement based on current intensity, which makes it unnecessary to artificially eliminate the ecological corridor to avoid subjectivity, and (2) identification of the pinch points and obstacles based on the current density helps to explicitly identify the key areas for ecological protection and restoration.
Although the Lancang River Basin (Yunnan section) was selected as the research area, the research method in this paper was also applicable to other areas. Considering the scale of the study area, this study selected giant patches with more than 100 km2 as ecological sources, and some smaller high-quality patches may be omitted. Other scholars should consider the scale of the study area in future research, and determine parameters according to different research scales. However, this study also has some limitations. Different species have different habitat suitability and migration capacity, which can affect the ecological network structure to a certain extent. Therefore, the model parameters should be set differently for different species. In addition, corridor width is also an important factor that should be considered. The width of the migration corridor varies with species, corridor structure, connectivity, and the matrix in which the corridor is located. For birds and small animals, the corridor width should be tens of meters to meet these species’ requirements. However, the migration of large mammals requires larger corridor widths, which can even reach thousands of meters or even tens of kilometers [6]. Therefore, future studies should be based on indicators, parameters, and the width of the ecological corridor for specific species.

6. Conclusions

In this study, the Lancang River basin (Yunnan section) was considered as the study area, and InVEST, MSPA, and circuit theory were comprehensively used to build the ecological security pattern of the basin. The following conclusions can be drawn from this study:
In this study, the InVEST model was used to evaluate the habitat quality of the study area. Based on the habitat quality index, MSPA and Guidos software were used to identify the core area as an alternative ecological source. Then, through the analysis of the landscape connectivity of the alternative ecological sources, 23 ecological sources with an area of 9019.56 km2 were obtained. The main land use types in the ecological source area are woodland, grassland, and water areas, which all have high ecological value. Using the InVEST and MSPA models to identify ecological sources has the advantages of accuracy, objectivity and improved ecological connectivity. Based on the current density map generated by the circuit theory, the Linkage Pathways Tool was used to generate potential ecological corridors, and a total of 39 ecological corridors were obtained. The ecological corridors in the study area showed the characteristics of fewer corridors but longer lengths in the south and more corridors but shorter lengths in the central and northern parts. The main reason is that the central and northern regions are mostly mountainous areas with good habitats and good vegetation conditions, while the southern regions are flat, with frequent human activities and relatively high resistance. The importance of corridors was quantified by the gravity model, and 15 key corridors (Gij > 3000), 17 important corridors (1 < Gij < 3000), and 7 general corridors (0 < Gij < 1) are finally extracted to form a watershed ecological safety network, thereby increasing the probability of species migration and diffusion. Among them, key corridors and important corridors are of great significance to improve the connectivity of ecological sources, and should be prioritized for planning and protection.
In this study, 16 ecological pinch points are identified, mainly distributed as strips, and Lanping County is found to be the region with the most pinch points. One primary ecological improvement area and 12 secondary improvement areas are identified using an analysis of obstacle factors. The primary improvement areas can significantly improve the connectivity of the watershed ecological network. Therefore, high priority should be given to this area for ecological restoration. The secondary improvement areas are widely distributed, and the improvement in these areas as a result of restoration can be relatively slow, indicating the need for a long-term restoration strategy in these areas. Moreover, 29 ecological breakpoints are formed when the ecological corridor intersects with the traffic line, and ecological protection and restoration should be carried out in the corresponding ecological breakpoint areas.
In conclusion, the construction of an ecological security pattern in the Lancang River Basin (Yunnan section) is of great significance for the protection of biodiversity and regional sustainable development. In the process of regional development and urban expansion, development on these important ecological sources, ecological corridors, and key nodes should be avoided as much as possible to maintain the stability of the regional ecology. This study can provide useful reference for future biodiversity conservation and urban development planning and also provide some methods for constructing ecological security patterns. In view of some deficiencies and limitations of this study, future research should be conducted on more specific species and target areas.

Author Contributions

Conceptualization, Y.W. and L.Z.; methodology, Y.W. and L.Z.; software, Y.W.; validation, Y.W.; formal analysis, Y.W.; investigation, Y.W.; resources, Y.S.; data curation, Y.W. and L.Z.; writing—original draft preparation, Y.W.; writing—review and editing, Y.W.; visualization, Y.W.; supervision, Y.S.; project administration, Y.W.; funding acquisition, Y.S. All authors have read and agreed to the published version of the manuscript.

Funding

This research was funded by the National Natural Science Foundation of China, grant number 51968064; the Yunnan Provincial Department of Education Science Research Fund Project, grant number 2022Y617; and the Industrial Technology Leading Talent Project, grant number YNWR-CYJS-2020-022.

Institutional Review Board Statement

Not applicable.

Informed Consent Statement

Not applicable.

Data Availability Statement

Not applicable.

Acknowledgments

We acknowledge the data support from “National Earth System Science Data Center, National Science & Technology Infrastructure of China. (http://www.geodata.cn, accessed on 26 April 2022)”; The Night time light coefficient data set was provided by the National Tibetan Plateau Data Center (http://data.tpdc.ac.cn, accessed on 13 October 2022). In addition, we thank Bullet Edits Limited for the linguistic editing and proofreading of the manuscript. We thank the reviewers who provided valuable comments to improve the paper.

Conflicts of Interest

The authors declare no conflict of interest.

References

  1. Fan, J. The Strategy of Major Function Oriented Zoning and the Optimization of Territorial Development Patterns. Bull. Chin. Acad. Sci. 2013, 28, 193–206. [Google Scholar]
  2. Pan, Y.; Gong, J.; Yang, J.X.; Yang, T.; Wang, Y. Construction of Ecological Security Pattern Based on Ecological Importance and Connectivity of MSPA-core Area: A Case Study of Guijiang River Basin. China Land Sci. 2022, 36, 86–95. [Google Scholar]
  3. People’s Government of Yunnan Province. Yunnan Province’s Ecological Civilization Construction Vanguard Plan (2021–2025). Available online: http://www.yn.gov.cn/zwgk/zcwj/swwj/202205/t20220521242388.html (accessed on 21 October 2022).
  4. Xu, G. Research on Yunnan’s Striving to be the Vanguard of Ecological Civilization Construction. Master’s Thesis, Yunnan Normal University, Kunming, China, 2016. [Google Scholar]
  5. Peng, J.; Zhao, H.J.; Liu, Y.X.; Wu, J.S. Research progress and prospect on regional ecological security pattern construction. Geogr. Res. 2017, 36, 407–419. [Google Scholar]
  6. Wang, Y.Y.; Shen, C.Z.; Jin, X.B.; Bao, G.Y.; Liu, J.; Zhou, Y.K. Developing and optimizing ecological networks based on MSPA and MCR model. Ecol. Sci. 2019, 38, 138–145. [Google Scholar]
  7. Tang, F.; Fu, M.; Wang, L.; Zhang, P. Land-use change in Changli County, China: Predicting its spatio-temporal evolution in habitat quality. Ecol. Indic. 2020, 117, 106719. [Google Scholar] [CrossRef]
  8. Gou, M.M.; Liu, C.F.; Li, L.; Xiao, W.F.; Wang, N.; Hu, J.W. Spatiotemporal variation characteristics and scenario simulation of habitat quality in a typical basin of the Three Gorges Reservoir Area. Chin. J. Ecol. 2022, 41, 1–12. [Google Scholar]
  9. Wang, L.R.; Feng, X.L.; Chang, Q.; Liu, H.; Wang, J. Pattern Construction of Habitat Network for Urban Green Space Based on the Compound Model of InVEST and MCR. Chin. Landsc. Archit. 2020, 36, 113–118. [Google Scholar]
  10. Hao, Y.; Zhang, N.; Du, Y.J.; Wang, Y.H.; Zhang, Y.D.; Zhang, C.C. Construction of ecological security pattern based on habitat quality in Tang County, Hebei, China. Chin. J. Appl. Ecol. 2019, 30, 1015–1024. [Google Scholar]
  11. Soille, P.; Vogt, P. Morphological segmentation of binary patterns. Pattern Recognit. Lett. 2009, 30, 456–459. [Google Scholar] [CrossRef]
  12. Xu, F.; Yin, H.W.; Kong, F.H.; Xu, J.G. Developing ecological networks based on mspa and the least-cost path method—A case study in bazhong western new district. Acta Ecol. Sin. 2015, 35, 6425–6434. [Google Scholar]
  13. Mao, C.R.; Dai, L.M.; Qi, L.; Wang, Y.; Zhou, W.M.; Zhou, L.; Yu, D.P.; Zhao, F.Q. Constructing ecological security pattern based on ecosystem services: A case study in Liaohe River Basin, Liaoning Province, China. Acta Ecol. Sin. 2020, 40, 6486–6494. [Google Scholar]
  14. Fang, Y.; Wang, J.; Huang, L.Y.; Zhai, T.L. Determining and identifying key areas of ecosystem preservation and restoration for territorial spatial planning based on ecological security patterns: A case study of Yantai city. J. Nat. Resour. 2020, 35, 190–203. [Google Scholar]
  15. Zhu, J.; Su, J.; Yin, H.W.; Kong, F.H. Construction of Xuzhou ecological network based on comprehensive sources identification and multi-scale nesting. J. Nat. Resour. 2020, 35, 1986–2001. [Google Scholar]
  16. Zhou, J.; Wang, H.W.; Tan, B.; Ma, C.; Wang, X.Q.; Dai, X.Y. Construction of ecological security pattern and identification of ecological rehabilitation Zones in Kaidu River Basin. Acta Ecol. Sin. 2022, 42, 1–11. [Google Scholar]
  17. Dickson, B.G.; Albano, C.M.; Anantharaman, R.; Beier, P.; Fargione, J.; Graves, T.A.; Gray, M.E.; Hall, K.R.; Lawler, J.J.; Leonard, P.B.; et al. Circuit-theory applications to connectivity science and conservation. Conserv. Biol. 2018, 33, 239–249. [Google Scholar] [CrossRef]
  18. Tong, L.; Yao, X.J.; Wang, X. Construction of Ecological Security Pattern in Agricultural Plains Based on Circuit Theory—A Case Study of Bozhou City. Environ. Sci. Technol. 2020, 43, 217–226. [Google Scholar]
  19. Zhou, L.; Li, M.H.; Zhou, Q.G.; Meng, H.B.; Peng, C.H.; Liu, X.W. Construction of Ecological Security Pattern in Very Large Mountainous City Based on Circuit Theory—Taking Chongqing Metropolitan Area as an Example. Res. Soil Water Conserv. 2021, 28, 319–325. [Google Scholar]
  20. Li, J.L.; Xu, J.G.; Chu, J.L. Constructing the Urban Ecological Security Pattern of Anqing City by Circuit Theory. Resour. Environ. Yangtze Basin 2020, 29, 1812–1824. [Google Scholar]
  21. Yang, S.S.; Zou, C.X.; Shen, W.S.; Shen, R.P.; Xu, D.L. Construction of ecological security patterns based on ecological red line—A case study of Jiangxi Province. Acta Ecol. Sin. 2016, 35, 250–258. [Google Scholar]
  22. Chen, X.; Peng, J.; Liu, Y.X.; Yang, Y.; Li, G.C. Constructing ecological security patterns in Yunfu city based on the framework of importance-sensitivity-connectivity. Geogr. Res. 2017, 36, 471–484. [Google Scholar]
  23. Zhang, M.F.; Chen, P.; Liu, B.W.; Gou, D.W.; Gong, Q.H. Construction of Natural Reserve Network in Shantou CityBased on Minimum Cumulative Resistance Model. Guangdong Agric. Sci. 2020, 47, 119–127. [Google Scholar]
  24. Zheng, Q.M.; Shen, M.Z.; Zhong, L.S. Construction of ecological security pattern in Pudacuo National Park. Acta Ecol. Sin. 2021, 41, 874–885. [Google Scholar]
  25. Xia, Y.; Zhang, Y.Y.; Li, E.H.; Cai, X.B.; Yang, C.; Yang, J. Spatio-temporal Evolution and Prediction of Habitat Quality in Four Lakes Basin of Jianghan Plain. Resour. Environ. Yangtze Basin 2022, 31, 1616–1626. [Google Scholar]
  26. Pan, Y.; Yin, Y.H.; Hou, W.J.; Han, H.S. Spatiotemporal variation of habitat quality in the Source Region of the Yellow River based on land use and vegetation cover changes. Acta Ecol. Sin. 2022, 42, 7978–7988. [Google Scholar]
  27. Cheng, S.K.; Shen, L.; Xu, Z.R. A Comprehensive Study of Scientific Expedition in Lancang River Basin and Greater Shangri-La Region; Science Press: Beijing, China, 2015; pp. 1–26. [Google Scholar]
  28. Zhao, J.; Liang, R.Q.; Mei, J. Target Species Oriented Construction of Urban Habitat Network. In Proceedings of the 2020 Annual Conference of the China Society of Landscape Architecture, Chengdu, China, 21 November 2020; China Architecture & Building Press: Beijing, China, 2021; Volume 1, pp. 607–612. [Google Scholar]
  29. Cao, J.J.; Fu, J.W. Research on the construction method of urban green space habitat network based on InVEST model and Least-cost path: A case study of Nanjing. Chin. Landsc. Archit. 2022, 38, 1–10. [Google Scholar]
  30. Pereira, H.M.; Cooper, H.D. Towards the global monitoring of biodiversity change. Trends Ecol. Evol. 2006, 21, 123–129. [Google Scholar] [CrossRef]
  31. Chowfin, S.M.; Leslie, A.J. Using birds as biodindicators of forest restoration progress: A preliminary study. Trees For. People 2021, 3, 100048. [Google Scholar] [CrossRef]
  32. Peng, J.; Pan, Y.J.; Zhao, H.J.; Wang, Y.L. Linking ecological degradation risk to identify ecological security patterns in a rapidly urbanizing landscape. Habitat Int. 2018, 71, 110–124. [Google Scholar] [CrossRef]
  33. Huang, M.Y.; Yue, W.Z.; Feng, S.R.; Zhang, J.H. Spatial-temporal evolution of habitat quality and analysis of landscape patterns in Dabie Mountain area of west Anhui province based on InVEST model. Acta Ecol. Sin. 2020, 40, 2895–2906. [Google Scholar]
  34. Li, X.; Yang, J.M.; Chen, Y.H.; Mao, L.F.; Ge, Z.W. Evaluations of habitat quality of Jiangsu Yancheng Wetland National Nature Rare Bird Reserve based on land use changes. J. Nanjing For. Univ. (Nat. Sci. Ed.) 2022, 46, 169–176. [Google Scholar]
  35. Zhao, Q.J.; Wu, X.Z. Research on the impact of land use change on habitat quality in Minjiang river basin based on InVEST Model. Ecol. Sci. 2022, 41, 1–10. [Google Scholar]
  36. Ding, Q.; Chen, Y.; Bu, L.; Ye, Y. Multi-scenario analysis of habitat quality in the Yellow River delta by coupling FLUS with InVEST model. Int. J. Environ. Res. Public Health 2021, 18, 2389. [Google Scholar] [CrossRef]
  37. Jang, J.E.; Kwon, H.Y.; Shin, H.S.; Lee, S.C.; Yu, B.H.; Jang, J.; Choi, S.H. Habitat Quality Analysis and Evaluation of InVEST Model Using QGIS-Conducted in 21 National Parks of Korea. Korean J. Environ. Ecol. 2022, 36, 102–111. [Google Scholar] [CrossRef]
  38. Ning, Q.; Zhu, Z.M.; Qin, M.L.; Shi, Q.Q.; Song, Y.Z. Research on the optimization of territorial space ecological network of Nanning City based on MSPA and circuit theory. J. Guangxi Univ. (Nat. Sci. Ed.) 2021, 46, 306–318. [Google Scholar]
  39. Xu, W.Z.; Huang, S.Y.; Geng, J.W.; Wang, X.Y.; Fu, W.C.; Lin, S.Y.; Dong, J.W. Construction of Ecological Space Network in Xiamen City Based on MCR and Gravity Model. J. Northwest For. Univ. 2022, 37, 264–272. [Google Scholar]
  40. Qin, B.G.; Lin, Y.L.; Zhao, J.S.; Chen, G.P.; He, W.C.; Lv, Q.Z. Identification of Key Areas for the Ecological Restoration of Territorial Space in Kunming Based on the InVEST Model and Circuit Theory. China Environ. Sci. 2022, 42, 1–12. [Google Scholar]
  41. Zhang, H.L.; Ye, C.S.; Hu, M.S. Identification and Restoration Strategy of Key Areas of Ecological Restoration in Urban Agglomeration around Poyang Lake Based on Ecological Security Pattern. Res. Soil Water Conserv. 2022, 29, 1–10. [Google Scholar]
  42. Meng, J.J.; Wang, Y.; Wang, X.D.; Zhou, Z.; Sun, N. Construction of landscape ecological security pattern in Guiyang based on MCR model. Resour. Environ. Yangtze Basin 2016, 25, 1052–1061. [Google Scholar]
  43. Chen, N.N.; Kang, S.Z.; Zhao, Y.H.; Zhou, Y.J.; Yan, J.; Lu, Y.R. Construction of ecological network in Qinling Mountains of Shaanxi, China based on MSPA and MCR model. Chin. J. Appl. Ecol. 2021, 32, 1545–1553. [Google Scholar]
  44. Ni, Q.L. Key Arca Identification of County Ecological Restoration Based on Ecological Network—A Case Study of Jiawang District. Master’s Thesis, China University of Mining and Technology, Xuzhou, China, 2021. [Google Scholar]
  45. Wu, J.S.; Zhang, L.Q.; Peng, J.; Feng, J.; Liu, H.M.; He, S.B. The integrated recognition of the source area of the urban ecological security pattern in Shenzhen. Acta Ecol. Sin. 2013, 33, 4125–4133. [Google Scholar]
Figure 1. Research framework. The picture was drawn by the author.
Sustainability 15 00477 g001
Figure 2. Spatial distribution of ecological sources in the Lancang River Basin. The picture was drawn by the author. The relevant data were obtained from the National Catalogue Service For Geographic Information and the Institute of Geographic Sciences and Natural Resources Research, CAS.
Sustainability 15 00477 g002
Figure 3. Ecological resistance factors. The picture was drawn by the author. The relevant data were obtained from the National Catalogue Service For Geographic Information and the Institute of Geographic Sciences, Natural Resources Research, Chinese Academy of Sciences, EARTHDATA, the National Qinghai-Tibet Plateau Scientific Data Center, and the Data Registration and Publishing System of Resources and Environmental Sciences.
Sustainability 15 00477 g003
Figure 4. Identification of the ecological corridor based on the circuit theory. The picture was drawn by the author. The relevant data were obtained from the National Catalogue Service For Geographic Information and the Institute of Geographic Sciences, Natural Resources Research, Chinese Academy of Sciences, EARTHDATA, the National Qinghai-Tibet Plateau Scientific Data Center, and the Data Registration and Publishing System of Resources and Environmental Sciences.
Sustainability 15 00477 g004
Figure 5. Identification of the Pinch points. (a)–(g) is the code of the local detail map of the ecological security pattern: it shows the distribution of pinch points. The picture was drawn by the author. The relevant data were obtained from the National Catalogue Service For Geographic Information and the Institute of Geographic Sciences, Natural Resources Research, Chinese Academy of Sciences, EARTHDATA, the National Qinghai-Tibet Plateau Scientific Data Center, and the Data Registration and Publishing System of Resources and Environmental Sciences.
Sustainability 15 00477 g005
Figure 6. Identification of the improvement areas. (a)–(f) is the code of the local detailed map of the ecological security pattern: it shows the distribution of the improvement areas. The picture was drawn by the author. The relevant data were obtained from the National Catalogue Service For Geographic Information and the Institute of Geographic Sciences, Natural Resources Research, Chinese Academy of Sciences, EARTHDATA, the National Qinghai-Tibet Plateau Scientific Data Center, and the Data Registration and Publishing System of Resources and Environmental Sciences.
Sustainability 15 00477 g006
Figure 7. Identification of the ecological breakpoints. The picture was drawn by the author. The relevant data were obtained from the National Catalogue Service For Geographic Information and the Institute of Geographic Sciences, Natural Resources Research, Chinese Academy of Sciences, EARTHDATA, the National Qinghai-Tibet Plateau Scientific Data Center, and the Data Registration and Publishing System of Resources and Environmental Sciences.
Sustainability 15 00477 g007
Table 1. Attributes of threat factor.
Threat FactorsMaximum InfluenceWeightAttenuation Mode
Drylands80.7Linear
Paddy fields80.7Linear
Rural residential areas50.6Index
Urban land uses101Index
Other construction lands50.5Index
Table 2. Habitat suitability and its sensitivity to threat factors.
Major Land TypesGround Class CodeLand-Use TypesHabitat SuitabilityPaddy FieldsDrylandsRural SettlementsUrban LandsOther Construction Lands
Plough11Paddy field0.40.30.30.60.70.5
12Dryland0.30.30.30.60.60.4
Woodland21Forested land10.60.60.80.90.8
22Spinney0.80.60.60.60.80.7
23Sparse woodland0.70.50.50.70.70.4
24Other woodlands0.60.50.50.70.70.8
Lawn31High coverage grassland0.70.60.60.70.70.7
32Medium coverage grassland0.60.50.50.70.70.7
33Low coverage grassland0.50.50.50.70.70.7
Water41Rivers and canals10.60.60.70.90.8
42Lake10.60.60.70.90.8
43Reservoir pit pond0.80.50.50.60.90.8
44Permanent glacier and snow000000
46Beachland0.50.50.50.60.90.8
Construction lands51Urban land000000.2
52Rural settlements000000.7
53Other construction lands0000.60.70
Unused land64Marshland0.50.40.40.40.40.3
65Barren earth000000
66Bare rock texture000000
Table 3. Ecological resistance factors and weights.
LevelEvaluation FactorGrading CriteriaDrag CoefficientWeight
Natural environmental factorsSlope0–510.0834
5–15100
15–25200
25–35300
>35500
Elevation<150010.0357
1500–2000100
2000–2500200
2500–3000300
>3000500
Distance from the water system0–50010.0225
500–1500100
1500–2500200
2500–3500300
>3500500
Social and economic elementsDistance from road0–5008000.0834
500–1000500
1000–1500300
1500–2000200
>20001
Distance from the residential area0–10001,0000.2503
1000–2000500
2000–3000200
3000–4000100
>40001
Ecological pattern elementsLand use typePlough1000.3498
Woodland1
Lawn100
Waters10
Land for construction1000
Unused land300
Habitat quality index010000.1749
0–0.4800
0.4–0.7500
0.7–0.8200
0.8–11
Table 4. Circuit theory and corresponding ecological terms and ecological meanings.
Circuit FactorsCorresponding Ecological TermsEcological Meaning
Power SupplyEcological sourceHabitat in the region with high quality and suitable for species survival
Electric currentSource connectivityThe net number of times the specified species (wanderers) in the habitat leave the nest area for evacuation and migration and pass through the landscape nodes before reaching the target nest area is proportional to the probability of net migration through the corresponding landscape nodes; a high-current-density area forms a “radiation path” to a certain extent
Electric conductanceHabitat suitabilityHabitat suitability refers to the capacity of the habitat and is directly proportional to the diffusion ability of the species
Electric resistanceLandscape resistanceThe impedance encountered by species migration or diffusion in habitats is directly proportional to the challenges in migration
VoltageSource connectivity probabilityThe net migration probability of any species (random walkers) in the habitat leaving the nest for migration and successfully reaching the designated landscape node or nest source is the basis for the selection of the possible connectivity index
Table 5. Landscape classification based on MSPA.
Landscape TypesArea (km2)Proportion of Foreground Elements (%)Proportion of Total Area (%)
Core21,972.6083.8423.80
Islet5.690.020.01
Perforation454.561.730.49
Edge3422.6313.063.71
Bridge76.820.290.08
Loop14.110.050.02
Branch259.960.990.28
Table 6. Statistics of ecological connectivity.
Serial NumberSource Numberdpc *Serial NumberSource Numberdpc *
11072.089841372.723802
21319.4279214211.590649
3611.4090915281.554688
497.51481416421.211476
5235.42343417201.211075
6324.7826718401.125012
744.76985619410.978304
8224.64190920340.685949
954.44231621260.510728
10433.7169522230.509328
11243.61224923190.501599
12113.018604
* Only patches of ecological with dpc greater than 0.5 are shown in the table.
Disclaimer/Publisher’s Note: The statements, opinions and data contained in all publications are solely those of the individual author(s) and contributor(s) and not of MDPI and/or the editor(s). MDPI and/or the editor(s) disclaim responsibility for any injury to people or property resulting from any ideas, methods, instructions or products referred to in the content.

