Article

Does Green Credit Policy Promote or Inhibit Firms’ Green Innovation in China? Moderating Effect of Environmental Information Disclosure

1
School of Economics and Management, Beijing Jiaotong University, Beijing 100044, China
2
School of Business Administration, Henan University of Economics and Law, Zhengzhou 450046, China
*
Author to whom correspondence should be addressed.
Sustainability 2023, 15(1), 462; https://doi.org/10.3390/su15010462
Submission received: 17 November 2022 / Revised: 20 December 2022 / Accepted: 22 December 2022 / Published: 27 December 2022
(This article belongs to the Section Sustainable Management)

Abstract

:
Green credit policy (GCP) serves as an important tool for environmental protection and economy development. However, conflicting evidence exists regarding its role in affecting firms’ green innovation. China’s GCP practice provides an opportunity to explore this issue in the context of developing economies. Taking the implementation of the “Green Credit Guidelines” in China in 2012 as an exogenous shock, this paper adopts the difference-in-differences (DIDs) method to separately explore GCP’s effect on green innovation of non-heavily polluting firms (non-HPFs) and heavily polluting firms (HPFs). Based on the microdata of Chinese firms from 2008 to 2020, this study finds that: (1) GCP promotes green innovation of non-HPFs, but inhibits green innovation of HPFs. (2) GCP’s promoting effect on green innovation of non-HPFs is more prominent in large-sized firms, regions with a higher financial development level, and regions with a higher pollution level. (3) GCP’s inhibiting effect on green innovation of HPFs is less prominent in regions with higher financial development level. (4) Environmental information disclosure (EID) strengthens GCP’s promoting effect on green innovation of non-HPFs. Overall, these findings help practitioners to better understand the impact of GCP on firms’ green innovation in developing countries.

1. Introduction

With rapid economic development giving rise to frequent environmental emergencies and severe pollution problems, the Chinese government has issued a series of policies to regulate firms’ behaviors [1]. The green credit policy (GCP) of China, which was initially designed in 2007 and formally enacted in 2012 by the Chinese central government, is an important policy instrument to alleviate firms’ polluting behaviors [2,3,4]. According to the Equator Principles proposed by the International Finance Corporation (IFC) in 2002, GCP refers to specific guidelines and rules designed for financial institutions to assess the environmental risks of projects or firms when lending [5]. Specifically, through providing more loans or preferential interest rates, GCP aims to put more funds from credit facilities (e.g., commercial banks) to environmentally friendly projects and their operating firms, eventually reducing industrial pollution [6].
Previous studies have found that, at the macro level, GCP encourages clean production, transforms the economic development paradigm, and creates a virtuous loop between finance and the environment [5,7]. At the micro level, scholars explore GCP’s influences on organizational activities, such as banks’ lending activities, firms’ investment, firms’ financing activities, firms’ polluting behaviors, and firms’ technological innovation [4]. For instance, Sun et al. explored the effect of GCP on firms’ pollution prevention behaviors [8]. Yao et al. studied the effect of GCP on firms’ financial behaviors and performance [9]. Xie et al. [10] analyzed both the direct and indirect effects of GCP on firms’ innovation. This study builds on the latter approach exploring the impact of GCP on firms’ green innovation activities.
Green innovation, belonging to both green activities and innovation activities, refers to “hardware or software innovation … in technologies … involved in energy-saving, pollution-prevention, waste recycling, green product designs, or corporate environmental management” [11] (p. 332). Green innovation enables firms to match technologies with green market opportunities and environmental protection requirements to advance their competitive advantages [12]. Given the importance of environmental protection and technological innovation for a firm’s survival, increasing studies explore GCP’s effects on green activities, innovation activities, or both at the firm level [13]. In general, there are two streams of literature conflicting with each other. One stream of literature, based on the neoclassical economic perspective, mainly focuses on challenges brought by GCP including a higher threshold of banks’ financing access and higher environmental compliance costs of firms [14]. Thus, this stream of literature emphasizes GCP’s inhibition effect on firms’ business activities such as green innovation. Alternatively, another stream of literature, based on Porter’s hypothesis, highlights that GCP and other environmental regulations may show an “innovation compensation effect”. That is, if environmental laws and regulations are well designed and implemented, they can significantly promote corporate innovation, which further offsets the rising costs of environmental protection [14,15]. Although both streams of research are insightful individually, they create a fundamental tension when taken together exemplified by the research question:
RQ1. Does GCP promote or inhibit firms’ green innovation?
Meanwhile, there has been increasing interest in the intersection between economic environmental policy instruments (e.g., GCP) and information-based environmental policy instruments (e.g., environmental information disclosure) [16]. The approach that focuses on the GCP-innovation linkage at the firm level can be extended by exploring the effect of environmental information disclosure (EID) [17]. In particular, EID may impact the potential benefits or costs of GCP, should it interact with GCP to affect firms’ green innovation activities. EID refers to a series of firm behaviors that disclose content such as environmental performance, environmental protection expenditure, and environmental protection income to the public through corporate annual reports, social responsibility reports, corporate websites, etc. [18,19,20]. As Luo et al. argue, firms with a high level of EID can help mitigate manager–owner conflicts and alleviate information asymmetry with stakeholders, hence turning better credit advantages into green innovation [20]. Thus, it is important to study how EID moderates the relationship between GCP and firms’ green innovation. Surprisingly, the existing literature provides little knowledge about this important issue.
Therefore, the second research question of this paper is:
RQ2. Can environmental information disclosure (EID) help enhance the positive or reduce the negative effect of GCP on firms’ green innovation?
By answering the proposed research questions, this study brings three main contributions to the relevant field of literature. First, we analyze GCP’s opposite effects on green innovation of non-heavily polluting firms (non-HPFs) and heavily polluting firms (HPFs). Thus, this study partially addresses the critical question of whether GCP promotes or inhibits firms’ green innovation [7,8,9,10]. Second, few studies examine EID’s moderating effect on the GCP–green innovation linkage, so little is known about how variations in EID affect GCP’s influence on firms’ green innovation [17]. We examine the moderating role of EID and the findings provide a deeper understanding of GCP. Third, we investigate the differences in GCP’s impact on green innovation of firms from the perspectives of firm heterogeneity and regional heterogeneity separately, which makes the research more comprehensive and is of great significance in helping governments to formulate detailed environmental regulation policies according to specific contexts.
Overall, the purpose of this study is to establish a framework to study whether GCP facilitates firms’ green innovation in developing economies such as China. The remaining part of this paper is organized as follows. Section 2 provides a theoretical background and literature review. Section 3 develops several hypotheses. Section 4 describes the research design. Section 5 presents the empirical results. Section 6 sets forth the conclusion, implications, and limitations.

2. Theoretical Background

2.1. Environmental Regulation and Firms’ Green Innovation

Firms’ green innovation refers to new or modified techniques, processes, and products which help firms better reduce pollution, control emissions, save energy, and ultimately achieve sustainable development [21]. Unlike highly symbolic and visible activities such as green ads, green innovation is characterized by high investments, high risks, and long cycles [22]. Meanwhile, compared with general innovation activities, green innovation involves both innovation issues and social issues, which lead to increased managerial complexity. In addition, green innovation has the characteristic of the “spillover effect”, which means green innovation achievements may be easily imitated by other entities and spread continuously [23]. Therefore, many firms lack the internal motivation to implement green innovation strategies and their green innovation activities are strongly driven by external institutional forces [21,22].
Institutional theory posits that firms’ behaviors are affected by political, economic, and social forces exerted by external institutes (e.g., governments, financial banks, suppliers, customers, etc.) [24]. Prior green innovation studies have identified a number of institutional forces, especially environmental regulation [21]. As an important policy instrument for governments’ social governance, environmental regulation restricts firms’ production and operation behaviors by imposing administrative penalties, emission standards, and emission taxes to reduce or even eliminate industrial pollution and facilitate sustainable economic development [25,26].
There are two main views (i.e., neoclassical economic perspective and Porter’s hypothesis) on whether environmental regulation can promote firms’ green innovation. According to the neoclassical economic perspective, environmental regulation significantly increases related firms’ environmental compliance costs, thereby preventing them from carrying out green innovation [6]. Chen et al. found that China’s carbon emission trading schemes have an evident lagging effect on restraining firms’ green innovation [12]. Tao et al. took China’s Target Responsibility System of Environmental Protection as a quasi-natural experiment and discovered that the policy leads to a decline in the quality of green innovation activities [27]. On the contrary, based on Porter’s hypothesis, other studies argue that more stringent but properly designed environmental regulation could trigger technological innovation and enhance firm competitiveness [15]. As Peng et al. showed, environmental regulation promotes green innovation behaviors through increasing green innovation intention [21]. Cui et al. found that the Cleaner Production Audit has a positive effect on both radical and incremental green innovation [1]. Lu et al. further argued that green finance reform and innovation can significantly enhance firms’ green technology innovation [28]. Therefore, it remains unclear whether environmental regulation facilitates or inhibits firms’ green innovation.

2.2. Green Credit Policy and Firms’ Activities

According to the Equator Principles proposed by the International Finance Corporation (IFC) in 2002, green credit policy (GCP) refers to specific guidelines and rules designed for financial institutions to assess the environmental risks of projects or firms when lending [5]. Customers of these financial institutions who do not comply with environment protection requirements will not be granted credit. GCP is thus a market-driven environmental policy instrument that promotes firms’ energy conservation, emission reduction, and other green activities through differential and dynamic credit policies of banking financial institutions [5,6,9,14,29]. Compared with many developed economies, China issued the “Green Credit Guidelines” recently in 2012.
Given the importance of GCP in China, increasing studies have explored GCP’s impact on firm activities, such as links to polluting behaviors, investment, financing activities, and innovation [4,8,9,10]. A review of the literature shows that the research themes into GCP’s impact at the firm level can be grouped into three types: (1) GCP’s impact on the economic activities of firms; (2) GCP’s impact on the environmental activities of firms; and (3) GCP’s impact on the innovation activities of firms. By reviewing related studies, we can find the following three gaps. First, the literature is unequivocal regarding the role of GCP in affecting firms’ activities in the context of developing countries. As Liu et al. pointed out, based on Porter’s hypothesis, prior studies have verified the positive effect of environmental regulation (e.g., GCP) on innovation, but whether this positive effect is valid in developing economies remains to be examined [7]. While some studies, in the context of developing economies, find that GCP has a positive effect on firm activities, others find insignificant or negative impacts [6,7,10,13,14,29,30,31,32,33,34,35]. Second, the previous literature has often explored GCP’s impact on green activities or innovation activities separately, however, rarely discusses GCP’s influence on green innovation. Third, the existing research on the effect of GCP on firm activities neglect environmental information disclosure [17].

2.3. The Moderating Role of Environmental Information Disclosure

Scholars increasingly recognize that, despite facing broadly similar environmental regulation forces (e.g., GCP), the variance in firms’ green innovation outputs persist. In other words, the relationship between environmental regulation and green innovation may be contingent on some contextual factors. While most related studies focus on external contextual factors [1,22,29,36], they neglect internal ones such as environmental information disclosure (EID). In accord with mounting interest in the interface between GCP and EID [17], we suggest that the analysis of the GCP–green innovation linkage can be extended by exploring EID’s moderating effect.
EID refers to a series of behaviors where market subjects (e.g., firms) disclose content such as environmental protection expenditure, environmental protection income, and environmental performance to the public through corporate annual reports, social responsibility reports, corporate websites, etc. [20]. According to agency theory, EID can effectively deal with the problem of information asymmetry to reduce the agency cost between various stakeholders and the focal firm [20]. Scholars who treat EID as a key firm characteristic have found that businesses with a high level of EID always perform better in green innovation [37]. As Luo et al. (2022) showed, EID significantly promotes firm innovation, especially exploratory innovation [20]. Zhang et al. found that the improvement of environmental information transparency has significantly increased the green innovation of firms, especially the number of green invention patent applications [38]. Ding et al. (2022) point out that EID increases the green patents of high-polluting firms [16].
In summary, previous studies have explored EID’s consequences at the firm level. However, there are few investigations on the moderating mechanism of EDI on the GCP–green innovation linkage. This research gap provides a good entry point for our study. The conceptual model is shown in Figure 1.

3. Hypotheses Development

3.1. Green Credit Policy and Green Innovation

We posit that green credit policy (GCP) has a positive effect on firms’ green innovation in non-heavily polluting industries. First, with the promulgation of GCP, non-HPFs have more funds to support green innovation. GCP compels credit-granting financial institutions to restrain HPFs’ loan applications while supply non-HPFs with a larger scale of debt financing [6,7,32]. With more funds, non-HPFs are more willing to innovate, take risks, and be more proactive than competitors toward emerging green opportunities. Second, GCP urges non-HPFs to invest more in green innovation projects through bringing a strong sense of crisis. Although GCP creates a relatively loose credit environment for non-HPFs in a short term, it poses more challenges for non-HPFs in the long term. Managers of non-HPFs easily realize that green credit standards are getting higher in the future and they will face a harsher credit environment [21,35,39]. The expectation of more intense credit competition makes non-HPFs’ managers attach greater importance to green value-added initiatives such as green technological innovation. Third, the implementation of GCP sends signals to the whole capital market that non-HPFs will be granted more credits [6]. As signaling theory posit, information is an important factor affecting the capital market. In this way, private investors may follow banks to invest in non-HPFs. Based on these arguments, this paper proposes the first hypothesis.
Hypothesis 1.
Green credit policy promotes green innovation in non-heavily polluting firms.
We predict that GCP has a negative effect on firms’ green innovation in heavily polluting industries. First, GCP may limit HPFs’ loan financing capacities and subsequently discourage their efforts in sustainable business activities such as green innovation [9]. Specifically, GCP stipulates that banks should increase loans lent to green projects but restrict loans lent to high pollution, high emission, and high energy consumption projects, thereby exerting high financing constraints on HPFs [9]. In this way, if HPFs want to secure financial support from banks under the supervision of GCP, they have to divert their limited green resources from those long-term oriented behaviors (e.g., green technological innovation) into short-term oriented ones (e.g., emission reduction, green ads, etc.) [5,35]. Second, the existence of GCP requires firms, especially HPFs, to invest more on daily environmental protection, thereby limiting their innovation capacities [21]. In other words, strict GCP significantly increases HPFs’ environmental protection costs which may further crowd out green innovation budget [21]. Third, after financial institutions comprehensively assess HPFs’ environmental risks according to GCP, they may send warning signals to external market subjects, especially related investment institutions. Under these circumstances, those institutions may reduce or even withdraw their investments. Without sufficient capital inflows, HPFs tend to behave cautiously and avoid taking high-risk actions such as green innovation [6,31]. Fourth, according to Porter’s hypothesis, HPFs have the motivation to invest more in green technological innovation when facing stricter environmental regulations [15]. Although GCP has both positive and negative impacts on HPFs’ green innovation, we believe the net effect will be negative. Therefore, this paper proposes the second hypothesis.
Hypothesis 2.
Green credit policy inhibits green innovation in heavily polluting firms.

3.2. The Moderating Effect of Environmental Information Disclosure

We predict that EID can enhance the positive effect of GCP on green innovation in non-HPFs. First, EID can reduce agency conflicts between firm owners and managers, and then help non-HPFs better exploit green credit opportunities in green innovation projects. As Luo et al. argued, EID reduces owner–manager agency conflicts and increases managers’ intentions in investing high-risk activities, especially green innovation projects [20]. By contrast, in firms with serious owner–manager conflicts, managers may seek short-term interests and object to many uncertain projects such as green innovation [40]. Second, by alleviating information asymmetry between firms and their stakeholders (e.g., customers, governments, investors, etc.), EID could help non-HPFs augment GCP’s information value for green innovation. Although GCP can partly convey non-HPFs’ environmental information to their external stakeholders, it is insufficient for investors to make sound investment decisions. As EID enables private investors to learn more detailed information about the focal firm, it markedly improves non-HPFs’ information transparency as well as legitimate status [41]. In this situation, non-HPFs are more likely to get funds from external investors (e.g., banks, private investors, etc.), contributing to higher levels of green innovation. Third, as a specific type of voluntary environmental regulation, EID can reflect one firm’s tendency to green initiatives. In this way, firms with a high level of EID are more motivated to capture the first-mover advantage in the future market [35]. Based on these arguments, we hypothesize:
Hypothesis 3.
Environmental information disclosure strengthens the promoting effect of GCP on green innovation in non-heavily polluting firms.
We suggest that EID weakens the inhibiting effect of GCP on green innovation in HPFs. First, EID could help HPFs decrease the difficulty of obtaining debt capital. According to institutional theory, legitimacy is critical to a firm’s survival because it ensures support and also continuous capital inflow from external stakeholders such as creditors [42]. Firms obtain legitimacy by signaling their conformity to various stakeholders’ expectations [42]. After the implementation of GCP, environmentally inferior firms, especially HPFs, are exposed to greater institutional pressures, including compliance pressure, public opinion pressure, and moral condemnation [43,44]. In this situation, by disclosing key green information to investors and meeting their environmental protection demands, EID helps to prove HPFs’ legitimacy, which decreases the level of credit financing difficulty and as such enhances green innovation [43]. Second, by providing incentives to shift toward green processes, EID augments the motivation value of GCP for HPFs’ green innovation. According to Porter’s hypothesis, HPFs are actually motivated to conduct green innovation after the promulgation of GCP [15]. However, the motivation level is low considering strict financing regulations that HPFs face. Under these circumstances, HPFs’ EID behaviors stimulate the public’s concerns about their green behaviors [38]. To better cater to these concerns, HPFs are inclined to adopt more green initiatives such as green innovation. Therefore, we hypothesize:
Hypothesis 4.
Environmental information disclosure weakens the inhibiting effect of GCP on green innovation in heavily polluting firms.

4. Data and Methodology

4.1. Data

This paper uses the implementation of the “Green Credit Guidelines” in China as a quasi-natural experiment. Since the guidelines were promulgated in February 2012, this paper selects all Chinese A-share listed firms from 2008 to 2020 as the original sample, excluding ST firms, *ST firms, PT firms, financial firms, firms with missing data, and firms whose asset–liability ratio is greater than 1, and finally obtains 3698 listed firms and 26,766 observations. In particular, we use the interpolation method to fill in missing values for data, and winsorize continuous variables at 1% and 99% to exclude the outlier effect. This paper focuses on the empirical analyses of both non-HPFs and HPFs. According to the industry category of listed firms and their pollution intensity, firms in the sample are classified into non-heavily polluting firms (non-HPFs) and heavily polluting firms (HPFs). Non-HPFs affected by the green credit policy (i.e., GCP) are regarded as treatment group 1, all HPFs are regarded as treatment group 2, and non-HPFs not affected by GCP are regarded as the control group.
According to the industry classification guidelines in China, the industry codes referring to firms in heavily polluting industries are B01, B03, B05, B07, C01, C03, C05, C11, C14, C31, C35, C41, C43, C61, C65, C67, C81, D01, H01, and H03 [14]. In this way, HPFs in our study are from industries including steel, electrolytic aluminum, thermal power, cement, coal, metallurgy, petrochemicals, chemicals, paper making, building materials, pharmaceuticals, fermentation, brewing, leather, textiles, and mining [45]. We have 3698 firms in the research sample. Finally, treatment group 1 includes 14,605 non-HPF observations which are not affected by GCP; treatment group 2 includes 7814 HPF observations, and the control group includes 4347 non-HPF observations which are affected by GCP. The data of listed firms come from the China Stock Market and Accounting Research Database (CSMAR) and Chinese Research Data Services (CNRDS).

4.2. Variables

4.2.1. Dependent Variable

Green innovation (GI) is the dependent variable in this study. Existing literature uses either R&D investment or the number of patents to measure firms’ innovation capacity. While green R&D investment emphasizes the pre-innovation stage and cannot accurately measure firms’ innovation output [7], green patents are introduced to reflect firms’ green innovation capacity and also green innovation performance. Furthermore, green patents can be subdivided into green invention patents and green utility patents [32]. Compared to green utility patents, green invention patents are a more convincing measure of innovation capacity because they represent substantial green technological innovation [32]. Therefore, we choose green invention patent grants as the indicator of firms’ green innovation. After obtaining the total number of green invention patents applied by firms in each year, we take the natural logarithm of the number of green invention patents plus one [22]. The higher the GI value is, the higher the green innovation level the firm has. Specifically, we use NHPFGI to denote non-HPFs’ green innovation, and HPFGI to represent HPFs’ green innovation.

4.2.2. Independent Variable

Model 1 is a multi-period DID model because the impact of GCP on non-HPFs is not at a single point in time, but begins when non-HPFs establish lending relationships with banks which implement GCP. Timei is the main test independent variable in Model 1. In this paper, each bank’s first disclosure of green credit balances in its annual report and related reports marks the basic completion of its green credit system structure. It is then considered as the time point when the bank formally begins to implement GCP. By comparing the year in which the firm establishes a lending relationship with one bank with the time when that bank implements its GCP, if the former is later than the latter, the year in which the lending relationship is established is taken as the policy impact point, and vice versa, the time when the bank implements its green credit policy is taken as the policy impact point. After determining the policy impact point for each firm, Postt is a year dummy variable that equals 1 if the observation year is after that point and 0 if the observation year is before that point.
Treati*Postt is the main test independent variable in Model 2, which is a general DID model. Since the Green Credit Guidelines were issued on 24 February 2012, Postt is a year dummy variable that equals 1 if the observation year is from 2012 to 2020 and 0 if the observation year is from 2008 to 2011. Moreover, if a listed firm belongs to the above 16 heavily polluting industries, we allocate it to the treatment group and Treati equals 1, and if a listed firm does not belong to the above 16 heavily polluting industries, we class it into the control group and Treati equals 0. The coefficient of Treati*Postt indicates that, after the implementation of GCP, compared to the control group, the green innovation in the treatment group has changed, which directly reflects the effect of GCP.

4.2.3. Control Variables

In terms of the selection of control variables, this paper selects firm growth (Growth), returns on asset (ROA), firm age (Age), asset–liability ratio (Lev), fixed assets (FixAss), cashflow (CaF), and institutional investors (Inst) as control variables. Δi denotes the individual fixed effect and μt denotes the time fixed effect (See Table 1 for definitions of variables).

4.2.4. Moderation Variable

Environmental information disclosure (EID) is the moderation variable. In line with many existing studies, we use content analysis to measure EID. With this method, we classify environmental information into seven sections, namely environmental management, environmental liabilities, environmental performance, environmental governance, information disclosure vehicles, and certification by independent agencies. Under each section, a number of sub-items are set up and scored according to the content of EID; the rules are 0 for no description, 1 for general qualitative description and 2 for quantitative description; a few sub-items are 0 for no disclosure and 1 for disclosure; and finally, the scores of each indicator are summed to obtain each sample firm’s EID score. To avoid the problem of right-skewed distribution, the score is taken as the logarithm of EID score.

4.3. Methodology

The difference-in-difference (DID) model is widely used in policy evaluation because it can suggest causality [45]. In this study, GCP meets the preconditions of the DID model as a purely exogenous event, because it does not occur for experimental purposes and will not be affected by a single firm. It can be regarded as a quasi-natural experiment. This paper constructs a quasi-natural experiment using the implementation of the “Green Credit Guidelines” in China in 2012 and uses the DID model to examine GCP’s effect on firms’ green innovation. In order to distinguish GCP’s different effects on different pollution types of firms, we divide firms into non-HPFs and HPFs according to their pollution levels.
To test H1, a multi-period DID model is set up in this paper, as GCP’s impacts on non-HPFs are not at the same point in time, but begin when establishing credit relationships with banks which implement GCP.
N H P F G I i , t = α 0 + β 0 P o s t t + γ 0 X i , t + δ i + μ t + ε i , t
N H P F G I i , t represents green innovation of the non-heavily polluting firm i in the year t. P o s t t is an event dummy variable, while the value is 1 in and after the policy impact point, otherwise it is 0. X i , t is a series of firm-level control variables. δ i is an individual fixed effect. μ t is a time-fixed effect. ε i , t is a random perturbation term. We are interested in β0, and if β0 is significantly positive, it indicates that the introduction of GCP has a positive effect on green innovation of non-HPFs, and vice versa.
To test H2, the paper sets the DID model as
H P F G I i , t = α 0 + β 0 T r e a t i × P o s t t + γ 0 X i , t + δ i + μ t + ε i , t
HPFGI i , t represents green innovation of the heavily polluting firm i in the year t. In Model 2, T r e a t i is a group dummy variable, while the value of HPFs is 1 and the value of non-HPFs not affected by GCP is 0. T r e a t i × P o s t t is the interaction item in the DID model. The other variables are defined as in Model 1. We are interested in β0, and if β0 is significantly negative, it indicates that the introduction of GCP has a negative effect on green innovation of HPFs, and vice versa.
To test H3 and H4, this paper sets the DID model as
NHPF G I i , t = α 0 + β 0 P o s t t × E I D i + β 1 E I D i + β 2 P o s t t + γ 0 X i , t + δ i + μ t + ε i , t
H P F G I i , t = α 0 + β 0 T r e a t i × P o s t t × E I D i + β 1 × T r e a t i + β 2 E I D i × T r e a t i + β 3 E I D i × P o s t t + γ 0 X i , t + δ i + μ t + ε i , t
EIDi represents environmental information disclosure of the firm i. T r e a t i × P o s t t × E I D i is the three-way interaction item. The other variables are defined as in Model 1. We are interested in β0, and if β0 is significantly positive, it indicates that environmental information disclosure is positively moderating GCP’s effect on green innovation, and vice versa.

5. Empirical Results

5.1. Descriptive Statistics

The descriptive statistics are divided into three categories, as shown in Table 2. The control group denotes non-HPFs not affected by GCP. Treatment group 1 denotes non-HPFs firms affected by GCP. Treatment group 2 denotes HPFs.

5.2. Baseline Regression Results

Table 3 shows GCP’s effect on firms’ green innovation, where column (1) is for non-HPFs and column (2) is for HPFs. To address endogeneity, we use clustered standard errors at the firm level to ensure that the regression above is reliable. For non-HPFs, the coefficient in column (1) is 0.0331, which is significant at the 5% level. This is consistent with H1, indicating that GCP stimulates non-HPFs’ green innovation. For HPFs, the coefficient in column (2) is −0.119, significant at the 5% level. This result means that GCP inhibits green innovation of HPFs, thereby validating H2.

5.3. Moderating Effects of Environmental Information Disclosure

To test H3 and H4, we further analyze the moderation effects, and their results are listed in Table 4. Column (1) is for non-HPFs and column (2) is for HPFs. The main focuses are the triple intersections of Treati, Postt, and the moderator, which imply the differences of Treati*Postt when the moderator changes. As the table shows, in column (1), the coefficient of Treati*Postt*EID is 0.066, which is significant at the 1% level. In column (2), the coefficient of Treati*Postt*EID is 0.019, which is not significant. These results indicate that any increase in EID will facilitate the impact of Treat*Post on GI in non-HPFs, but not affect the impact of Treat*Post on GI in HPFs. Therefore, H3 is proved but H4 is not proved.

5.4. Heterogeneity Analysis

In order to examine the heterogeneity of GCP’s effects on green innovation, this paper further examines the heterogeneity in terms of firm size, the level of regional financial development, and the level of regional pollution. The specific estimation results are shown in Table 5, where columns (1) to (3) are for non-HPFs and columns (4) to (6) are for HPFs.
(1) Heterogeneity of firm size
Schumpeter’s innovation theory suggests that firm size is closely related to innovation [12]. Firms of different sizes face varying levels of capabilities, costs, and risks, thereby creating distinct micro-environments for firm-level innovation activities. This paper takes the logarithm of the total assets of the firm to measure firm size. The Treati*Postt*Size is obtained by multiplying firm size with the policy dummy variable.
The coefficient of Treati*Postt*Size in column (1) is significantly positive at the 1% level, which indicates that the size can influence GCP’s promotion effect on green innovation of non-HPFs. That is to say, GCP’s promotion effect on green innovation is more obvious for large-sized non-HPFs, compared to small-sized non-HPFs. The coefficient of Treati*Postt*Size in column (4) is insignificantly positive, indicating that firm size plays a limited role in the GCP-HPFs’ green innovation linkage.
(2) Heterogeneity of regional financial development
The regional financing environment faced by firms may also have a significant impact on the GCP–green innovation linkage. In regions with well-developed financial markets, firms have abundant access to external capital. In addition to credit financing, firms have other capital options such as bond financing and equity financing. In contrast, in regions with less developed financial markets, firms usually face limited capital options and rely heavily on bank credit as a major source of financing [32]. As GCP influences firms’ green innovation by affecting their credit financing, regional financial development can provide or restrict local firms’ financing channels. Therefore, GCP’s impacts on green innovation may vary in regions with different levels of financial development.
We measure regional financial development by the ratio of the sum of banking loans to GDP [46]. The regression results in columns (2) and (5) show that the coefficients of Treati*Postt*Findev are both positive at the 10% level. This indicates that the level of regional financial development can positively moderate GCP’s effects on both non-HPFs’ and HPFs’ green innovation. To be specific, the higher the level of regional financial development, the more obvious GCP’s incentivizing effects on non-HPFs’ green innovation and the less significant GCP’s inhibitory effect on HPFs’ green innovation.
(3) Heterogeneity of regional pollution level
Pollution intensity varies greatly across regions in China. The more polluted a region (e.g., a city) is, the more its local government may emphasize high-pollution industries. This paper measures regional pollution by the haze pollution of the city where a firm’s headquarter locates. By referring to the study of Zhang et al. [47], the annual average concentration of fine particles with a diameter of 2.5 µm or less (PM2.5) is employed as the proxy indicator of haze pollution. The coefficient of Treati*Postt*Pollute in column (3) is significantly positive, which indicates that the regional pollution level can influence GCP’s promotion effect on green innovation of non-HPFs. That is, GCP’s promotion effect on green innovation is more obvious for non-HPFs located in high pollution regions. The coefficient of Treati*Postt*Pollute in column (6) is insignificantly positive, indicating that regional pollution intensity plays a limited role in the GCP-HPFs’ green innovation linkage.

5.5. Robustness Testing

To guarantee the robustness of the results, both the parallel trend test and placebo test are carried out.

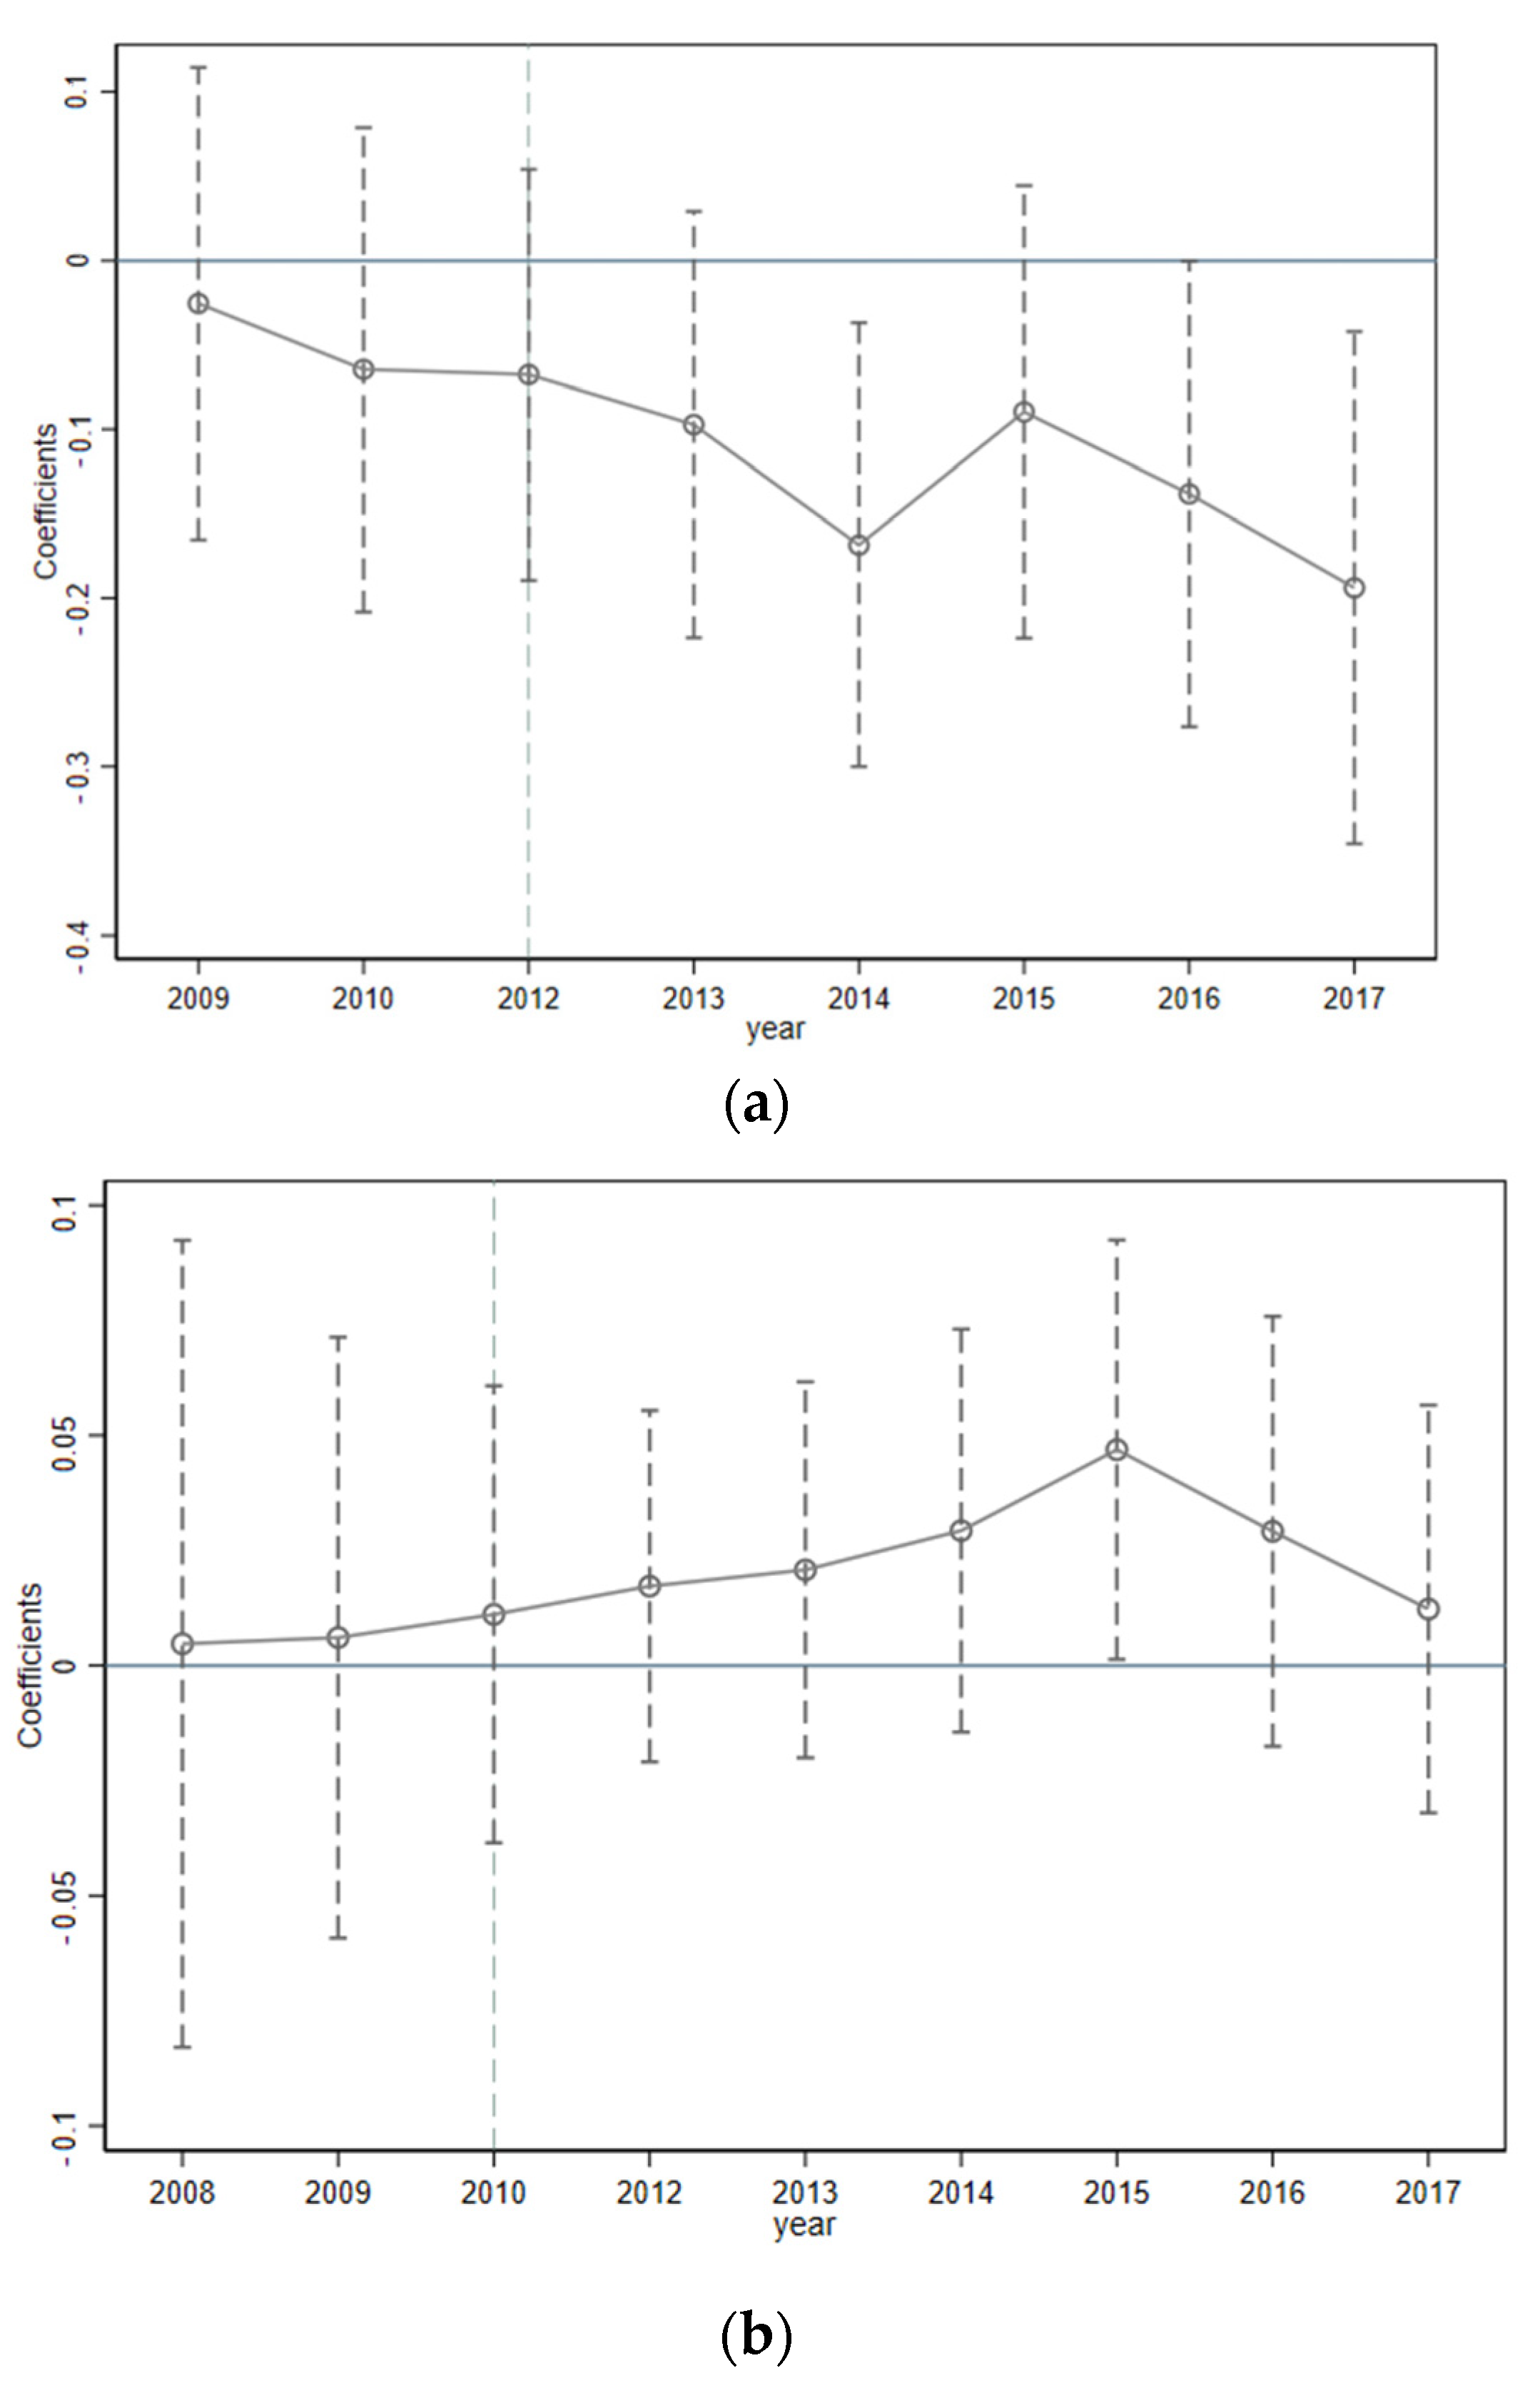
5.5.1. Parallel Trend Test
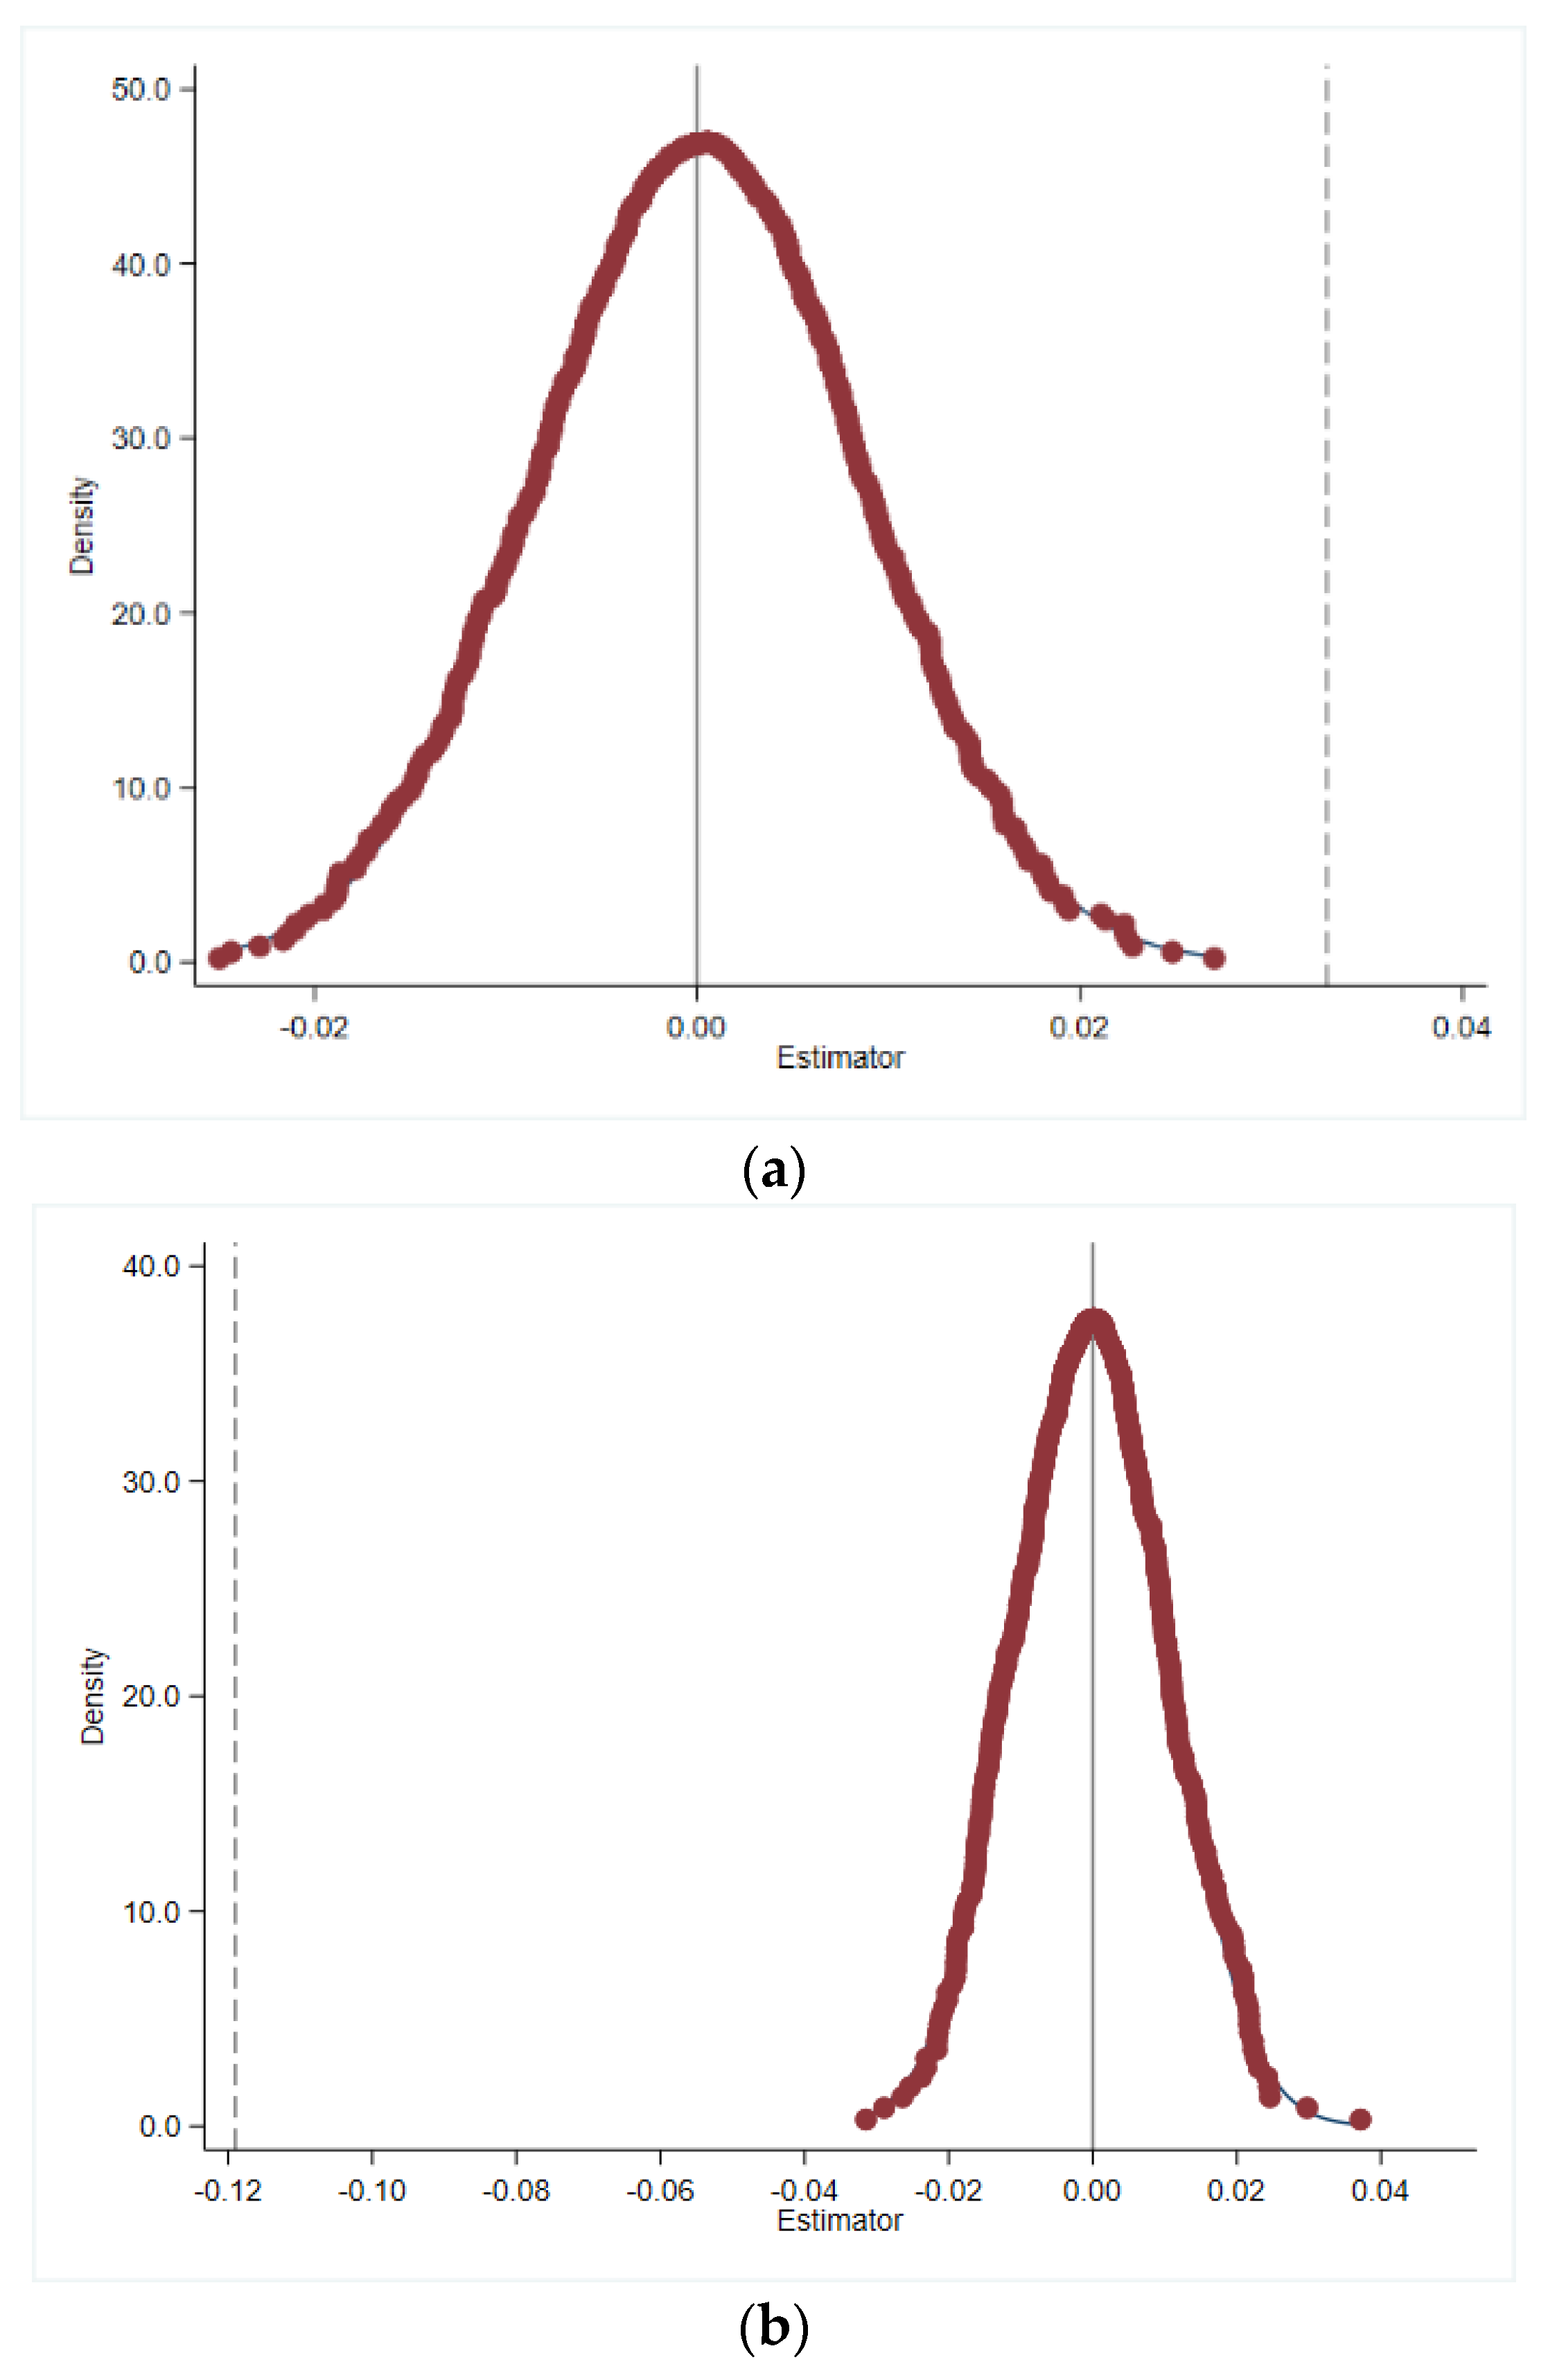
When using the DID method, the treatment and control groups need to pass the parallel trend test. That is, without the implementation of GCP, the development trend of treatment and control groups’ variables remain consistent. Hence, drawing on the study of Jcobsons et al. and adopting the event study method, this paper analyzes GCP’s dynamic impact on firms in the treatment group, thereby testing the parallel trend premise [13].
H P F G I i , t = α 0 + j = M N β t P o s t t + γ 0 X i , t + δ i + μ t + ε i , t
H P F G I i , t = α 0 + j = M N β t T r e a t i P o s t t + γ 0 X i , t + δ i + μ t + ε i , t
In the above equations, M and N denote the number of periods before and after GCP’s implementation year, respectively. In Equation (5), the coefficient of Postt ( β t ) measures the difference between the treatment and control groups in period t. In Equation (6), the coefficient of the interaction term between Treati and Postt ( β t ) measures the difference between the treatment and control groups in period t. Other variables are defined to remain consistent with Equation (1). Figure 2 represents the estimation results of the regression coefficients β t at 95% confidence intervals. It can be seen that β t is insignificant for a number of years prior to GCP’s promulgation, indicating that the treatment and control groups are not significantly different before GCP’s promulgation point and basically satisfy the parallel trend.

5.5.2. Placebo Test

As noted in the previous analysis, the DID presupposes that there is no large variation in firms’ green innovation prior to the policy event (i.e., GCP). The estimated coefficients on the core variables will be insignificant if the policy event is not set in 2012; otherwise, it is likely that there are other unobservable factors that may influence firms’ green innovation [48]. By referring to existing research [5], the placebo test in this study sets the hypothetical time of policy shock as random between 2008 and 2020 to examine whether a policy effect still exists. Figure 3a and Figure 3b report the probability density distribution of the estimated coefficients. The distribution centers around zero and our true baseline estimates from column (1) and (2) of Table 3 (0.0331 and −0.119) are outliers in the placebo test. The placebo test provides evidence that our estimation results are not seriously biased because of any omitted variables [16].

6. Conclusions, Implications, and Limitations

Based on the data of listed firms in China from 2008 to 2020, this study empirically investigates the effect of the Green Credit Guidelines (i.e., GCP) on firms’ green innovation by using the DID model and two classic robustness tests. The influence of heterogeneity and the moderating effect of environmental information disclosure (EID) on the relationship between GCP and firms’ green innovation are also analyzed. The study finds that: (1) GCP promotes green innovation of non-heavily polluting firms (non-HPFs). (2) GCP inhibits green innovation of heavily polluting firms (HPFs). (3) EID strengthens GCP’s promoting effect on green innovation of non-HPFs. (4) GCP’s promoting effect on green innovation of non-HPFs is more prominent in large-sized firms, regions with higher financial development levels, and regions with higher pollution levels. (5) GCP’s inhibiting effect on green innovation of HPFs is less prominent in regions with higher financial development levels.
These above conclusions have several practical implications. First, governments, banks, and firms should cooperate to improve GCP’s design and implementation. We find that GCP improves non-HPFs’ green innovation but imperils HPFs’ green innovation. Consequently, governments should not only continue to enforce GCP as an environmentally friendly regulation but also improve the design of GCP. For example, it could update some clauses of GCP and strengthen the supervision of banks’ lending to firms, especially HPFs. Banks should continue to play the guiding role of GCP for firms and enhance environmental and social risk management in the credit financing process [9,49]. Facing the introduction of GCP, non-HPFs should actively carry out green innovation to better leverage credit resources. HPFs should augment their awareness of environmental protection, accelerate transformation, and realize their own sustainable development through promoting green innovation.
Second, governments should eliminate the “one-size-fits-all” policy as soon as possible. The results of additional analysis indicate that GCP’s promoting effect on green innovation of non-HPFs is more prominent in large-sized firms, regions with higher financial development levels, and regions with higher pollution levels. Additionally, GCP’s inhibiting effect on green innovation of HPFs is less prominent in regions with higher financial development levels. Therefore, governments should consider the differences of all firms’ governance pressures and formulate specific control measures.
Finally, our research finds that EID plays a positive moderating role in the GCP–non-HPFs’ green innovation linkage. Therefore, when formulating and implementing policies, governments, financial institutions, and firms all need to give full consideration to the role of corporate environmental information disclosure, and guide firms, especially non-HPFs, to eliminate environmental information asymmetry through EID.
The research has some limitations which need to be improved in the future. First, we take the implementation of the “Green Credit Guidelines” in China in 2012 as an exogenous shock, and then only select Chinese A-share listed firms as the research objects. We believe the results are country-specific. For example, we find that GCP inhibits HPFs’ green innovation in China. Scholars could use samples in other developing countries to explore this issue. Second, this study only analyzes the heterogeneity of firm size, regional financial development, and regional pollution level. However, the effect of GCP on firms’ green innovation may also vary depending on the level of marketization, the industry, and firms’ internal control systems. Hence, subsequent studies can do more in-depth research.

Author Contributions

Conceptualization, Y.L. and H.D.; methodology, Y.L.; software, Y.L.; formal analysis, Y.L.; funding acquisition, B.S.; data curation, B.S.; writing—original draft preparation, Y.L. and H.D.; writing—review and editing, B.S.; supervision, H.D. All authors have read and agreed to the published version of the manuscript.

Funding

This research was supported by National Natural Science Foundation of China (Grant No. 71702047) and Henan Philosophy & Social Science Project (Grant No. 2022CJJ120).

Institutional Review Board Statement

Not applicable.

Informed Consent Statement

Not applicable.

Data Availability Statement

Not applicable.

Acknowledgments

We would like to thank the anonymous reviewers for their very helpful suggestions that substantially improved this paper.

Conflicts of Interest

The authors declare no conflict of interest.

References

  1. Cui, J.B.; Dai, J.; Wang, Z.X.; Zhao, X.D. Does environmental regulation induce green innovation? A panel study of Chinese listed firms. Technol. Forecast. Soc. Change 2022, 176, 121492. [Google Scholar] [CrossRef]
  2. The China Banking Regulatory Commission (CBRC). Suggestions on Implementation of Environmental Policies and Regulations and Guard Against Credit Risks. 2007. Available online: http://www.gov.cn/zwhd/2007-12/29/content_846830.htm (accessed on 12 December 2022).
  3. The China Banking Regulatory Commission (CBRC). Notice on Printing and Issuing Green Credit Guidelines. 2012. Available online: http://www.gov.cn/gzdt/2012-02/24/content_2076079.htm (accessed on 12 December 2022).
  4. Xing, C.; Zhang, Y.M.; Tripe, D. Green credit policy and corporate access to bank loans in China: The role of environmental disclosure and green innovation. Int. Rev. Financ. Anal. 2021, 77, 101838. [Google Scholar] [CrossRef]
  5. Zhang, A.X.; Deng, R.R.; Wu, Y.F. Does the green credit policy reduce the carbon emission intensity of heavily polluting industries? Evidence from China’s industrial sectors. J. Environ. Manag. 2022, 311, 114815. [Google Scholar] [CrossRef]
  6. Hu, G.Q.; Wang, X.Q.; Wang, Y. Can the green credit policy stimulate green innovation in heavily polluting enterprises? Evidence from a quasi-natural experiment in China? Energy Econ. 2021, 98, 105134. [Google Scholar] [CrossRef]
  7. Liu, S.; Xu, R.X.; Chen, X.Y. Does green credit affect the green innovation performance of high-polluting and energy-intensive enterprises? Evidence from a quasi-natural experiment. Environ. Sci. Pollut. Res. 2021, 28, 65265–65277. [Google Scholar] [CrossRef]
  8. Sun, J.X.; Wang, F.; Yin, H.T.; Zhang, B. Money talks: The environmental impact of China’s green credit policy. J. Policy Anal. Manag. 2019, 38, 653–680. [Google Scholar] [CrossRef]
  9. Yao, S.Y.; Pan, Y.Y.; Sensoy, A.; Uddin, G.S.; Cheng, F.Y. Green credit policy and firm performance: What we learn from China? Energy Econ. 2021, 101, 105415. [Google Scholar] [CrossRef]
  10. Xie, Q.X.; Zhang, Y.; Chen, L. Does green credit policy promote innovation: A case of China. Manage. Decis. Econ. 2022, 43, 2704–2714. [Google Scholar] [CrossRef]
  11. Chen, Y.S.; Lai, S.B.; Wen, C.T. The influence of green innovation on corporate advantage in Taiwan. J. Bus. Ethics. 2006, 67, 331–339. [Google Scholar] [CrossRef]
  12. Chen, Z.F.; Zhang, X.; Chen, F.L. Do carbon emission trading schemes stimulate green innovation in enterprises? Evidence from China? Technol. Forecast. Soc. Change 2021, 168, 120744. [Google Scholar] [CrossRef]
  13. Chen, Z.G.; Zhang, Y.Q.; Wang, H.S.; Xiao, O.Y.; Xie, Y.X. Can green credit policy promote low-carbon technology innovation? J. Clean. Prod. 2022, 359, 132061. [Google Scholar] [CrossRef]
  14. Cui, X.; Wang, P.P.; Sensoy, A.; Nguyen, D.K.; Pan, Y.Y. Green credit policy and corporate productivity: Evidence from a quasi-natural experiment in China. Technol. Forecast. Soc. Change 2022, 177, 121516. [Google Scholar] [CrossRef]
  15. Porter, M.E.; Van Der Linde, C. Toward a new conception of the environment-competitiveness relationship. J. Econ. Perspect. 1995, 9, 97–118. [Google Scholar] [CrossRef] [Green Version]
  16. Ding, J.X.; Lu, Z.; Yu, C. Environmental information disclosure and firms’ green innovation: Evidence from China. Int. Rev. Econ. Financ. 2022, 81, 147–159. [Google Scholar] [CrossRef]
  17. Wang, F.; Yang, S.Y.; Reisner, A.; Liu, N. Does green credit policy work in China? The correlation between green credit and corporate environmental information disclosure quality. Sustainability 2019, 11, 733. [Google Scholar] [CrossRef] [Green Version]
  18. Kreuze, J.G.; Newell, G.E. A strategy for improving the quality of entry-level management accountants. J. Edu. Bus. 1996, 71, 334–338. [Google Scholar] [CrossRef]
  19. Geng, J.X.; Jiao, R.J. On environmental accounting information disclosure of listed companies. Account. Res. 2002, 1, 43–47. [Google Scholar]
  20. Luo, Y.D.; Xiong, G.B.; Mardani, A. Environmental information disclosure and corporate innovation: The “Inverted U-shaped” regulating effect of media attention. J. Bus. Res. 2022, 146, 453–463. [Google Scholar] [CrossRef]
  21. Peng, H.; Shen, N.; Ying, H.Q.; Wang, Q.W. Can environmental regulation directly promote green innovation behavior? Based on situation of industrial agglomeration. J. Clean. Prod. 2021, 314, 128044. [Google Scholar] [CrossRef]
  22. Chen, Z.; Jin, J.; Li, M. Does media coverage influence firm green innovation? The moderating role of regional environment. Technol. Soc. 2022, 70, 102006. [Google Scholar] [CrossRef]
  23. Shang, H.; Jiang, L.; Pan, X.Y.; Pan, X.F. Green technology innovation spillover effect and urban eco-efficiency convergence: Evidence from Chinese cities. Energy Econ. 2022, 114, 106307. [Google Scholar] [CrossRef]
  24. Scott, W.R. Institutions and Organizations, 2nd ed.; Sage: Thousand Oaks, CA, USA, 2001. [Google Scholar]
  25. Zhang, H. The green paradox puzzle: Interpretation from the perspective of local government competition. J. Financ. Econ. 2014, 40, 114–127. [Google Scholar]
  26. Yang, Q.Y.; Gao, D.; Song, D.Y.; Li, Y. Environmental regulation, pollution reduction and green innovation: The case of the Chinese Water Ecological Civilization City Pilot Policy. Econ. Sys. 2021, 45, 100911. [Google Scholar] [CrossRef]
  27. Tao, F.; Zhao, J.; Zhou, H. Does environmental regulation improve the quantity and quality of green innovation: Evidencefrom the target responsibility system of environmental protection. China Ind. Econ. 2021, 2, 136–154. [Google Scholar]
  28. Lu, N.; Wu, J.; Liu, Z. How does green finance reform affect enterprise green technology innovation? Evidence from China. Sustainability 2022, 14, 9865. [Google Scholar] [CrossRef]
  29. Zhang, D.Y.; Kong, Q.X. Credit policy, uncertainty, and firm R&D investment: A quasi-natural experiment based on the Green Credit Guidelines. Pac.-Basin Financ. J. 2022, 73, 101751. [Google Scholar]
  30. Liu, X.H.; Wang, E.X.; Cai, D.T. Green credit policy, property rights and debt financing: Quasi-natural experimental evidence from China. Financ. Res. Lett. 2019, 29, 129–135. [Google Scholar] [CrossRef]
  31. Zhang, S.L.; Wu, Z.H.; Wang, Y.; Hao, Y. Fostering green development with green finance: An empirical study on the environmental effect of green credit policy in China. J. Environ. Manag. 2021, 296, 113–159. [Google Scholar] [CrossRef]
  32. Liu, Q.; Dong, B. How does China’s green credit policy affect the green innovation of heavily polluting enterprises? The perspective of substantive and strategic innovations. Environ. Sci. Pollut. Res. 2022, 29, 77113–77130. [Google Scholar] [CrossRef]
  33. Li, S.; Zhang, W.; Zhao, J. Does green credit policy promote the green innovation efficiency of heavy polluting industries? Empirical evidence from China’s industries. Environ. Sci. Pollut. Res. 2022, 29, 46721–46736. [Google Scholar] [CrossRef]
  34. Zhang, Y.; Li, X.L.; Xing, C. How does China’s green credit policy affect the green innovation of high polluting enterprises? The perspective of radical and incremental innovations. J. Clean. Prod. 2022, 336, 130387. [Google Scholar] [CrossRef]
  35. Feng, Y.C.; Liang, Z. How does green credit policy affect total factor productivity of the manufacturing firms in China? The mediating role of debt financing and the moderating role of environmental regulation. Environ. Sci. Pollut. Res. 2022, 29, 31235–31251. [Google Scholar] [CrossRef]
  36. Wang, H.T.; Qi, S.Z.; Zhou, C.B.; Zhou, J.J.; Huang, X.Y. Green credit policy, government behavior and green innovation quality of enterprises. J. Clean. Prod. 2022, 331, 129834. [Google Scholar] [CrossRef]
  37. Li, Q.; Ruan, W.; Shi, H.; Xiang, E.; Zhang, F. Corporate environmental information disclosure and bank financing: Moderating effect of formal and informal institutions. Bus. Strat. Environ. 2022. Early view. [Google Scholar] [CrossRef]
  38. Zhang, S.H.; Zhang, M.; Qiao, Y.B.; Li, X.; Li, S. Does improvement of environmental information transparency boost firms’ green innovation? Evidence from the air quality monitoring and disclosure program in China. J. Clean. Prod. 2022, 357, 131921. [Google Scholar] [CrossRef]
  39. Zhou, Q.; Song, Y.; Wan, N.; Zhang, X. Non-linear effects of environmental regulation and innovation-spatial interaction evidence from the Yangtze River Delta in China. Environ. Sci. Pol. 2020, 114, 263–274. [Google Scholar] [CrossRef]
  40. Acharya, V.; Xu, Z. Financial dependence and innovation: The case of public versus private firms. J. Financ. Econ. 2017, 124, 223–243. [Google Scholar] [CrossRef] [Green Version]
  41. Feng, Y.C.; Wang, X.H.; Liang, Z. How does environmental information disclosure affect economic development and haze pollution in Chinese cities? The mediating role of green technology innovation. Sci. Total Environ. 2021, 775, 145811. [Google Scholar] [CrossRef]
  42. Suchman, M.C. Managing legitimacy: Strategic and institutional approaches. Acad. Manag. Rev. 1995, 20, 571–610. [Google Scholar] [CrossRef]
  43. Meng, X.H.; Zeng, S.X.; Xie, X.M.; Zou, H.L. Beyond symbolic and substantive: Strategic disclosure of corporate environmental information in China. Bus. Strat. Env. 2019, 28, 403–417. [Google Scholar] [CrossRef]
  44. Li, W.A.; Cui, G.Y.; Zheng, M.N. Does green credit policy affect corporate debt financing? Evidence from China. Environ. Sci. Pollut. Res. 2022, 29, 5162–5171. [Google Scholar] [CrossRef] [PubMed]
  45. Chai, S.L.; Zhang, K.; Wei, W.; Ma, W.Y.; Abedin, M.Z. The impact of green credit policy on enterprises’ financing behavior: Evidence from Chinese heavily-polluting listed companies. J. Clean. Prod. 2022, 363, 132458. [Google Scholar] [CrossRef]
  46. Jiang, P.C.; Jiang, H.L.; Wu, J.H. Is inhibition of financialization the sub-effect of the green credit policy? Evidence from China. Financ. Res. Lett. 2022, 47, 102737. [Google Scholar] [CrossRef]
  47. Zhang, S.L.; Hao, Y.; Zhang, Y.P. Does public opinion affect air quality? Evidence based on the monthly data of 109 prefecture-level cities in China. Energy Policy 2018, 116, 299–311. [Google Scholar] [CrossRef]
  48. Sun, J.M.; Xue, J.A.; Qiu, X.D. Has the sustainable energy transition in China’s resource-based cities promoted green technology innovation in firms? Soc. -Econ. Plan. Sci. 2022. Early view. [Google Scholar] [CrossRef]
  49. Zhang, Y.; Xie, H.B.; Li, J. Does green credit policy mitigate financialization? Evidence from Chinese heavily polluting enterprises. Environ. Sci. Pollut. Res. 2022. [Google Scholar] [CrossRef] [PubMed]
Figure 1. Conceptual framework.
Sustainability 15 00462 g001
Figure 2. (a) Parallel trend test of non-HPFs. (b) Parallel trend test of HPFs. Note: All regressions control for firm fixed effects, time fixed effects, and industry fixed effects, and use firm-level clustering robust standard errors.
Sustainability 15 00462 g002
Figure 3. (a) Placebo test of non-HPFs. (b) Placebo test of HPFs. Note: The horizontal axis shows the estimated coefficients of Postt or Treati*Postt from the 1000 randomly assigned policy shock times. The curve is the kernel density distribution of the estimates, with the associated p-values shown as the dots. The two vertical lines in Figure 3a and Figure 3b. represent the true baseline estimates from column (1) and (2) of Table 3, respectively.
Sustainability 15 00462 g003
Table 1. Definitions and measures of major variables.
Variable NameVariable SymbolDefinition
Green innovation of non-HPFsNHPFGIGreen invention patent grants of non-heavily polluting firms
Green innovation of HPFsHPFGIGreen invention patent grants of heavily polluting firms
Treatment group 1TreatThe value of non-HPFs affected by GCP is 1, and the value of non-HPFs not affected by GCP is 0
Treatment group 2TreatThe value of HPFs is 1, and the value of non-HPFs not affected by GCP is 0
Treatment periodPostFor HPFs, the value of the sample is 1 in and after 2012, otherwise it is 0; for non-HPFs, the value of the sample is 1 in and after the policy impact point, otherwise it is 0.
Environmental information disclosureEIDWith content analysis method, environmental information is first classified, then each category is assigned a value according to its content, and finally, the score for each firm is calculated
Firm growthGrowthThe growth rate of business revenue
Returns on assetROAReturn on assets equal to earnings before interest, tax and abnormal items at fiscal year-end divided by average total assets
Firm ageAgeThe number of years from the issue period to the current period, taking the logarithm, ln(current year − year of incorporation + 1)
Asset–liability ratioLevTotal debt divided by total assets at fiscal year-end
Fixed assetsFixAssFixed assets divided by total assets at fiscal year-end
CashflowCaFNet cash flow from operating activities divided by total assets
Institutional investorsInstThe percentage of shares owned by institutional investors in the enterprise
Individual fixed effectδiControl of individual firm
Time fixed effectμtControl of year
Table 2. Descriptive Statistical Results.
Control GroupTreatment Group 1Treatment Group 2
VariableMeanSDMeanSDMeanSD
GI0.6001.0200.5700.9500.4200.780
EID1.6800.7501.5500.6802.0900.810
ROA0.06000.06000.04000.06000.05000.0600
CaF0.05000.07000.04000.07000.06000.0700
FixAss0.1800.1500.1700.1400.3000.170
Lev0.3800.2100.4400.2100.4200.210
INST0.3700.2600.3700.2300.3900.240
Age2.8200.3502.8200.3702.8300.340
Growth0.4701.3600.5501.4000.2100.830
Table 3. Baseline Regression Results.
(1)(2)
NHPFGIHPFGI
Treati*Postt −0.119 ** (−2.33)
Postt0.0331 ** (2.17)
Age0.405 *** (3.00)0.289 (1.70)
ROA0.261 ** (2.10)0.405 * (2.39)
Cashflow−0.207 ** (−2.55)−0.0195 (−0.20)
Lev0.253 *** (3.48)0.289 *** (3.43)
Inst−0.0219 (−0.53)0.0341 (0.65)
Growth−0.00272 (−0.69)−0.00454 (−0.56)
FixAss0.0157 (0.17)0.0633 (0.69)
Constant−0.685 * (−1.80)−0.433 (−0.91)
Year-fixedYESYES
Firm-fixedYESYES
N18,16811,576
Adjusted R20.6680.645
Note: *, ** and *** indicate that the estimated coefficients are significant at the levels of 10%, 5%, and 1%, respectively. T-values in parenthesis are provided.
Table 4. Moderating effects of EID.
(1)(2)
NHPFGIHPFGI
Treati*Postt*EID 0.019 (0.47)
Treati* EID −0.108 *** (−4.07)
Postt*EID0.055 *** (2.80)0.100 *** (3.38)
Treati*Postt −0.122 * (−1.66)
Age0.397 *** (2.95)0.318 * (1.89)
ROA0.252 ** (2.04)0.421 ** (2.50)
Cashflow−0.214 *** (−2.65)−0.012 (−0.12)
Lev0.254 *** (3.51)0.286 *** (3.41)
Inst−0.022 (−0.54)0.034 (0.65)
Growth−0.003 (−0.69)−0.005 (−0.65)
FixAss0.009 (0.09)0.050 (0.54)
Constant−0.687 * (−1.82)−0.558 (−1.20)
Year-fixedYESYES
Firm-fixedYESYES
N18,16811,576
Adjusted R20.6700.650
Note: *, ** and *** indicate that the estimated coefficients are significant at the levels of 10%, 5%, and 1%, respectively. T-values in parenthesis are provided.
Table 5. Heterogeneity test.
(1)(2)(3)(4)(5)(6)
NHPFGINHPFGINHPFGIHPFGIHPFGIHPFGI
Postt*Size0.137 ***
(5.05)
Postt*Findev 0.040 **
(1.15)
Postt*Pollute 0.076 ***
(2.96)
Treati*Postt*Size 0.106
(1.57)
Treati*Postt*Findev 0.134 *
(1.75)
Treati*Postt*Pollute 0.072
(1.14)
Constant−0.651 *
(−1.72)
−0.678 *
(−1.79)
−0.679 *
(−1.79)
−0.525
(−1.12)
−0.450
(−0.95)
−0.411
(−0.87)
Control VariablesYESYESYESYESYESYES
Year-fixedYESYESYESYESYESYES
Firm-fixedYESYESYESYESYESYES
N18,16818,16818,16811,57611,57611,576
Adjusted R20.6700.6680.6680.6470.6450.645
Note: *, ** and *** indicate that the estimated coefficients are significant at the levels of 10%, 5%, and 1%, respectively. T-values in parenthesis are provided.
Disclaimer/Publisher’s Note: The statements, opinions and data contained in all publications are solely those of the individual author(s) and contributor(s) and not of MDPI and/or the editor(s). MDPI and/or the editor(s) disclaim responsibility for any injury to people or property resulting from any ideas, methods, instructions or products referred to in the content.

