Abstract
The coupled and coordinated development of urban resilience and new urbanization is an important guarantee for the realization of urban security and sustainable development. This paper first constructs an evaluation index of urban resilience and new urbanization and uses the entropy method to clarify the weights. Second, the coupling coordination degree model is used to measure the spatiotemporal differentiation characteristics of the coupling coordinated development of urban resilience and new urbanization in the Yangtze River Economic Belt from 2005 to 2019. The key influencing factors of the coupling coordination are analyzed using geodetectors. The results show the following. (1) The urban resilience of the Yangtze River Economic Belt has continued to improve, showing a stepwise distribution pattern of “high in the east and low in the west” in space. The overall development of new urbanization is at a medium–high level, with high levels concentrated in the eastern coastal cities. (2) The degree of spatial coupling and coordination between urban resilience and new urbanization is increasing year by year, and there is significant spatial heterogeneity, showing the pattern of “high in the east and low in the west, high in the center and low in the surrounding areas”, and the type of lag is mostly urban resilience lag in new urbanization. (3) Endogenous power, external power, government power and market power interact to jointly promote the development of coupling coordination. The comprehensive effect of government power and other driving forces is the key mechanism for improving spatial coupling coordination.
1. Introduction
Urbanization has become one of the important development trends in today’s world [1]. According to data released by the United Nations, the worldwide urbanization rate is projected to increase to 68% by 2050. As global urbanization accelerates and economic activities become highly concentrated, cities are exposed to many greater pressures and risks, such as resource shortages, employment difficulties, and traffic congestion [2], and threatened by many natural disasters and public dangers, such as landslides, earthquakes, floods, and sudden public emergencies [3,4]. As a result, the sustainable development of cities is no longer as stable as before. As one of the important frontier theories in terms of public safety, resilience has provided a systematic framework for effectively countering risks endangering city safety and improving the capability of cities to resist disasters; thus, it has been gradually applied to city governance, and building resilient cities has become the common consensus of international society to achieve sustainable targets [5]. Therefore, there is an urgent need to deeply understand the relationship between urbanization and the construction of resilient cities and formulate countermeasures for the safe development of cities. International scholars have attempted to improve the practicability of urban resilience in different urban planning scenarios by establishing an integrated concept of urban resilience, reconstructing the urban resilience system of knowledge and using urban planning as an effective tool to influence and enhance the resilience of urban systems [6,7], while constructing and adapting planning and assessment frameworks to positively influence the urbanization process [8,9].
The urbanization of China enjoys the largest scale and fastest speed, with the urbanization rate of permanent residents rising from 10.64% at the end of 1949 to 64.72% at the end of 2021. In past decades, China has followed a traditional path of urbanization, or in other words, an extensive mode of “incomplete” and “low-quality” urbanization. Therefore, it shows the typical “four highs and five lows” characteristic, where the “four highs” are reflected in terms of consumption, investment, emissions and expansion, while the “five lows” are seen in quality, level, coordination degree, inclusiveness and sustainability [10]. To effectively reduce the risks to urban development caused by traditional urbanization, China has been devoted to actively exploring a new urbanization model that is people-oriented and resource-intensive and that integrates urban and rural development. In the rapid development of new urbanization, the population is expanding and resource demand is increasing, which means that cities are still faced with many uncertain impacts and disturbances. As an innovative idea to solve risks and crises, a high level of urban resilience can provide a healthy and sound development environment for cities and promote the development of new urbanization, while it is difficult for a low level of urban resilience to prevent and resist the occurrence of urban risks. At the same time, there is a close bidirectional relationship between new urbanization and urban resilience. More specifically, high-level urbanization will promote high-quality urban development, comprehensively improve the capacity for disaster prevention and mitigation, and enhance urban resilience. In a nutshell, the sustainable development of cities is the unified goal of realizing new urbanization and improving urban resilience, and the coordinated development of urban resilience and new urbanization is an effective way to achieve sustainable urban development (Figure 1). Therefore, it is of great practical significance to scientifically evaluate the spatial coupling coordination of urban resilience and new urbanization and analyze the key influencing factors for guaranteeing the sound, safe, and sustainable development of cities.
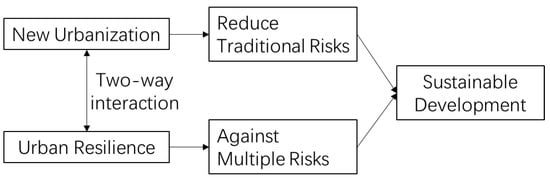
Figure 1.
Two-way relationship between new urbanization and urban resilience.
We propose the following. (1) The growth trend of urbanization will continue worldwide, especially in developing countries. Traditional urbanization puts more emphasis on the urbanization of land and pursues one-sided and excessive development; therefore, China proposes a new type of “people-oriented” urbanization to cope with many problems of traditional urbanization. (2) The expanding population and increasing resource demand will make cities increasingly vulnerable to diversified risks, and a high level of urban resilience can create a healthy and safe development environment for cities. (3) New urbanization can promote urban resilience and vice versa, and their coordinated development is of great significance to achieve the common goal of sustainable urban development. As an important engine for China’s regional economic development, the Yangtze River Economic Belt (YREB) is the main region where the new urbanization strategy is promoted, as well as a region prone to various disasters and risks; thus, it is of important research value and representative significance to make the YREB the research object. Based on this, this paper takes 110 prefecture-level cities in the YREB as the research object, constructs an evaluation index of urban resilience and new urbanization, and studies the spatiotemporal differences in four time periods, namely, 2005, 2010, 2015 and 2019. Moreover, the geographic detector model is used to explore the driving factors affecting the coupling and coordination of the two, and suggestions are put forward based on regional development differences to support the building of safe and resilient sustainable cities.
2. Literature Review
2.1. Connotation and Evaluation System of New Urbanization
The concept of urbanization was first proposed by Spanish engineer Serda, and it is considered an irreversible trend. Urbanization is a complex process in which population change, economic structure, social governance and living environment interact with each other, relying on the coordinated role of many factors. For example, Maparu et al. studied urbanization in India and found that transportation infrastructure, economic geographical location and economic development level all have an impact on urbanization [11]. Islam et al. studied the influencing factors of urbanization in Bangladesh and found that energy consumption, economic development, investment, and other factors have significantly promoted the urbanization process [12]. Reasonable urbanization can effectively promote social equity and achieve sustainable urban development. Scholars pay more attention to the study of urbanization from two perspectives. The first one focuses on the optimal development of urbanization itself. Scholars focus on the development mode [13,14] and influencing factors [15,16] of urbanization and put forward relevant strategies to improve the development level of urbanization. The second one is the multidisciplinary cross-sectional research oriented to urbanization. Scholars mostly combine urbanization development with the ecological environment [17,18,19], land use [20,21,22], industrialization [23,24], etc. to analyze the relationship and the mechanism of action between them. The research areas often cover multiple disciplines including geography, architecture, environmental science and economics, thus enabling a more systematic study of urbanization development.
Through these studies, we can find that with the acceleration of urbanization, a series of land use, food security, climate defense, environmental pollution and other issues have emerged [25,26,27,28,29]. When the urban economy moves from a stage of high-speed development to a stage of high-quality development, it is difficult for traditional urbanization to adapt to the new development requirements; thus, the urban development mode requires urgent transformation. To make up for the shortcomings of traditional urbanization strategies, many countries have proposed new urbanization development strategies, such as sustainable cities [30,31], low-carbon cities [32] and circular cities [33]. Sustainable cities emphasize the development of cities in an environmentally friendly and resource-efficient manner [34,35]; “low-carbon city” refers to the transformation of economic development from extensive to low energy consumption [36]; and circular cities rethink the possibility to produce and use goods and services, exploring new ways to ensure long-term prosperity [33]. Although scholars have different definitions of the new type of urbanization, their goal is to achieve high-quality urbanization. China has entered a new stage of people-centered urbanization. Unlike previous urbanization, new urbanization is far more inclusive, humanistic and sustainable, and focuses on comprehensively improving the quality of urbanization, paying more attention to the needs of people, pursuing green, low-carbon, intensive, efficient, innovative and intelligent development, and following a road towards scientific development, ecological civilization, harmonious society, urban and rural integration and innovative systems so as to achieve the coordinated development of the economy, society and environment [37].
Many scholars have tried to evaluate new urbanization by constructing multidimensional indices, mainly including demographic, economic, social, land, ecological and other dimensions. The research scope can be divided into different spatial levels, from country and region to city. For example, Yang et al. [38] conducted a dynamic comprehensive evaluation of new urbanization in 30 provinces and cities in China, which showed a fluctuating upward trend and regional differences. Zeng et al. [39] analyzed the development pattern and influencing factors of new urbanization in the city agglomeration of Beijing–Tianjin–Hebei and found that new urbanization decreased progressively in the surrounding cities from the centers of Beijing and Tianjin. Song et al. [40] researched the eco-environment-bearing capacity and the development of new urbanization in Wuhan and found that the overall development quality was not high and the coordination degree was low. Most studies adopted methods such as entropy, horizontal open level [38], gray correlation degree [39], coupling coordination degree [40] and exploratory spatial analysis. In general, the development of new urbanization has obvious spatiotemporal differentiation characteristics and close synergistic interactions with the ecological environment [41], public services [42] and industrial development [43]. The coordinated development of new urbanization is jointly promoted by the government, market, internal sources and external sources.
2.2. Connotation and Evaluation System of Urban Resilience
Resilience is a word from the Latin “resilio”, which originally meant “return to original state” [44]. Holling initially applied the concept of “resilience” in system ecology to describe the characteristics of the stable state of ecosystems [45]. Since then, the related research has expanded from natural ecology to human ecology and has been gradually introduced into the field of urban planning. In 2002, the International Council for Sustainable Regional Development (ICLEI) first proposed “urban resilience”, which means that cities can resist disasters, reduce losses by themselves and recover quickly from disasters through the reasonable allocation of resources. Later, it was introduced into urban and disaster prevention research [46]. According to “resilience alliance”, urban resilience is defined as the ability of a city or its system to soak up and absorb external disturbances and maintain its original main characteristics, structure and key functions [47]. Due to the complexity of the urban system and the diversity of internal and external interference factors, there is still no unified definition of the term “urban resilience” [48]. In general, urban resilience refers to the ability of a city and its subsystems to quickly adapt, recover and effectively prevent risks while responding to various shocks and disturbances [49,50].
Considering the understanding and prospect of urban resilience, scholars have put forward different assessment frameworks for it. In 2012, the United Nations Program for Disaster Reduction (UNISDR) put forward the “Ten Criteria for Urban Resilience”, which is the basic framework for constructing its evaluation index [51]. In 2013, the Rockefeller Foundation put forward the urban resilience framework composed of leadership and strategy, economic and social, health and welfare, infrastructure, and ecological system [52]. Based on the framework, Adriana [53] explored the main advantages and disadvantages of the urban resilience process under the guidance of the 100RC initiative, following a comparative analysis of two cities—Rome and Athens. In 2018, the Technical Committee on Sustainable Urban Development proposed the “Resilient Urban Indicators for Sustainable Urban Development”. From the perspective of the present research, we are still exploring the evaluation system of urban resilience, and it is mainly constructed from the dimensions of economy, society, ecology and infrastructure. In terms of evaluation methods, Heiman et al. [54] identified the criteria needed to assess urban resilience by presenting relevant questions and judged whether the existing evaluation tools are systematic and holistic. In addition, scholars have applied evaluation methods such as system dynamics models (SDM) [55], social infrastructure networks [56] and OD datasets [57] to measure the level of resilience. The evaluation results indicate that urban resilience is affected by the ecological environment [58], employment structure [59], infrastructure [60], urban land use [61] and many other factors. In general, the assessment of urban resilience is no longer limited to a single dimension, such as the ecosystem, but tends to be a comprehensive study that includes other dimensions, such as economic, social and institutional.
2.3. The Coupling and Coordination Relationship between New Urbanization and Urban Resilience
Both systems of new urbanization and urban resilience involve the fields of population, economy, society and ecology, and there is a close coupling coordinated development relationship between them. For example, Balletto [33] believed that the circular economy is the most suitable candidate to respond to the societal challenges tied to rapid urbanization changes and the strategic action to improve urban resilience. Most studies on the coupling coordinated development of this complex system focused on urban and provincial areas, but less on regional areas. For example, Hong et al. [62] studied the coupling coordination between the urban resilience and urbanization of Hefei City. Bai et al. [63] investigated the comprehensive level and spatial pattern of urban resilience and urbanization in Jilin Province and analyzed the coupling coordination relation between them. As for research methods, most scholars used the coupling coordination model to quantify the collaborative relationship; the spatial autocorrelation model [64], gray prediction model [65] and Markov chain [66] to analyze the spatiotemporal variation; and the gray relational model [66], linear regression analysis [67] and geographical weighted model [67] to explore the influencing factors of the coupling coordination relationship. The research results showed that the coupling coordination degree of urbanization and urban resilience had obvious spatiotemporal development characteristics and different lag types; thus, improving the level of urban resilience is the key to achieving higher coupling coordination [64,65]. At the same time, the coupling coordinated development of composite systems is affected by multiple factors [66], such as the government, market, internal sources and external sources.
By reviewing the relevant literature, it is found that scholars have conducted many studies on the coordinated development of urban resilience and new urbanization; however, there are still some shortcomings. First, most studies analyze the relationship between traditional urbanization and urban resilience, or their relationship with other urban systems; thus, the discussion on the coupling coordination relationship between new urbanization and urban resilience needs to be further explored. Second, in terms of research objects, there are few studies that start from a regional perspective. Third, as for the research itself, most studies are concentrated on evaluating the comprehensive level, coupling coordination degree, spatiotemporal variation characteristics and spatial distribution types of urban resilience and urbanization, but there is less analysis of influencing factors of the coupling coordination relationship. Therefore, this paper tries to explore the coupling coordination relationship between urban resilience and new urbanization and its influencing factors with the YREB as the research object, which has certain theoretical value and practical significance for realizing urban sustainable development and regional integrated development.
3. Research Method and Data
3.1. Research Object
The YREB consists of three major urban agglomerations: the Yangtze River Delta urban agglomerations, the middle reaches of the Yangtze River urban agglomerations and the Chengdu–Chongqing urban agglomerations, covering 11 provinces and municipalities: Shanghai, Zhejiang, Anhui, Jiangxi, Hubei, Hunan, Jiangsu, Chongqing, Guizhou, Yunnan and Sichuan. By the end of 2020, it covered a total area of about 2.05 million km2, accounting for 21.4% of China’s area, and the population and economic aggregate covers more than 40% of the country level. With an urbanization rate of permanent residents of 63.22%, it is one of the regions with the highest comprehensive strength and plays the largest economic supportive role in China. Taking the relevant development outlines and data availability into account, this paper finally delimits 110 prefecture-level cities of 11 provinces in the YREB as the research objects. The specific regional scope is shown in Figure 2.
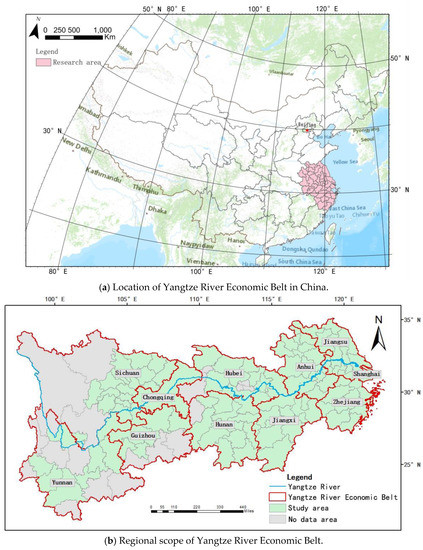
Figure 2.
Study area.
3.2. Index Construction
To study the coupling coordination relationship between urban resilience and new urbanization in the YREB, it is necessary to build a comprehensive evaluation index system of urban resilience and new urbanization first. Based on existing research and the current situation of the development of various provinces and cities in the YREB, this study follows the scientific, systematic, gradation and operability principles, and uses the composite index method to build the corresponding evaluation index. The index contains 2 targets, 8 criteria layers and 27 index layers, and the index weight is gained by the entropy value method, which is shown in Table 1.

Table 1.
Comprehensive evaluation index of urban resilience and new urbanization.
The urban resilience index includes 4 dimensions, namely, economic resilience, social resilience, ecological resilience and infrastructure resilience, which can be divided into a total of 16 s-level indicators. Economic resilience refers to the flexible transformation ability of each economic entity in a city to cope with unknown economic risks. The per capita GDP and per capita savings balance of urban and rural residents are used to measure the potential of economic development, and the proportion of tertiary industry in GDP and per capita actual utilization of foreign capital reflect the diversification of the economic structure. Moreover, social resilience refers to the capacity of a society to cope with external pressure caused by social environment change in the process of building a city community. Last but not least, the registered urban unemployment rate, the number of students at schools with a scale of 10,000 people, the number of doctors per 10,000 people and the per capita retail of social consumer goods, respectively, represent the social stability, population quality, medical insurance and consumer demand. Ecological resilience refers to the environmental bearing capability and self-adjustment of cities to cope with natural disasters and human-made disasters. Per capita park green land area represents the livable level of the environment; industrial solid waste comprehensive utilization and hazard-free treatment rate of daily waste reflect the resource utilization efficiency; and emissions per unit of GDP industrial wastewater reflect the environmental bearing capacity. Infrastructure resilience refers to the ability of cities to provide basic services for residents in emergencies. The number of car owners per 10,000 people represents evacuation capacity; the number of Internet users per 10,000 people represents the level of urban communication; and the density of drainage pipes and per capita gas supply in built-up areas reflects the degree of infrastructure perfection. The urban registered unemployment rate and industrial wastewater discharge per unit GDP are negative. The larger the value, the worse the ability of a city to adapt to and recover from external uncertainties when trying to maintain social stability and alleviate environmental pressure.
The new urbanization index has a total of 11 s-level indicators of 4 dimensions: population urbanization, economic urbanization, social urbanization and ecological urbanization. Population urbanization is an important symbol of urbanization development. The proportion of the urban population, population density and proportion of employees in secondary and tertiary industries, respectively, reflect the population size, population agglomeration and employment structure. Compared with the past, economic development in new urbanization orients more to quality than speed. Therefore, the per capita disposable income of urban residents and the coefficient of industrial structure upgrading are selected to represent urban economic vitality and the degree of industrial structure optimization, respectively, in this study. The coefficient of industrial structure ranges from 1 to 3, and the closer the value is to 1, the lower the degree of urban industrial structure upgrading; the closer it is to 3, the higher the level. Social urbanization is the concentrated reflection of “people-oriented” new urbanization. The basic endowment insurance coverage of urban workers, number of beds in hospitals per 10,000 people, number of books in public libraries per 10,000 people and per capita urban road area are used to reflect the status of urban social security, medical services, cultural popularity and traffic facilities. Ecological urbanization is the basis for the sustainable development of new urbanization. The urban greening level is measured by the green coverage rate of built-up areas, and the environmental treatment efficiency is reflected by the sewage treatment rate.
3.3. Data Sources
The characterization data of each indicator in this paper were obtained from the China Urban Statistical Yearbook, China Urban Construction Statistical Yearbook, statistical yearbooks of various provinces and cities, and statistical bulletins of the national economic and social development of various provinces and cities from 2005, 2010, 2015, and 2019. Some missing data were supplemented by data of adjacent years and/or an interpolation method.
3.4. Research Methods
3.4.1. Entropy Weight
As one of the common methods of objective weighting, entropy can be used to determine the weight value of indicators according to the correlation between the original data of each indicator and effectively avoid the deviation caused by subjective factors. The entropy weights were calculated using SPSS Statistics for Windows, version 18.0. The calculation procedure is as follows.
The original data matrix of indicators involves years, cities and indicators; therefore, the original data matrix of indicators is, where represents the original date of the jth item of the ith city in the th. In this research, , and are, respectively, 4, 110 and 27.
This study carried out dimensionless processing via range standardization for different indicators. At the same time, to avoid meaningless logarithmic processing when calculating the entropy value, this study conducted nonnegative processing for the standardized index value:
- (1).
- Positive indicator:
- (2).
- Negative indicator:where , , and , respectively, represent the minimum and maximum values of all indicators, represent the original value and the standardized value of the index, respectively, is the index value after translation and is the translation amplitude, where .
- (3).
- Calculate the proportion of the ith city in the jth indicator: ;
- (4).
- Calculate the entropy value of the jth indicator: , ;
- (5).
- Calculate the diversity factor of the jth indicator: ;
- (6).
- Calculate the weight of the jth indicator: ;
- (7).
- Calculate the comprehensive grade of the ith city: .
3.4.2. Coupling Coordination Degree
The concept of coupling coordination originates from the field of physics, which refers to the interaction between different systems influenced by the outside world and themselves. The coupling coordination degree model is applied in this paper to describe and measure the interactive relationship between urban resilience and new urbanization, and the coupling degree is calculated using the following formula:
where is the coupling degree of urban resilience and new urbanization; and , respectively, represent the comprehensive evaluation index of urban resilience and the new-type urbanization level. Since the coupling degree can only describe the interaction between different systems and cannot measure the coordination development level between the two systems, the coordination degree model is introduced to measure the coordination degree of the two systems. The calculation formula is as follows:
where is the comprehensive coordination index of urban resilience and new urbanization; are the undetermined weights, which refer to the importance degree of the two systems, where . In this paper, urban resilience is considered equally important as the level of new urbanization; thus, both are set to a value of 0.5. is the coupling coordination degree of urban resilience and new urbanization. The higher the value of , the higher the development degree of the two systems, and they promote each other, while the lower the value of , the lower the development degree of the two systems, and they contain each other. Based on the relevant research results, the types of coupling coordination can be divided, as shown in Table 2.
Table 2.
The coupling coordination types of urban resilience and new urbanization.
3.4.3. Geographic Detector
Geographic detector is a statistical method for detecting spatial differentiation and its underlying dynamic factors, which has been applied in many fields such as nature and society [67]. This paper mainly analyzes the driving factors of the spatiotemporal differences in the coupling coordination between urban resilience and new urbanization in the YREB with the aid of factor detection and interaction detection. Factor detection is mainly used to reflect the explanatory power of independent variables to dependent variables, which can be measured by the q value:
where represents the factor detection force of the influencing factor; is the number of samples in the whole region; is the number of secondary regions; is the number of samples in the sublevel regions; is the variance of the coupling coordination degree of urban resilience and new urbanization in the whole region; is the variance of the coupling coordination degree of the sublevel regions. The larger the value range of , the stronger the explanatory power of this factor for the coupling coordination degree. The smaller the value range, the weaker the explanatory power.
Interaction detection was used to identify whether different risk factors would weaken or enhance the degree of explanation of the dependent variable when they cooperated, with five interaction types: nonlinear weakening, single-factor nonlinear weakening, two-factor nonlinear strengthening, and independent and nonlinear strengthening.
4. Research Results
4.1. Analysis of Urban Resilience and New Urbanization Based on Evaluation
4.1.1. Temporal and Spatial Evolution of Urban Resilience
According to the weight results of the entropy method, the weights of economic resilience, social resilience, ecological resilience and infrastructure resilience in the urban resilience evaluation system are 0.4147, 0.3212, 0.0720 and 0.1922, respectively, indicating that economic resilience in the four criterion layers has the greatest impact on the comprehensive development level of urban resilience in the YREB, followed by social resilience, infrastructure resilience and ecological resilience. Among the 16 indicators, the top 5 with the highest weight are, in order, the per capita actual utilization of foreign capital (0.1642), the number of students at schools per 10,000 people (0.1467), the per capita retail sales of social consumer goods (0.1120), the per capita GDP (0.1099) and the per capita savings balance of urban and rural residents (0.0923). The explanatory power of urban resilience is as high as 62.5%, indicating that population quality and consumer demand are also key factors for the rapid development of urban resilience in the YREB, in addition to economic factors such as economic structure and economic potential.
- (1)
- Temporal evolution of urban resilience
This study carried out a comprehensive evaluation of the resilience levels of 110 prefecture-level cities in the YREB and conducted descriptive statistical analysis of their comprehensive indices (Table 3). From the perspective of the YREB, the average of the urban resilience level increased year by year, increasing to 0.270 in 2019 from 0.118 in 2005. However, the overall value was not high, indicating that the overall urban resilience level of the YREB still needs to be further improved. The difference between the minimum value and the maximum value of urban resilience increased with time, rising to 0.548 from 0.282. However, the coefficient of variation showed a downward trend, which reflects the imbalanced urban resilience among cities, but the overall development tended to be balanced.
Table 3.
Comprehensive index of urban resilience in the Yangtze River Economic Belt (U1).
- (2)
- Spatial evolution of urban resilience
According to the regional economic classification standard of the World Bank, the 110 cities in the YREB were successively divided into low-level, medium–low-level, medium–high-level and high-level regions by 0.5, 1 and 1.5 times the average urban resilience index. The spatial evolution trend of urban resilience from 2005 to 2019 was drawn with the aid of ArcGIS software (Figure 3). As for the resilience level, the proportion of cities with low, medium–low, medium–high and high resilience in the study area was optimized from 46.36%, 41.82%, 10.91% and 0.91% in 2005 to 0%, 30.91%, 41.82% and 27.27% in 2019. In 2005, the resilience of cities in the YREB was mainly at a low level, mainly concentrated in provinces such as Sichuan, Hunan and Jiangxi. The medium–high-level cities were mostly provincial capitals or coastal cities, and only Nanjing (0.340) was at a high level. In 2010, most cities were at a medium–low level of resilience, and there were only 12 low-level cities, which were mostly in southwest China, while the cities with a high level of resilience were clustered in southern Jiangsu, northern Zhejiang and Shanghai, and the rest were provincial capitals. Cities with a medium–high level of resilience were surrounding cities of those cities with a high level of resilience. In 2015, only Zhaotong (0.095) had a low level of resilience, and the agglomeration effect of medium–high resilience and high resilience in the Yangtze River Delta was expanded. In 2019, there were no cities with a low level of resilience, and Jiangsu, Zhejiang, Shanghai, Chongqing and other places all achieved the medium–high level of resilience or above. The results showed that the resilience level of cities in the YREB increased year by year from 2005 to 2019, accompanied by obvious spatial differences. Generally, the resilience level of cities in the YREB showed a ladder spatial pattern of “high in the east and low in the west”, and the resilience level decreased from the lower reaches of the Yangtze River to the middle and upper reaches.
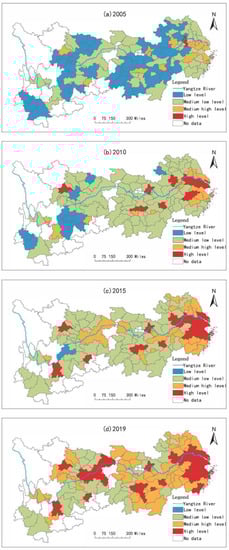
Figure 3.
Spatial evolution trend of urban resilience from 2005 to 2019.
4.1.2. Temporal and Spatial Evolution of New Urbanization
The weight results of the entropy method showed that the weights of population urbanization, economic urbanization, social urbanization and ecological urbanization in the four criterion layers of the new urbanization evaluation system were 0.1941, 0.1743, 0.5530 and 0.0786, respectively, indicating that social urbanization played the most critical role in the development of new urbanization from 2005 to 2019, followed by population urbanization, economic urbanization and ecological urbanization. Among the 11 indicators, the top 5 with the highest weight were the coverage rate of urban workers’ basic pension insurance (0.1878), the number of books in public libraries per 10,000 people (0.1650), the population density (0.1142), the number of beds in medical institutions per 10,000 people (0.1142) and the per capita disposable income of urban residents (0.1074). In addition, the explanatory power of new urbanization reached 68.9%, implying that public services such as education, medical care and social security, as well as the degree of population agglomeration and economic vitality, are of great significance to accelerate the construction of new urbanization.
- (1)
- Temporal evolution of new urbanization
The new-urbanization level of 110 cities in the YREB was comprehensively evaluated, and descriptive statistical analysis was conducted on it in this study (Table 4). From the perspective of the YREB, the average level of new urbanization was obviously upward, rising from 0.189 in 2005 to 0.360 in 2019, but the overall level was still low, indicating that the overall level of new urbanization in the YREB needs to be further improved. The gap between the maximum and minimum values of the new-urbanization level of the 110 cities expanded from 0.474 in 2005 to 0.503 in 2019. The coefficient of variation decreased year by year, and the value was small, implying that there were differences in the new-urbanization level of the YREB, and the overall development trend toward integration was positive.
Table 4.
Comprehensive index of new urbanization in the Yangtze River Economic Belt (U2).
- (2)
- Spatial evolution of new urbanization
As with the method used in the categorization of the resilience level of cities, the level of new urbanization was divided into four categories: low level, medium–low level, medium–high level and high level, and ArcGIS software was used to conduct a visual analysis of its change trend (Figure 4). As shown in the figure, the overall level of new urbanization in the YREB in 2005 was relatively low, and most cities were in the medium–low-level areas. Except the northern part of Sichuan, regions in the low-level areas were contiguous, while the other cities were scattered. In 2010, the number of areas with a low level of new urbanization decreased significantly, all of which turned to medium–low-level areas. Only Bazhong, Bijie and Zhaotong were left as areas with a low level of new urbanization. In 2015, the level of new urbanization in the YREB was further improved, and there were no low-level areas. In 2019, most regions were in the medium–high-level stage of new urbanization, showing significant agglomeration characteristics, and these cities were mainly distributed in the north of the upper, middle and lower reaches of the Yangtze River. The high-level region extended to the surrounding areas from the center of Shanghai, including Zhejiang and southern Jiangsu. From 2005 to 2019, the level of new urbanization in the YREB increased significantly, but there were still obvious spatial differences. Most cities experienced a transformation process from “low level to high level”, and the overall level of new urbanization showed a diffusion trend of high level to low level from east to west.
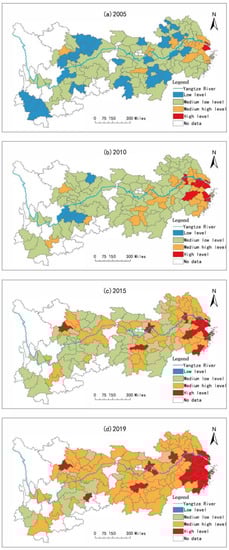
Figure 4.
Spatial evolution trend of new urbanization from 2005 to 2019.
4.2. Analysis of the Coupling Coordination Relationship between Urban Resilience and New Urbanization
4.2.1. Time Sequence Difference Analysis
Combined with the comprehensive evaluation index of urban resilience () and new urbanization () of the 110 cities in the YREB, this study used the coupling coordination degree model to calculate the coupling coordination degree () from 2005 to 2019, and the types were divided, as shown in Table 5, so as to explore the temporal change characteristics of the coupling coordinated development of urban resilience and new urbanization in the YREB.
Table 5.
Coupling coordination relationship of Yangtze River Economic Belt (D).
The results show that the mean value of the coupling coordination degree between urban resilience and new urbanization in the YREB increased year by year from 0.378 in 2005 to 0.550 in 2019, indicating that the coupling coordination degree of the YREB improved in general. The mean values in the lower reaches of the Yangtze River were above the average level, while the mean values in the middle and upper reaches of the Yangtze River were below the average level, and the mean values in the upper reaches were the smallest. The standard deviation of the coupling coordination degree increased from 0.075 in 2005 to 0.088, demonstrating a general trend of increasing first and then stabilizing, which indicates that the absolute difference in the coupling coordination index in the YREB increased from 2005 to 2019. The coefficient of variation was adjusted from 0.199 in 2005 to 0.160 in 2019, showing a continuous downward trend overall, which indicates that the relative difference in the coupling coordination degree among cities decreased continuously. The absolute difference increased while the relative difference decreased, which shows that the overall regional development tended to be balanced, and the coupling coordination type was optimized from basic imbalance in 2005 to basic coordination in 2019.
4.2.2. Spatial Pattern Analysis
Based on the above classification criteria of coupling coordination types between urban resilience and new urbanization (Table 2), the coupling coordination degree was divided into four categories: severe imbalance, basic imbalance, basic coordination and high coordination. Next, ArcGIS 10.2 was used to create the spatial pattern trend map of the coupling coordination degree in the YREB from 2005 to 2019 (Figure 5).
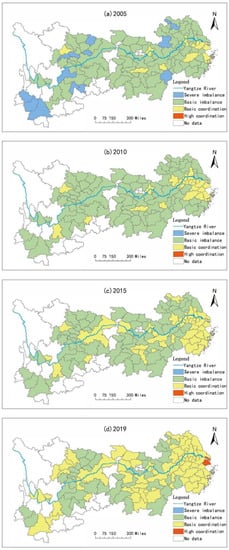
Figure 5.
Spatial trend of coupling coordination degree from 2005 to 2019.
From the perspective of development trends, most areas were basically imbalanced in 2005, and the cities in serious imbalance were scattered around the country. In 2010, there were no cities in severe dysfunction—most were still in the basic dysfunctional stage. In 2015, the number of basic balanced cities increased significantly, most of them concentrated in the eastern part of the economic belt. In 2019, the number of cities in basic balance accounted for more than half; meanwhile, Shanghai (0.811) upgraded from basic balance to advanced balance, and Zhejiang and Jiangsu Provinces both reached a basic balance. Dysfunctional cities were distributed around Chongqing (basic balance) in the west, while the remaining dysfunctional cities were concentrated in the marginal areas of the YREB. The results show that, as the core of regional development, the coupling coordination degree of urban resilience and new urbanization in Shanghai has reached a high level, which has a significant radiating effect on the surrounding areas. Jiangsu and Zhejiang are two provinces that are adjacent to Shanghai that have achieved rapid development of urban resilience and urbanization. As one of the most important cities in the YREB, Chongqing has an obvious “siphon effect” on the surrounding dysfunctional cities. In the development stage, Chongqing constantly attracted the input of various production factors from the surrounding areas. Constrained by terrain, transportation, resources and many other conditions, cities in provinces such as Sichuan, Yunnan and Guizhou are typical of lagging infrastructure construction, low resource-utilization efficiency and poor living environments, which is reflected in the difficulty of achieving the coordination of urban resilience and new urbanization.
Overall, from 2005 to 2019, the coupling coordination degree of the YREB showed the distribution pattern of “high in the east, low in the west and scattered from the center”, or in other words, Shanghai was the center, with the coupling coordination degree diminishing from east to west, with provincial capital cities as the center at the same time, giving play to their role in the radiating effect, which presents the tendency of coordinated development to radiate from central cities to surrounding cities.
4.2.3. Lag Analysis of Urban Resilience and New Urbanization
According to the difference between and , each category is divided into three subtypes (Table 2), which can be used to judge the relative development of urban resilience or new urbanization. From the subtypes of coupling coordination, the development of new urbanization and urban resilience of most cities in 2005 was relatively consistent, and the lag type was mainly resilience lag, which was concentrated in the downstream areas, most of which showed “basic imbalance–urban resilience lag.” In 2010, the cities still showed “basic imbalance–urban resilience lag”, and the lagging cities showed a trend of spreading from east to west and from the central city to the surrounding areas. In 2015, the number of cities in the “basic balance–urban resilience lag” category increased, which were distributed in the Yangtze River Delta region, showing a relatively obvious agglomeration effect. In 2019, “basic coordination–urban resilience lag” appeared for the first time in the upstream region, and the subtype of the coupling coordination degree of Wuhan City was “basic balance–new urbanization lag”.
The research shows that the resilience of cities in the YREB and the new-urbanization level have been greatly improved from 2005 to 2019, especially in central cities or provincial capitals, but there is a common lag of urban resilience. In other words, in the early stage of new-urbanization development, the urbanization and resilience of all cities were low. With the continuous improvement of the new-urbanization level, the external risk factors faced by the city also increased, leading to the slow growth in resilience of cities and the widening gap between new urbanization and the coordinated development of the two systems. With the rapid development of the economy and society, all cities began to attach importance to resilience to improve urban resistance against risks, adaptability and self-adjusting ability, and pay more attention to the coordinated development of the region and the radiating effect of centers. In addition, the coordination between the toughness of the city and urbanization was enhanced, showing a significant characteristic of regional agglomeration.
4.3. Analysis of Driving Factors of Coupling Coordination Degree
4.3.1. Index Selection
The coordinated development of urban resilience and new urbanization is influenced by many factors. Therefore, this paper draws on relevant research results [11] and is based on the four-dimensional dynamic theory. This study selected per capita local fiscal budget expenditure (X1), the proportion of urban private enterprises and individual employment (X2), the proportion of total imports and exports in GDP (X3) and the total industrial output value above per capita scale (X4) as the detection factors from the four dimensions of government power, market power, external power and internal power, so as to explore the driving factors of the coupling coordination of urban resilience and new urbanization in the YREB (Table 6). At the same time, this paper used the ArcGIS natural discontinuity point method to discretize the original index data, which were taken as the independent variable (X) and jointly imported into the Geodetector software with the coupling coordination degree (Y) of the dependent variable to obtain the factor detection results (Table 7) and interaction results (Table 8).
Table 6.
The driving factors of the coupling coordinated development of urban resilience and new urbanization in the Yangtze River Economic Belt.
Table 7.
Detection results of driving factors of coupling coordination degree of Yangtze River Economic Belt.
Table 8.
Interaction results of driving factors of coupling coordination degree of Yangtze River Economic Belt.
4.3.2. Result Analysis
- (1)
- Factor Detection Analysis
The detection force q values of each driving factor from 2005 to 2019 passed the significance test of 95% confidence, which was closely related to the spatial differentiation of the coupling coordination degree. In general, the order of the mean detection force of each driving factor was X4 (0.669) > X3 (0.626) > X1 (0.613) > X2 (0.460), which indicates that X4 has the strongest explanatory power for the coupling coordination degree in the years studied; in other words, the endogenous driving force has become the core driving force for the coordinated development of the two systems of urban resilience and new urbanization in the YREB, followed by the external driving force, the government driving force and the market driving force. In terms of the temporal period, there are differences between the forces of each driving factor. In 2005 and 2010, the two influencing factors with the highest q values were X4 and X3, and the values were both greater than 0.6, indicating that the endogenous and outward driving forces were the key factors affecting coordinated development in this stage. In 2015, X4 still ranked first in detection power, and X1 exceeded X3 for the first time to rank second, indicating that the explanatory power of government motivation on the coordination degree was enhanced. In 2019, the driving forces of all influencing factors changed greatly. X1 rose to first place and X3 to second place; thus, the leading factors were transformed into the government’s driving force and the external driving force. In terms of specific indicators, the fluctuation in X1′s detection force increased and reached the peak in 2019, while the fluctuation in X2′s and X3′s detection force decreased and X4′s detection force continued to decrease. The above results imply that the endogenous driving force always plays a pillar role in the development of new urbanization and urban resilience by promoting the transformation and upgrading of the industrial structure, as well as the flow of economic factors. In addition, the external driving force can effectively improve the competitiveness of cities by saving capacity and expanding demand, and its influence is second only to the internal driving force. Government power is an important guarantee for urban development. Moreover, adequate financial support and appropriate policies can give full play to the government’s macro-control role and avoid the delayed development of either party. Compared with the former three dimensions, market dynamics have relatively weak power in explaining coupling coordination, which reflects the weak influence of market vitality and resource allocation efficiency on urban resilience and new urbanization, which may be related to the strengthening of government regulation power.
- (2)
- Interaction Detection Analysis
This paper carried out an interaction detection of four driving factors and obtained a total of seven groups of factor pairs, all of which were two-factor interaction types, without independent, weakened and nonlinear enhanced interaction types. The research shows that the interaction between the influencing factors of the coupling coordinated development of urban resilience and new urbanization in the YREB from 2005 to 2019 was greater than the driving strength of each factor. Among them, the top two values for interaction detection in 2005 were X1∩X4 (0.799) and X2∩X4 (0.796); the top two values for interaction detection in 2010 were X1∩X4 (0.818) and X2∩X3 (0.815); the top two values for interaction detection in 2015 were X1∩X3 (0.790) and X1∩X4 (0.840); the top two values for interaction detection in 2019 were X1∩X3 (0.784) and X1∩X4 (0.851). In general, the interaction explanatory power of the X1∩X4 factor pair ranked first and continued to increase with time, which means that the interaction mechanism between them is conducive to improving the coupling coordination degree. In different periods, the overall explanatory power of X1 and other factors ranked first, indicating that the comprehensive effect of government dynamics and other dimension dynamics is the dominant path to improve the coordination degree.
5. Conclusions and Recommendations
5.1. Conclusions
The coordinated development of new urbanization and urban resilience is an effective way to achieve sustainable urban development. To better explore the development law of their interactive relationship, 110 cities in the YREB were observed to explore the coupling coordinated development characteristics of new urbanization and urban resilience. Based on the rich connotation of urban resilience and new urbanization, this study first constructed a comprehensive evaluation index dual system of urban resilience (economy–society–infrastructure resilience) and new urbanization (population–economy–society–ecology urbanization) and calculated the index weights using the entropy method. Next, it adopted the coupling coordination degree model to investigate the spatial–temporal differentiation pattern of the coupling coordination of urban resilience and new urbanization from 2005 to 2019. Finally, the driving factors of the coupling coordination degree of the YREB were researched using the geographic detector method based on the four-dimensional dynamic theory. The main conclusions are as follows.
- (1)
- The resilience and the new-urbanization level of cities in the YREB need to be further improved. Moreover, the state transition of the level is stable and there is a “convergence” phenomenon. There is an obvious ladder spatial development pattern of “high in the east and low in the west”, and most cities have experienced a transformation from “low level to high level.”
- (2)
- The coupling coordination between urban resilience and new urbanization in the YREB has been increasing in general, and the overall regional coordination type was upgraded from basic imbalance to basic coordination from 2005 to 2019. As for the spatial distribution, the coupling coordination has the characteristics of “high in the east and low in the west, moving from the central city to the surrounding areas”, and the central cities fully show a radiating driving effect.
- (3)
- In the coupling coordination process of new urbanization and urban resilience, the general hysteresis of urban resilience is shown. In other words, in the coupled system, new urbanization is at the priority level, and the level of urban resilience increases relatively slowly. As the new-urbanization level continues to be improved, the external risk factors faced by cities also increase, and the sustainable development of cities should give more priority to the improvement of the resilience level of cities.
- (4)
- The main driving forces to improve the coupling coordination degree are the endogenous driving force, government driving force and external driving force, and the interaction between two of them is larger than the driving strength of each. The synergistic mechanism of government power and endogenous power contributes the most to the improvement of the coupling coordination degree, and the comprehensive effect of government power and other dimensions is the dominant path to improve the coordination degree, which emphasizes the optimization effect of government regulation on the coupling system.
5.2. Recommendations
Based on the research conclusions, this paper puts forward the following suggestions to promote the coordinated and sustainable development of new urbanization and urban resilience in the YREB.
- (1)
- It is suggested that adherence to people-oriented theory and steadily promote the high-quality development of new urbanization be continued. According to the research results, social urbanization plays the most critical role in the development of new urbanization. The public service guarantee mechanism of education, medical care, employment and old-age care should be improved. It is necessary to create an urban construction environment in which humans and nature coexist in harmony, and further improve the urban spatial layout to promote orderly regional development. For areas with a high level of new urbanization, especially coastal cities along the Yangtze River downstream, it is suggested to quicken the transfer of agricultural population transformation, improve the bearing capacity of the ecological environment, give full play to the central city and create an urban agglomeration growth pole in the middle reaches of the Yangtze River and Chongqing; for underdeveloped regions, especially Guizhou, Yunnan and other provinces, it is better to adapt measures suitable to local conditions, rationally develop resources, overcome obstacles in the construction of transportation, drainage and other infrastructure, follow policy guidance, make cities more attractive to surrounding production factors, break development difficulties and expand development channels.
- (2)
- It is suggested that the vision of resilient development be implemented and uneven development among regions improved. By integrating resilient cities into urban construction and renewal, establishing and improving emergency management systems, and strengthening the urban comprehensive disaster prevention and earthquake reduction system planning, a long-term mechanism for urban sustainable development can be formed. It is necessary to strengthen the weak links, promote the orderly coordination of multiple resilience subsystems such as the economy, society, ecology and infrastructure, strengthen the adaptability and resilience of cities to cope with the disturbances and impacts of disaster risks and improve the overall resilience of cities. To address the significant spatial heterogeneity of regional resilience, it is necessary to coordinate development among regions and continue to reduce differences in resilience, to promote more balanced development among regions. According to the research results, economic resilience has the greatest impact on the comprehensive development level of urban resilience in the Yangtze River Economic Belt, and is an important support for the improvement of urban resilience. We should promote collaborative innovation in Shanghai, Hangzhou, Nanjing, Hefei and other major cities in the Yangtze River Delta, accelerate the development of the digital economy and grasp the important impact of economic resilience and social resilience on the construction of resilient cities. We should also improve the ability of Wuhan, Changsha, Nanchang and other provincial capitals in the middle reaches of the Yangtze River to absorb the spillover factors from the downstream cities, break down interregional barriers and strengthen intercity exchanges and cooperation. However, it is necessary to overcome the siphon effect of the better-developed areas on the less-developed areas.
- (3)
- It is suggested that a sound driving mechanism to promote the coordinated development of urban resilience and new urbanization be established. Since the development of urban resilience lags behind urbanization, more attention should be paid to the improvement of urban resilience. For significant spatial differentiation in the coupling coordinated development of the YREB, and the weak spatial agglomeration effect in the central region, endogenous power and outgoing power should be further combined, actively guiding the orderly flow of resource factors and accumulation, promoting industrial development fundamentals of reconstructing new patterns of urban development, giving full play to the regional comparative advantage and absolute advantage, improving the investment environment, and attracting foreign investment. At the same time, it is better that the government be the driving force to improve the public service system, focus on people’s livelihood issues, strengthen its macro-control, and link with market forces to improve the efficiency of resource allocation and stimulate market vitality.
Author Contributions
F.S. designed the research; S.W. collected and cleaned all the data and finished the calculations; J.Y. conducted the investigation; N.L. analyzed the results and wrote the paper. All authors have read and agreed to the published version of the manuscript.
Funding
This research was funded by the National Natural Science Foundation of China, grant 42071159.
Institutional Review Board Statement
Not applicable.
Informed Consent Statement
Not applicable.
Data Availability Statement
The source of research data has been described in Section 3.3.
Acknowledgments
The authors are grateful for the support of the National Natural Science Foundation of China. The contents of this paper are solely the responsibility of the authors and do not represent the official views of the institutes or funding agencies.
Conflicts of Interest
The authors declare no conflict of interest.
References
- Tonne, C.; Adair, L.; Adlakha, D.; Anguelovski, I.; Belesova, K.; Berger, M.; Brelsfoord, C.; Dadvand, P.; Dimitrova, A.; Giles-Corti, B.; et al. Defining pathways to healthy sustainable urban development. Environ. Int. 2021, 146, 106236. [Google Scholar] [CrossRef] [PubMed]
- Botequilha-Leitão, A.; Díaz-Varela, E.R. Performance Based Planning of complex urban social-ecological systems: The quest for sustainability through the promotion of resilience. Sustain. Cities Soc. 2020, 56, 102089. [Google Scholar] [CrossRef]
- Mera, A.; Balijepalli, C. Towards improving resilience of cities: An optimisation approach to minimising vulnerability to disruption due to natural disasters under budgetary constraints. Transportation 2019, 47, 1809–1842. [Google Scholar] [CrossRef]
- Lafortezza, R.; Sanesi, G. Nature-based solutions: Settling the issue of sustainable urbanization. Environ. Res. 2019, 172, 394–398. [Google Scholar] [CrossRef] [PubMed]
- Melika, A.; Saeideh, S.; Ayyoob, S. Urban resilience: A vague or an evolutionary concept? Sustain. Cities Soc. 2022, 81, 103853. [Google Scholar]
- Sharma, M.; Sharma, B.; Kumar, N.; Kumar, A. Establishing Conceptual Components for Urban Resilience: Taking Clues from Urbanization through a Planner’s Lens. Nat. Hazards Rev. 2023, 24, 04022040. [Google Scholar] [CrossRef]
- Feagan, M.; Matsler, M.; Meerow, S.; Muñoz-Erickson, T.A.; Hobbins, R.; Gim, C.; Miller, C.A. Redesigning knowledge systems for urban resilience. Environ. Sci. Policy 2019, 101, 358–363. [Google Scholar] [CrossRef]
- Asadzadeh, A.; Kötter, T.; Fekete, A.; Moghadas, M.; Alizadeh, M.; Zebardast, E.; Weiss, D.; Basirat, M.; Hutter, G. Urbanization, migration, and the challenges of resilience thinking in urban planning: Insights from two contrasting planning systems in Germany and Iran. Cities 2022, 125, 103642. [Google Scholar] [CrossRef]
- Solecki, W.; Seto, K.C.; Balk, D.; Bigio, A.; Boone, C.G.; Creutzig, F.; Fragkias, M.; Lwasa, S.; Marcotullio, P.; Romero-Lankao, P.; et al. A conceptual framework for an urban areas typology to integrate climate change mitigation and adaptation. Urban Clim. 2015, 14, 16–137. [Google Scholar] [CrossRef]
- Guan, X.; Wei, H.; Lu, S.; Dai, Q.; Su, H.J. Assessment on the urbanization strategy in China: Achievements, challenges and reflections. Habitat Int. 2018, 71, 7–109. [Google Scholar] [CrossRef]
- Maparu, T.S.; Mazumder, T.N. Transport infrastructure, economic development and urbanization in India (1990–2011): Is there any causal relationship? Transp. Res. Part A Policy Pract. 2017, 100, 319–336. [Google Scholar] [CrossRef]
- Islam, M.M.; Irfan, M.; Shahbaz, M.; Vo, X.V. Renewable and non-renewable energy consumption in Bangladesh: The relative influencing profiles of economic factors, urbanization, physical infrastructure and institutional quality. Renew. Energy 2022, 184, 1130–1149. [Google Scholar] [CrossRef]
- Comer, A.; Forbes, K. Urbanisation in the UK: The need for a more focused approach on city infrastructure. Proc. Inst. Civ. Eng. Civ. Eng. 2016, 169, 53. [Google Scholar] [CrossRef]
- Chauvin, J.P.; Glaeser, E.; Ma, Y.; Tobio, K. What is different about urbanization in rich and poor countries? Cities in Brazil, China, India and the United States. J. Urban Econ. 2016, 98, 17–49. [Google Scholar] [CrossRef]
- Tripathi, S.; Rani, C. The impact of agricultural activities on urbanization: Evidence and implications for India. Int. J. Urban Sci. 2018, 22, 123–144. [Google Scholar] [CrossRef]
- Maarten, B.; Uwe, D.; Mark, R. Hukou and highways the impact of China’s spatial development policies on urbanization and regional inequality. Reg. Sci. Urban Econ. 2016, 71, 1–109. [Google Scholar]
- Arpit, S.; Ganesh, D.K. Assessment of urbanization impact on urban heat island effect and rainfall for the Surat city. Acta Geophys. 2022, 70, 243–264. [Google Scholar]
- Mahmood, H.; Alkhateeb, T.T.Y.; Furqan, M. Industrialization, urbanization and CO2 emissions in Saudi Arabia: Asymmetry analysis. Energy Rep. 2020, 6, 1553–1560. [Google Scholar] [CrossRef]
- José, M.M.; Mercedes, A. Effects of Urbanization on Extreme Climate Indices in the Valley of Mexico Basin. Atmosphere 2022, 13, 785. [Google Scholar]
- Delbecque, N.; Dondeyne, S.; Gelaude, F.; Mouazen, A.M.; Vermeir, P.; Verdoodt, A. Urban soil properties distinguished by parent material, land use, time since urbanization, and pre-urban geomorphology. Geoderma 2022, 413, 115719. [Google Scholar] [CrossRef]
- Egidi, G.; Salvati, L.; Falcone, A.; Quaranta, G.; Salvia, R.; Vcelakova, R.; Giménez-Morera, A. Re-Framing the Latent Nexus between Land-Use Change, Urbanization and Demographic Transitions in Advanced Economies. Sustainability 2021, 13, 533. [Google Scholar] [CrossRef]
- Alqurashi, A.F.; Kumar, L. An assessment of the impact of urbanization and land use changes in the fast-growing cities of Saudi Arabia. Geocarto Int. 2019, 34, 78–97. [Google Scholar] [CrossRef]
- Azam, M.; Rehman, Z.U.; Ibrahim, Y. Causal nexus in industrialization, urbanization, trade openness, and carbon emissions: Empirical evidence from OPEC economies. Environ. Dev. Sustain. 2022, 24, 13990–14010. [Google Scholar] [CrossRef]
- Sher, K.; Tariq, M.M. Toward economic growth without emissions growth: The role of urbanization & industrialization in Pakistan. J. Environ. Stud. Sci. 2022, 11–16. [Google Scholar]
- Kantakumar, L.N.; Kumar, S.; Schneider, K. Spatiotemporal urban expansion in Pune metropolis, India using remote sensing. Habitat Int. 2016, 51, 11–22. [Google Scholar] [CrossRef]
- Lambin, E.F.; Meyfroidt, P. Global land use change, economic globalization, and the looming land scarcity. Proc. Natl. Acad. Sci. USA 2011, 108, 3465–3472. [Google Scholar] [CrossRef]
- Parrish, D.D.; Zhu, T. Clean Air for Megacities. Science 2009, 326, 674–675. [Google Scholar] [CrossRef]
- Rafiq, S.; Salim, R.; Nielsen, I. Urbanization, openness, emissions, and energy intensity: A study of increasingly urbanized emerging economies. Energy Econ. 2016, 56, 20–28. [Google Scholar] [CrossRef]
- Yu, R.L.; Clarke, K.C.; Zhang, J.M.; Jia, X.; Feng, J.; Li, J. The impact of urbanization and climate change on ecosystem services: A case study of the city belt along the Yellow River in Ningxia, China. Comput. Environ. Urban Syst. 2020, 77, 101–115. [Google Scholar]
- Dewan, A.M.; Yamaguchi, Y. Land use and land cover change in Greater Dhaka, Bangladesh: Using remote sensing to promote sustainable urbanization. Appl. Geogr. 2009, 29, 390–401. [Google Scholar] [CrossRef]
- Jiboye, A.D. Sustainable urbanization: Issues and challenges for effective urban governance in Nigeria. J. Sustain. Dev. 2011, 6, 211–224. [Google Scholar] [CrossRef]
- Kocabas, A. The transition to low carbon urbanization in Turkey: Emerging policies and initial action. Habitat Int. 2013, 37, 80–87. [Google Scholar] [CrossRef]
- Balletto, G.; Ladu, M.; Camerin, F.; Ghiani, E.; Torriti, J. More Circular City in the Energy and Ecological Transition: A Methodological Approach to Sustainable Urban Regeneration. Sustainability. 2022, 14, 14995. [Google Scholar] [CrossRef]
- Nevens, F.; Frantzeskaki, N.; Gorissen, L.; Loorbach, D. Urban Transition Labs: Co-creating transformative action for sustainable cities. J. Clean. Prod. 2013, 50, 111–122. [Google Scholar] [CrossRef]
- Spangenberg, J.H. Sustainability science: A review, an analysis and some empirical lessons. Environ. Conserv. 2011, 38, 275–287. [Google Scholar] [CrossRef]
- Sununta, N.; Kongboon, R.; Sampattagul, S. GHG evaluation and mitigation planning for low carbon city case study: Dan Sai Municipality. J. Clean. Prod. 2019, 228, 1345–1353. [Google Scholar] [CrossRef]
- Huo, B. New urbanization path planning based on cluster calculation. Clust. Comput. 2019, 22, 6827–6835. [Google Scholar] [CrossRef]
- Yang, W.; Lu, X. An Assessment of China’s New Urbanization Level—Based on the Vertical and Horizontal Levels of the Grade Method. Econ. Horiz. 2016, 18, 197–208. [Google Scholar]
- Zeng, J.; Zhao, Y.; Li, S. Research on the Evolution and Driving Factors of the New Urbanization Level of Beijing-Tianjin-Hebei Urban Agglomeration. Ecol. Econ. 2021, 37, 100–107. [Google Scholar]
- Song, M.; Hu, C. A Coupling Relationship between the Eco-Environment Carrying Capacity and New-Type Urbanization: A Case Study of the Wuhan Metropolitan Area in China. Sustainability 2018, 10, 4671. [Google Scholar] [CrossRef]
- Zhang, F.; Ju, S.; Chan, N.W.; Ariken, M.; Tan, M.L.; Yushanjiang, A.; Wang, Y. Coupled analysis of new urbanization quality (NUQ) and eco-environmental carrying capacity (EECC) of prefecture-level and above cities in China during 2003–2016. Environ. Dev. Sustain. 2021, 24, 8008–8038. [Google Scholar] [CrossRef]
- Ma, F.; Guo, Y.; Yuen, K.; Woo, S.; Shi, W. Association between New Urbanization and Sustainable Transportation: A Symmetrical Coupling Perspective. Symmetry 2019, 11, 192. [Google Scholar] [CrossRef]
- Wu, X.; Huang, Y.; Gao, J. Impact of industrial agglomeration on new-type urbanization: Evidence from Pearl River Delta urban agglomeration of China. Int. Rev. Econ. Financ. 2022, 77, 312–325. [Google Scholar] [CrossRef]
- Susie, M.; Andreanne, D. The Resilient Melbourne experiment: Analyzing the conditions for transformative urban resilience implementation. Cities 2021, 110, 103017. [Google Scholar]
- Holling, C.S. Resilience and Stability of Ecological Systems. Annu. Rev. Ecol. Syst. 1973, 4, 1–23. [Google Scholar] [CrossRef]
- Motesharrei, S.; Rivas, J.; Kalnay, E.; Asrar, G.R.; Busalacchi, A.J.; Cahalan, R.F.; Cane, M.A.; Colwell, R.R.; Feng, K.; Franklin, R.S.; et al. Modeling Sustainability: Population, Inequality, Consumption, and Bidirectional Coupling of the Earth and Human Systems. Natl. Sci. Rev. 2016, 3, 470–494. [Google Scholar] [CrossRef]
- Alliance, R. Urban Resilience Research Prospectus; CSIRO: Canberra, Australia, 2007. [Google Scholar]
- Ribeiro, P.; Gonçalves, L. Urban resilience: A conceptual framework. Sustain. Cities Soc. 2019, 50, 101625. [Google Scholar] [CrossRef]
- Spaans, M.; Waterhout, B. Building up resilience in cities worldwide—Rotterdam as participant in the 100 Resilient Cities Programme. Cities 2016, 61, 109–116. [Google Scholar] [CrossRef]
- Meerow, S.; Newell, P.J.; Stults, M. Defining urban resilience: A review. Landsc. Urban Plan. 2016, 147, 38–49. [Google Scholar] [CrossRef]
- Valdes, H.M. How to Make Cities More Resilient: A Handbook for Local Government Leaders; United Nations UNISDR: Geneva, Switzerland, 2012. [Google Scholar]
- Croese, S.; Green, C.; Morgan, G. Localizing the Sustainable Development Goals Through the Lens of Urban Resilience: Lessons and Learnings from 100 Resilient Cities and Cape Town. Sustainability 2020, 12, 550. [Google Scholar] [CrossRef]
- Adriana, G.; Giada, L.; Dimitra, S.K. Strengths and weaknesses of the 100 Resilient Cities Initiative in Southern Europe: Rome and Athens’ experiences. City Territ. Archit. 2020, 7, 16. [Google Scholar]
- Dianat, H.; Wilkinson, S.; Williams, P.; Khatibi, H. Choosing a holistic urban resilience assessment tool. Int. J. Disaster Risk Reduct. 2022, 71, 102789. [Google Scholar] [CrossRef]
- Datola, G.; Bottero, M.; De Angelis, E.; Romagnoli, F. Operationalising resilience: A methodological framework for assessing urban resilience through System Dynamics Model. Ecol. Model. 2022, 465, 109851. [Google Scholar] [CrossRef]
- Guidotti, R.; Gardoni, P.; Rosenheim, N. Integration of physical infrastructure and social systems in communities’ reliability and resilience analysis. Reliab. Eng. Syst. Saf. 2019, 185, 476–492. [Google Scholar] [CrossRef]
- Martins, M.C.; Silva, A.N.R.; Pinto, N. An indicator-based methodology for assessing resilience in urban mobility. Transp. Res. Part D 2019, 77, 352–363. [Google Scholar] [CrossRef]
- Tayyab, M.; Zhang, J.; Hussain, M.; Ullah, S.; Liu, X.; Khan, S.N.; Baig, M.A.; Hassan, W.; Al-Shaibah, B. GIS-Based Urban Flood Resilience Assessment Using Urban Flood Resilience Model: A Case Study of Peshawar City, Khyber Pakhtunkhwa, Pakistan. Remote Sens. 2021, 13, 1864. [Google Scholar] [CrossRef]
- Marcin, B. Employment Diversification as a Determinant of Economic Resilience and Sustainability in Provincial Cities. Sustainability 2021, 13, 4861. [Google Scholar]
- Muhammad, R.; Dietwald, G.; Umer, K. Green infrastructure indicators to plan resilient urban settlements in Pakistan: Local stakeholder’s perspective. Urban Clim. 2021, 38, 100899. [Google Scholar]
- Mitchell, D.; Barth, B.; Ho, S.; Sait, M.S.; McEvoy, D. The Benefits of Fit-for-Purpose Land Administration for Urban Community Resilience in a Time of Climate Change and COVID-19 Pandemic. Land 2021, 10, 563. [Google Scholar] [CrossRef]
- Hong, T.; Wang, B.; Li, L. The Coupling Relationship between Urban Resilience Level and Urbanization Level in Hefei. Math. Probl. Eng. 2022, 2022, 7339005. [Google Scholar] [CrossRef]
- Bai, L.; Feng, X.; Sun, R.; Zhao, H.Y. Coupling Analysis of Urban Resilience Level and Urbanization Quality in Jilin Province. Urban. Archit. 2018, 35, 19–23. [Google Scholar]
- Gao, Y.; Chen, W. Study on the coupling relationship between urban resilience and urbanization quality–A case study of 14 cities of Liaoning Province in China. PLoS ONE 2021, 16, e0244024. [Google Scholar] [CrossRef]
- Xiong, Y.; Li, C.; Zou, M.; Xu, Q. Investigating into the Coupling and Coordination Relationship between Urban Resilience and Urbanization: A Case Study of Hunan Province, China. Sustainability 2022, 14, 5889. [Google Scholar] [CrossRef]
- Zhang, Y.; Liu, Q.; Li, X. Spatiotemporal Evolution of the Coupling Coordination of Urban Resilience and New Urbanization in the Urban Agglomeration of Yangtze River Delta. Urban Probl. 2022, 5, 17–27. [Google Scholar]
- Wang, J.; Xu, C. Geodetector: Principle and Prospective. Acta Geogr. Sin. 2017, 72, 116–134. [Google Scholar]
Disclaimer/Publisher’s Note: The statements, opinions and data contained in all publications are solely those of the individual author(s) and contributor(s) and not of MDPI and/or the editor(s). MDPI and/or the editor(s) disclaim responsibility for any injury to people or property resulting from any ideas, methods, instructions or products referred to in the content. |
© 2022 by the authors. Licensee MDPI, Basel, Switzerland. This article is an open access article distributed under the terms and conditions of the Creative Commons Attribution (CC BY) license (https://creativecommons.org/licenses/by/4.0/).