Article

Investigation of Local Tsunami Effect on Coastal Areas: A Case Study of Putian City, Fujian Province, China

1
National Marine Environmental Forecasting Center, Beijing 100081, China
2
Key Laboratory of Marine Hazards Forecasting, Ministry of Natural Resources, Beijing 100081, China
3
Japan Agency for Marine-Earth Science and Technology, Yokohama 236-0001, Japan
*
Author to whom correspondence should be addressed.
Sustainability 2023, 15(1), 415; https://doi.org/10.3390/su15010415
Submission received: 23 November 2022 / Revised: 22 December 2022 / Accepted: 23 December 2022 / Published: 27 December 2022
(This article belongs to the Special Issue Tsunami and Storm Surge Early Warning for Disaster Mitigation)

Abstract

:
In this paper, we explored the local tsunami hazards induced by an active local seismic Quanzhou fault, along the coastlines of the City of Putian, Fujian Province, in the southeast of China. The simulation results indicated that the tsunami wave will hit the nearest coast of Putian 0.5 h after the earthquake occurs. The most serious tsunami inundation depth in Putian was less than 3.0 m. This study also conducted a sensitivity test of the tsunami amplitude and inundation in response to different seismic source parameters, particularly the rake and strike angles of the Quanzhou fault. Based on the post-earthquake survey and the most updated geophysical data, the uniform dislocation distribution is applied in the range of scientific geometrical characteristic parameters for numerical modeling. A 20° change in the rake angle increases the inundation area from 50.0 km2 to more than 100.0 km2, and increases the tsunami amplitude from 0.2 m to 1.0 m. In this study, the tsunami hazard of Putian is more sensitive to the rake than to the strike angle for a local fault. Tsunamis generated by seismic fault could also result in serious coastal flooding along the coastlines locally, and the time for emergency response is limited. The research results could provide technical support for refining local tsunami hazard assessment and contingency plans, to save decision-making time and avoid waste of social resources.

1. Introduction

China is located in the eastern part of Asia, close to the subduction zones of the Pacific Ring of Fire, surrounded by several island countries like Japan and the Philippines. Due to the barrier of these islands, China is less likely to be affected seriously by a distant tsunami from the east Pacific Ocean. Therefore, regional and local tsunamigenic earthquakes are the main high-risk tsunami sources for China. The potential tsunami sources off the Chinese seas have been studied extensively [1,2]. The regional tsunami sources are concentrated mostly in the Ryukyu and Manila Trench, and the Manila Trench has a high tsunami risk to the adjacent seas [3,4]. Potential tsunami threat from the Manila Trench has been broadly studied in recent years since it will affect almost the entire Chinese southeastern coastlines once a significant earthquake occurs at this area [5,6,7,8]. Although the fault segments along the Chinese continental shelf are smaller than those in the Manila Trench [9], a local tsunami could also create a severe tsunami disaster because of the short distance between the tsunami source and its affected coasts, and limited emergency response time. Normally it will take only tens of minutes (or less) for tsunami waves propagating to the coastlines [10]. However, less attention is paid to tsunami disaster effect and characteristics on the coastlines locally along the coasts of China.
Two methods to assess potential tsunami hazard on a site of interest have been studied; one is Deterministic Tsunami Hazard Analysis (DTHA) and the other is Probabilistic Tsunami Hazard Analysis (PTHA). DTHA has been widely used in China in recent years [11]. It mainly evaluates the tsunami hazard on a site by defining and simulating a worst-case tsunami scenario (one source mechanism) in one tsunami source qualitatively. However, PTHA, which is derived from Probabilistic Seismic Hazard Analysis (PSHA), is becoming another way for the tsunami hazard evaluation and has been widely implemented in many countries, including Indonesia and Australia [12,13,14]. Selva et al. [15] presented the Probabilistic Tsunami Forecasting (PTF) approach to deal with uncertainty in real-time tsunami forecasting and link alert-level definition for tsunami early warning to such uncertainty. Based on the tsunami hazard assessment associated with existing development, Chock et al. [16] started to consider disaster resilience in community planning for future development.
The probability of a local tsunami effect on the coastlines of China in different regions has been studied broadly using the method of PTHA. Li et al. [17] used the PTHA method and evaluated the tsunami hazard for the Bohai Sea and adjacent coast (northeastern coast of China). The results showed that the probability of the tsunami wave height over 1.0 m within 200 years is only 0.5% for Laizhou Bay, which is the highest tsunami risk for the Bohai Sea. However, the probability of a local tsunami for the southeastern coast of China is much higher than the northeastern Sea [18,19]. In particular, Fujian Province in the southeastern coast of China has the highest tsunami hazard risk probability compared with other provinces. The probabilities of tsunami wave heights over 1 m in the Quanzhou and Xiamen cities (Fujian Province) within 100 years are greater than 20% in general [18].
It is later realized that for earthquakes of the same magnitude, different dislocation distributions would affect the tsunami wave height. Mueller et al. [20] studied the nearshore effects of local tsunami sources with random slip distributions. A uniform rake distribution may lead to an underestimation of tsunami inundation by about 0.3–0.4 equivalent magnitude compared with non-uniform rake distribution [20]. Even for the same tsunami source, different slip distributions could lead to various tsunami inundations as other seismic parameters are not changed [20]. Goda et al. [21] used dislocation distributions from historical earthquakes to generate random dislocation distributions. In this study, the random dislocation was not taken into account considering the recommendation for tsunami hazard assessment. Based on the post-earthquake survey and the most updated geophysical record, the uniform dislocation distribution was used in this study in the range of scientific geometrical characteristic parameters.
In this study, we aimed to investigate local tsunami induced by a potential seismic Quanzhou source near Fujian Province coast, and used a well validated numerical model to simulate the tsunami impact, including coastal flooding, on Putian City. At the same time, a sensitivity study was conducted to analyze the tsunami maximum amplitude and coastal flooding in response to the rake and strike angles. Thus, different from the DTHA method, these research results could provide technical support for coastal cities to implement refined tsunami hazard assessments and emergency response plans.

2. Tsunami Source

Many records show that China has been hit by local tsunamis throughout history [22,23]. Figure 1 shows the tsunamis and earthquakes with magnitudes of 6.0–8.0 near the southeastern coast of China from 1000 BC to 2022 AD. Local tsunamis mostly occurred on the southern coast of Fujian and the northern coast of Guangdong due to earthquakes with magnitudes of greater than 7.0 (Figure 1a). The data for historical tsunamis and earthquakes were obtained from the global historical tsunami database of the National Center for Environmental Information (NCEI), the National Oceanic and Atmospheric Administration (NOAA), the earthquake archives of United States Geological Survey (USGS), and historical earthquake statistics recorded by the China Earthquake Administration [24,25].
In 1604, a magnitude 8.0 earthquake occurred off the coast of Quanzhou and caused a tsunami, which caused thousands of deaths. This earthquake occurred on the Littoral Fault in the southern coastal region of China, and this fault was determined to have the highest intensity and frequency of seismic activity in this region. This fault has induced several strong earthquakes throughout history and may generate more strong earthquakes in the future [26]. Thus, in this study, we used a scientific Quanzhou source on this fault to simulate the tsunami propagation process, and we analyzed the influences of the fault parameters on the tsunami wave amplitude and inundation in Putian.
According to the Seismic Ground Motion Parameters Zonation Map of China [27], Ren et al. [18] provided 15 potential local tsunami sources in the Chinese coast and determined that 8 of the 15 local tsunami sources posed a potential tsunami threat to the southeastern coast of China. Liu [19] further analyzed the regional characteristics of the probabilistic tsunami hazard for the southeastern coast of China. The results showed that compared with regional tsunami sources, the local tsunami sources had a larger annual earthquake recurrence rate in this region. Among all the major cities on the southeastern coast of China, Fujian Province has the highest tsunami hazard risk probability and Zhejiang and Hainan have relatively low probabilities. The probability of the tsunami wave height exceeding 1 m in Fujian (Quanzhou and Xiamen cities) within 100 years is greater than 20% on average, whereas the rate in Hong Kong and Macao is much lower when only local tsunamis are considered [18].
Referring to Ren et al. [18] and Yang [9], the well analyzed local tsunami source parameters of the Quanzhou fault were used to simulate the tsunami propagation and inundation of Putian. The fault parameters of this source are listed in Table 1, and the epicenter is shown in Figure 1a. The earthquake parameters of this source fit the upper bound magnitude of this region within the definition of the Seismic Ground Motion Parameters Zonation Map of China [27]. In addition, the geological tectonic characteristics and the historical earthquakes are both considered [9]. The earthquake parameters were determined using the empirical relationships supplied by Papazachos et al. [28]. Ren et al. [18] used a rake angle of 90° and assumed the tsunami source was on a thrust fault. However, when estimating the rake angle in this study, we considered the rake angle of 172.75° calculated by Liu and Ding [29] and the tsunami risk assessment reports of the National Marine Forecasting Center. The rake angle was set as 150°, which is consistent with the Littoral Fault dominated by the dextral strike-slip fault plane.

3. Materials and Methods

3.1. High-Resolution Tsunami Inundation Model

In this paper, a high-resolution numerical model, the Cornell multi-grid coupled tsunami model (COMCOT), is applied to simulate tsunami propagation and inundation. Multiple tsunami-generating mechanisms, for example, transient fault rupture, landslides, and water surface turbulence, can be adopted in this model to trigger the initial disturbance field. Okada’s [30] model is used to calculate the seafloor deformation and initial tsunami surface elevation. Linear and nonlinear shallow water equations in both Spherical and Cartesian Coordinates are implemented in COMCOT using the modified leap-frog finite difference method [31].
The wavelength of a tsunami is usually very large compared to water depth so shallow water equations are suitable to study tsunami evolutions. The shallow water equations are derived from the depth-averaged incompressible Navier–Stokes equations and express conservation of mass and momentum. The conservative form of shallow water equations is implemented in COMCOT to simulate the propagation. In the conservative form, the governing equations are formulated in terms of free surface fluctuation and volume fluxes. When the local tsunami propagates to the coast over the continental shelf, the tsunami wave height becomes lager as it approaches the shallow water zone, and the bottom friction becomes increasingly important. Thus, the nonlinear shallow water equations are used to compute the high-resolution simulation of the inundation area. The nonlinear shallow water equations used in the Spherical Coordinate system in the model are as follows:
η t + 1 R cos φ P ψ + φ cos φ Q = h t ,
P t + 1 R cos φ ψ P 2 H + 1 R φ PQ H + gH R cos φ η ψ   fQ   + F x = 0 ,
Q t + 1 R cos φ ψ PQ H + 1 R φ Q 2 H + gH R η φ +   fP   + F y = 0 ,
where η is the free surface elevation; R is the Earth’s radius; h is the water depth; H is the total water depth; and H = η + h . (P, Q) denotes the volume fluxes, where P = hu and Q = hv, and u and v are the depth-averaged velocities in the longitude and latitude directions. φ ,   ψ denotes the latitude and longitude of the Earth. f is the Coriolis force coefficient. Fx and Fy are the bottom friction in the longitude and latitude directions respectively and can be expressed via Manning’s formula, in which n is the Manning’s roughness coefficient:
F x = gn 2 H 7 / 3 P P 2 + Q 2 1 / 2 ,
F y = gn 2 H 7 / 3 Q P 2 + Q 2 1 / 2 .
This model has been validated using numerous historical tsunami events [32,33] and has been broadly used in tsunami-related research [34,35,36].

3.2. Model Setup and Topographic Data

A nested grid configuration with finer topographic data is necessary to obtain detailed tsunami information for the coast, including tsunami wave profiles and inundation for the study area [37,38]. In this paper, three nested grids are constructed in COMCOT.
Figure 1b shows the innermost computational domain of the model (Level 3), which covers the entire administrative region of Putian, with a grid resolution of 1/32 arcmin (approximately 50 m). The other two computational domains, Level 1 and Level 2 (Figure 1a), have grid resolutions of 2 and 1/4 arcmin, respectively. The explicit information about the geographic ranges of the three grids is presented in Table 2. In addition, 19-year monthly mean high tide level data for the Xiuyu sea level station (25.01° N, 119.13° E, 3.43 m) were used in the computation to consider the impact of tides on the tsunami. The governing equations for Level 1 are linear shallow water equations, whereas those for the other levels are nonlinear shallow water equations, and all the computations are conducted in the Spherical Coordinate system. The Manning’s roughness coefficient is set to 0.025.
The bathymetry data from the Earth topography (ETOPO) model were used for grid Level 1, and the Shuttle Radar Topography Mission (SRTM) data were used for grid Level 2. For the high-resolution topographic data for the study area, grid Level 3 was compiled by combining 50 m digital elevation models (DEMs), 15 m Landsat data, dam elevation data, the General Bathymetric Chart of the Oceans (GEBCO) data, and topographic data from the Putian Water Conservancy Bureau.

3.3. Numerical Model Validation

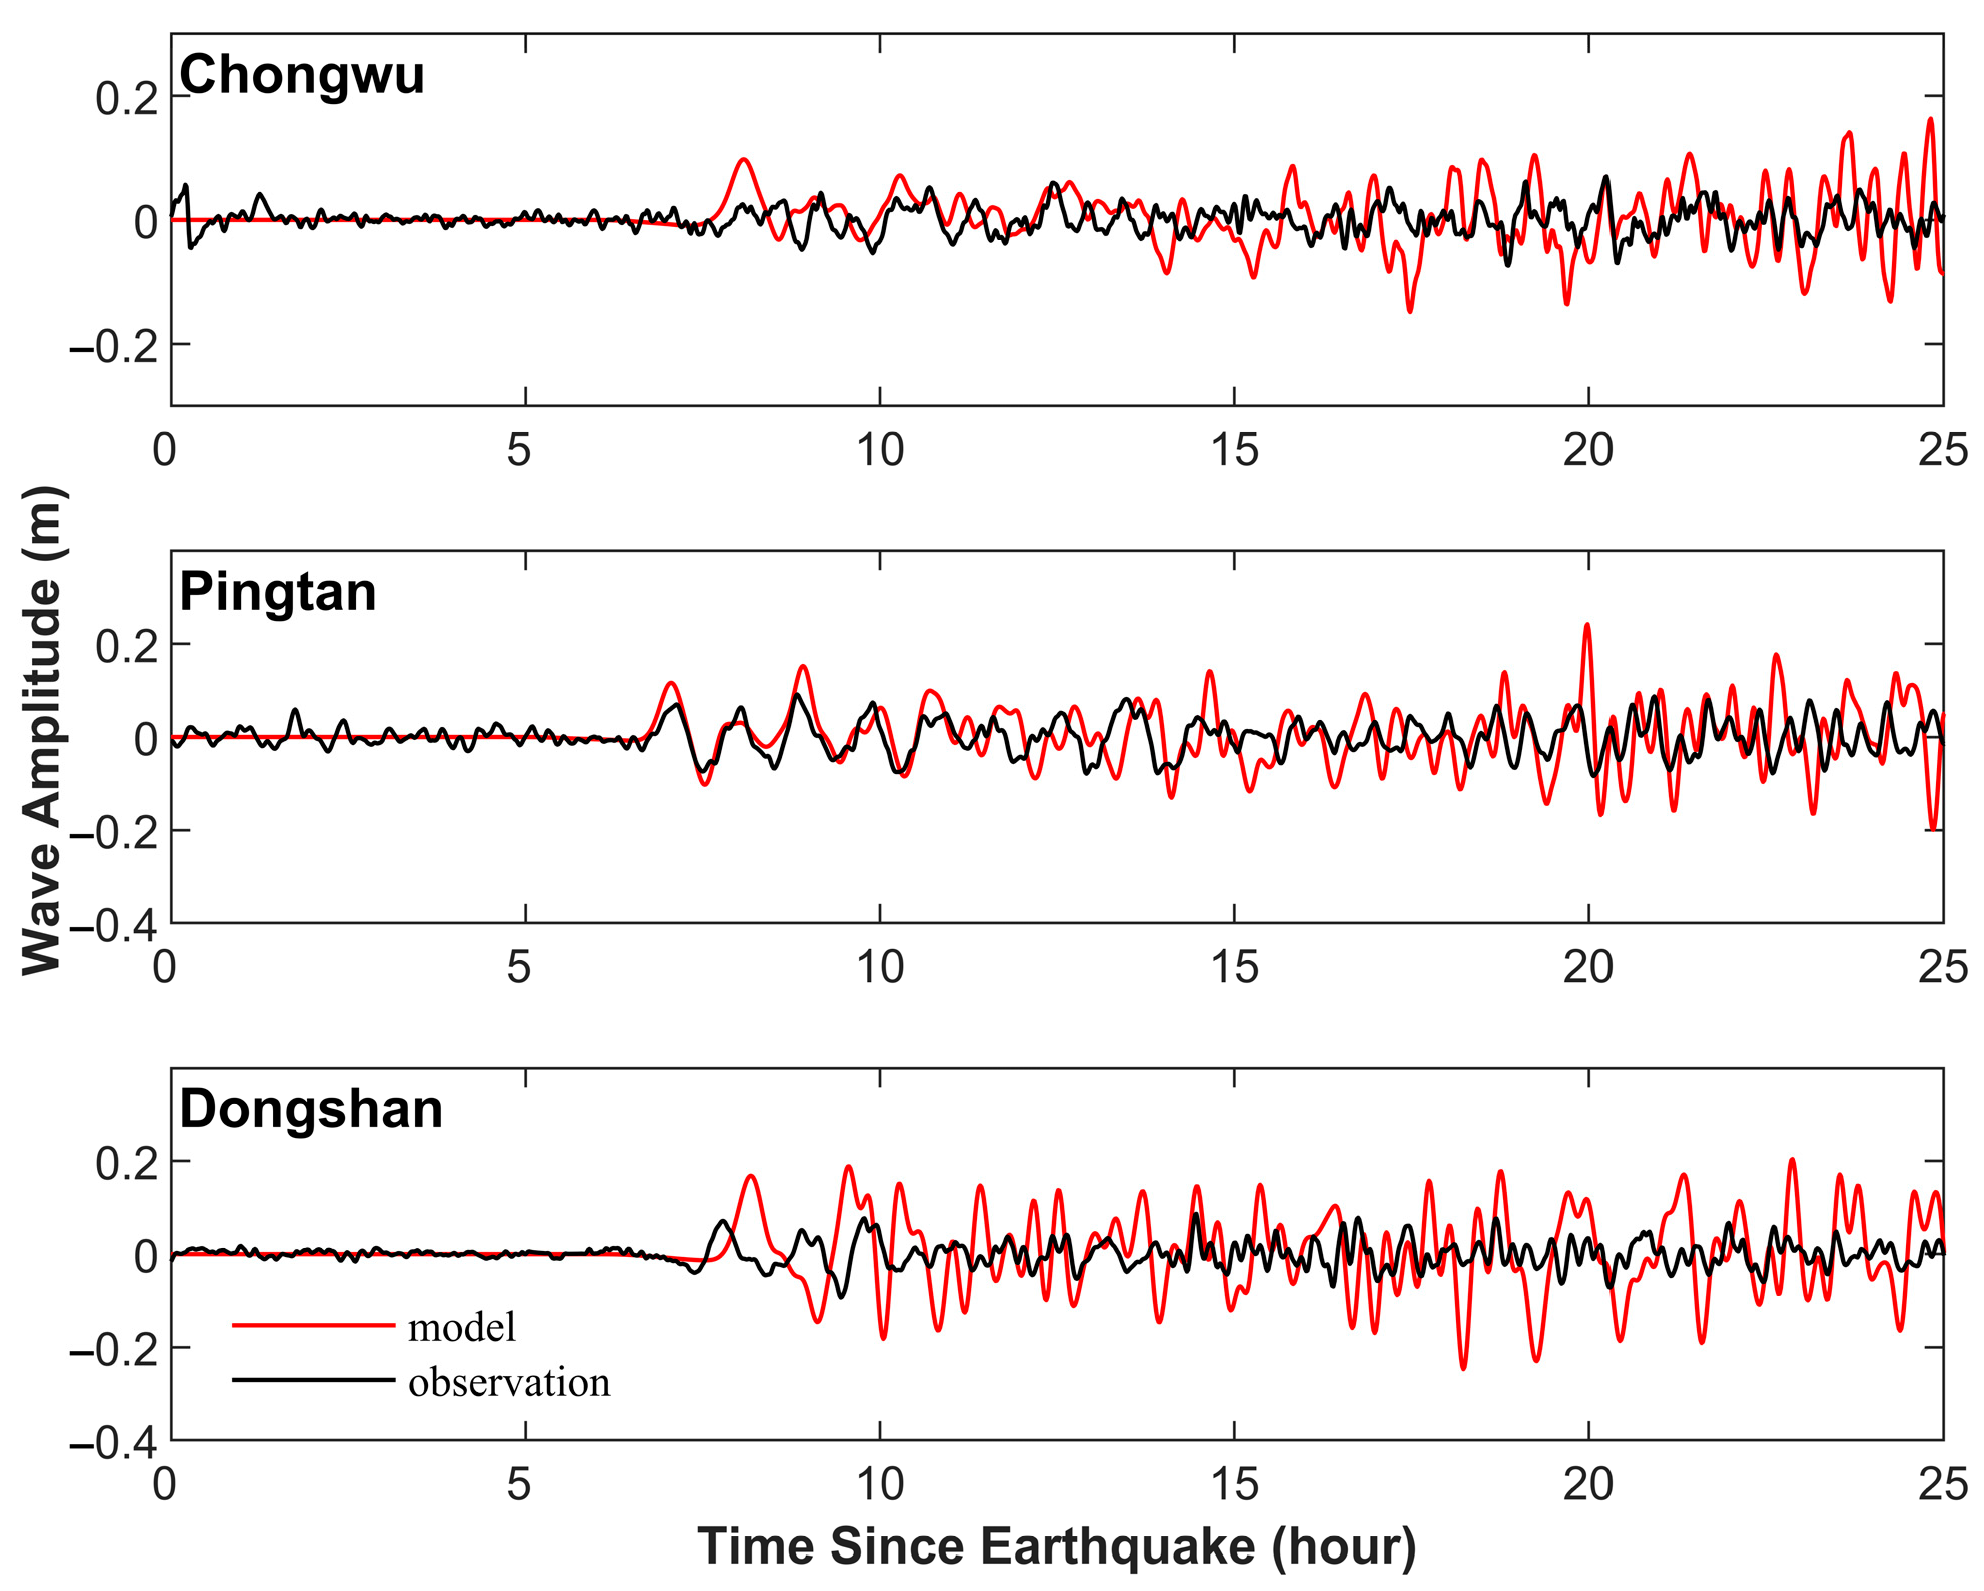
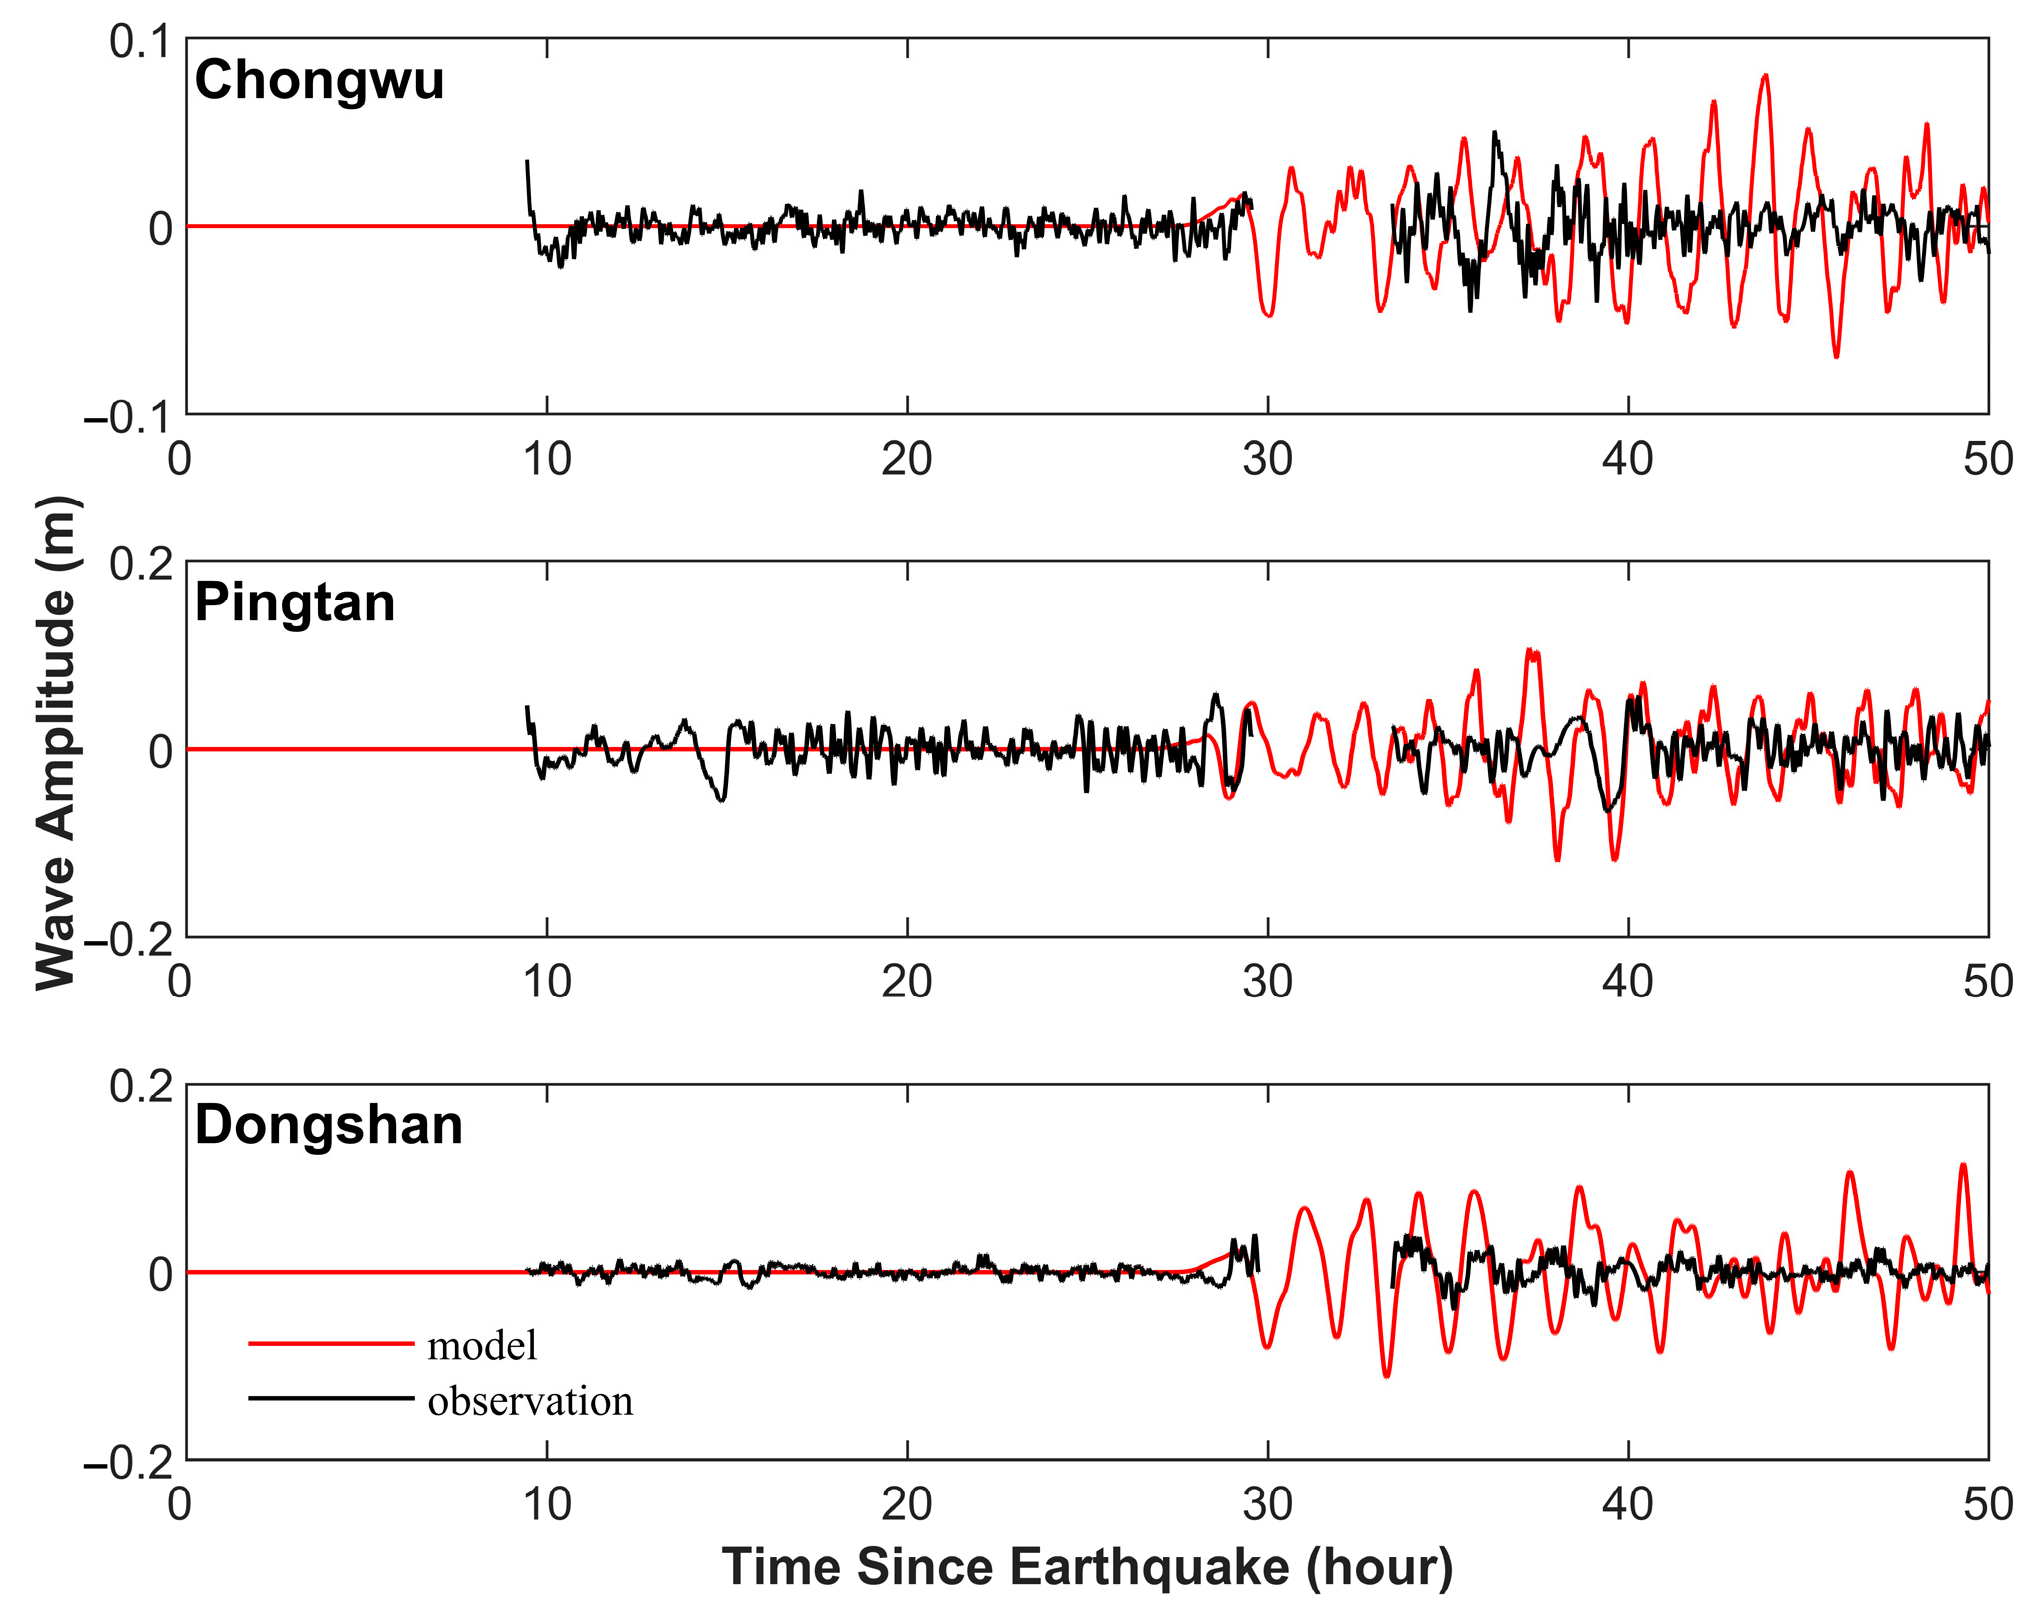
The COMCOT model was validated by comparing the observed tsunami events on 11 March 2011 in Japan and on 27 February 2010 in Chile with the model data. The measured water surface elevation and modeling results at three tidal gauges around the coast of Putian City were compared (Figure 2 and Figure 3). The geographic locations of the three tidal gauges are shown in Figure 1a. Pingtan and Chongwu stations are to the north and south of Putian, respectively. The sources of these two tsunami events were obtained from the USGS finite-fault solutions, and the Manning’s coefficient was set to 0.025. The topographic data used for the simulations were the same in this study. The computed results reproduced the observed data well, and the arrival times of the initial waves were correctly estimated by the model (Figure 2 and Figure 3). Although the modeled wave amplitudes were slightly overestimated compared to the measured data at some time points, the simulation results yielded a relative modeling error within 0.3, which is reasonable for small tsunami waves calculation. The validity of the simulation is the result of the high resolution of the nearshore topography data and the good estimation of the earthquake parameters.

4. Numerical Results

4.1. Tsunami Wave Propagation Characteristics

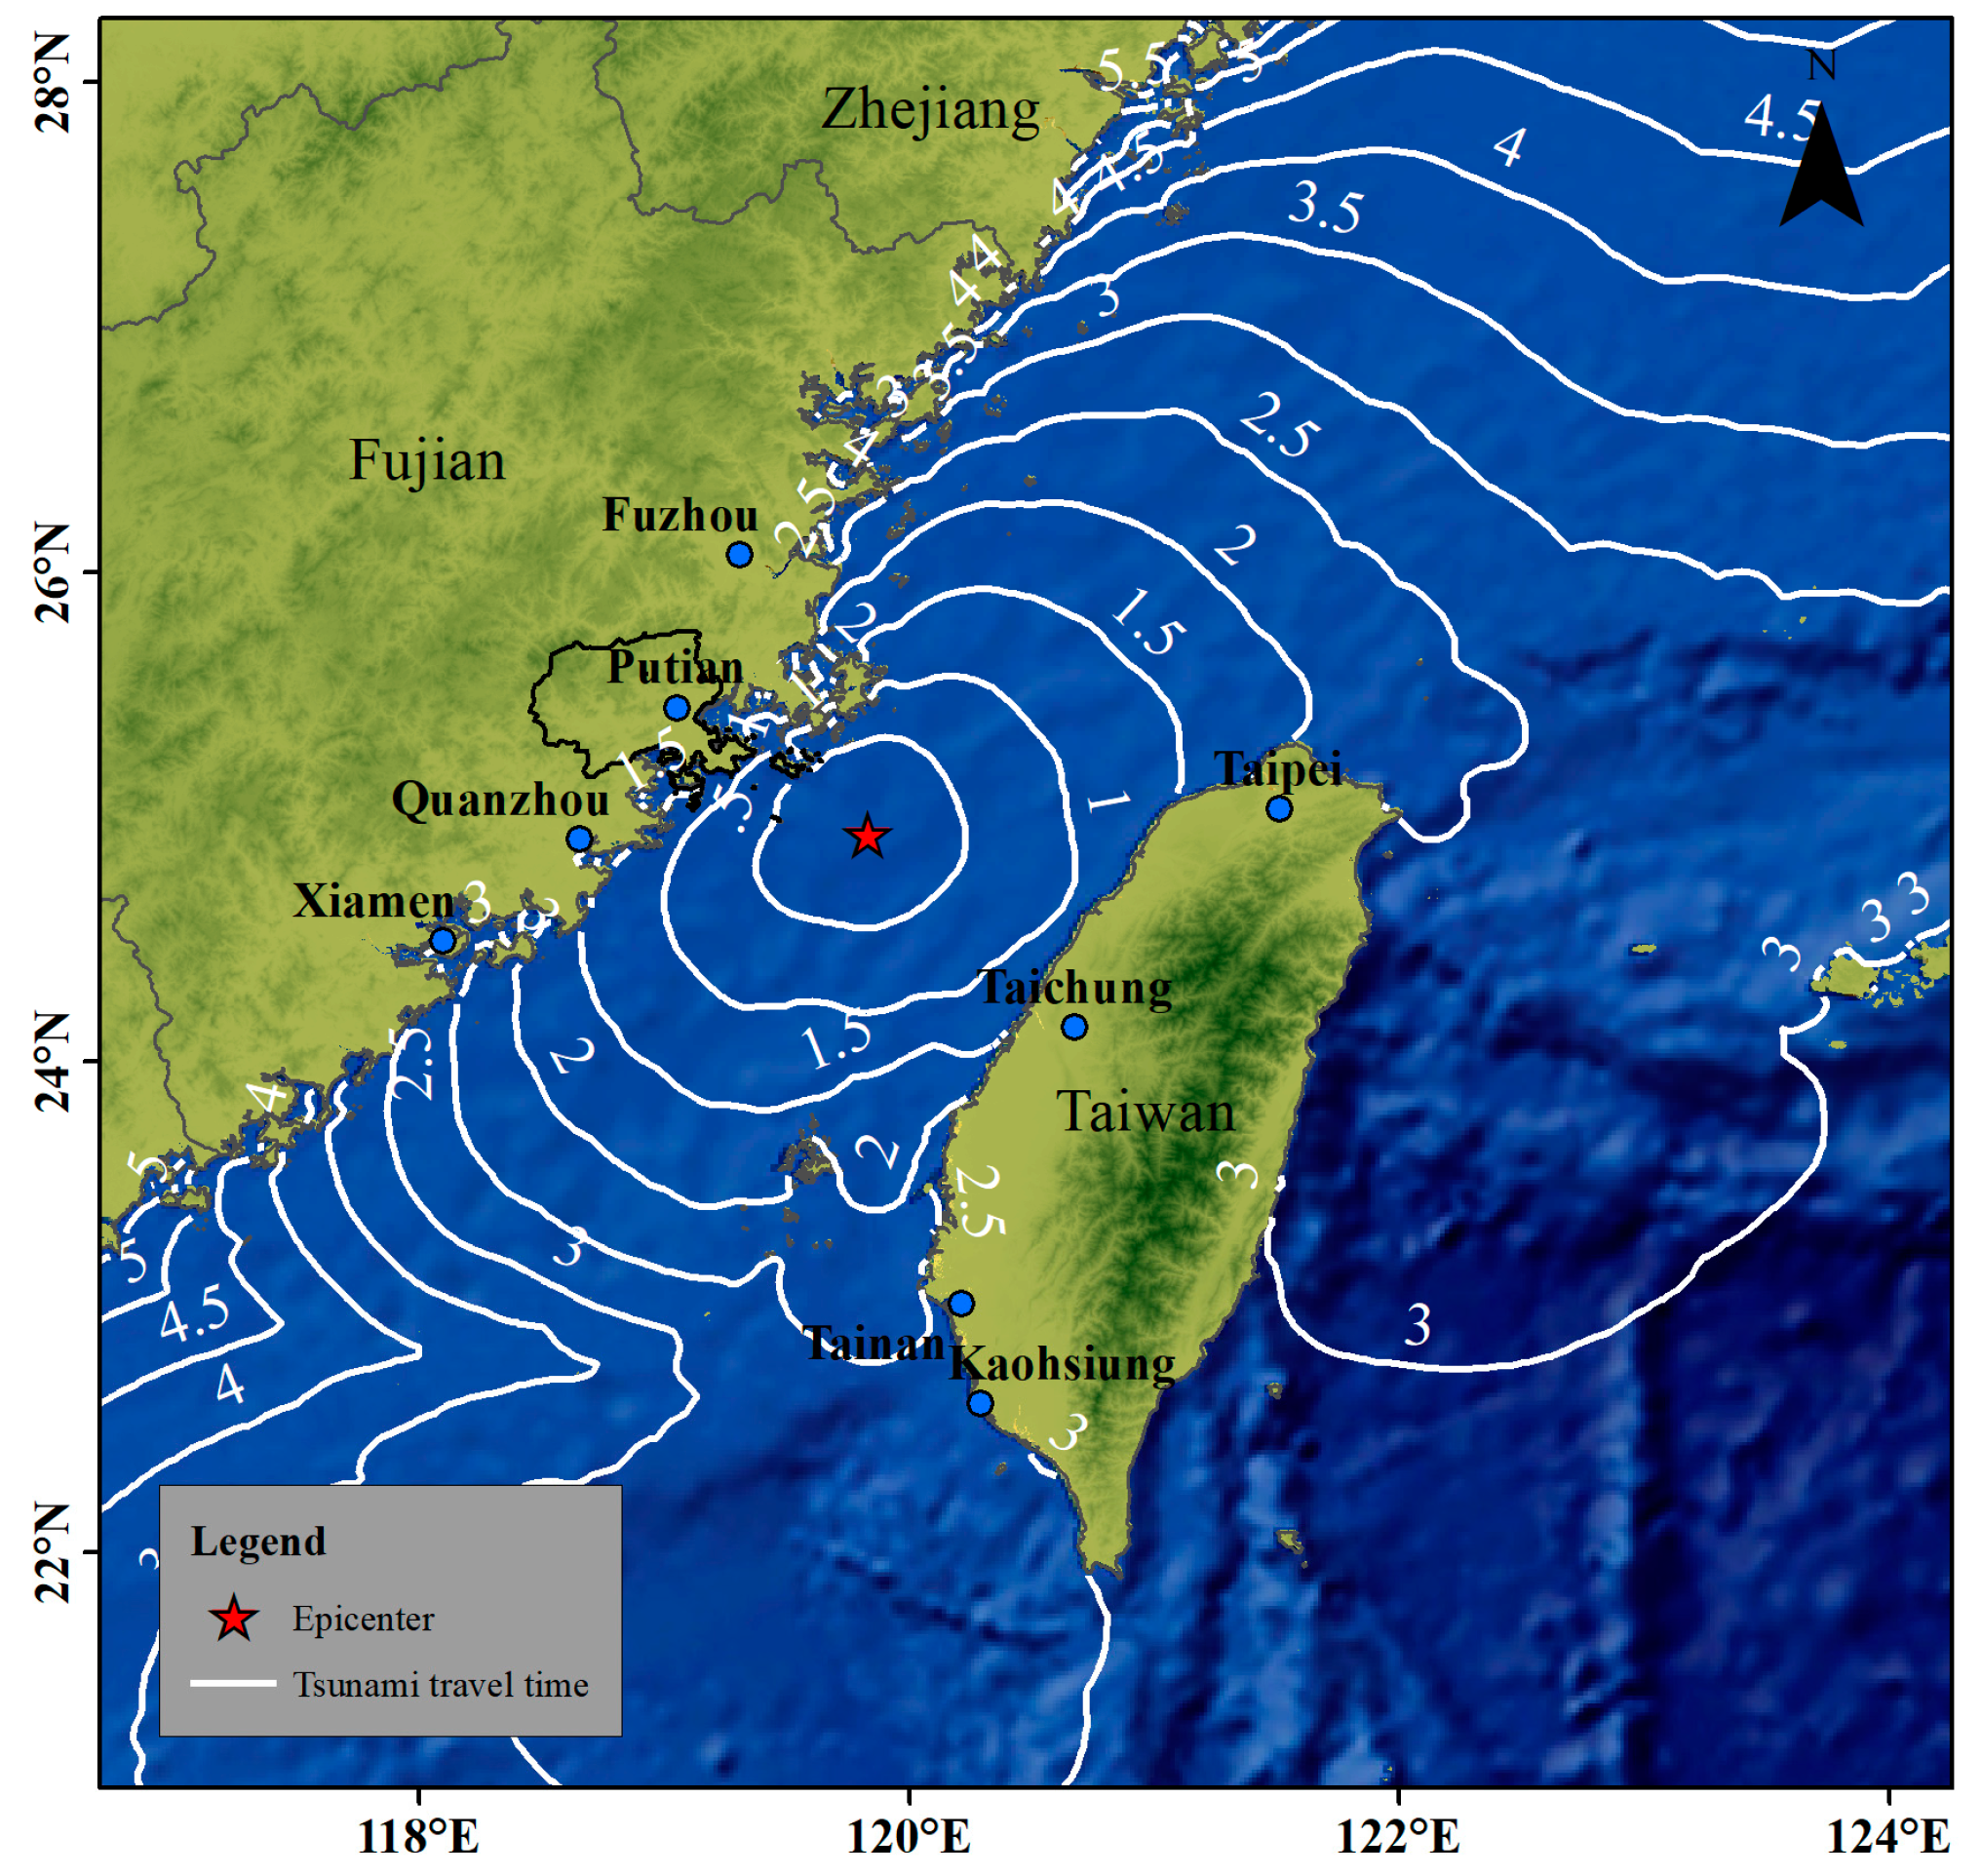
The computed spatial distribution of the Quanzhou tsunami was shown to analyze the tsunami propagation characteristics and the hazard risk to Putian. The tsunami travel time was calculated using the Tsunami Travel Time (TTT) model. This model was developed by Paul Wessel, Geoware [39]. As shown in Figure 4, the tsunami wave will hit the nearest coast of Putian 0.5 h after the earthquake occurs and will take at most 5.0 h to spread over the entire coast of Fujian Province. The fastest arrival time is 1.5 h at Taiwan Island. The tsunami wave will propagate to all Putian shorelines within 2.0 h due to the short distance.
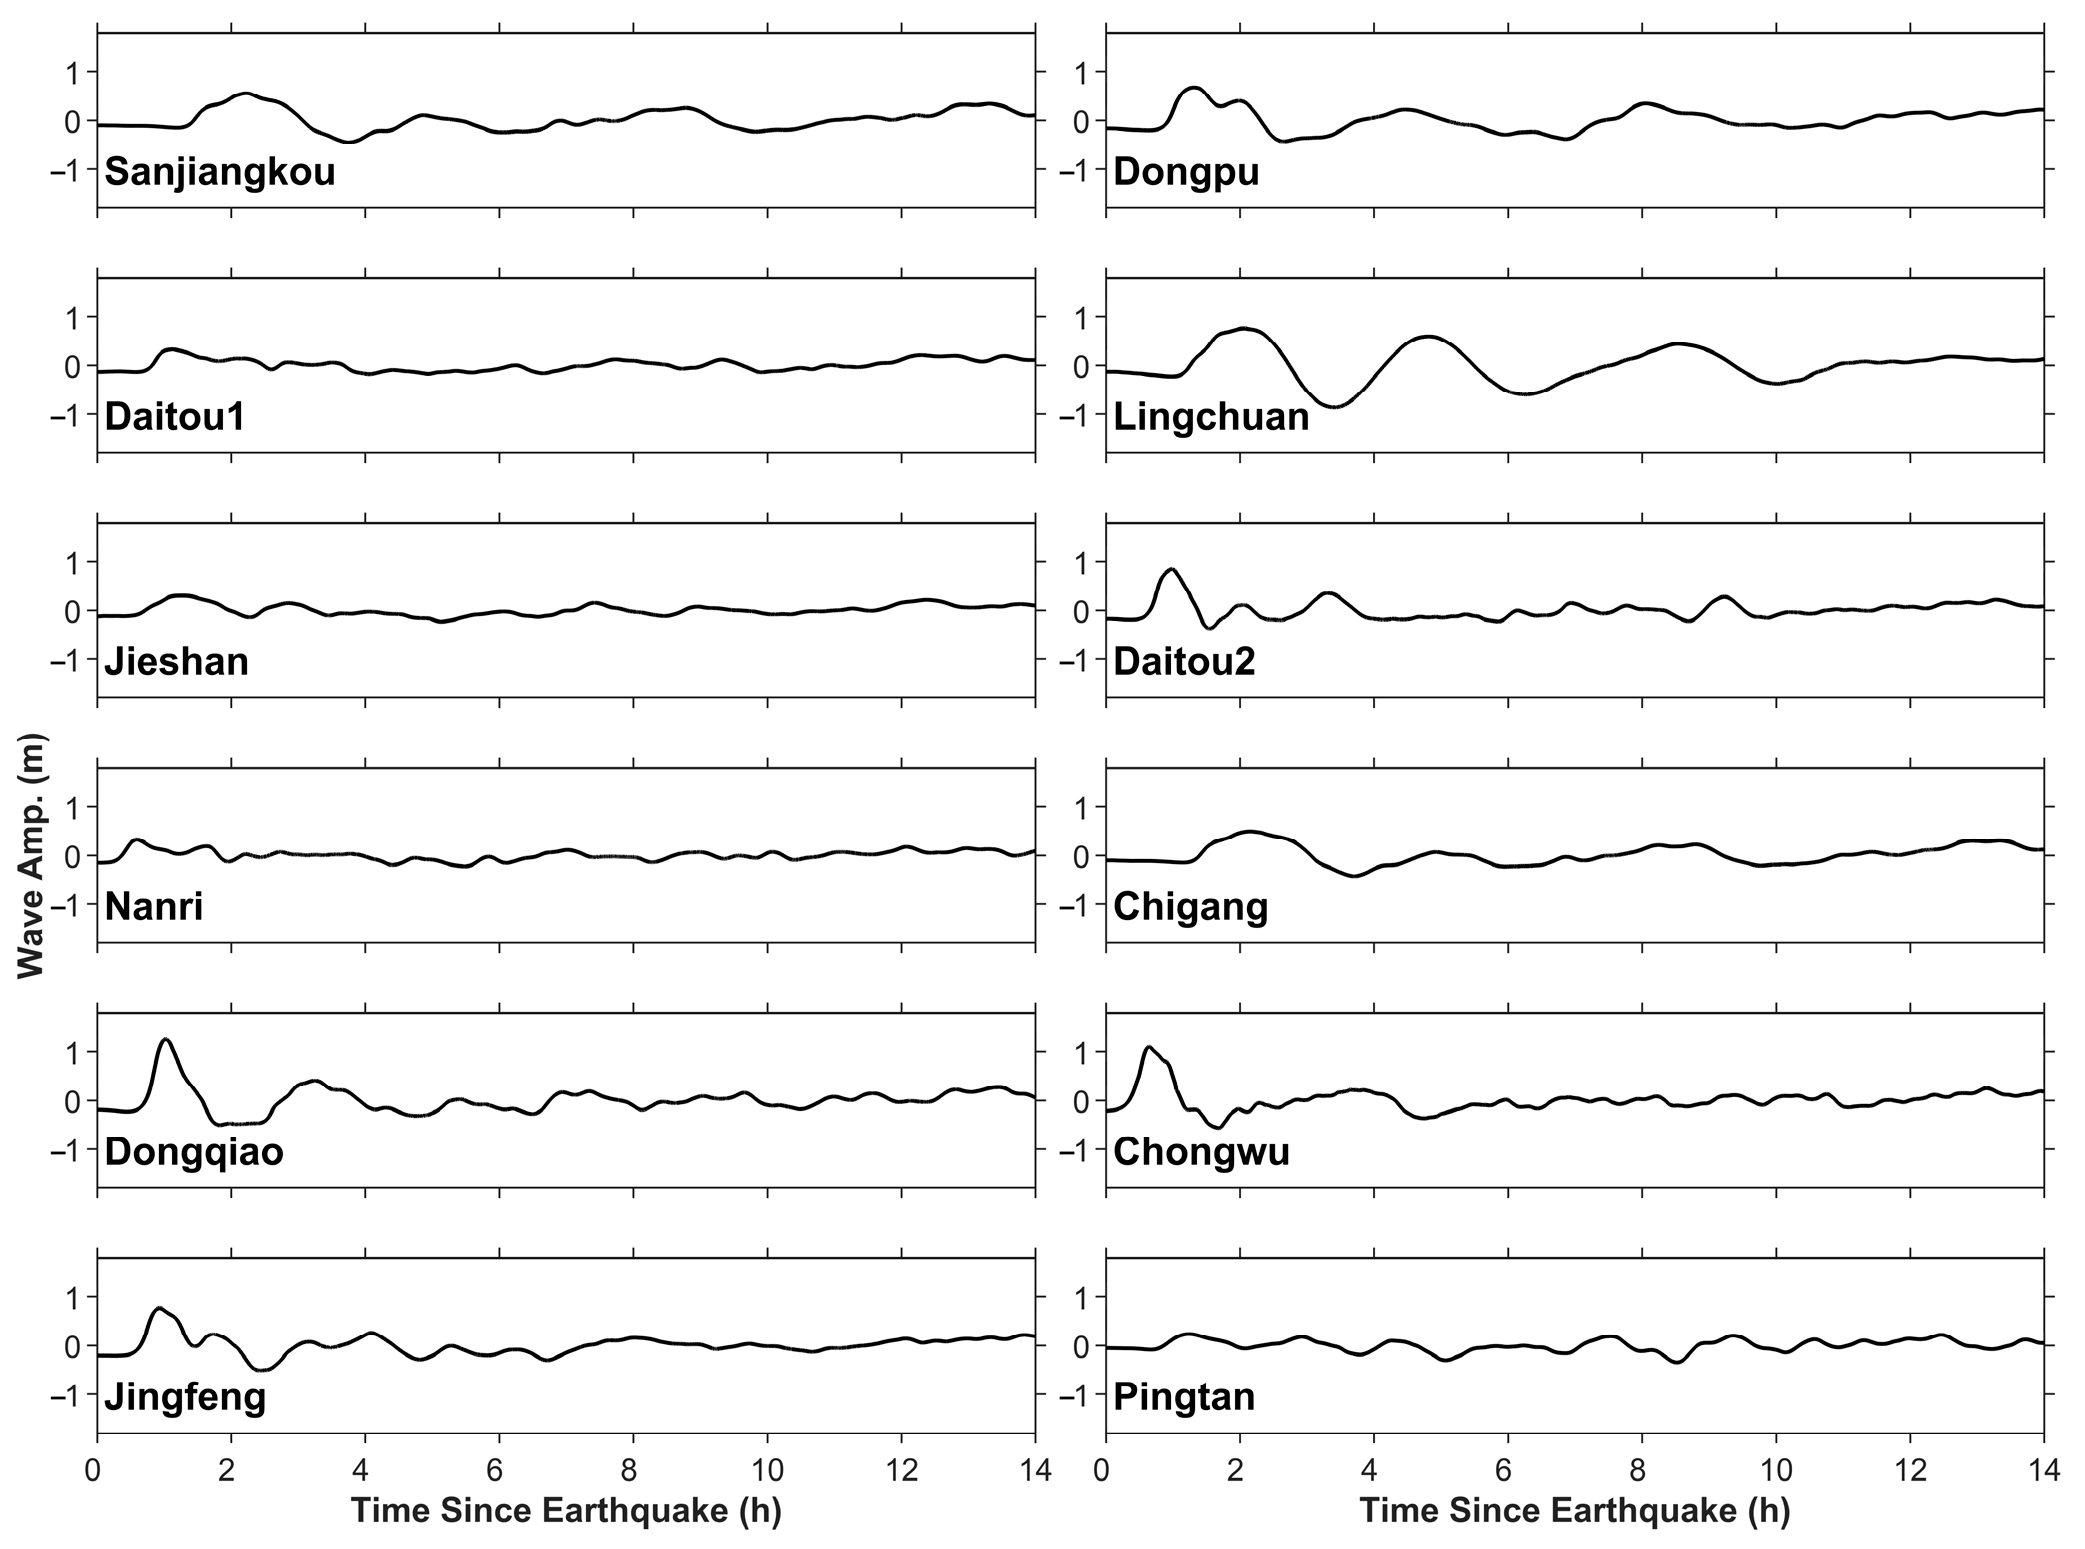
A total of 10 evenly distributed virtual gauges around Putian (Figure 1b), and the Pingtan and Chongwu tide gauges (marked in Figure 1a), were selected to analyze the tsunami propagation features along the entire Putian coastline. The surface wave elevation time series for the 12 sites is shown in Figure 5. The largest maximum wave amplitude reaches 1.4 m at the Dongqiao site (Pinghai Bay), which is located in the middle of the Putian coastline. The other sites will experience maximum wave amplitudes of about 1.0 m on average, apart from the sites which are out of the main tsunami propagation direction. As shown in Figure 5, it will take approximately 2.0 h for the maximum tsunami waves to arrive at the Lingchuan and Chigang sites (Meizhou and Xinghua Bay), which are located on the innermost coast of Putian. After the first tsunami wave arrives at these two sites, the tsunami waves maintain their resilience during the following hours (Figure 5). This may be because the tsunami waves induce wake oscillation in a local region, such as the mouth of the bay.
The fault strike of the Quanzhou source is northeast, and the main tsunami energy propagation direction is toward the Putian coast. A local tsunami can have a direct hazard impact on the coastal area in a short period of time when the nearest coastline is parallel to the main fault zone rupture direction. According to the computation results, the maximum tsunami wave amplitude in Putian is approximately 2.0 m and is concentrated south of Daitou and on the inner coast of Pinghai Bay (Figure 6). However, under the protection of the seawall, there is not a massive inundation area on the coast of Pinghai Bay. The tsunami impact will rapidly weaken when the propagation direction deviates. For example, at the Nanri site and Pingtan tide gauge station, which are located in the northern part of Putian, the maximum tsunami wave amplitude tends to be less than 0.5 m (Figure 5).

4.2. Sensitivity of Seismic Parameters of Local Tsunami Source

The focal mechanism solutions of the local tsunami source have a great influence on the tsunami hazard in the coastal area. A uniform rake may lead to an underestimation with an equivalent magnitude of about 0.3–0.4 compared with a non-uniform rake distribution for the numerical potential inundation results [20]. Even for the same tsunami source, the inundation can be very different for various rake distributions when the other focal parameters are the same [20]. Therefore, we analyzed the sensitivities of the tsunami wave amplitude distribution and inundation extent in the assessment area by altering the earthquake parameters (strike and rake angle) of the Quanzhou fault. The cases of the sensitivities of a non-uniform rake distribution and dip angle were not taken into account. Huang and Wang [40] analyzed the dip angle of the 1604 Mw 8.0 earthquake off the coast of Quanzhou, which was very close to the location and upper bound magnitude of the potential Quanzhou source in this study. They determined that the dip angle of the 1604 earthquake was 54° based on the steep dip angle of the fault zone in the Quanzhou Sea, and this is consistent with the occurrence dip angle (50°–60°) of the active faults in the Nanri and Meihzou Islands near the epicenter. This is basically consistent with the dip angle of 60° reported by Ren et al. [18]. Hence, it is reliable to use this dip angle in this study, and sensitivity analysis was not performed. Based on the isoseismic lines and the tectonic structure of the area, Liu and Ding [29] reported the fault strike in the Quanzhou Sea to be 38°. This is consistent with the strike angle of 30°–50° proposed by Huang and Wang [40]. The strike angle was reported to be 65° by Ren et al. [18]. Thus, the strike angles of 30°, 40°, 50°, and 60° were used in the sensitivity study. Liu and Ding [29] obtained a rake angle of 172.75° according to the strike and dip angles of the two nodal planes of the hypocenter. Considering the focal parameters used in the tsunami risk assessment conducted by the National Marine Environmental Forecasting Center, we set the rake angle to 150°, 160°, and 170°. Therefore, seven scenarios were selected for use in the sensitivity study. The details are presented in Table 3.
In this study, 300 virtual points were selected along the offshore of Putian. Each point was set at the water grid point nearest to the coast (Figure 7), and the coastal tsunami amplitude distributions were analyzed. Figure 8 shows the tsunami wave amplitudes at these points from the westernmost to the easternmost along the shoreline. It can be seen from Figure 8 that the maximum tsunami amplitude of the Rake170 scenario is the smallest, and the maximum tsunami amplitude of the Rake150 scenario is the largest. It can be understood that the larger the vertical displacement of the fault, the greater the tsunami wave amplitude.
In terms of the strike angle, the larger the strike angle, the larger the maximum wave amplitude. However, the maximum tsunami amplitude is more sensitive to the change in the rake angle. When the rake angle or the strike angle changes by 20°, the change in the maximum tsunami amplitude caused by the rake angle is about 1.0 m, while that caused by the strike angle is only about 0.2 m. In all cases, the maximum tsunami amplitude was the largest near the coast of Pinghai Bay.

4.3. Tsunami Inundation Modeling of Putian City

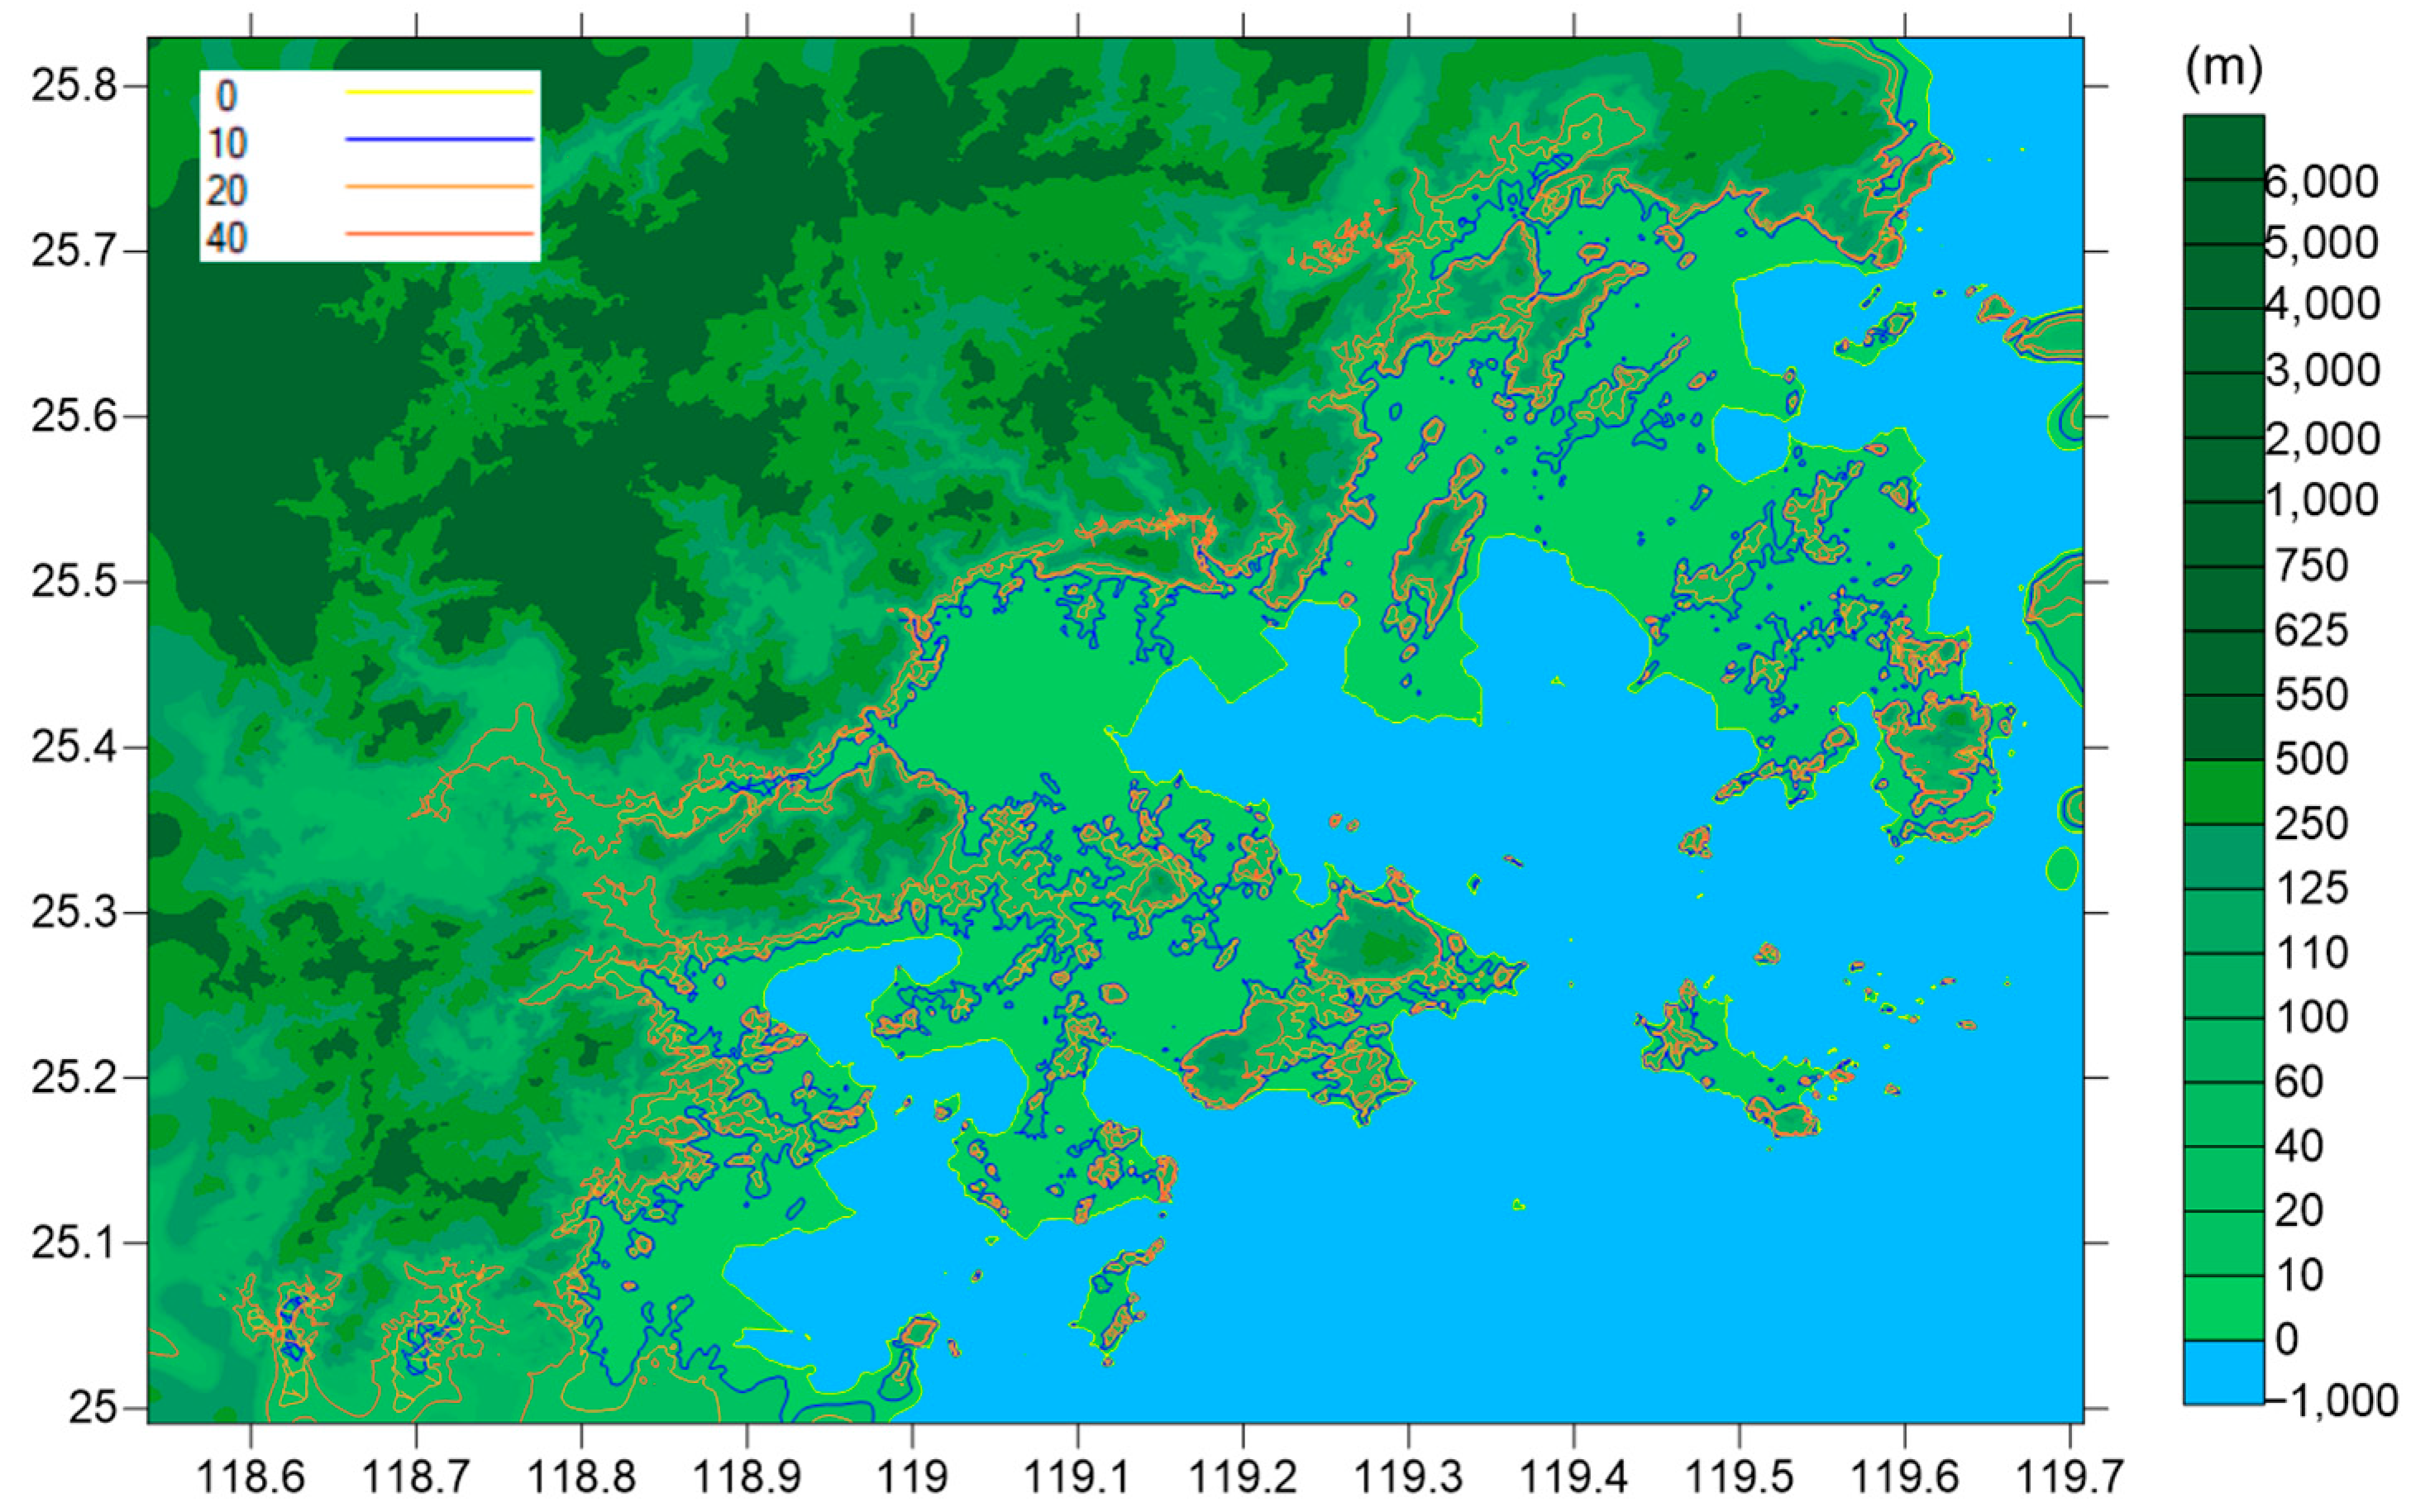
The tsunami inundation was analyzed under all scenarios. Putian has a low and wide terrain, with an average altitude of about 50.0 m, which makes it easy for inundation to occur (Figure 9). The nearshore topography of Putian City is complicated. The shoreline has a serrated shape and a total length of about 220.0 km. The computed results revealed that the inundated area tends to be quite different under the different tsunami scenario, ranging from 50 km2 to more than 100 km2. In all scenarios, the largest inundation area was concentrated in the Xiuyu District (one of the districts of Putian), accounting for nearly the total inundation area in Putian.
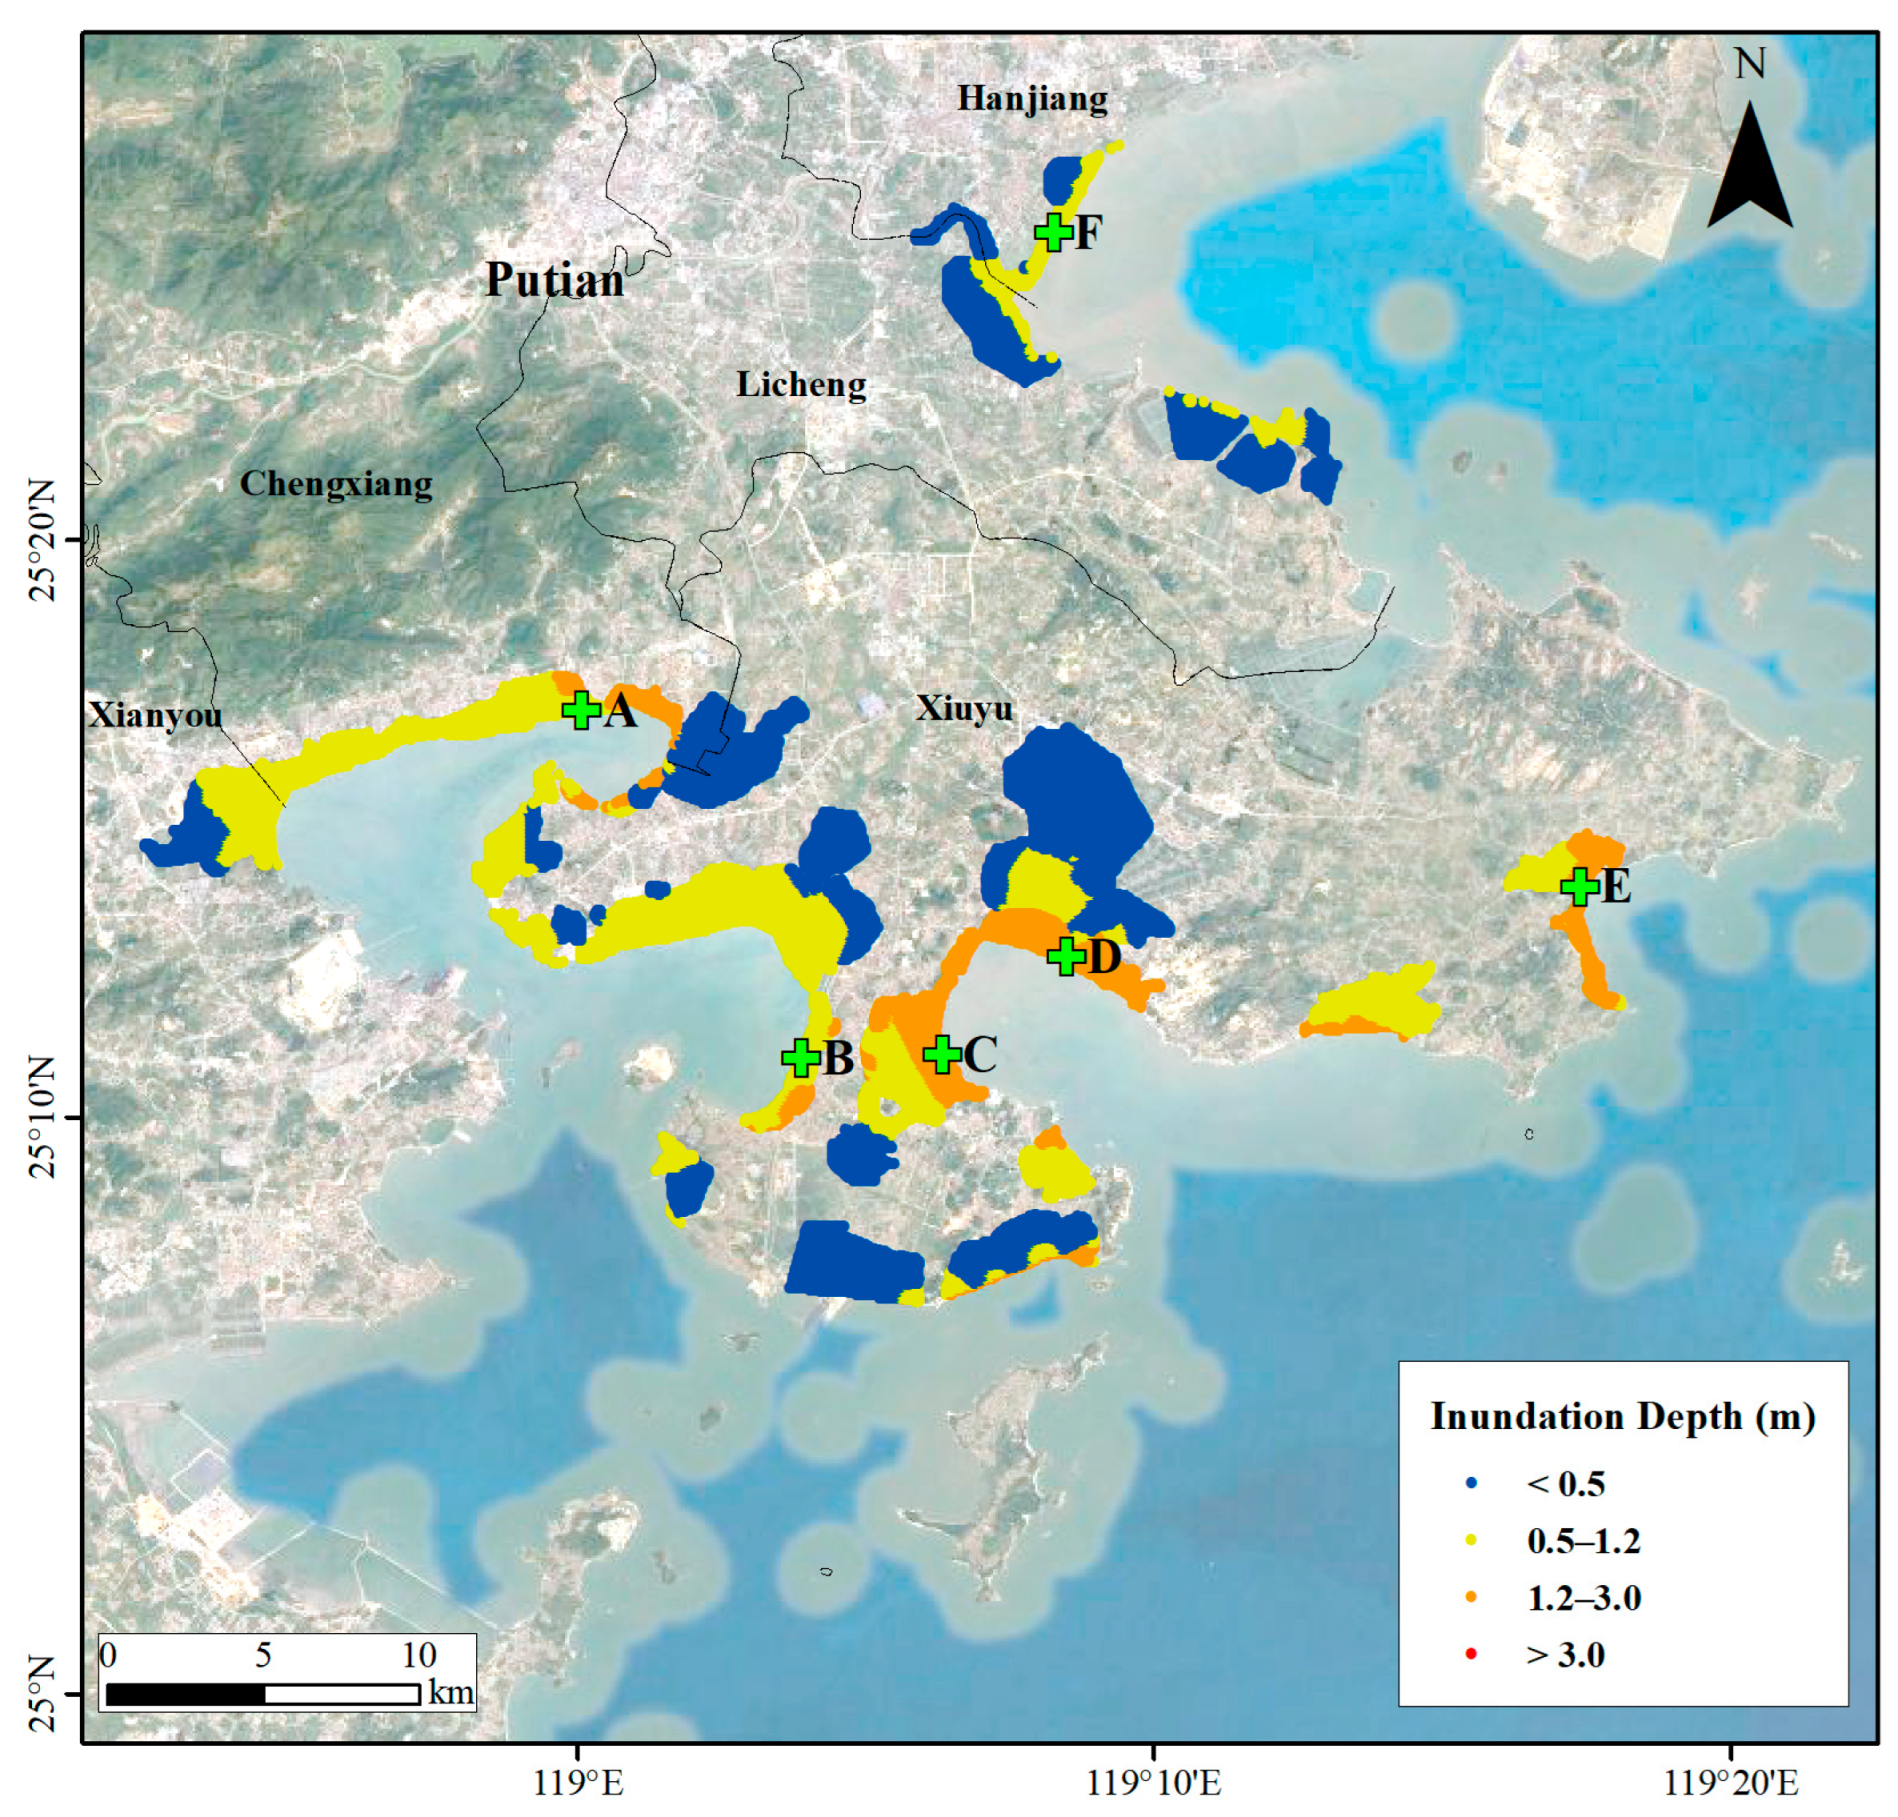
The tsunami inundation depth was used to classify the tsunami hazard level. According to the Technical Directives for Tsunami Risk Assessment and Zoning of China [41], there are four tsunami hazard levels. The highest level is Level 1, with a tsunami inundation depth of >3.0 m; and the lowest level is Level 4, with an inundation depth of <0.5 m. Figure 10 shows the model computed inundation map for Putian for the Rake150 scenario. As shown in Figure 10, the majority of Putian has a tsunami hazard level of Levels 3 (0.5–1.2 m) and 4 (<0.5 m). There are no areas with inundation depths > 3.0 m, and most of the Level 2 areas are concentrated in the Xiuyu District, which is close to the open sea.
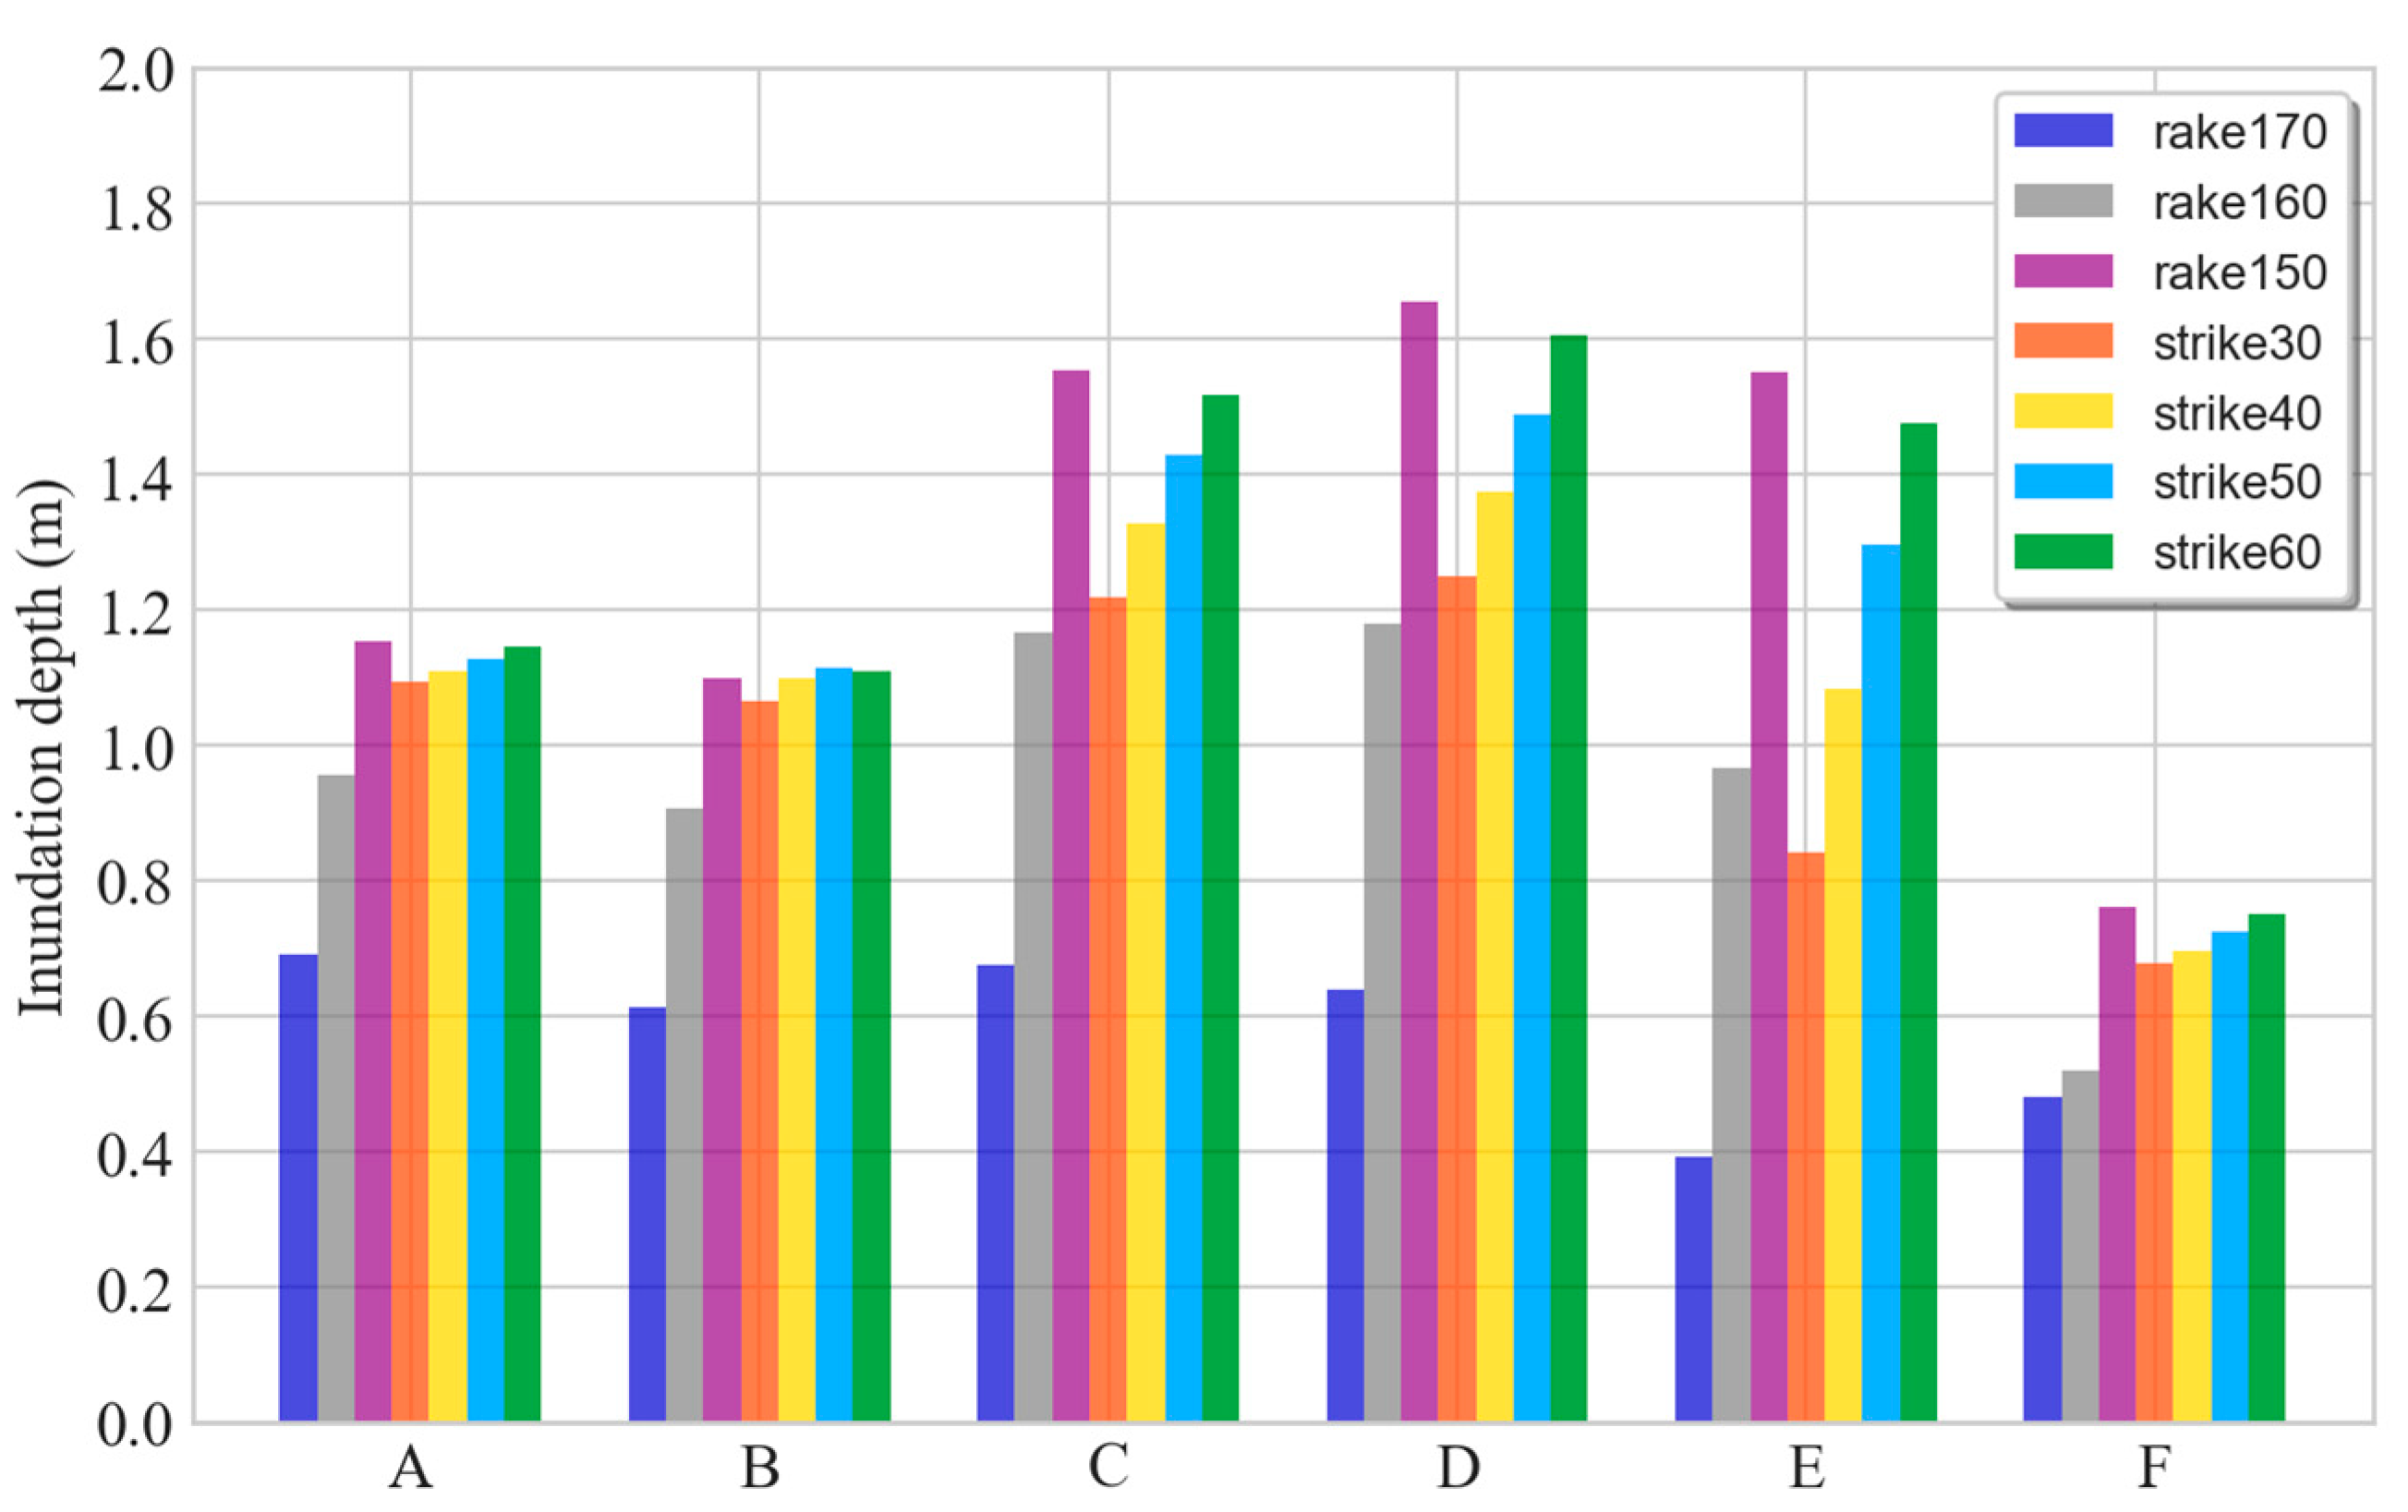
Figure 11 shows the inundation depths at six representative locations (marked in Figure 10) under each scenario. The distribution of the inundation depth is consistent with that of the tsunami wave amplitude (Figure 11). The inundation depth on the coast of Putian is the smallest when the rake angle is 170° and is the largest when the rake angle is 150°. In general, the factors that affect the inundation of a local tsunami primarily depend on the relative positions of the earthquake epicenter and the assessment area. In all scenarios, the inundation depths in locations C, D, and E (in the Xiuyu District) are generally larger than that at other locations. This is mainly because the propagation direction of the tsunami energy directly points to this region. The tsunami inundation is also closely related to the earthquake parameters. The tsunami inundation is more sensitive to the rake angle than the strike angle, and a change in one of these angles can significantly change the inundation area.
There are many coastal agricultural fields and salt and fishery fields along the coastline of Putian, as well as a large number of fishery related operations and boats nearshore. These facilities will be seriously damaged if a local tsunami such as the Quanzhou event occurs. The gaps in the coastal protection structures in the assessment area are also a factor leading to the relatively serious inundation.

5. Discussion

A potential local tsunami source near Quanzhou, located on the Littoral Fault, was used in this study to carry out tsunami hazard and sensitivity analysis for the coast of Putian City, Fujian Province. The following opinions regarding the impact of the local tsunami hazard on the coastal region are presented.
  • Detailed marine geophysical surveys are required to better understand the geometrical characteristic parameters of the fault. It is still impossible to accurately forecast the focal mechanism and parameters of each potential tsunami source, for example, the slip distribution of a seismic source. The rupture complexity may increase the uncertainty in the evaluation of the local tsunami hazard. For a local tsunami event, it was demonstrated in this study that for the scientific uniform rupture distribution of an identical tsunami source, a slight change in the rake or strike angle can change the tsunami wave amplitude by several tens of centimeters and the flooding area of the assessment area by tens of square kilometers. Thus, the precise rupture parameters are one of the highly required data for local tsunami risk assessment.
  • The relative geographic positions, distance between the tsunami source and the site of interest are also important factors that determine the level of the local tsunami hazard and the tsunami travel time. Local tsunamis are more susceptible to the topography of the coastal environment. The coastal terrain of China is complicated, comprising estuary, bay, plain, and steep areas. Even within the same city, the local tsunami hazard mitigation measures at different coastal sites can be very different. Thus, it is necessary to conduct refined local tsunami hazard assessment and emergency response plans for high-risk cities in order to reduce disaster losses to the maximum extent possible.
  • At the same time, a high-resolution grid model and coastal seawall-like structures data could help to get more accurate tsunami inundation calculations. In this study, the inundation simulation will be improved when higher resolution grid data is obtained. Tsunami inundation easily occurs into the low lands if there are no consecutive protections that are high enough along the coastlines. Many gaps in the seawall structures and the low coastal terrain are the reasons for the relatively serious inundation induced by local tsunamis in Putian City.

6. Conclusions

This study investigated the potential local tsunami effect on Putian City. A tsunamigenic Mw 8.0 earthquake offshore of Quanzhou and a sensitivity test were presented. The high-resolution tsunami inundation model used in this study has been validated and has consistently been reported to have a reliable performance. The modeling results showed that the maximum tsunami hazard level in Putian is Level 2, with an inundation depth of less than 3.0 m. Most of the inundation areas under each scenario were concentrated in the Xiuyu District, which is in the main direction of tsunami propagation. The computational results showed that tsunami amplitude and inundation were quite sensitive to the earthquake parameters of the Quanzhou fault, particularly the rake and strike angles.
Tsunamis induced by the active seismic fault could result in serious tsunami inundation locally. Since the emergency response time for local tsunamis for decision-making authorities is very limited (sometimes only half an hour or less), compared with regional and distant tsunamis, local tsunamis present more challenges in tsunami early warning and mitigation. Thus, the refined local tsunami hazard assessment and contingency plans for coastal cities considering more scenarios in each potential tsunami source are suggested to save emergency response time, avoid waste of social resources, and to be a proper reference for city planning and coastal structures design for disaster prevention.

Author Contributions

Conceptualization, T.F. and P.W.; methodology, T.F.; software, T.F. and J.H.; validation, T.F.; formal analysis, T.F.; investigation, Z.X.; resources, L.Z.; writing—original draft preparation, T.F.; writing—review and editing, P.W., J.H., and Y.W.; visualization, T.F. and Y.G.; supervision, P.W. and J.H. All authors have read and agreed to the published version of the manuscript.

Funding

This research was funded by the National Key R&D Program of China under contract (No. 2022YFC3003804) and the China–Indonesia Marine and Climate Center Development (No. 121152000000210003).

Institutional Review Board Statement

Not applicable.

Informed Consent Statement

Not applicable.

Data Availability Statement

The data are available upon request from the corresponding author.

Acknowledgments

The authors would like to thank the reviewers who made constructive suggestions throughout the review process. Many thanks to the Putian Water Conservancy Bureau for providing the topographic data.

Conflicts of Interest

The authors declare that there are no conflict of interest.

References

  1. Mak, S.; Chan, L.S. Historical tsunamis in South China. Nat. Hazards 2007, 43, 147–164. [Google Scholar] [CrossRef]
  2. Ren, Y.F.; Wen, R.Z.; Song, Y.Y. Recent progress of tsunami hazard mitigation in China. Episodes 2014, 37, 277–283. [Google Scholar]
  3. Kirby, S.; Geist, E. Great Earthquake Tsunami Sources: Empiricism and Beyond; USGS Tsunami Sources Workshop: Menlo Park, CA, USA, 2006. [Google Scholar]
  4. Yuan, Y.; Li, H.; Wei, Y.; Shi, F.; Wang, Z.; Hou, J.; Wang, P.; Xu, Z. Probabilistic Tsunami Hazard Assessment (PTHA) for Southeast Coast of Chinese Mainland and Taiwan Island. J. Geophys. Res. Solid Earth 2021, 126, e2020JB020344. [Google Scholar] [CrossRef]
  5. Liu, P.; Wang, X.M.; Salisbury, A.J. Tsunami hazard and early warning system in South China Sea. J. Asian Earth Sci. 2009, 36, 2–12. [Google Scholar] [CrossRef]
  6. Zhao, X.; Jiang, Y.P.; Ren, Z.Y.; Liu, H. Historical tsunami records and potential tsunami scenarios near Haikou coastal region. Nat. Hazards 2017, 89, 625–645. [Google Scholar]
  7. Qiu, Q.; Li, L.L.; Hsu, Y.J.; Wang, Y.; Chan, C.H.; Switzer, A.D. Revised earthquake sources along Manila trench for tsunami hazard assessment in the South China Sea. Nat. Hazards Earth Syst. Sci. 2019, 19, 1565–1583. [Google Scholar]
  8. Li, L.L.; Qiu, Q.; Li, Z.G.; Zhang, P.Z. Tsunami hazard assessment in the South China Sea: A review of recent progress and research gaps. Sci. China Earth Sci. 2022, 65, 783–809. [Google Scholar]
  9. Yang, Z.B. Probabilistic Tsunami Hazard Analysis Alone Chinese Coast. Master’s Thesis, China Earthquake Administration, Institute of Engineering Mechanics, Harbin, China, 2015. (In Chinese). [Google Scholar]
  10. Curtis, G.D.; Pelinovsky, E.N. Evaluation of tsunami risk for mitigation and warning. Sci. Tsunami Hazards 1999, 17, 187–192. [Google Scholar]
  11. Zhou, Q.; Adams, W.M. Tsunami risk analysis for China. Nat. Hazards 1988, 1, 181–195. [Google Scholar]
  12. Grezio, A.; Babeyko, A.; Baptista, M.A.; Behrens, J.; Costa, A.; Davies, G.; Geist, E.L.; Glimsdal, S.; González, F.I.; Griffin, J. Probabilistic tsunami hazard analysis: Multiple sources and global applications. Rev. Geophys. 2017, 55, 1158–1198. [Google Scholar] [CrossRef] [Green Version]
  13. Horspool, N.; Pranantyo, I.; Griffin, J. A probabilistic tsunami hazard assessment for Indonesia. Nat. Hazard Earth Sys. 2014, 14, 3105–3122. [Google Scholar] [CrossRef] [Green Version]
  14. Burbidge, D.; Cummins, P.R.; Mleczko, R.; Thio, H.K. A probabilistic tsunami hazard assessment for Western Australia. Pure Appl. Geophys. 2008, 165, 2059–2088. [Google Scholar] [CrossRef] [Green Version]
  15. Selva, J.; Lorito, S.; Volpe, M.; Romano, F.; Tonini, R.; Perfetti, P.; Bernardi, F.; Taroni, M.; Scala, A.; Babeyko, A.; et al. Probabilistic tsunami forecasting for early warning. Nat. Commun. 2021, 12, 1–14. [Google Scholar]
  16. Chock, G.Y.K.; Carden, L.; Robertson, I.; Wei, Y.; Wilson, R.; Hooper, J. Tsunami resilient building design considerations for coastal communities of Washington, Oregon, and California. J. Struct. Eng. 2018, 144, 04018116. [Google Scholar] [CrossRef]
  17. Li, H.W.; Wang, Z.C.; Yuan, Y.; Xu, Z.G.; Wang, P.T.; Shi, J.Y. Probabilistic tsunami hazard assessment in the Bohai Sea. Acta Oceanol. Sin. 2019, 41, 51–57. (In Chinese) [Google Scholar]
  18. Ren, Y.; Wen, R.; Zhang, P.; Yang, Z.; Pan, R.; Li, X. Implications of local sources to probabilistic tsunami hazard analysis in south Chinese coastal area. J. Earthq. Tsunami 2017, 11, 1740001. [Google Scholar] [CrossRef]
  19. Liu, Y. Regional Characteristics of the Probabilistic Tsunami Hazard for the Southeast Coastal Area of China. Master’s Thesis, China Earthquake Administration, Institute of Engineering Mechanics, Harbin, China, 2018. (In Chinese). [Google Scholar]
  20. Mueller, C.; Power, W.; Fraser, S.; Wang, X.M. Effects of rupture complexity on local tsunami inundation: Implications for probabilistic tsunami hazard assessment by example. J. Geophys. Res. Solid Earth 2015, 120, 488–502. [Google Scholar] [CrossRef]
  21. Goda, K.; Yasuda, T.; Mori, N.; Mai, P.M. Variability of tsunami inundation footprints considering stochastic scenarios based on a single rupture model: Application to the 2011 Tohoku earthquake. J. Geophys. Res. Oceans 2015, 120, 4552–4575. [Google Scholar] [CrossRef]
  22. Zhou, Q.; Adams, W.M. Tsunamigenic earthquakes in China: 1831 BC to 1980 AD. Sci. Tsunami Hazards 1986, 4, 131–148. [Google Scholar]
  23. Hou, J.; Li, X.; Yuan, Y.; Wang, P. Tsunami hazard assessment along the Chinese mainland coast from earthquakes in the Taiwan region. Nat. Hazard 2016, 81, 1269–1281. [Google Scholar]
  24. NOAA Tsunami Event Database. Available online: http://www.ngdc.noaa.gov/hazard/tsu_db.shtml (accessed on 21 May 2022).
  25. USGS Earthquake Archives. Available online: http://earthquake.usgs.gov/earthquakes/search/ (accessed on 11 May 2022).
  26. Xia, S.H.; Zhou, P.; Zhao, D.; Cao, J. Seismogenic structure in the source zone of the 1918 M7. 5 Nanao earthquake in the northern South China Sea. Phys. Earth Planet Inter. 2020, 302, 106472. [Google Scholar] [CrossRef]
  27. GB 18306-2015; Manual for National Seismic Ground Motion Parameters Zonation Map of China. Standards Press of China: Beijing, China, 2015.
  28. Papazachos, B.C.; Scordilis, E.M.; Panagiotopoulos, D.G.; Papazachos, C.B.; Karakaisis, G.F. Global relations between seismic fault parameters and moment magnitude of earthquakes. Bull. Geol. Soc. Greece 2004, 36, 1482–1489. [Google Scholar] [CrossRef] [Green Version]
  29. Liu, Z.L.; Ding, H.P. Discussion of magnitude and focal shock parameter based on numerical simulation of strong ground motion on the 1604 earthquake in the marine area near Quanzhou, Fujian. South China J. Seismol. 2011, 31, 1–10. (In Chinese) [Google Scholar]
  30. Okada, M. Surface deformation due to shear and tensile faults in a half-space. Bull Seism. Soc. Am. 1995, 75, 1135–1154. [Google Scholar]
  31. Cho, Y.S. Numerical Simulations of Tsunami and Runup. Ph.D. Thesis, Cornell University, Ithaca, NY, USA, 1995. [Google Scholar]
  32. Wang, X.M.; Liu, P. An analysis of 2004 Sumatra earthquake fault plane mechanisms and Indian Ocean tsunami. J. Hydraul. Eng. Res. 2006, 44, 147–154. [Google Scholar] [CrossRef]
  33. Wu, T.R.; Chen, P.F.; Tsai, W.T.; Chen, G.Y. Numerical study on tsunamis excited by 2006 Pingtung earthquake doublet. Terr. Atmos. Ocean. Sci. 2008, 19, 705–715. [Google Scholar]
  34. Hou, J.M.; Li, X.J.; Yuan, Y.; Ren, Z.Y.; Zhao, L.D.; Wang, Z.C.; Wang, J.C. Scenario-based tsunami evacuation analysis: A case study of Haimen town, Taizhou, China. J. Earthq. Tsunami 2017, 11, 1750008. [Google Scholar] [CrossRef]
  35. Heidarzadeh, M.; Muhari, A.; Wijanarto, A.B. Insights on the source of the 28 September 2018 Sulawesi tsunami, Indonesia based on spectral analyses and numerical simulations. Pure Appl. Geophys. 2019, 176, 25–43. [Google Scholar] [CrossRef] [Green Version]
  36. Rasyif, T.M.; Kato, S.; Syamsidik; Okabe, T. Numerical simulation of morphological changes due to the 2004 tsunami wave around banda aceh, indonesia. Geosciences 2019, 9, 125. [Google Scholar] [CrossRef] [Green Version]
  37. Tang, L.J.; Titov, V.V.; Wei, Y.; Mofjeld, H.O.; Spillane, M.; Arcas, D.; Newman, J. Tsunami forecast analysis for the May 2006 Tonga tsunami. J. Geophys. Res. Oceans 2008, 113, C12015. [Google Scholar] [CrossRef] [Green Version]
  38. Wei, Y.; Chamberlin, C.; Titov, V.V.; Tang, L.J.; Bernard, E.N. Modeling of the 2011 Japan Tsunami: Lessons for near-field forecast. Pure App. Geophys. 2012, 170, 1309–1331. [Google Scholar] [CrossRef]
  39. Shokin, Y.I.; Chubarov, L.B.; Novikov, V.A.; Sudakov, A.N. Calculations of tsunami travel times charts in the Pacific Ocean (models, algorithms, techniques, results). Sci. Tsunami Hazards 1987, 5, 85–113. [Google Scholar]
  40. Huang, Z.; Wang, S.X. Tectonic features and activity of Binhai fault zone in Taiwan Strait. J. Geod. Geodyn. 2006, 26, 16–26. (In Chinese) [Google Scholar]
  41. HY/T 0273.3-2021; Technical Directives for Risk Assessment and Zoning of Marine Disaster Part 3: Tsunami. Standards Press of China: Beijing, China, 2021.
Figure 1. (a) Computational domain of the first two grids and the historical earthquakes and tsunamis on China’s southeastern coast and adjacent areas (1000 BC to 2022 AD). The yellow dots represent Mw 6.0–7.0 earthquakes, the purple dots represent Mw 7.0–8.0 earthquakes, the white dots represent historical tsunami events related to Mw > 6.0 earthquakes, the red dots and triangles indicate the tsunami source and tide gauges used for the model validation, respectively, and the black short lines define the seismic belts of the Littoral Fault. (b) The 10 virtual gauges in the model and the third computational domain.
Sustainability 15 00415 g001
Figure 2. Comparison of observed and modeled surface elevation time series at tidal gauges near Putian for the 11 March 2011 Japan tsunami.
Sustainability 15 00415 g002
Figure 3. Comparison of observed and modeled surface elevation time series at tidal gauges near Putian for the 27 February 2010 Chile tsunami.
Sustainability 15 00415 g003
Figure 4. Tsunami arrival time for the Quanzhou earthquake is indicated by the white lines. The red star denotes the epicenter. The time interval is 0.5 h.
Sustainability 15 00415 g004
Figure 5. Surface elevation time series for the 10 virtual gauges and 2 tide gauge stations around the Putian coast.
Sustainability 15 00415 g005
Figure 6. Maximum tsunami amplitude for the Quanzhou earthquake.
Sustainability 15 00415 g006
Figure 7. Offshore grid points (black points) selected along the offshore area of Putian.
Sustainability 15 00415 g007
Figure 8. Tsunami amplitudes of the offshore grid points under each scenario, from west to east along the shoreline.
Sustainability 15 00415 g008
Figure 9. The elevation contours of the third level grid. The yellow line is the mean sea level, the blue line is the 10-m elevation, the light orange shows the 20-m elevation, and the brown line indicates the 40-m elevation, respectively.
Sustainability 15 00415 g009
Figure 10. Model computed tsunami inundation in Putian (scenario Rake150). Six representative locations from A to E were selected in the assessment area.
Sustainability 15 00415 g010
Figure 11. Inundation depths at the six representative locations under each scenario.
Sustainability 15 00415 g011
Table 1. Source parameters of Quanzhou fault zone.
Fault Parameters
Longitude (°)119.42
Latitude (°)24.74
Mw8.0
Length (km)92
Width (km)71
Depth (km)20
Strike (°)65
Dip (°)60
Rake (°)150
Table 2. Nested grids for computation.
Level 1Level 2Level 3
Range of latitude (°)−5.0 to 52.021.5–26.524.99–25.83
Range of longitude (°)99.0–157.0117.0–122.5118.54–119.71
Data resolution2′1/4′1/32′
Coordinate systemSphericalSphericalSpherical
Manning’s n/0.0250.025
Governing equationLinearNonlinearNonlinear
Table 3. Earthquake parameters of tsunami scenarios for the sensitivity study.
ScenarioLong.
(°)
Lat.
(°)
MwDepth
(km)
Length
(km)
Width
(km)
Strike
(°)
Dip
(°)
Rake
(°)
Rake170119.4224.7408.02092716560170
Rake160119.4224.7408.02092716560160
Rake1501119.4224.7408.02092716560150
Strike30119.4224.7408.02092713060150
Strike40119.4224.7408.02092714060150
Strike50119.4224.7408.02092715060150
Strike60119.4224.7408.02092716060150
1 The earthquake parameters in bold are the Quanzhou fault zone used in this study.
Disclaimer/Publisher’s Note: The statements, opinions and data contained in all publications are solely those of the individual author(s) and contributor(s) and not of MDPI and/or the editor(s). MDPI and/or the editor(s) disclaim responsibility for any injury to people or property resulting from any ideas, methods, instructions or products referred to in the content.