Article

Research on China’s Tourism Public Services Development from the Perspective of Spatial–Temporal Interactions and Based on Resilience Theory

1
School of Economic and Management, Yanshan University, Qinhuangdao 066004, China
2
Regional Economic Development Center, Yanshan University, Qinhuangdao 066004, China
*
Author to whom correspondence should be addressed.
Sustainability 2023, 15(1), 4; https://doi.org/10.3390/su15010004
Submission received: 20 November 2022 / Revised: 14 December 2022 / Accepted: 15 December 2022 / Published: 20 December 2022
(This article belongs to the Section Tourism, Culture, and Heritage)

Abstract

:
In this paper, resilience theory is applied to construct an evaluation index system of tourism public services. The entropy weight method, Kernel density and Moran index were used to measure China’s tourism public services development level from 2010 to 2020 and to analyze its spatial–temporal evolution. The results showed that the overall development level of China’s tourism public services had a gentle upward trend; however, the development trend of each subsystem was not completely consistent with the overall development. From the spatial grade distribution, the characteristics of China’s tourism public services presented a clearly higher intensity in the middle region while the values for the two-sided ones were much lower. From the spatial pattern, the weakening trend appeared from the southeast to northwest. The high level and the above trend of concentrated contiguous distribution regions were formed in the eastern region in China, and the distribution regions were transformed into an optimized one in the southwest region in China. From the spatial agglomeration, the characteristics showed that the distribution in the east region was superior to that in the west region, and that in north region was superior to that in the south region. The overall tourism public services development level of each subsystem was improved while there were obstacles in its balanced development. The tourism entertainment services, tourism human resources and tourism safety services were the obstacle factors to the tourism public services development.

1. Introduction

Currently, due to the impact of COVID-19, the tourism industry is facing severe challenges such as prominent vulnerability and increased risk uncertainty [1,2,3]. Meanwhile, there are many supplies for tourism, and the potential tourism demand is still large [4,5,6]. As tourism public services are present throughout the whole process of tourism activities, they shoulder the important task of satisfying people’s need for a better life [7,8]. With the extensive development of resilience research and the urgent need for tourism development [9,10] in order to maintain its own stable development, the ways in which companies can cope with various changes and improve their ability to adapt to uncertain factors has become an important issue in the tourism field [11,12]. Therefore, based on the concept of resilience, exploring tourism public services from the perspective of spatial–temporal interactions is of great significance to adjust and innovate the tourism public service model, to make up for the shortcomings, and even to promote the high-quality development of tourism.
In the process of coping with the increasingly severe global problems, the word “resilience” as a new concept and paradigm to promote the sustainable development of the social economy has attracted extensive attention from scholars in the tourism field [13]. Many scholars have applied the concept of resilience to tourism [14], tourism destinations [15], tourism disasters [16] and tourism communities [17] by systematically discussing the sustainability, vulnerability and resilience of tourism [18]. In recent years, some scholars have conducted studies on tourism resilience under the influence of COVID-19 [19]. Meanwhile, under the concept of resilience, many research achievements have been made regarding the tourism economic system [20], tourism environment [21], tourism community [22] and socioecological system of tourism destinations [23]. Tourism public services are the basis for promoting tourism development and are the key to realizing the steady growth of the tourism economy [24]. Therefore, more research on public services in the field of tourism is required [25].
At present, researchers have carried out studies on the construction of the tourism public services system [26], the supply mechanism of tourism public services [27], the quality and satisfaction of tourism public services [28], etc. However, there are no detailed studies that apply resilience theory into tourism public services, and there is a lack of research on the dynamic evolution of the tourism public services development level. Therefore, based on resilience theory, we comprehensively measured the development level of provincial tourism public services in China and analyzed its temporal and spatial evolution characteristics by using ArcGIS, Kernel density and the Moreland index. Then, we analyzed the obstacle factors that are affecting the development of tourism public services using the obstacle degree model. Similar to the existing literature, the research problems to be solved in this paper are reflected in the following three aspects: Firstly, based on resilience theory, we further enriched the connotation of tourism public services and provided a theoretical basis for improving the quality and efficiency of tourism public services. Secondly, we used 31 provinces and cities in China as the research object, measured the development level of their tourism public services and analyzed the spatial–temporal evolution of the tourism public services development in order to determine the current situation and the characteristics of China’s tourism public services. Thirdly, we applied the obstacle degree model to determine the obstacle factors affecting tourism public services development, which is helpful to open the “black box” of tourism public services development, identify the gaps and promote the sustainable development of tourism public services.

2. Theoretical Analysis

2.1. Connotation of Tourism Public Service

The World Tourism Organization defines “tourism service” as all the services provided by tourism enterprises to meet the needs of tourists, including 12 categories such as tourism and travel-related services, entertainment, culture and sports services, financial and transportation services and so on. Different from private tourism services which focus on the pursuit of efficiency and profit maximization, public tourism services pursue the two goals of efficiency and fairness synchronously and emphasize the coordinated development of comprehensive benefits. The fairness of the services is one of the basic conditions used to measure the development level of a country’s tourism public services. Therefore, the main difference between public tourism services and private tourism services is that the former concerns public welfare while the latter concerns profit.
As for the concept of tourism public services, an influential statement was put forward by Dr. Li Shuang (2010) in China [29]. Tourism public services is the general term for non-profit-oriented products and services provided by the government or other social organizations with obvious publicity to meet the common needs of tourists. In the “13th Five-Year Plan for National Tourism Public Service” issued in December 2016, the tourism public services system that was mentioned included tourism public services infrastructure, tourism information consultation, tourism transportation distribution, toilet revolution, tourism convenience and benefits, tourism security, etc. With the official establishment of the Ministry of Culture and Tourism in 2018, under the background of the integrated development of culture and tourism, the tourism, cultural and entertainment services have been gradually incorporated into the research scope of tourism public services.

2.2. Sustainable Development of Tourism Public Services under the Concept of Resilience

In 1973, Canadian ecologist Holling [30] introduced the concept of resilience into the study of ecological system stability and proposed resilience theory as the “hierarchical structure, chaos and adaptive cycle”. Subsequently, the concept of resilience was further developed into “socio-ecological” resilience, which has gradually become compatible with sociology, management, economics and other disciplines, with more emphasis on the adaptive capacity of the system [31]. Some scholars have interpreted resilience as “the ability of systems, enterprises and individuals to maintain their core functions and integrity in a radically changing environment” [32]. From the perspective of the research context, the connotation of “resilience” has undergone changes from “engineering resilience” to “ecological resilience” and then to “evolutionary resilience” [33,34]; that is, it has changed from “resistance” to “adaptation”. In other words, resilience is not a simple defense, but an ability and process, and the key is the ability of “adaptive governance” [35]. Ali et al. [36] proposed the theory of the complex adaptive system (CAS) and introduced the concept of the “adaptive subject”. They pointed out that when the system environment changes, the adaptability of the body can be based on some rules of interaction, and it can spontaneously continue to adjust its structure and behavior so as to guide the overall system upgrade restructuring.
Resilience is the material and energy that can maintain system security, stability and orderly development under external disturbance and crisis situations. It has the characteristics of coordination, adaptability and sustainability, and is an important condition to ensure sustainable development. Sustainable development emphasizes multiefficiency harmonious coexistence, which is a systematic concept. Its connotation is constantly enriched with the development of the economy and society, and its core has always been to emphasize the three development bottom lines (TBL) of economy, social culture and environment [37,38]. Sustainable tourism is “tourism that fully considers its current and future economic, social and environmental impacts and meets the needs of tourists, industry, environment and host community” [39]. It is also the specific application of the sustainable development concept in tourism, and its development achievements will be further invested in the process of resilience “forging”. And then, individuals will continuously consolidate and improve the overall resilience level of the existing tourism development to achieve resilience function improvement. Tourism public services not only involve tourism activities but they are also an important reflection of the regional tourism development level. The participation of its service objects, namely stakeholders, is also considered as a basic element of sustainable tourism development [39]. Therefore, it is particularly important to establish a resilient, durable, inclusive and sustainable tourism public services system, comprehensively consider the interaction among various dimensions in the complex system and make the benefits of tourism activities more equitably shared and widely distributed in the system [40], which is particularly important for the sustainable development of tourism public services and even the tourism industry.
With social, environmental and cultural elements as the target, tourism public services are comprehensive and dynamic and can be regarded as a complex system composed of multiple elements. The structure, function and characteristics of the system are constantly adjusted and adapted to cope with the changes in the environment and society so that the system has a steady-state balance and is sustainably developed. At present, the development of tourism public services is in a complex two-way interactive process of “top-down” and “bottom-up”. There are not only problems of sustainable development within the system itself, but also those of unbalanced development within the region, as well as external uncertain risks such as natural disasters and public health events. To realize the long-term and fair development of tourism public services as well as the inclusive development of different spatial scales and their interrelationships is the biggest challenge facing the sustainable development of tourism public services and is also the key to achieve the high-quality tourism development goal.
With the help of adaptive cycle theory and complex adaptive system theory, we believe that, from the perspective of space–time interactions, the tourism public services system is a complex adaptive system composed of four elements: ecology, society, institution and culture, which is shown in Figure 1.
These four systems are not simple superpositions or parallel substitutions. They are part of a complex inclusive and complementary relationship formed by the interaction between various systems. The tourism public services system is vulnerable to multiple disturbances, and its resilience is manifested by the potential resilience elements of the system itself. The diversity and flexibility of the organization of these elements enable the adaptation subject and subsystem within the system to interact with each other under certain conditions and effectively resist and absorb external disturbances through resilience capabilities such as resistance, absorption, adaptation and recovery. By maintaining and restoring its supply level and obtaining the ability of adaptive development, a diversified and inclusive resilient functional system of tourism public services can be built so as to form a balanced state to maintain its own stability. It is also a comprehensive reflection of the “anti-vulnerability” and “self-adaptability” of the four subsystems of the tourism public services system, namely, ecology, society, system and culture.

3. Research Method and Data Sources

3.1. Research Method

3.1.1. Index System Construction

On the basis of the “13th Five-Year Plan for National Tourism Public Service” and the systematic, scientific and accessible selection of the index system, we refer to relevant scholars’ research on the quality of tourism public services [41], the mismatch degree of tourism public services [42], the coupling and coordinated development of the tourism economy and tourism public services [43] and the supply–demand relationship of tourism public services [44], and we combine it with the theoretical connotation of the second part of this paper to construct the evaluation index system of tourism public services under resilience theory. The four systems of tourism public services, i.e., ecology, society, system and culture, are divided into seven dimensions, namely, tourism public environment, tourism public information, tourism transportation services, tourism infrastructure, tourism safety services, tourism human resources and tourism cultural and entertainment services, and 30 indicators were selected to construct an evaluation index system. The indicators and their meanings are listed in Table 1.

3.1.2. Evaluation Model

The raw data were first standardized. Then, the entropy weight method was adopted to determine the weight of each index. The multiobjective weighted sum was used to calculate the development level index of the tourism public services and each subsystem. The comprehensive index of the tourism public services development level was calculated as follows [45]:
y i = j = 1 m ω j x i j ,   i   =   1 ,   2 ,   n
where n is the number of provinces; m is the number of indicators; x i j is the standardized data of indicators; y i is the tourism public services development level index of the ith sample; and ω j is the weight of the jth index.

3.1.3. Kernel Density Estimation

Kernel density estimation is less dependent on model and research duration and has good statistical properties. Therefore, it has been widely applied in the analysis of spatial disequilibrium distributions [46]. The spatial and temporal evolution trend of the development level in each subsystem of tourism public services is shown by drawing the Kernel density estimation map. The principle is as follows:
f ( x ) = 1 N h i = 1 N K ( X i x h )
where K(·) is the function; N represents the number of observed values; X i represents the independent and identically distributed observed value; x represents the mean of the observed values; and h represents the bandwidth, which can be automatically obtained by Stata software.

3.1.4. Spatial Autocorrelation Analysis

The spatial correlation can measure the spatial correlation degree of adjacent areas under a certain standard and describe the phenomenon of spatial correlation and spatial agglomeration. In this study, the local Moran’s I index [47] was used to test the spatial autocorrelation of the tourism public services level index, which can reflect the local spatial agglomeration degree of each region. The calculation method is as follows:
I i = X i X ¯ S 2 j = 1 n W i j X j X ¯
where n is the observed quantity in the sample province; Wij is the spatial weight matrix; Xi and Xj are the measurement values of the tourism public services level index of province i and province j, respectively; X ¯ = 1 n i = 1 n X i represents the mean value of the tourism public services level index of all provinces; and S 2 = 1 n i X i X ¯ 2 is the variance of the tourism public services level index.

3.1.5. Obstacle Degree Model

The obstacle degree model [48] can be used to diagnose the influencing factors of the tourism public service, so as to identify the gap and improve the direction. In the model, three variables, i.e., factor contribution wj, index deviation degree dij and obstacle degree Oij were introduced. The specific calculation formula is as follows:
d i j = 1 - x ij
O i j = w j / j = 1 n d i j w j × 100 %
where wj represents the influence degree of a single factor on the overall goal, which is generally expressed by the index weight; dij represents the gap between a single index and the development goal of tourism public services and is set as the difference between the standardized value of a single index x′ij and 100%; and Oij represents the impact value of a single indicator and classified indicator on the development level of tourism public services, which is the target and result of the diagnosis of development obstacles of tourism public services.

3.2. Data Sources

The data involved in this paper were taken from the “China Statistical Yearbook”, “China Urban Statistical Yearbook”, “China Urban Construction Statistical Yearbook”, “China Tourism Statistical Yearbook” and “China Culture and Tourism Statistical Yearbook” as well as the statistical yearbook of some provinces and the statistical bulletin of the relevant departments of the state. Some missing values in the data were supplemented by regression statistical analysis or trend extrapolation. The descriptive statistics of the variables are listed in Table 2. It can be seen that there were no outliers in all the variables and their stability was good.

4. Results and Analysis

Based on the above evaluation method, the comprehensive index and subsystem index score of the tourism public services development level in 31 provinces of China (excluding China’s Hong Kong, Macao and Taiwan) from 2010 to 2020 were calculated, and the results are listed in Table 3.

4.1. Temporal Evolution Analysis

4.1.1. Temporal Comprehensive Index Evolution Trend

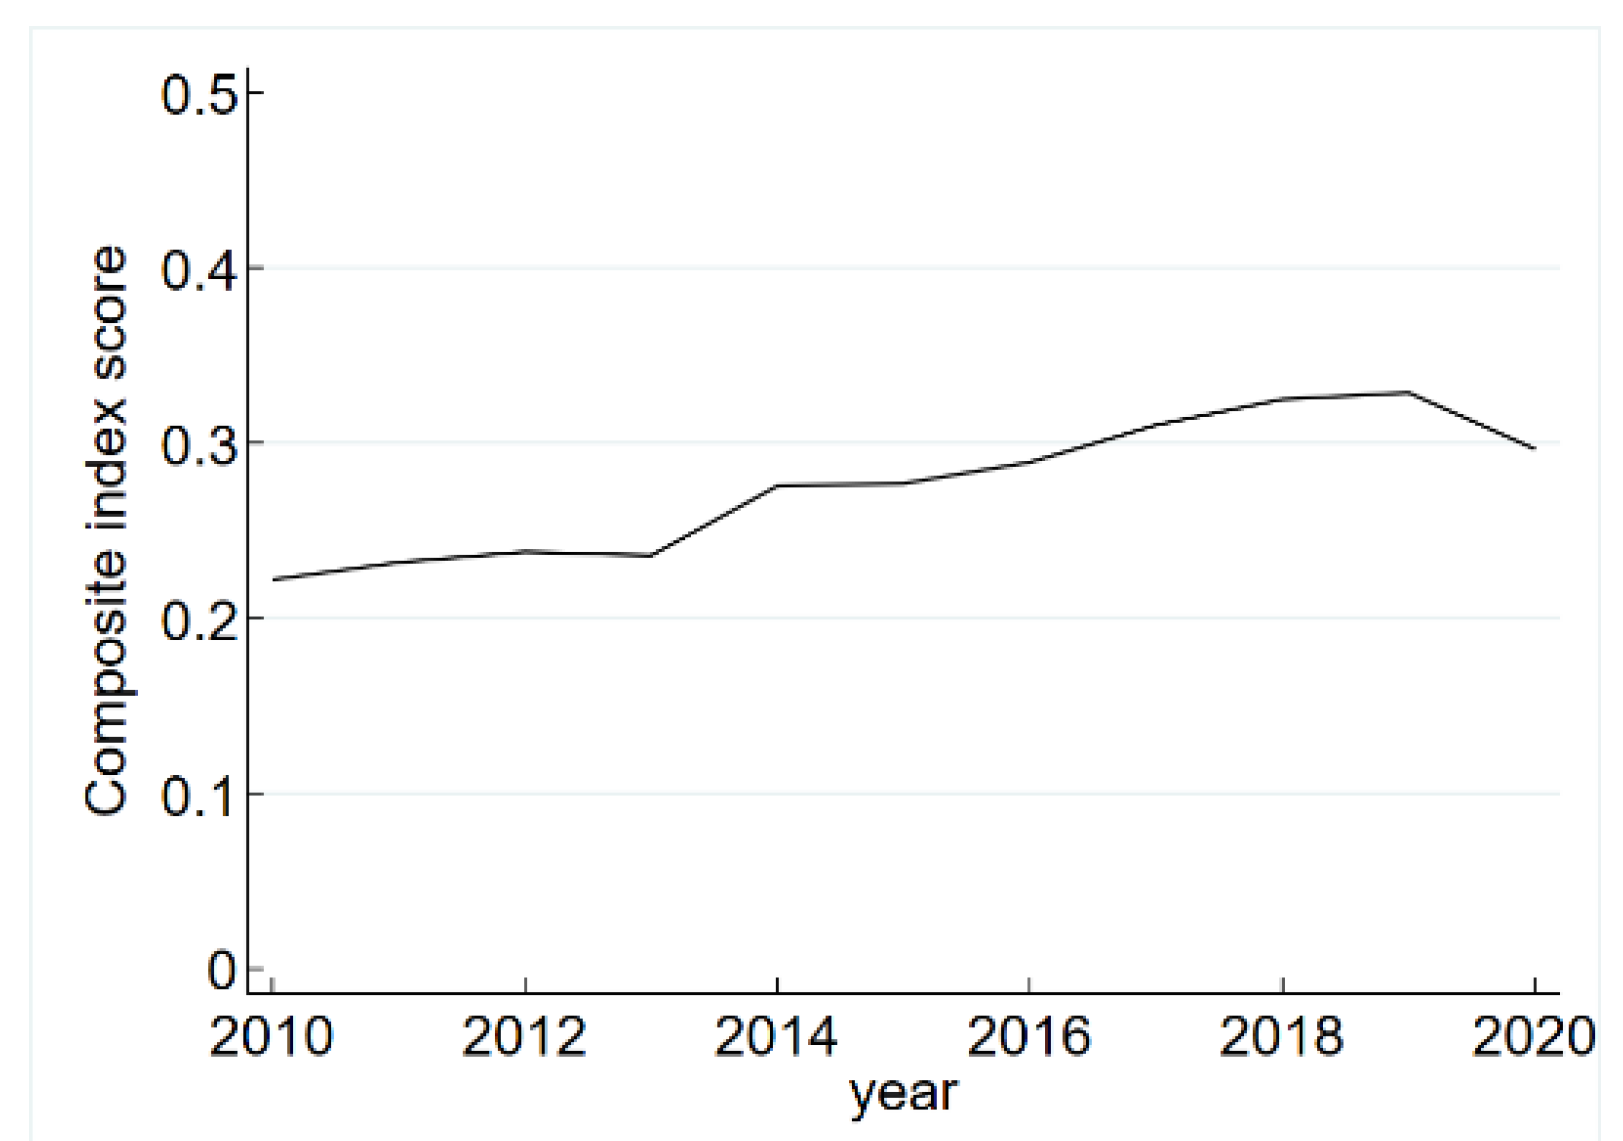
The comprehensive index of China’s tourism public services development trend is shown in Figure 2. It can be seen that the comprehensive index average score of China’s tourism public services development level fluctuated between 0.222 and 0.329 during the study period and declined slightly in 2013. However, it had a gentle upward trend overall. From 2015 to 2018, with an average annual growth rate of 5.47%, it increased rapidly and reached the maximum in 2019. In 2019–2020, there was a declining trend due to the impact of COVID-19, and the decline rate was about −9.78%. Generally, from 2010, China’s tourism public services development level has increased by 2.94% annually, and the tourism public services development level of nearly half of the provinces was better than the national average level. Although it was affected by external disturbances, the overall development momentum was good and had strong adaptability.

4.1.2. Temporal Evolution Trend of Subsystem Index

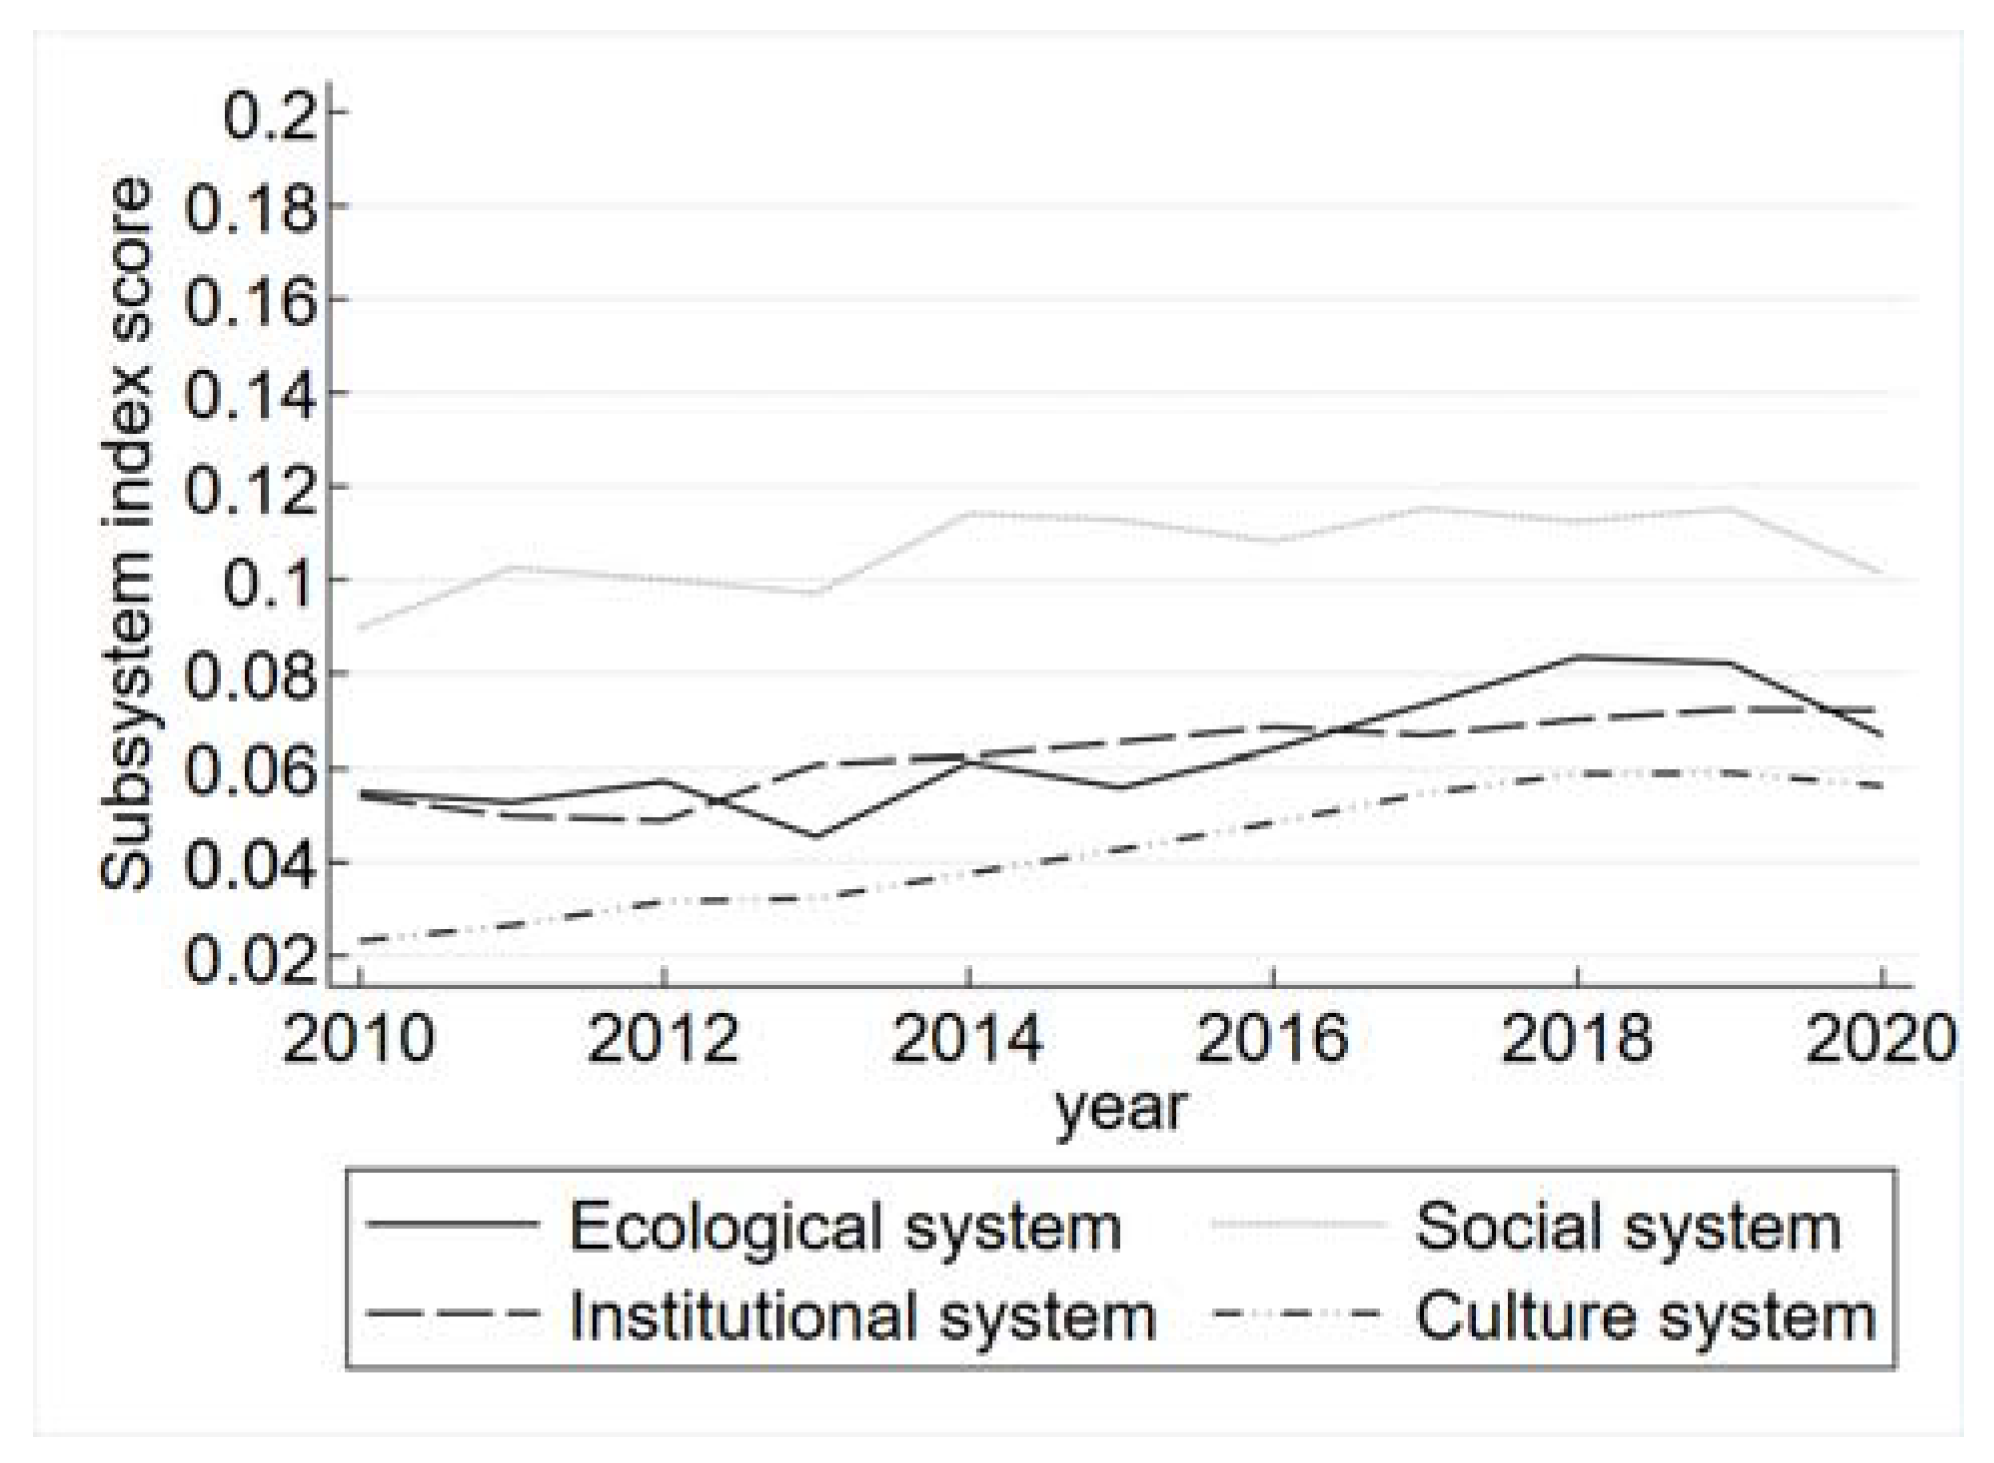
The trend of each subsystem of China’s tourism public services development is shown in Figure 3. It can be seen that the tourism public services ecological system index showed an overall trend of rising fluctuations and reached the minimum in 2013. To some extent, during the period of rapid tourism development from 2010 to 2013, it had a certain reverse effect on the ecological environment. From 2014 to 2020, it showed an “anti-N” type trend, reached the maximum in 2018 and declined significantly in 2020.
The tourism public services social system index also showed a fluctuating upward trend, while the average annual growth rate was only 1.16%. During the two stages from 2010 to 2016 and from 2016 to 2020, it showed an “M” shaped trend and reached the maximum in 2017 and 2019. Similarly, in 2020, the index fell most obviously while its system function was strong, and the overall development trend was better than other subsystems.
The overall trend of the tourism public services institutional system index was “downward-rising” and reached the minimum in 2012. Followed by a gentle upward trend, it reached the maximum in 2019. Unlike the other subsystems, its index in 2020 was basically unchanged from 2019, with no downward trend.
Except for a slight decline in 2020, the tourism public services cultural system index showed a rapid upward trend on the whole, with an average annual growth rate of 9.31%. It reached the maximum in 2019 and the development momentum continued to improve. However, it was still at a low level compared with the other subsystems, which indicated that there was a large space for improvement, and it also responded to the development trend of the deep integration of China’s culture and tourism.
Comparing the comprehensive development index of China’s tourism public services with that of each subsystem, it can be seen that the growth trend of the comprehensive index of China’s tourism public services development trend was not completely consistent with each subsystem, and each had its own characteristics of evolution. The social system development trend was better than that of the other subsystems. The cultural system development trend was always lower than that of other the subsystems, but its development trend was always good. The ecological system development trend was slightly lower than that of the institutional system in 2013–2016 and 2020 and was higher than that of the institutional system in other stages. However, the institutional system development trend was relatively weak. Generally, the tourism public services should be developed comprehensively, and timely adjustments should be made according to the development status of each subsystem, so as to ensure the quality and coordinated development of each subsystem and achieve a balanced state of steady improvement of its own.

4.2. Analysis of Spatial Evolution Pattern

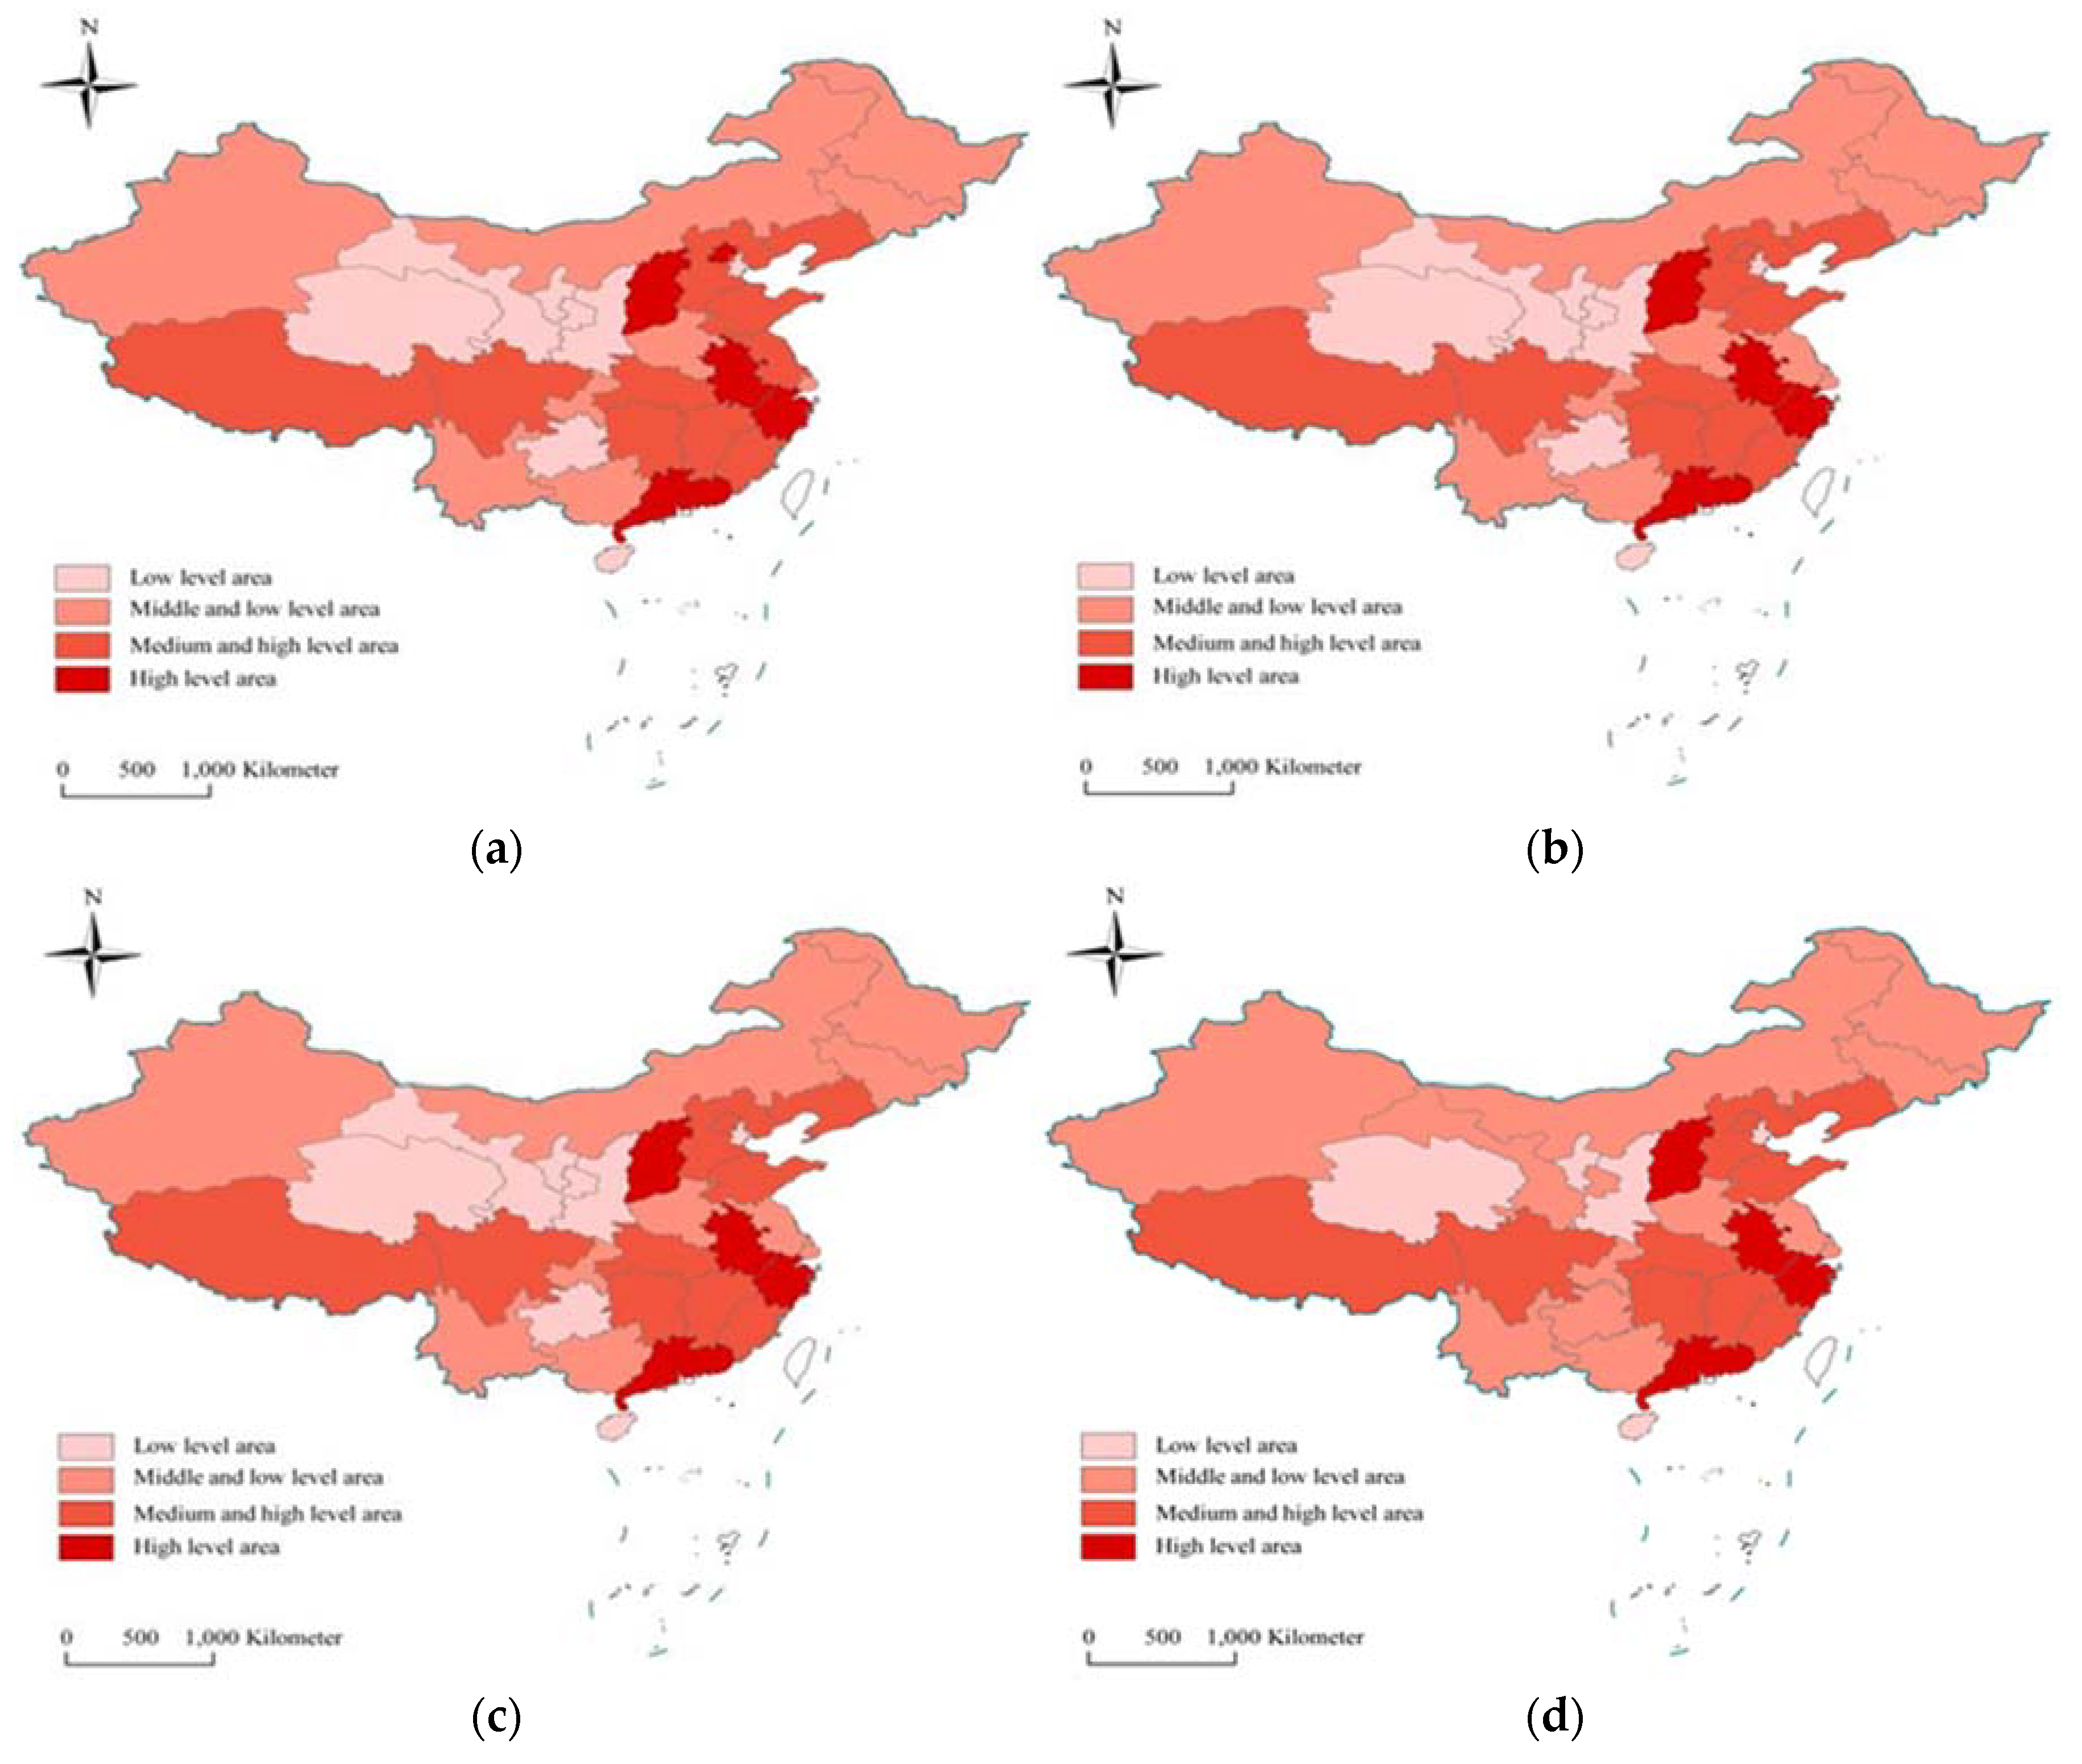
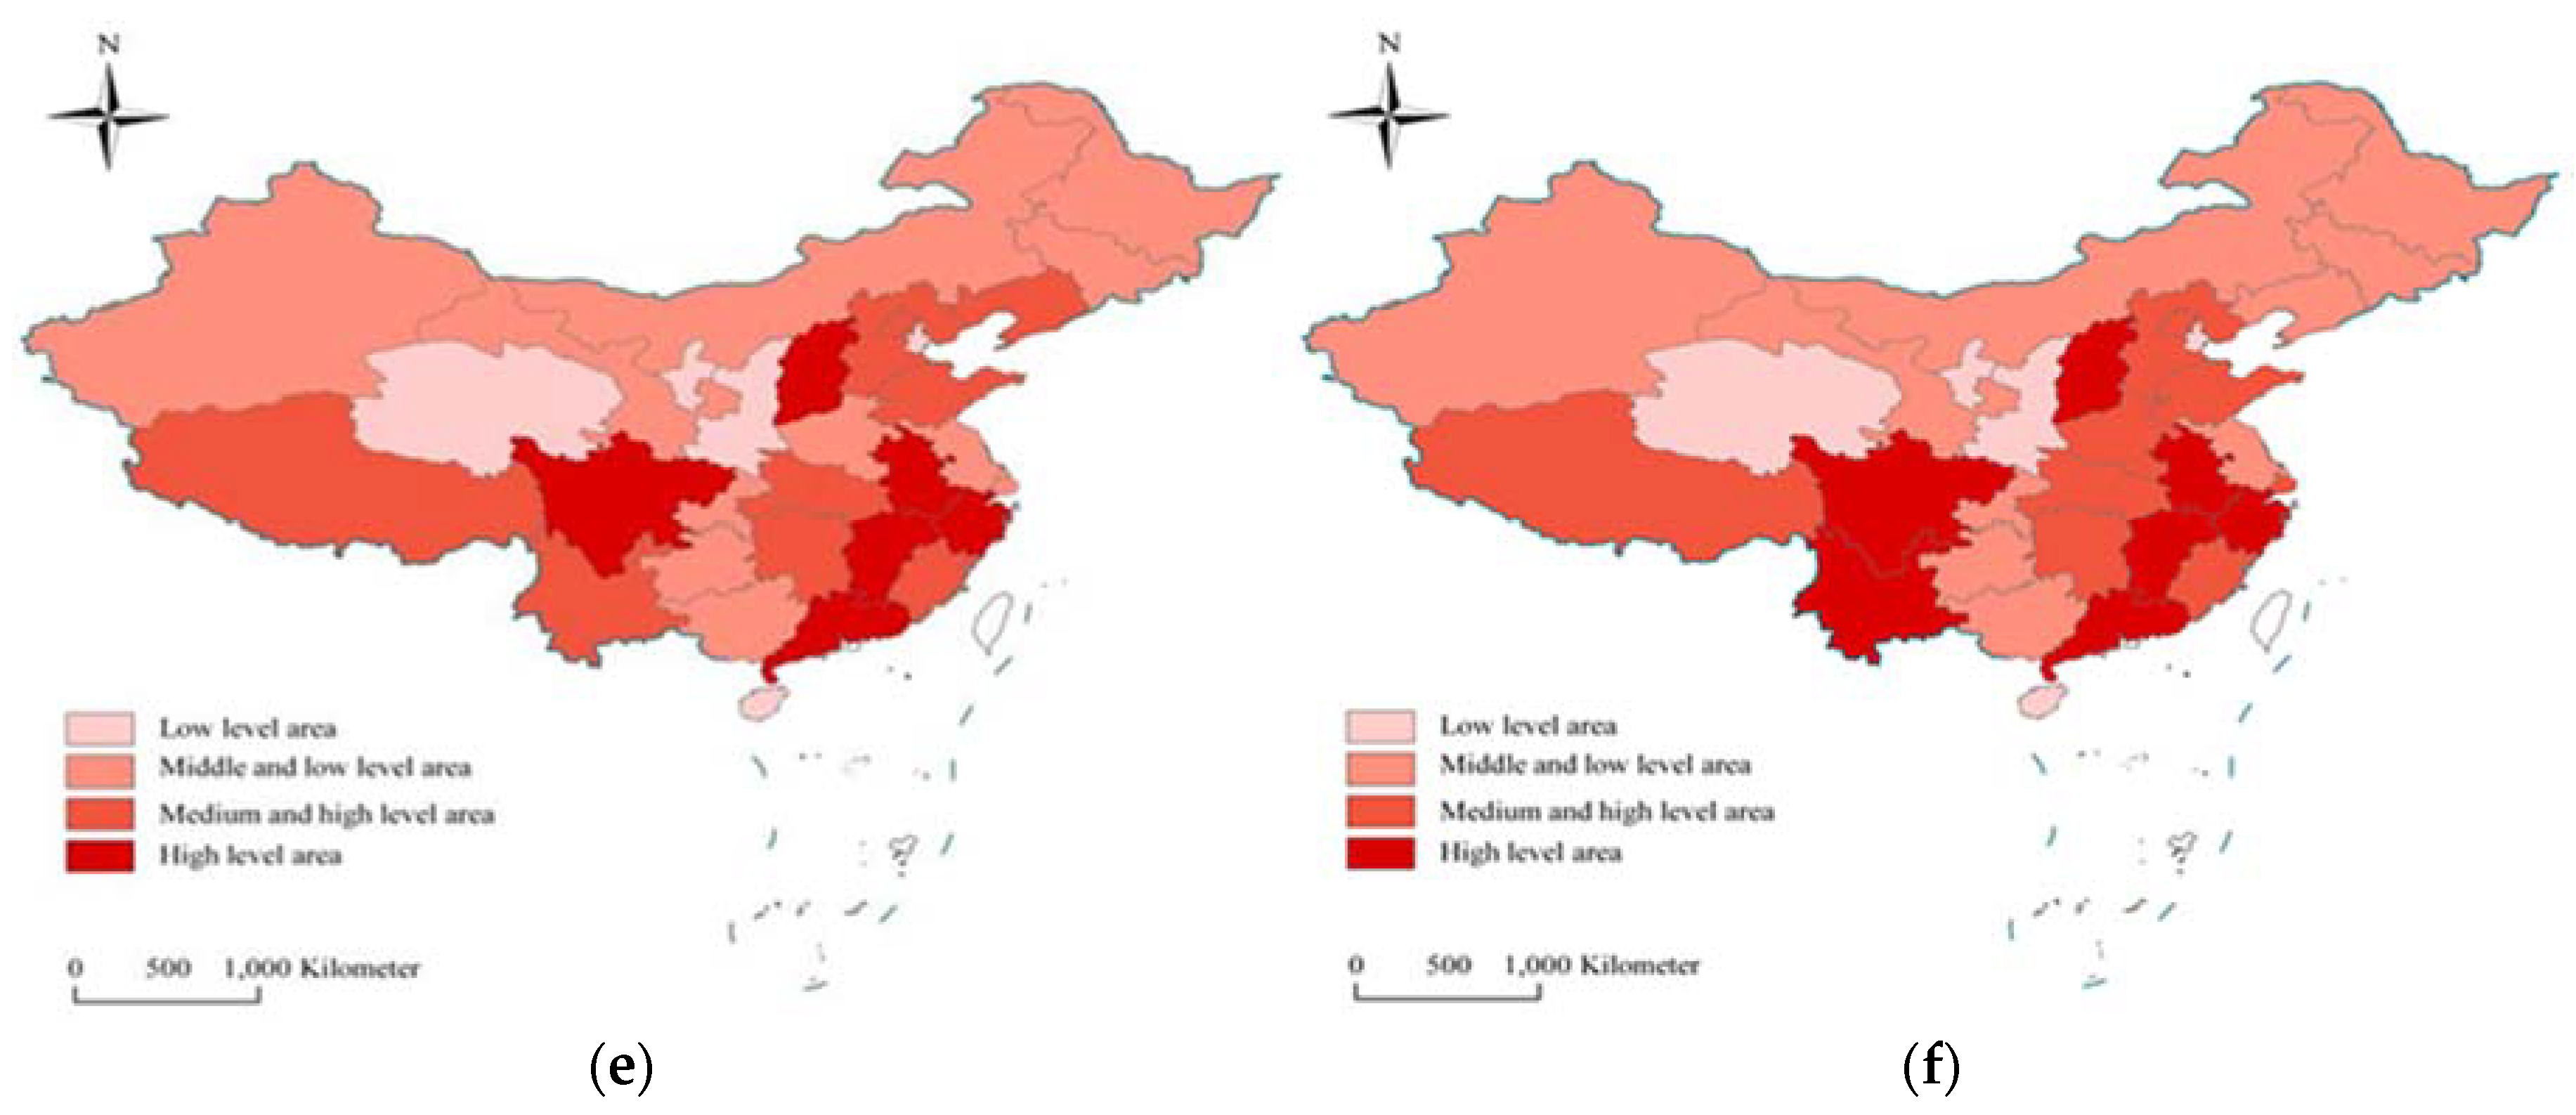
In this paper, the tourism public services development level was divided into four levels by using the classification method of natural discontinuity points, which were named as the low level, medium–low level, medium–high level and high level. From the measured results, the tourism public services development level index and grade classification results of six temporal sections in 2010, 2012, 2014, 2016, 2018 and 2020 were selected to draw the spatial distribution map of China’s tourism public services development level with the help of ArcGIS software, which is shown in Figure 4.
It can be seen that the spatial evolution pattern of China’s tourism public services development level index during the study period had the following two characteristics: From the grade distribution, the characteristics of China’s tourism public services presented a clear higher intensity in the middle region while the values for the two side ones were much lower. In addition, the number of high-level provinces showed an increasing trend, but the overall pattern reflected a certain “Matthew effect”. The Guangzhou, Anhui, Shanxi and Zhejiang provinces were always at a high level, while the Tianjin city, Hainan, Qinghai, Ningxia and Shaanxi provinces were always at a low level. Meanwhile, the overall level of the grade distribution in the eastern region was higher than that in the western region, and that in the southern region was higher than that in the northern region. From the perspective of the spatial distribution pattern, China’s tourism public services development level was weakened from southeast to northwest. The middle–high level or above concentrated contiguous distribution areas were formed in the eastern region, and the southwest region showed a trend of continuous optimization. However, China’s tourism public services development level in Central China, North China and Northwest China showed no trend change, except some provinces such as the Gansu, Henan and Jiangxi provinces have some improvement. Throughout the whole study period, China’s tourism public services development level was imbalanced and insufficient, which contradicts the vision of coordinated development in the development philosophy of the new era. From the perspective of the spatial evolution of the tourism public services development pattern, it is key to improve the ability of the regional tourism public services system, so as to adapt to uncertain factors and achieve a stable equilibrium state. Therefore, the quality upgrading and sustainable development of China’s tourism public services can be guaranteed.

4.3. Kernel Density Distribution of Each Subsystem

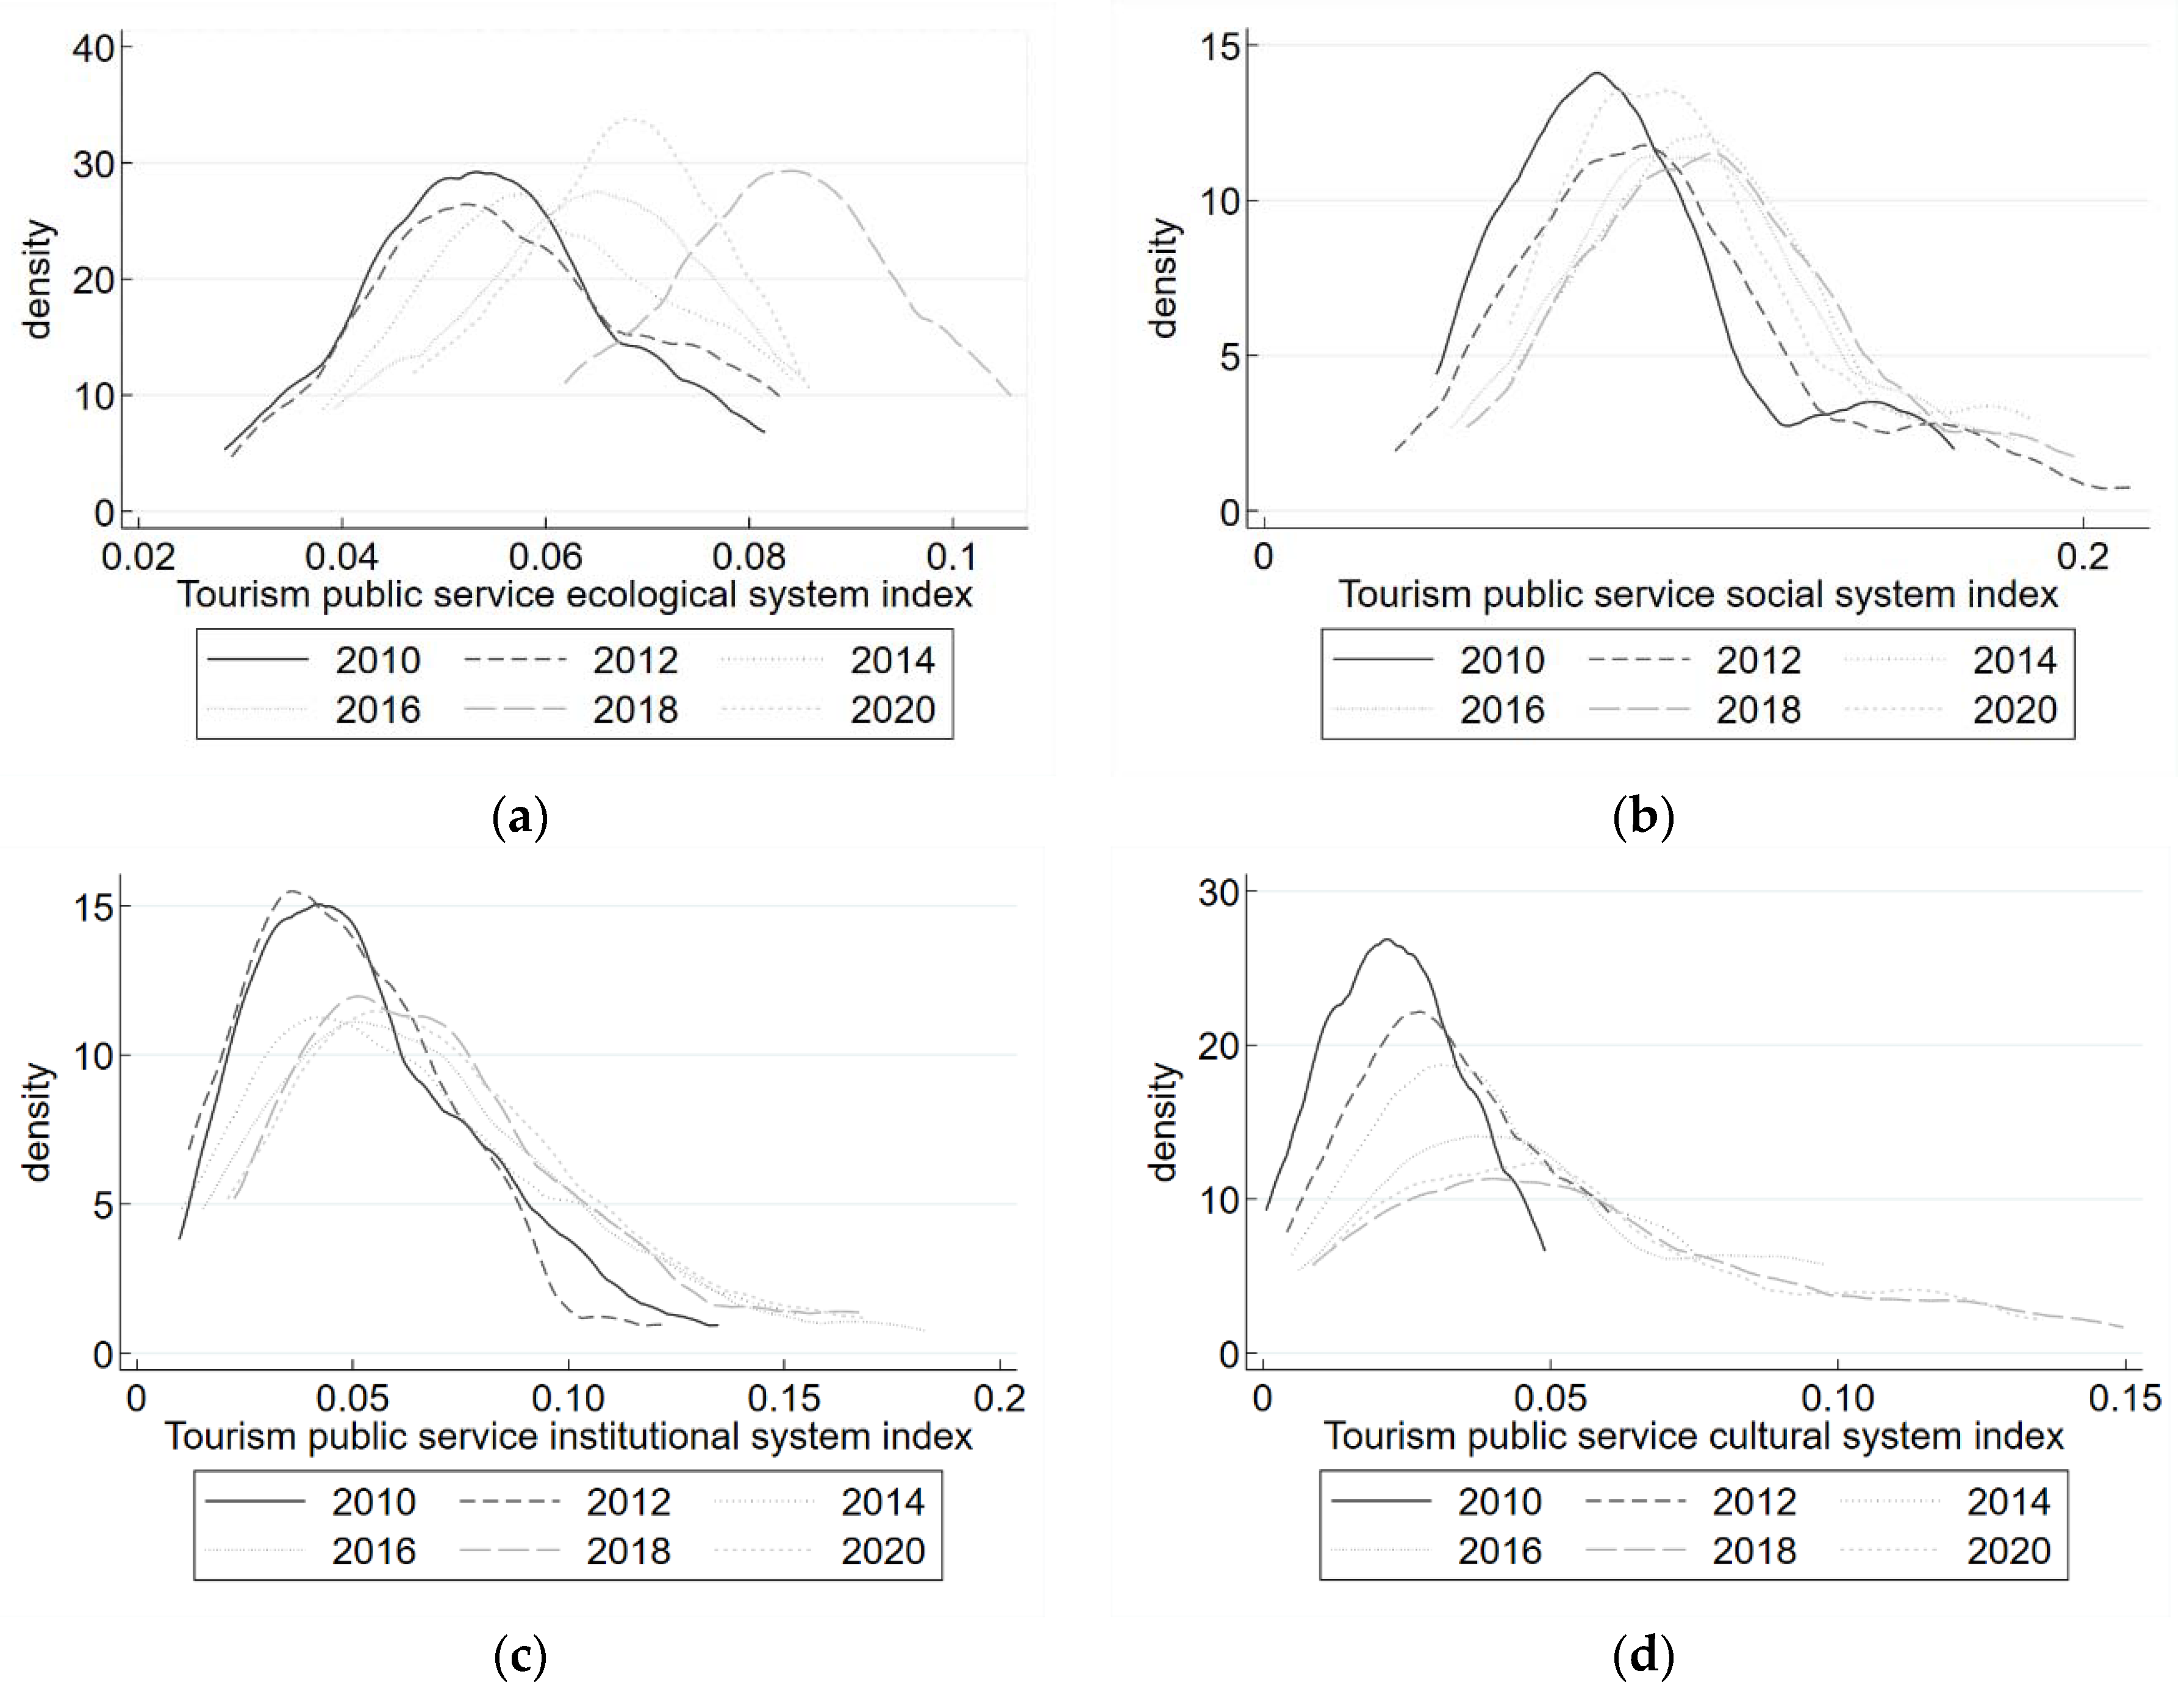
In order to further analyze China’s tourism public services distribution dynamic characteristics and the evolution trends of each subsystem, the Kernel density estimation method was adopted in this paper, and Stata software was used to calculate and draw the tourism public services Kernel density distribution map of each subsystem, which is shown in Figure 5.
Figure 5a is the Kernel density evolution curve of China’s tourism public services ecological system. It can be seen that in terms of location, the peak of China’s tourism public services ecological system development level in 2012 moved slightly to the left compared with that in 2010, which indicates a slight decline in the development level during the study period. From 2012 to 2018, the peak of the ecological system shifted to the right, which indicates that the tourism public services ecological system development level improved year by year. The peak position of the tourism public services ecological system in 2020 obviously moved to the left compared with that in 2018, which indicates that the tourism public services ecological system development level in 2020 showed a significant downward trend. In terms of shape, the trend of the single peak during 2010–2020 indicated that no polarization phenomenon occurred. The height and width of the wave peak were relatively stable from 2010 to 2018, which indicates that the regional difference did not change significantly during the study period. In 2020, the peak height became steeper, and the peak width became slightly narrower, which indicates a slight decrease in regional difference.
Figure 5b is the Kernel density evolution curve of China’s tourism public services social system. It can be seen that in terms of location, the position of the main peak moved to the right from 2012 to 2014, which indicates that China’s tourism public services social system development level gradually improved during the study period. In 2016, the position of its main peak moved to the left compared with that in 2014, which indicates that the development level of 2016 decreased compared with that of 2014. The position of the main peak moved to the right in 2018 while that in 2020 moved significantly to the left compared with that in 2018, which indicates that the tourism public services social system development level experienced an “up-and-down” process, and the decline trend was obvious in 2020. In terms of shape, the “double peak” situation of one big and one small peak was obvious in 2010 compared with the weak “double peak” situation in 2020, which indicates that the polarization pattern of the tourism public services social system development level gradually weakened. Compared with 2010, the peak height of the wave from 2012 to 2018 slowed down and widened, which indicates that the regional difference increased during this period. The peak height of the wave in 2020 became steeper and the width did not change significantly, which indicates that the regional difference did not change significantly.
Figure 5c is the Kernel density evolution curve of China’s tourism public services institutional system. It can be seen that in terms of location, the main peak of the tourism public services institutional system development level moved to the right from 2010 to 2020, which indicates that the overall development level improved, but the increase was not obvious. In terms of shape, the trend of the single peak during 2010–2020 indicates that no polarization phenomenon occurred. Since 2014, the peak height was flat and the peak width range increased, which indicates that the tourism public services institutional system development level increased compared with the previous regional difference, but it can also be seen that the regional difference did not change significantly from 2014 to 2020.
Figure 5d is the Kernel density evolution curve of China’s tourism public services culture system. It can be seen that in terms of location, the main peak of the tourism public services cultural system development level moved to the right from 2010 to 2016, which indicates that its development level was constantly improved. However, the position of the main peak was relatively stable from 2016 to 2020, which indicates that its development level did not change significantly. In terms of shape, the trend of the single peak during 2010–2020 indicates that no polarization phenomenon occurred. From 2010 to 2018, the peak height of the tourism public services culture system slowed down and decreased significantly on the whole while the peak width widened significantly, which indicates that regional differences in the tourism public services culture system development level increased significantly during this period. In 2020, the peak height was slightly steeper and the width was slightly narrower, which indicates that the regional difference was slightly smaller. Generally, the tourism public services development level of each subsystem was improved, but there were certain obstacles in its balanced development.

4.4. Tourism Public Services Development Space in Different Provinces

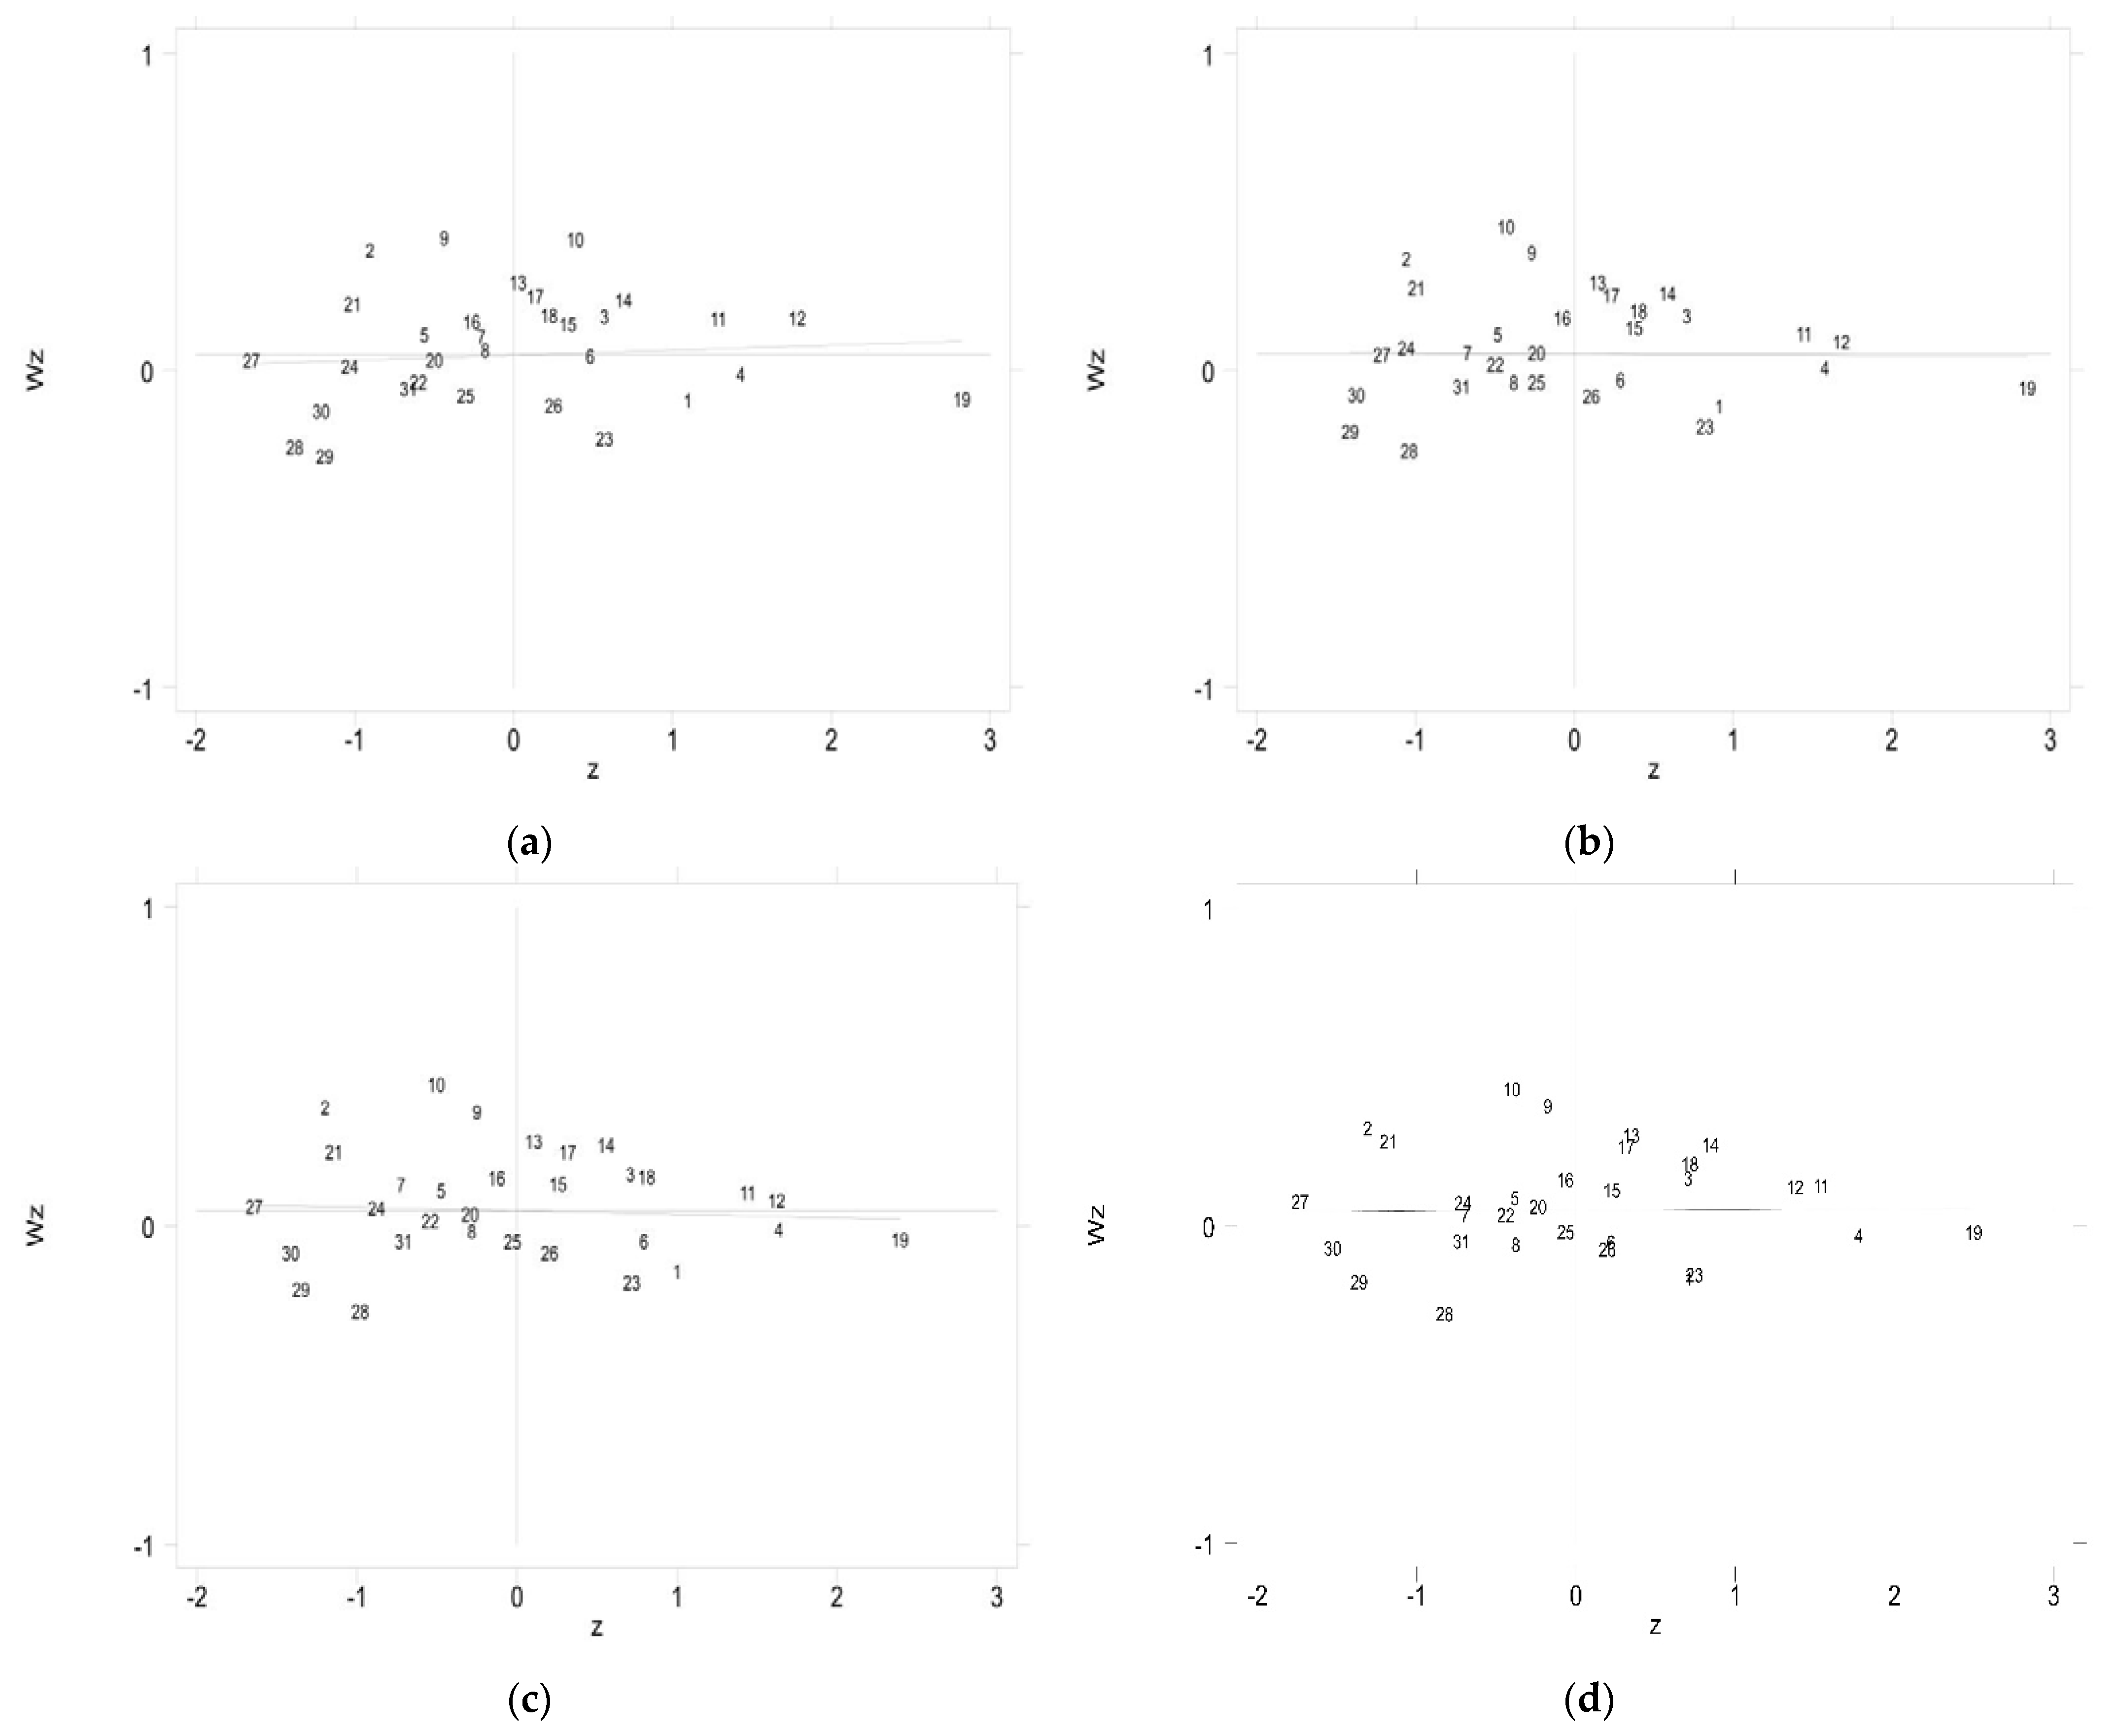
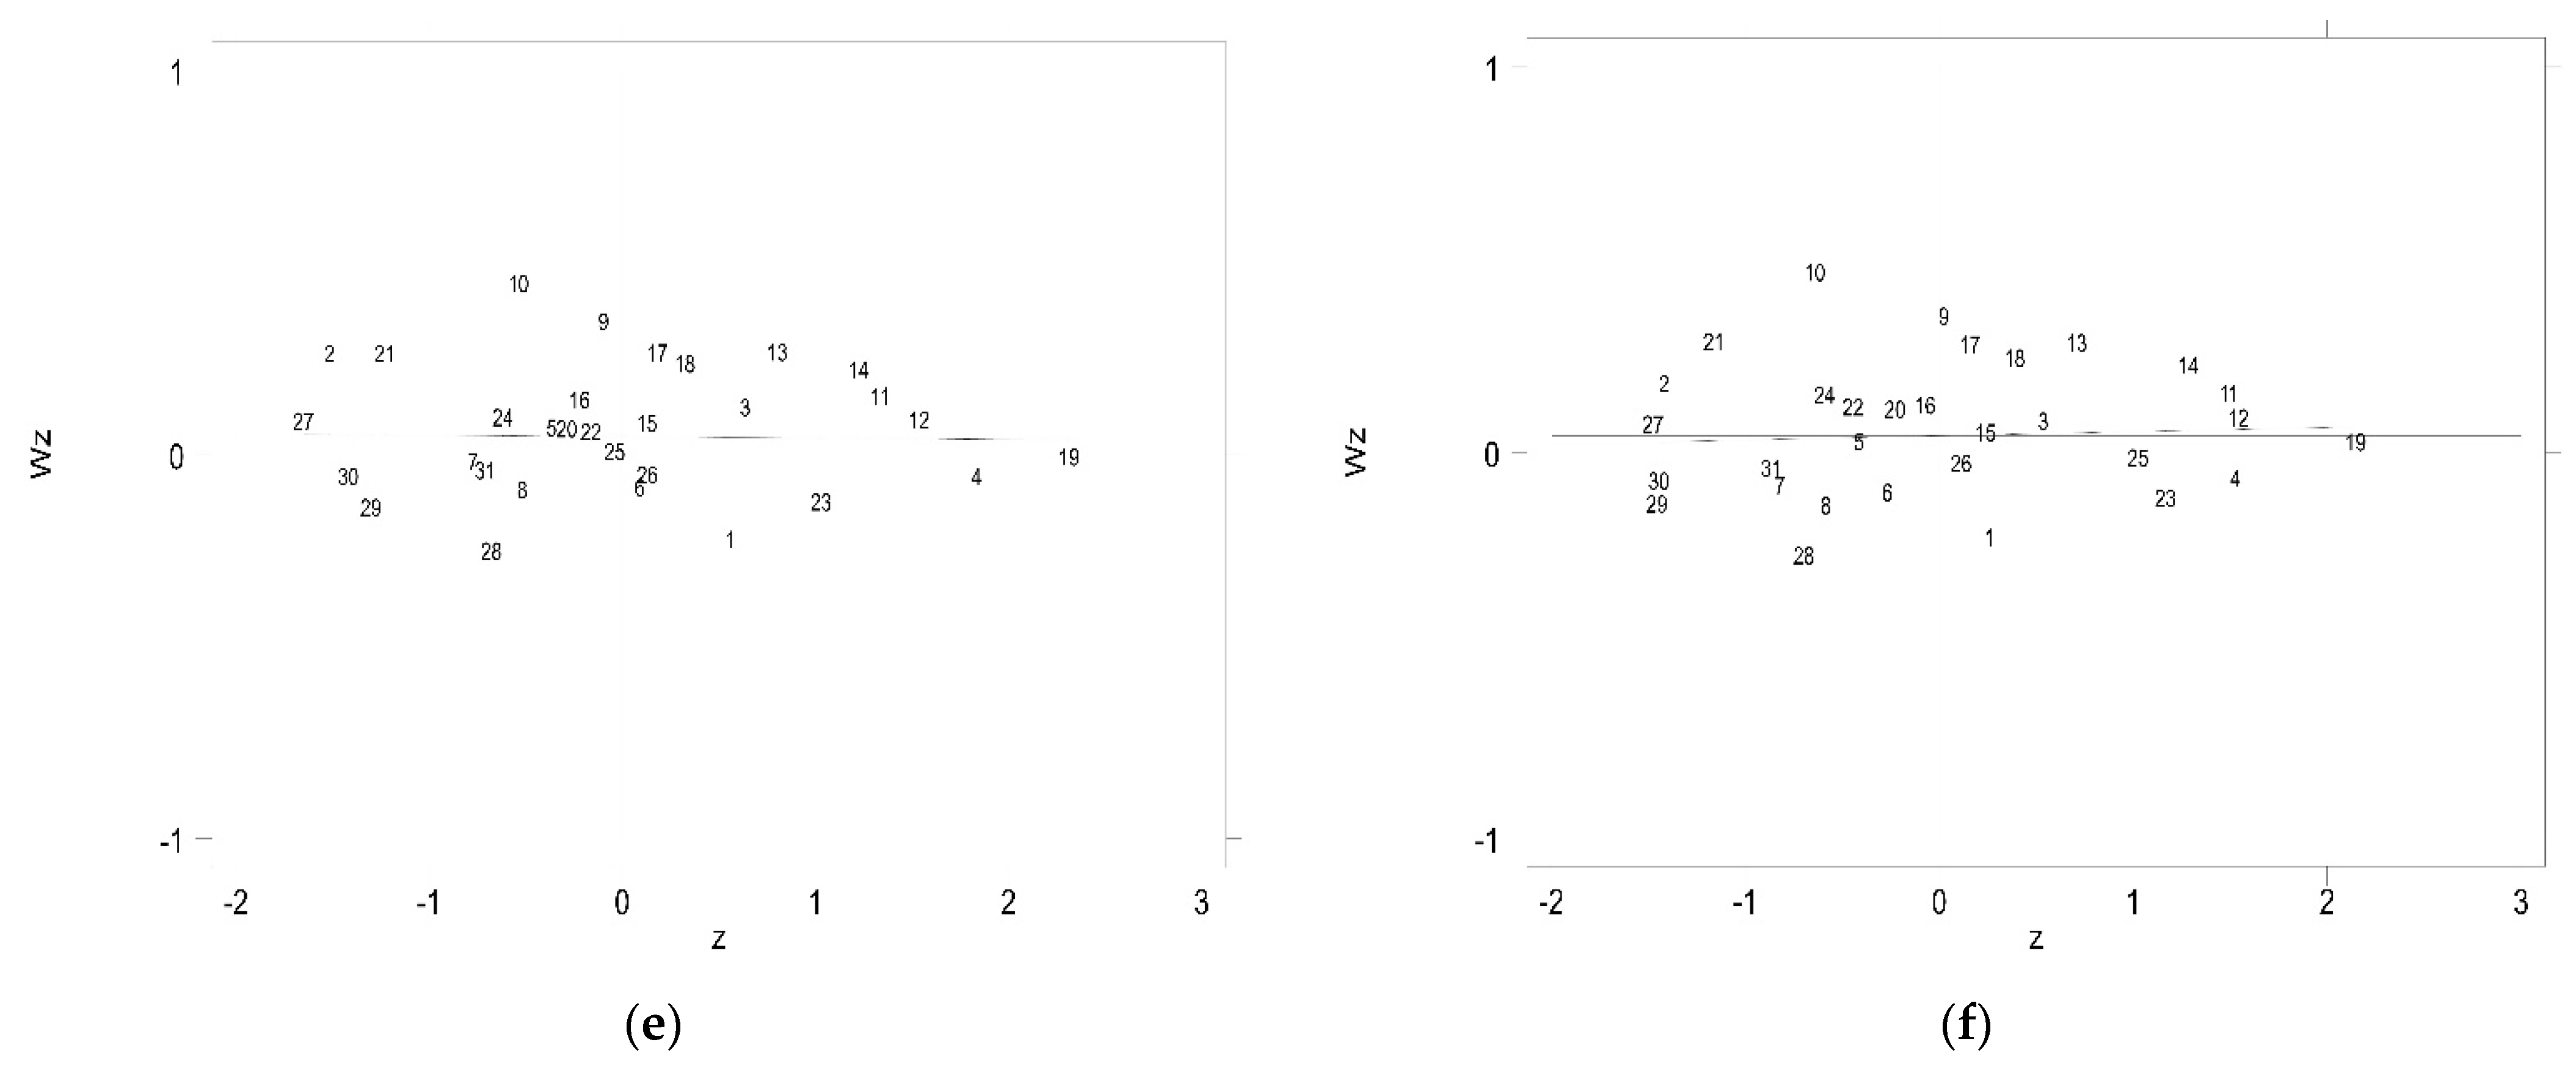
In order to further investigate the spatial correlation and distribution differences in China’s tourism public services development level, the indicators in 2010, 2012, 2014, 2016, 2018 and 2020 were selected in this paper, and the spatial agglomeration of the tourism public services development in different provinces was analyzed by using the scatter plot of the local Moran’s I index, which is shown in Figure 6. The provinces located at the first quadrant (high–high type) and the third quadrant (low–low type) had good spatial positive correlation properties, namely, the region presented spatial agglomeration characteristics. Those located at the second quadrant (low–high type) and the fourth quadrant (high–low type) presented spatial negative correlation properties, which indicates that the regional difference in the tourism public services development was large.
On the whole, the Zhejiang, Anhui, Fujian, Jiangxi, Hebei, Hubei and Hunan provinces were all located in the first quadrant during the study period, belonging to the “high-high type”, which indicates that the tourism public services development level indicators in these and neighboring provinces were relatively high and had a high spatial diffusion and spillover effect on neighboring provinces. The Tianjin city, Henan and Hainan provinces were all located in the second quadrant, belonging to the “low-high type”, that is, the development level index of their own tourism public services was lower than that of neighboring provinces, which had certain development potential. The Gansu, Qinghai, Ningxia and Xinjiang provinces were located in the third quadrant, belonging to the “low-low type”, which forms the low-value aggregation areas. The Beijing city, Shanxi, Guangzhou, Sichuan and Xizang provinces were located in the fourth quadrant, belonging to the “high-low type”, which means that their own tourism public services development level was high but the development level of the surrounding provinces and cities was low and the regional difference was large.
At the end of the study period, the analysis showed that a contiguous hot spot region was formed in the eastern region (the Shanghai city, Zhejiang, Anhui, Fujian, Jiangxi, Hebei, Shandong, Hunan, Hubei provinces), which indicated that this region belonged to the high-value agglomeration area. A certain range of low-value agglomeration areas were formed in Northeast China (the Liaoning, Jilin, Heilongjiang provinces) and the Inner Mongolia region as well as in Northwest China (the Gansu, Qinghai, Ningxia, Xinjiang provinces). The spatial agglomeration characteristics of the tourism public services development level showed that the eastern region was better than the western region, and the northern region was better than the southern region. Compared with the beginning of the study period, the tourism public services development level remained relatively stable in spatial pattern. The number of high-value areas and low-value areas did not expand or shrink, and some provinces showed a transformation of aggregation areas during the study period. The overall spatial pattern showed a certain aggregation trend, which reflected the imbalance and inadequacy of China’s tourism public services development process during the study period.

4.5. Diagnosis of Obstacle Factor

4.5.1. Main Obstacle Factor Analysis

In order to clarify the influencing factors of China’s tourism public services development level, the obstacle degree model was used in this paper to calculate the obstacle degree (OB) of China’s tourism public services development level. Due to a large number of indicators, in order to reflect their criticality, the top eight obstacle factors (OFs) were screened and are listed in Table 4.
During the study period, no significant changes occurred in the single obstacle factor, and there were seven common obstacle factors. Among them, the number of art performance groups (C1), employment in tourist attractions (I8) and highway passenger volume (S9) always ranked as the top three. The employment of travel agencies (I6), internet broadband access ports (S2), total retail sales of social consumer goods (C2) and employment of star hotels (I7) were the main obstacle factors in each year, with slightly different intensities of the obstacle effect. The number of museums (C3) was the main obstacle factor in 2010, 2016 and 2018, while the number of medical institutions (I5) was the main OF in 2012, 2014 and 2020. The order of all changed in the last two.
From the perspective of agglomeration, C1, C2 and C3 were all indicators of the tourism and cultural services of its cultural system, which indicates that tourism and cultural services were always the main obstacle factors to the tourism public services development. I6, I7 and I8 were all indicators of tourism human resources in the system, which indicates that the tourism public services development urgently requires the construction of talents in related fields. Meanwhile, the index of tourism safety covered a major obstacle factor of I5. In addition, S9 and S2 in the social system were the main obstacle factors, which indicates that tourism traffic and tourism public information services need to be enhanced. In addition, S9 and S2 in the social system were the main obstacle factors, which indicates that tourism traffic and tourism public information services need to be enhanced. From the comprehensive obstacle degree value of each indicator, the obstacle degree value of the single indicator did not change significantly with the progress of time, which indicates that system coordination and single governance should be combined in the future to achieve the balanced and stable development of the tourism public services system.

4.5.2. Obstacle Degree Analysis of Subsystem

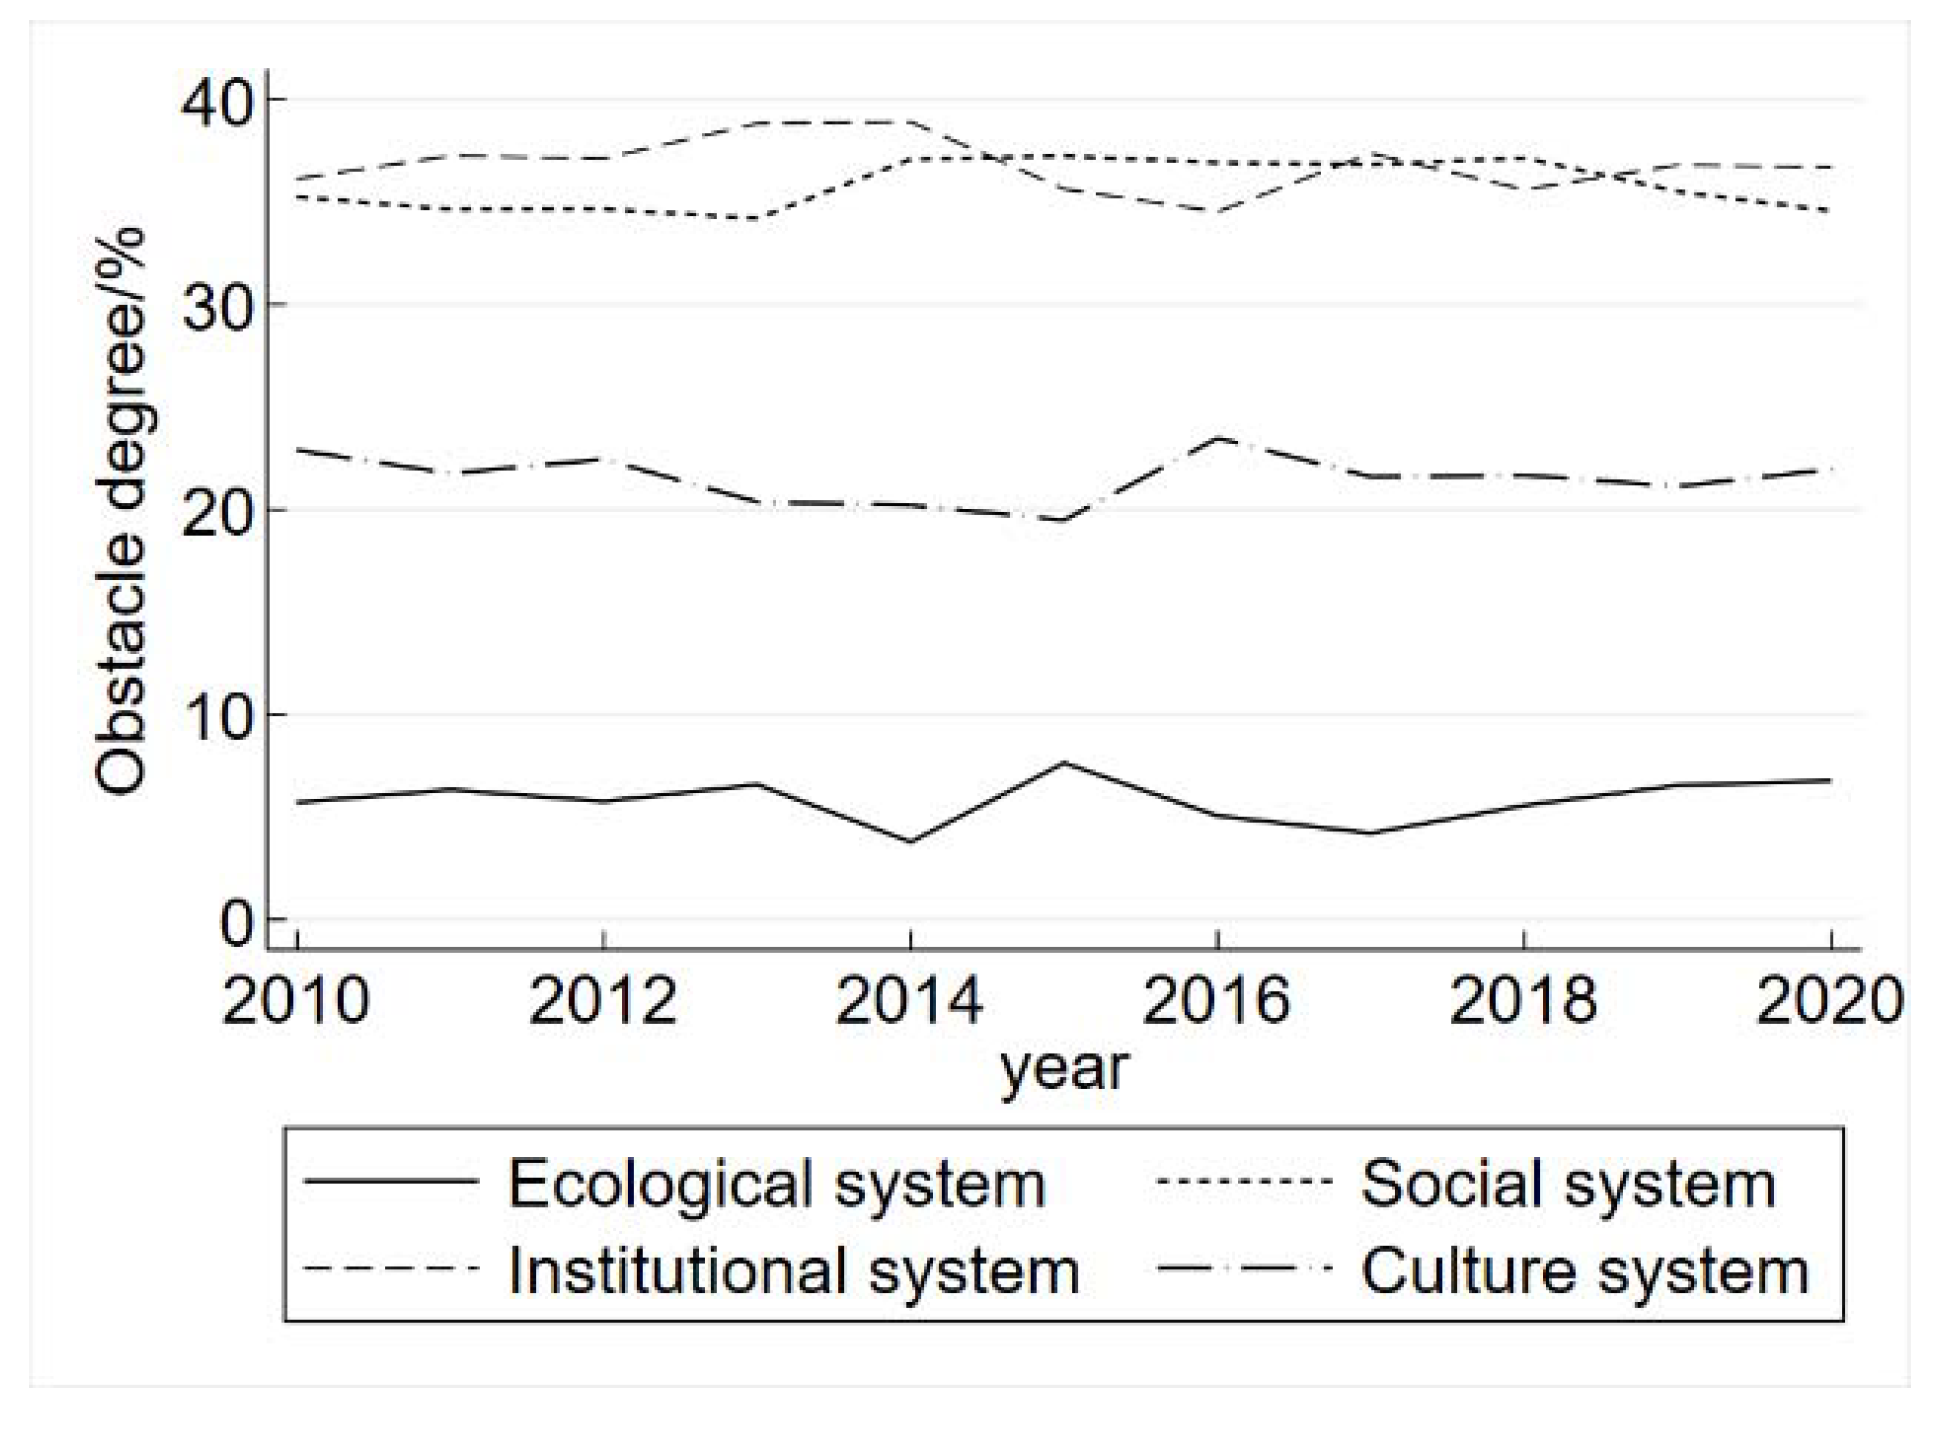
Based on the calculation results of the single index obstacle degree, the obstacle degrees of each subsystem of tourism public services were further measured, which are shown in Figure 7. From the perspective of the development trend, the obstacle degree of each subsystem had no obvious trend change from 2010 to 2020. The relative fluctuation range of the ecological system obstacle degree was large, and there was an obvious trend of “downward-upward-down” from 2013 to 2016. The obstacle degree at the end of the study period was slightly higher than that at the beginning of the study period by 1.05%. The obstacle degrees of the social system and cultural system basically showed a gentle development trend, and the obstacle degrees decreased by 0.68% and 0.94%, respectively, during the study period. The overall obstacle degree of the institutional system presented a gentle “M” type trend change, with a 4.38% difference between the maximum and minimum values. During the study period, the change range was relatively the smallest, only increasing by 0.57%. It can be seen that the obstacles affecting the tourism public services development level during the study period were not effectively solved or continuously deteriorated, which indicates that the tourism public services system had a certain adaptive capacity.
In terms of specific values, the annual average handicap degree of the ecological system, social system, institutional system and cultural system was 5.82%, 35.82%, 36.81% and 21.55%, respectively. In 2015, 2016 and 2018, the primary obstacle system was the social system, and in the other years, it was the institutional system. The obstacle degrees of the two systems were similar and significantly higher than those of the cultural system and ecological system. Because the social system development index was relatively high and the system function was strong, the institutional system development index was relatively low. Therefore, it can be concluded that in the future, the social system will have a lot of room for improvement while the institutional system will face a severe situation. Although the obstacle degree of the cultural system was lower than that of the social system and institutional system, it had no downward trend and the situation was not optimistic. The obstacle degree of the ecological system was the lowest, which indicates that the development process of China’s tourism public services basically followed the “two mountains theory”. From the perspective of the development trend, the ecological system will continue to improve.

5. Conclusions and Discussion

The sustainable development of tourism public services under the concept of resilience was discussed in this paper. Meanwhile, the development level of provincial tourism public services in China from 2010 to 2020 was measured and the spatial–temporal evolution was analyzed. Moreover, the obstacles affecting the development of tourism public services were identified. The conclusions are as follows:
  • Resilience is the sustainable development basis of a regional tourism public service, and maintaining the resilience of the system is also the goal of the sustainable development of tourism public services. According to the theory of adaptive cycles and complex adaptive systems, the tourism public service itself can be regarded as a complex adaptive system composed of multiple elements and covering four subsystems: society, ecology, system and culture. The system itself has problems of internal sustainable development, uneven development within the region, and external uncertain risks such as natural disasters and public health events. Therefore, the structure, function and characteristics of the tourism public services system are constantly adjusted and adapted to the environmental and social changes. Its resilience elements can maintain the secure, stable and orderly development of the system under external disturbances and crisis situations, and it has a good “anti-vulnerability” and “self-adaptability” to form a stable equilibrium state to maintain its own stability. It is an important prerequisite for the sustainable development of tourism public services.
  • When assessing the temporal and spatial evolution characteristics of the tourism public services, we found that the development of China’s tourism public services showed a steady upward trend on the whole while it was vulnerable to external disturbances and was unstable; additionally, an insufficient and unbalanced phenomenon from the overall pattern of the development was obtained. From the perspective of time evolution, except for the decline in 2020 due to the COVID-19 epidemic, the overall development momentum of the tourism public services and its subsystems in this study period was good; however, the development trend was not completely consistent. From the perspective of spatial evolution, the optimization trend of China’s tourism public services development was obvious while the development was not balanced. The overall pattern reflected a certain “Matthew effect”, and the balanced development of each subsystem had certain obstacles. It indicated that spatial–temporal evolution is a complex process and is the result of multiple factors. It also showed that China’s tourism public services system had good adaptability and sustainability. However, the tourism public services and their subelements should further strengthen mutual adaptation and coordination, so as to promote the perfection of the tourism public services system and comprehensively improve the development level of the tourism public services. Therefore, it is better to adapt to the current and future problems and impacts that the development of tourism public services may encounter.
  • Compared with the development of the tourism industry, the development of the tourism public services is still relatively backward. It is particularly important to focus on adjusting the existing development obstacles and implement policies in different areas to improve the quality and efficiency of the tourism public services and even the sustainable development of tourism. According to the obstacle factor analysis, the obstacle degree value of a single index had no obvious change with the progress of time. It indicated that the existing obstacles affecting the development of tourism public services were not effectively solved in this study period, and the adaptive development ability of the system needs to be further improved. According to the development trend of each subsystem obstacle degree, the development of China’s tourism public services should take the integration of culture and tourism and the reform of the supply side structure as an opportunity, focusing on improving the coverage of tourism infrastructure, optimizing the tourism transportation service, strengthening the construction of the tourism talent team, and improving the level of tourism public information services and public security management. In other words, from the social, ecological, institutional and cultural dimensions that constitute the resilience system of tourism public services, relevant measures and strategies for adaptation and recovery were formulated, and the organization of elements and resource allocation of the tourism public services were paid attention to from a dynamic perspective so as to improve the current supply lag of the tourism public services. It is a key problem for the coordinated and sustainable development of tourism public services and their subsystems.
The innovation of this paper is that: (1) It enriches and extends the theoretical connotation of tourism public services. In this paper, the concept of resilience was embedded in the sustainable development of the tourism public services system, and it was proposed that the tourism public services can be regarded as a complex adaptive system composed of multiple elements, including four subsystems: society, ecology, system and culture. The balanced and sustainable development of tourism public services is the result of the comprehensive action of various factors. It is an important way to promote the sustainable and high-quality development of tourism public services and even the tourism industry by building a resilient functional system of diversified, inclusive and innovative tourism public services and making it reach a stable equilibrium state. (2) It strengthens the exploration of the spatial and temporal differentiation of tourism public services. We used ArcGIS, the Moran Index, Kernel density and other methods to investigate the tourism public services as a whole and the four subsystems of society, ecology, system and culture from the perspective of time and space. Meanwhile, we identified the obstacle factors of tourism public services and analyzed the development of tourism public services in multiple dimensions, which increased the fullness and validity of the research on tourism public services. It has significant application value to further control the development trend of China’s tourism public services.
The shortcomings and future research directions of this paper are as follows: Firstly, since tourism public services have not been clearly defined in China, its connotation is constantly enriched and adjusted with the development of society. Therefore, the construction of the tourism public services system under the concept of resilience in this paper is not perfect and is applicable to the specific development stage of the studied region. In future research, it needs to be continuously improved according to the actual situation. Secondly, the development level of the tourism public services was explored in this paper from the perspective of resilience, and its spatial–temporal evolution and obstacle factors were analyzed. However, due to the lack of a clear optimal allocation standard for the tourism public services, the applicability of this research method needs to be further discussed, and its applicability to modeling analyses is an important content of future research on tourism public services. Thirdly, the supply side of the tourism public services was studied in this paper while the balanced development of the tourism public services supply and demand was the premise of its sustainable and high-quality development. Therefore, the next research plan will focus on the demand end of tourism public services and the analysis of the equilibrium between supply and demand, and it will also explore the matching degree and coupling characteristics. And, the mutual influence relationship between tourism public services and the destination tourism economy, tourism scale and other factors will also be the focus of the next research direction. Fourthly, Western countries seldom mention the term “tourism public service” because their “tourism public service” has been well realized in their universal public service. China’s tourism public services are dominated by the government and have a short development history. Future studies will also compare the differences in the development of “tourism public services” between China and Western countries so as to explore a more multidimensional sustainable development path of tourism public services.

Author Contributions

Conceptualization, S.Y. and W.G.; methodology, S.Y. and W.G.; writing—original draft preparation, S.Y.; writing—review and editing, W.G.; visualization, S.Y.; supervision, S.Y. and W.G.; funding acquisition, W.G. All authors have read and agreed to the published version of the manuscript.

Funding

The authors would like to express their gratitude to the Cultural, Artistic, Scientific Planning and Tourism Research Project of Hebei Province (No. HB22-ZD002) and Key Research Base of Humanities and Social Sciences of Colleges and Universities in Hebei Province (JJ2204) for supporting this project.

Data Availability Statement

The datasets used and/or analyzed during the current study are available from the corresponding author upon reasonable request.

Conflicts of Interest

The authors declare no conflict of interest.

References

  1. Seabra, C.; Bhatt, K. Tourism Sustainability and COVID-19 Pandemic: Is There a Positive Side? Sustainability 2022, 14, 8723. [Google Scholar]
  2. Dang, Q. Research on the Impact of Media Credibility on Risk Perception of COVID-19 and the Sustainable Travel Intention of Chinese Residents Based on an Extended TPB Model in the Post-Pandemic Context. Sustainability 2022, 14, 8729. [Google Scholar] [CrossRef]
  3. Miguel, O.M.; Mauricio, C.F.; Assumpció, H.; Wilmer, C.F.; Nathalie, L.B.; Orly, C.F. Post-COVID-19 tourists’ preferences, attitudes and travel expectations: A Study in Guayaquil, Ecuador. Int. J. Environ. Res. Public Health 2022, 19, 4822. [Google Scholar]
  4. Akhtar, N.; Khan, N.; Khan, M.M.; Ashraf, S.; Hashmi, M.S.; Khan, M.M.; Hishan, S.S. Post-COVID 19 tourism: Will Digital Tourism Replace Mass Tourism? Sustainability 2021, 13, 5352. [Google Scholar] [CrossRef]
  5. Shen, K.; Yang, J. Residents’ Support for Tourism Amidst the COVID-19 Era: An application of social amplification of risk framework and knowledge, attitudes, and practices theory. Int. J. Environ. Res. Public Health 2022, 19, 3736. [Google Scholar] [CrossRef]
  6. Chica, M.; Hernández, J.M.; Bulchand, G.J. A collective risk dilemma for tourism restrictions under the COVID-19 context. Sci. Rep. 2021, 11, 504. [Google Scholar] [CrossRef]
  7. Ndou, V.; Mele, G.; Hysa, E.; Manta, O. Exploiting technology to deal with the COVID-19 challenges in travel & tourism: A Bibliometric Analysis. Sustainability 2022, 14, 5917. [Google Scholar]
  8. Wan, Y.K.P.; Li, X.P.; Lau, V.M.C.; Dioko, L. Destination governance in times of crisis and the role of public-private partnerships in tourism recovery from Covid-19, The case of Macao. J. Hosp. Tour. Manag. 2022, 51, 218–228. [Google Scholar]
  9. Li, M.L.; Yin, D.X.; Qiu, H.L.; Baic, B. A systematic review of AI technology-based service encounters: Implications for hospitality and tourism operations. Int. J. Hosp. Manag. 2021, 95, 102930. [Google Scholar] [CrossRef]
  10. Yang, E.J.; Kim, J.W.; Hwang, C.S. The spatial moderating effect of environmental pollution on the relationship between tourism and community resilience. Tour. Manag. 2022, 93, 104554. [Google Scholar] [CrossRef]
  11. João, R. Tourism, smart specialisation, growth, and resilience. Ann. Tour. Res. 2020, 84, 102995. [Google Scholar]
  12. Zeng, Y.X.; Zhong, L.S.; Wang, L.E.; Yu, H. Measuring the conflict tendency between tourism development and ecological protection in protected areas: A study on National Nature Reserves in China. Appl. Geog. 2022, 142, 102690. [Google Scholar]
  13. Kai, K.B.; Matthias, F. Aligning tourism’s socio-economic impact with the United Nations’ sustainable development goals. Tour. Manag. Perspect. 2021, 39, 100831. [Google Scholar]
  14. Wakil, M.A.; Sun, Y.; Chan, H.W.E. Co-flourishing: Intertwining community resilience and tourism development in destination communities. Tour. Manag. Perspect. 2021, 38, 100803. [Google Scholar] [CrossRef]
  15. Luthe, T.; Wyss, R. Assessing and planning resilience in tourism. Tour. Manag. 2014, 44, 161–163. [Google Scholar] [CrossRef]
  16. Cartier, E.; Taylor, L.L. Living in a wildfire: The relationship between crisis management and community resilience in a tourism-based destination. Tour. Manag. Perspect. 2020, 34, 100635. [Google Scholar] [CrossRef]
  17. Beckens, S.; Mahon, R.; Reneie, H.G. The tourism disaster vulnerability framework: An application to tourism in small island destinations. Nat. Hazards 2014, 71, 955–972. [Google Scholar] [CrossRef]
  18. Lew, A.A. Scale, change and resilience in community tourism planning. Tour. Geogr. 2014, 16, 14–22. [Google Scholar] [CrossRef]
  19. Cheung, K.S.; Li, L.H. Understanding visitor-resident relations in over-tourism: Developing resilience for sustainable tourism. J. Sustain. Tour. 2019, 27, 197–1216. [Google Scholar] [CrossRef] [Green Version]
  20. Huang, S.H.; Shao, Y.H.; Zeng, Y.; Liu, X.Y.; Li, Z.Y. Impacts of COVID-19 on Chinese nationals’ tourism preferences. Tour. Manag. Perspect. 2021, 40, 100895. [Google Scholar] [CrossRef]
  21. Liu, A.Y.; Kim, Y.R.; Song, H.Y. Toward an accurate assessment of tourism economic impact: A systematic literature review. J. Trauma Acute Care Surg. 2022, 3, 100054. [Google Scholar] [CrossRef]
  22. Zhang, Z.W.; Plathong, S.; Sun, Y.G.; Guo, Z.; Munnoy, T.; Ma, L.N. Analysis of the island tourism environment based on tourists’ perception—A case study of Koh Lan, Thailand. Ocean Coast. Manag. 2020, 197, 105326. [Google Scholar] [CrossRef]
  23. Xu, D.; Zhang, J.H.; Huang, Z.F.; Zhou, Y.P.; Fan, Q.Y. Tourism community detection: A space of flows perspective. Tour. Manag. 2022, 93, 104577. [Google Scholar] [CrossRef]
  24. Natali, L.; Mikel, A.B.; Jose, A.S.F.; Berta, M.L. Assessing social-ecological vulnerability of coastal systems to fishing and tourism. Sci. Total Environ. 2021, 784, 147078. [Google Scholar]
  25. Anna, S.; Susan, S.; Paul, F.J.E. A decision framework on the choice of management models for park and protected area tourism services. J. Outdoor Rec. Tour. 2019, 26, 72–80. [Google Scholar]
  26. Ivanochko, O.; Gregus, M.; Szałek, M.; Roliński, J.; Stoliński, B. City tourism services with mobile geolocation sharing. Procedia Comput. Sci. 2021, 191, 49–56. [Google Scholar] [CrossRef]
  27. Fei, J.H.; Lin, Y.; Jiang, Q.T.; Jiang, K.H.; Li, P.L.; Ye, G.Q. Spatiotemporal coupling coordination measurement on islands’ economy-environment-tourism system. Ocean Coast. Manag. 2021, 212, 105793. [Google Scholar] [CrossRef]
  28. Ma, S.G.; He, Y.; Gu, R. Joint service, pricing and advertising strategies with tourists’ green tourism experience in a tourism supply chain. J. Retail. Consum. Serv. 2021, 61, 102563. [Google Scholar] [CrossRef]
  29. Li, S.; Huang, F.C.; Li, J.Z. Tourism public services: Connotation, characteristics and classified framework. Tour. Trib. 2010, 25, 20–26. [Google Scholar]
  30. Holling, C.S. Resilience and stability of ecological systems. Annu. Rev. Ecol. Syst. 1973, 7, 1–23. [Google Scholar] [CrossRef]
  31. Farley, J.; Voinov, A. Economics, socio-ecological resilience and ecosystem services. J. Environ. Manage. 2016, 183, 389–398. [Google Scholar] [CrossRef]
  32. Wang, J.F.; Chen, M.Y.; Feng, L.J.; Yue, J.J. The construction of enterprise tacit knowledge sharing stimulation system oriented to employee individual. Procedia Eng. 2017, 174, 289–300. [Google Scholar]
  33. Sabatier, R.; Joly, F.; Hubert, B. Assessing both ecological and engineering resilience of a steppe agroecosystem using the viability theory. Agric. Syst. 2017, 157, 146–156. [Google Scholar] [CrossRef]
  34. Angus, R.; Mclntosh, I.C.B. Ecological and Evolutionary Consequences of Disturbance in Freshwater Ecosystems. Encycl. Inland Waters 2022, 2, 370–381. [Google Scholar]
  35. Francesca, M.; Ben., L.; Fiona, M.; George, M.C.; David, L. Monitoring tourists’ specialisation and implementing adaptive governance is necessary to avoid failure of the wildlife tourism commons. Tour. Manag. 2020, 81, 104160. [Google Scholar]
  36. Ali, E.A.; Halit, K.K.; John, C.B. Complex adaptive systems theory and firm product innovativeness. J. Eng. Technol. Manag. 2014, 31, 21–42. [Google Scholar]
  37. John, E. Cannibals with forks: The triple bottom line of 21st century business. Altern. J. 1999, 25, 42. [Google Scholar]
  38. Darcy, S.; Cameron, B.; Pegg, S. Accessible tourism and sustainability: A discussion and case study. J. Sustain. Tour. 2010, 18, 515–537. [Google Scholar] [CrossRef]
  39. Sisto, R.; Cappelletti, G.M.; Bianchi, P.; Sica, E. Sustainable and accessible tourism in natural areas: A participatory approach. Curr. Issues Tour. 2022, 25, 1307–1324. [Google Scholar] [CrossRef]
  40. Cisneros-Martínez, J.D.; Mccabe, S.; Fernández-Morales, A. The contribution of social tourism to sustainable tourism: A case study of seasonally adjusted programmes in Spain. J. Sustain. Tour. 2018, 26, 85–107. [Google Scholar] [CrossRef]
  41. Zhang, H.; Tao, L.Y.; Ding, J.; Fang, W.J. Study on coupling coordination between tourism public service quality and tourism economic level in the Yangzeriver economic belt. J. Hefei Univ. Technol. 2021, 35, 1–10. (In Chniese) [Google Scholar]
  42. Weng, G.M.; Li, C.H.; Pan, Y.; Li, J.P. Analysis on the spatio-temporal evolution and formation mechanism of tourism public service mismatch: Taking nine provinces on the silk road economic belt as cases. Ecol. Econ. 2021, 37, 125–131. (In Chniese) [Google Scholar]
  43. Gong, Z.G.; Guo, R.; Ma, H.Q.; Li, Z. Tourism economy-tourism public service-population urbanization coupling coordinated development of space-time evolution. Stat. Decis. 2021, 19, 83. (In Chinese) [Google Scholar]
  44. Xu, Y.F.; Liu, T. Coupling relationship and coordinated development of tourism public service supply and demand. Soc. Sci. 2020, 20, 35–40. [Google Scholar]
  45. Gisleine, C.Z.; Janaina, F.G.; Evandro, A.B.; Jean, P.O. How sustainable is the nitrogen management in Brazil? A sustainability assessment using the Entropy Weight Method. J. Environ. Manag. 2022, 316, 115330. [Google Scholar]
  46. Kamill, D.; Kovács, I.H. Tracing out the effect of transportation infrastructure on NO2 concentration levels with Kernel Density Estimation by investigating successive COVID-19-induced lockdowns. Environ. Pollut. 2022, 309, 119719. [Google Scholar]
  47. Yuan, Y.M.; Cave, M.; Zhang, C.S. Using Local Moran’s I to identify contamination hotspots of rare earth elements in urban soils of London. Appl. Geochem. 2018, 88, 167–178. [Google Scholar] [CrossRef]
  48. Zhou, J.L.; Wu, Y.N.; Liu, F.T.; Tao, Y.; Gao, J.W. Prospects and obstacles analysis of applying blockchain technology to power trading using a deeply improved model based on the DEMATEL approach. Sustain. Cities Soc. 2021, 70, 102910. [Google Scholar] [CrossRef]
Figure 1. Theoretical framework of tourism public services development with resilience theory.
Sustainability 15 00004 g001
Figure 2. Comprehensive index of China’s tourism public services development trend.
Sustainability 15 00004 g002
Figure 3. China’s tourism public services development trend of each subsystem.
Sustainability 15 00004 g003
Figure 4. Spatial evolution pattern of comprehensive index of China’s tourism public services development level: (a) 2010; (b) 2012; (c) 2014; (d) 2016; (e) 2018; (f) 2020.
Sustainability 15 00004 g004aSustainability 15 00004 g004b
Figure 5. Kernel density evolution curve of China’s tourism public services subsystem: (a) ecological system; (b) social system; (c) institutional system; (d) culture system.
Sustainability 15 00004 g005
Figure 6. Scatterplot of local spatial autocorrelation of China’s tourism public services: (a) 2010; (b) 2012; (c) 2014; (d) 2016; (e) 2018; (f) 2020. The corresponding relationship between the numbers and provinces in Figure 6 is as follows: 1—Beijing; 2—Tianjin; 3—Hebei; 4—Shanxi; 5—Neimenggu; 6—Liaoning; 7—Jijin; 8—Heilongjiang; 9—Shanghai; 10—Jiangsu; 11—Zhejiang; 12—Anhui; 13—Fujian; 14—Jiangxi; 15—Shandong; 16—Henan; 17—Hubei; 18—Hunan; 19—Guangdong; 20—Guangxi; 21—Hainan; 22—Chongqing; 23—Sichuan; 24—Guizhou; 25—Yunnan; 26—Xizhang; 27—Shanxi; 28—Gansu; 29—Qinghai; 30—Ningxia; 31—Xinjiang.
Sustainability 15 00004 g006aSustainability 15 00004 g006b
Figure 7. China’s tourism public services obstacle degree of each subsystem in 2010–2020.
Sustainability 15 00004 g007
Table 1. Interpretation of the evaluation indicators of the development level of tourism public services.
Target LayerSystem LayerCriterion LayerIndex LayerIndicator Meaning
Development level of tourism public servicesEcological systemTourist public environmentE1 Forest coverage rate (%)It represents the forest resources and woodland possession
E2 Afforestation coverage rate of built-up area (%)It represents the greening level of urban public environments
E3 Per capita park green area (m2/person)It represents the level of human settlement environments
E4 Harmless treatment rate of household garbage (%)It represents the ability and level of environmental governance
E5 Centralized treatment rate of sewage treatment plants in municipal districts (%)
E6 SO2 emissions (ten thousand tons)It represents the regional environmental pollution status
Social systemTourism public informationS1 Mobile phone penetration (%)It represents the level of regional communication
S2 Broadband internet access port (ten thousand number)It represents the development level of the Internet
S3 Comprehensive population coverage of television programs (%)It represents the coverage status of communication facilities
S4 Broadcast coverage (%)
Tourist transport servicesS5 Urban road area per capita (m2)It represents the level of urban transport infrastructure
S6 Public transport vehicles for every 10,000 people (number)It represents the level of public transport
S7 Railway operating mileage (ten thousand kilometers)It represents the accessibility of regional tourism transportation
S8 Railway passenger traffic volume (ten thousand people)It represents the development level of regional railway traffic
S9 Highway passenger capacity (ten thousand people)It represents the development level of regional highway traffic
Tourism infrastructureS10 Each unit has a public toilet (seat/ten thousand person)It represents public infrastructure conditions
S11 Number of travel agencies (number)It represents the supporting level of regional tourism public services
S12 Number of star hotels (number)
Institutional systemTravel safety servicesI1 Number of health personnel (ten thousand person)It represents the regional medical rescue capacity
I2 Health technicians per 10,000 people (person)
I3 Number of beds in medical institutions per 10,000 people (number)
I4 Local finance and public security expenditure (100 million yuan)It represents the strength of policy support for public security
I5 Number of health institutions (number)It represents the level of regional medical service supporting
Tourism human resourcesI6 Employment personnel of travel agency (person)It represents the labor force in the tourism industry
I7 Star hotel employment staff (person)
I8 Employment in tourist attractions (person)
Cultural systemTourism and entertainment servicesC1 Number of performing arts groups (number)It represents the regional art and cultural environment
C2 Total retail sales of consumer goods (100 million yuan)It represents the consumption level of residents and its dynamics
C3 Number of museums (number)It represents the richness of regional cultural resources
C4 Public library (number)
Table 2. Descriptive statistics of variables.
NameSample SizeMean ValueStandard DeviationMinimum ValueMaximum Value
E1 Forest coverage rate34133.67318.2014.266.8
E2 Afforestation coverage rate of built-up area 34139.2374.09018.155.10
E3 Per capita park green area 34112.7682.8645.7821.05
E4 Harmless treatment rate of household garbage34191.23612.74538.00100.00
E5 Centralized treatment rate of sewage treatment plants in municipal districts34184.69515.1480.0699.6
E6 SO2 emissions 34145.70439.8290.18182.74
S1 Mobile phone penetration 34195.98025.88140.87189.46
S2 Broadband internet access port 3411847.9211673.89917.88653.2
S3 Comprehensive population coverage of television programs 34198.5361.46291.4100
S4 Broadcast coverage34197.9492.20287.6100
S5 Urban road area per capita 34115.6324.7584.0426.76
S6 Public transport vehicles for every 10,000 people34112.4103.1156.226.55
S7 Railway operating mileage 3410.3770.2280.041.42
S8 Railway passenger traffic volume3418083.8425667.7898438,699
S9 Highway passenger capacity 34162,615.79067,989.968576556,510
S10 Each unit has a public toilet 3413.0331.1260.778.15
S11 Number of travel agencies 341962.035655.585783390
S12 Number of star hotels 341345.085189.753551008
I1 Number of health personnel 34134.65622.4571.67102.79
I2 Health technicians per 10,000 people34161.07917.56725155
I3 Number of beds in medical institutions per 10,000 people 34150.27613.07815.5979.5
I4 Local finance and public security expenditure341265.971206.4374.791428.11
I5 Number of health institutions 34131,609.81822,092.285412986,939
I6 Employment personnel of travel agency34111,868.31711,652.30952666,522
I7 Star hotel employment staff 34142,274.27337,159.124364372,838
I8 Employment in tourist attractions 34128,554.19632,562.665141202,284
C1 Number of performing arts groups 341379.282448.751162859
C2 Total retail sales of consumer goods 3419408.6058214.641192.442,951.80
C3 Number of museums341127.32894.5292577
C4 Public library 341100.21146.2414207
Table 3. Comprehensive index and subsystem index score of tourism public services development level.
PeriodEcological SystemSocial SystemInstitutional SystemCultural SystemIndex
20100.0550.0900.0540.0230.222
20110.0530.1030.0500.0260.232
20120.0570.1000.0490.0320.238
20130.0450.0970.0610.0320.236
20140.0610.1140.0620.0380.275
20150.0560.1130.0650.0430.277
20160.0640.1080.0690.0480.289
20170.0730.1150.0670.0550.310
20180.0830.1120.0700.0590.325
20190.0820.1150.0720.0590.329
20200.0670.1010.0720.0560.296
Table 4. Ranking of main obstacles to the development of tourism public service.
No.201020122014201620182020
OFsOB/%OFsOB/%OFsOB/%OFsOB/%OFsOB/%OFsOB%
1C110.04C110.31I89.54C112.15C110.08C19.47
2I89.56I89.15S99.02I89.58S98.70I88.88
3S98.92S98.71C18.43S98.85I88.33S98.18
4I66.35I67.04I67.38I76.03I67.40I67.02
5S26.25C26.16S26.12S25.61C26.13C26.29
6C25.99S25.97C25.91I65.32S25.97S26.19
7I75.35I75.56I75.81C35.06I75.41I55.68
8C34.98I55.38I54.93C25.01C34.43I75.18
Disclaimer/Publisher’s Note: The statements, opinions and data contained in all publications are solely those of the individual author(s) and contributor(s) and not of MDPI and/or the editor(s). MDPI and/or the editor(s) disclaim responsibility for any injury to people or property resulting from any ideas, methods, instructions or products referred to in the content.