Article

Long-Term Cross-Slope Variation in Highways Built on Soft Soil under Coupling Action of Traffic Load and Consolidation

1
School of Highway, Chang ’an University, Xi’an 710064, China
2
Innovation Research Institute of Shandong High-Speed Group, Jinan 250000, China
3
Shandong Hi-Speed Group Co., Ltd., Jinan 250000, China
*
Author to whom correspondence should be addressed.
Sustainability 2023, 15(1), 33; https://doi.org/10.3390/su15010033
Submission received: 21 November 2022 / Revised: 13 December 2022 / Accepted: 16 December 2022 / Published: 20 December 2022

Abstract

:
The variation in road cross slope with service life affects the pavement drainage and has an adverse effect on vehicle operation safety. This paper describes a cross-slope variation prediction method influenced by the coupling effect of traffic load and soil consolidation, considering characteristics of embankment to cover the shortage for insufficient consideration of compacted embankment. First, the traffic load-induced settlement equation of a highway on soft soil foundation was introduced, which considers the effects of traffic load stress, confining pressure, soil structure, strength weakening and cyclic loading times on different positions along the cross-section. Then, the finite element model of a highway on soft soil foundations under soil consolidation is established, considering the influence of soil seepage. Finally, predictions of long-term settlement and cross-slope variation generated by coupling action of traffic load and soil consolidation were carried out with contrastive analysis with measured data. We find the following: (1) the long-term settlement was mostly from the consolidation of natural soft subsoil, while the cross-slope variation was mainly affected by traffic load; (2) variation in the cross slope of highway in soft soil areas mainly occurs within 1 year of operation. The effect of passenger cars and trucks on cross-slope variation shows diametrically opposite results, as the passenger car lane decreases while the truck lane increases; (3) the relative error of the cross-slope variation prediction results with the measured data are 2.86% and 2.5% for the left and right lane cross slopes, respectively.

1. Introduction

The road cross-section index is an important indicator affecting road traffic safety. Reasonable setting of cross slopes ensures speedy water drainage off roads, reducing the risks of safety hazards such as hydroplaning [1]. However, the permanent deformation of the roadway will alter the cross slope, which in turn impacts the service performance of the highway. Not only will the cyclic traffic loads cause highway long-term deformation, but also the consolidation of soil. Therefore, to accurately predict the road cross slope in order to control the service life and maintenance costs of the highway, it is necessary to investigate the deformation with consideration of the coupling effect of traffic loads and consolidation on the lateral distribution along the road. The existing research on highway deformation prediction can be divided into two groups: (1) prediction of consolidation settlement caused by embankment filling; and (2) cumulative deformation under traffic load.
The pore water in the saturated soil of the roadbed gradually dissipates under the action of external load to produce consolidation and settlement. Consolidation settlement was obtained in most cases using Terzaghi’s one-dimensional consolidation theory [2]. Santos developed a three-dimensional consolidation theory with a wider range of applications, which simplified the solution of two- and three-dimensional consolidation solution problems by calculus calculations [3]. Based on this, Sandhu et al. [4] analyzed the coupled consolidation problem using the finite element method. In addition, the field deformation analysis (FDA) method is based on actual measured data of field roadbed settlement deformation presented by Loganathan et al. [5] for analyzing the roadbed settlement and lateral deformation problems. Based on the development of the above results, the existing methods for soft soil consolidation settlement prediction can be divided into four groups: (1) empirical equations; (2) graphical methods; (3) neural networks; and (4) numerical methods. For example, a logistic prediction model proposed by Zhu et al. [6] based on measured data improves the accuracy under the condition of sufficient measured data. However, the hyperbolic and neural network hybrid model proposed by Liu et al. [7] significantly improves accuracy over the hyperbolic model and requires high accuracy of the measured data. Huang [8] established a finite element model to analyze the dynamic settlement of the roadbed during the filling process, and found that the finite element method can better simulate the roadbed’s filling process and settlement process. Furthermore, the precise monitoring of road settlement by Interferometric Synthetic Aperture Radar (InSAR) technology provides an effective means to obtain actual road settlement data to ensure the sustainable operation of highways [9].
The major methods for predicting foundation settlement due to traffic load can be divided into three groups: (1) empirical equations; (2) equivalent static methods; and (3) numerical methods. The empirical equation integrates the intuitiveness of the function expression and the accuracy of the actual test data. It can reflect the influence of the number of load actions and other factors on the soil deformation, while the calculation results have high accuracy. The commonly used power equation was proposed by Monismith [10] to describe the relationship between foundation deformation and the number of load actions. It has good consistency in calculating the cumulative plastic strain. However, the randomness of taking constant values for different soils is relatively large. Li [11] gave a reference range of constant values for the power equation based on the large randomness of the constant values. Chai et al. [12] modified the parameters of the power equation and proposed a new empirical equation, which considers the effect of stress history and initial static deflection stress of the soil. Sakai et al. [13] proposed a logarithmic model of cumulative plastic strain under partially drained conditions in powdered clay soils based on cyclic triaxial soil tests. Wei et al. [14] proposed an empirical model of residual deformation of soft soil under traffic load by equating the traffic load as a static load, combined with examples to prove the validity. Zhuang et al. [15] found that vehicle speeds and numbers of the traffic load cycles had significant effects on the settlement of the embankment just above the subsoil by the finite element model. Lü et al. [16] calculated the dynamic stress of roadbeds under traffic load by elastic theory solution, considering the number of cyclic load actions and pore pressure to obtain the relationship between roadbed settlement deformation and load number actions. The method of using empirical formula is simple and practical, while the accuracy of the calculation results can be guaranteed.
Existing studies mainly concentrating on the deformation of foundation caused by the traffic loads and consolidation aim to ensure long-term road structural stability. However, deformation’s effect on cross-slope variation is rarely taken into account. Still, the foundation settlement caused by traffic loads is limited due to the presence of compacted embankment. The available research shows that studies on cross-slope variation in long-term deformation of highways under the coupling effect of traffic loads and consolidation are rather limited, and hence these related investigations make much sense. In this paper, a combined empirical equation and numerical method solution for road settlement prediction is proposed, taking into account the coupling action of traffic loads and consolidation on compacted embankment and foundation. The cross-slope variation induced by uneven highway settling is then investigated. In order to confirm the reliability, the forecast results are lastly checked with the actual measurement data.

2. Methodology

2.1. Cumulative Deformation Caused by Traffic Load

Empirical equations combine the clarity of function expressions with the precision of actual test results, allowing them to accurately depict the influence of various factors on soil deformation. A number of empirical equations that take into account various relevant factors have been proposed to predict the permanent deformation of road under repeated load. Among them, the index equation proposed by Xu et al. [17], which accurately predicted cumulative plastic strains of roads caused by traffic loads, was able to reflect the influence of coupling effect of dynamic and static deviatoric stress, confining pressure, soil structure, strength weakening, and cyclic loading times:
ε p = a q d χ q s 1 χ S σ q u l t c q d χ q s 1 χ m p p a n e k N b
where q d = traffic-load-induced dynamic deviatoric stress; q s = initial static deviatoric stress; q u l t = undrained shear strength of soft subsoil, S σ = stress sensitivity; χ = weighting of the effect of dynamic and static deviatoric stresses; p = confining pressure; p a = standard atmospheric pressure; N = number of repeated traffic load applications; a , b , c , m and n = constants.
Based on Equation (1) and considering both the layered characteristic of basement and lateral dynamic traffic load distribution, the cumulative settlement can be evaluated using a layerwise summation method. The methods for determining the variables and constants in Equation (1) are as follows:
  • Dynamic deviatoric stress q d . The real stress field induced by traffic loading includes a simultaneous cyclic variation in vertical normal stress, horizontal normal stress, and shear stress. The distribution of dynamic deviatoric stress along the cross-section of the road is influenced by the position of vehicle load [18]. Several points along the road cross-section direction as (shown in Figure 1) were selected to obtain the lateral distribution characteristics of dynamic deflection stress. The dynamic deviatoric stress can be calculated as follows:
    q d = 1 2 Δ σ 11 Δ σ 22 2 + Δ σ 11 Δ σ 33 2 + Δ σ 22 Δ σ 33 2 + 6 Δ σ 12 2
    where Δ σ 11 , Δ σ 22 and Δ σ 33 = the normal stress amplitudes in x, y and z directions, respectively; Δ σ 12 = shear stress component amplitude.
  • Initial deviatoric stress q s . It is included in the static distribution in subsoil using finite element simulations and manual calculations and is calculated in the paper as follows:
    q s = σ v σ h = γ i h i K 0 σ v i
    where σ v = vertical stress; σ h = lateral stress; γ i h i = effective stress due to the gravity force of subsoil; K 0 = lateral soil pressure coefficient; σ v i = vertical stress increment of i-th layer of soil.
  • Undrained shear strength of soft subsoil q u l t . According to the existing consolidation theory, the undrained shear strength of soft subsoil can be calculated as the following:
    q u l t = c c u cos ϕ c u 1 sin ϕ c u + 1 + K 0 2 σ z sin ϕ c u 1 sin ϕ c u
    where c c u = cohesion of soil; ϕ c u = Internal friction angle of soil; σ z = normal stress in the soil along the vertical direction.
  • Stress sensitivity S σ . Stress sensitivity was proposed by Chandler [19] to respond to the influence of soil properties on accumulated deformation, which reflects the difference between remodeled soils and structural soils from the perspective of structural resistance during loading compression deformation. The stress sensitivity corresponding to the solidified yield state can be calculated as follows:
    S σ = σ v y σ v e *
    where σ v y = structural yield stress, obtained from the in situ soil compression curve; σ v e * = corresponding value of vertical effective stress on intrinsic compression line.
  • Parameters χ and c . The parameter χ controls the effect weight of dynamic and static deviatoric stresses on the accumulation of plastic strain. Xu [17] showed that the greater the sum of dynamic and static deviatoric stresses, the more cumulative the plastic deformation. The effect of dynamic stress is more pronounced when the total dynamic and static partial stresses are known. The recommended range of χ is 0.5~0.75647. The softening index is widely used to describe the strength weakening of soils under cyclic loading, while the parameter c determines the magnitude of the softening index under dynamic and static deviatoric stresses. The recommended value of c is 0.767.
  • Constants a , m and n . The constants a and m describe the impact of dynamic and static stress levels on the accumulated strain in the first axial cycle, where the accumulated strain grows exponentially with the first axial cycle strain. Constants a and m can be obtained from the fitting curve of indoor tests. The constant n controls the impact of confining pressure on accumulated strain, with suggested value for 0.5 [20].
  • Constants b and k . The parameters b and k control the increment rate of plastic strain with the number of repeated load applications. The parameter b taken ranges from 0.5 to 0.7, while the parameter k varied significantly according to the indoor test results [21]. The type of soil has an impact on the value of k, the value for soft soil is determined by indoor testing in most studies, while the value of k for compacted embankment is infrequently discussed. According to the Mechanistic-Empirical Pavement Design Guide (MEPDG) [22], the parameters b and k for embankment can be determined as follows:
    log b = 0.61119 0.017638 W c
    k = 10 9 C 0 1 10 9 b b
    where W c = water content; C 0 = constant influenced by elastic modulus.

2.2. Cumulative Deformation Due to Soil Consolidation

Currently, studies have focused on the deformation of soft ground focus on the traffic-load-induced settlement while ignoring the amount of consolidation and settlement of the road itself before operation. Road consolidation settlement appears to be larger at the center and smaller at the shoulder [23]; however, it is necessary to discuss how uneven settlement brought on affects the cross slope. The foundation deformation problem can be reduced to a problem of planar deformation and spatial seepage by the finite element method (FEM) to examine the road consolidation settlement. The ground stress balance setting in the finite element model used in this paper ensures that the initial circumstances of the model are aligned with the actual project. The seepage problem was taken into account in addition to the pore water dissipation process during consolidation, where parameters such as initial pore ratio, effective stress and pore pressure were set by means of predefined fields.
Boundary conditions were set to be horizontally constrained on both sides, so the bottom of the foundation is completely constrained and the slope of the side slope is not constrained. The initial pore ratio, initial effective stress and initial pore pressure were defined to analyze the seepage of the soil, with hydrostatic pore pressure boundary that increases linearly in depth for the soil below the groundwater line. The roof of soil off the slope foot was set as a free drainage boundary with pore pressure to 0. The grid division of the model adopts the form of a dense outer sparse space in the embankment area, considering the improvement in the calculation accuracy and calculation efficiency of the uneven lateral settlement of the highway. The Drucker–Prager (D–P) elastoplastic constitutive model was adopted by the embankment and mucky clay, while the clay plasticity model was adopted by the silty clay. The sequence of paving and pre-compaction in the model is consistent with the actual paving process to obtain the deformation of the highway more accurately. The specific modeling process is described in Section 3.2.

2.3. Highway Long-Term Deformation Calculation Model

The embankment is subjected to the long-term effects of consolidation and traffic dynamic loads during the opening process [24]. Since the limited effect of traffic load on the road in depth, the cumulative deformation under cyclic dynamic loads S 1 and the consolidated deformation caused by self-weight of foundation S 2 were considered. The final form of the highway long-term deformation calculation model is given as follows:
S = S 1 + S 2 = i = 1 n a i q d i χ i q s i 1 χ i S σ i q u l t i c i q d i χ i q s i 1 χ i m i p i p a n i e k i N b i h i + S 2
where S = long-term deformation of highway. The calculation steps are shown in the chart with respect to the highway long-term deformation in Figure 2.

3. Results

3.1. Description of Rongwu Highway

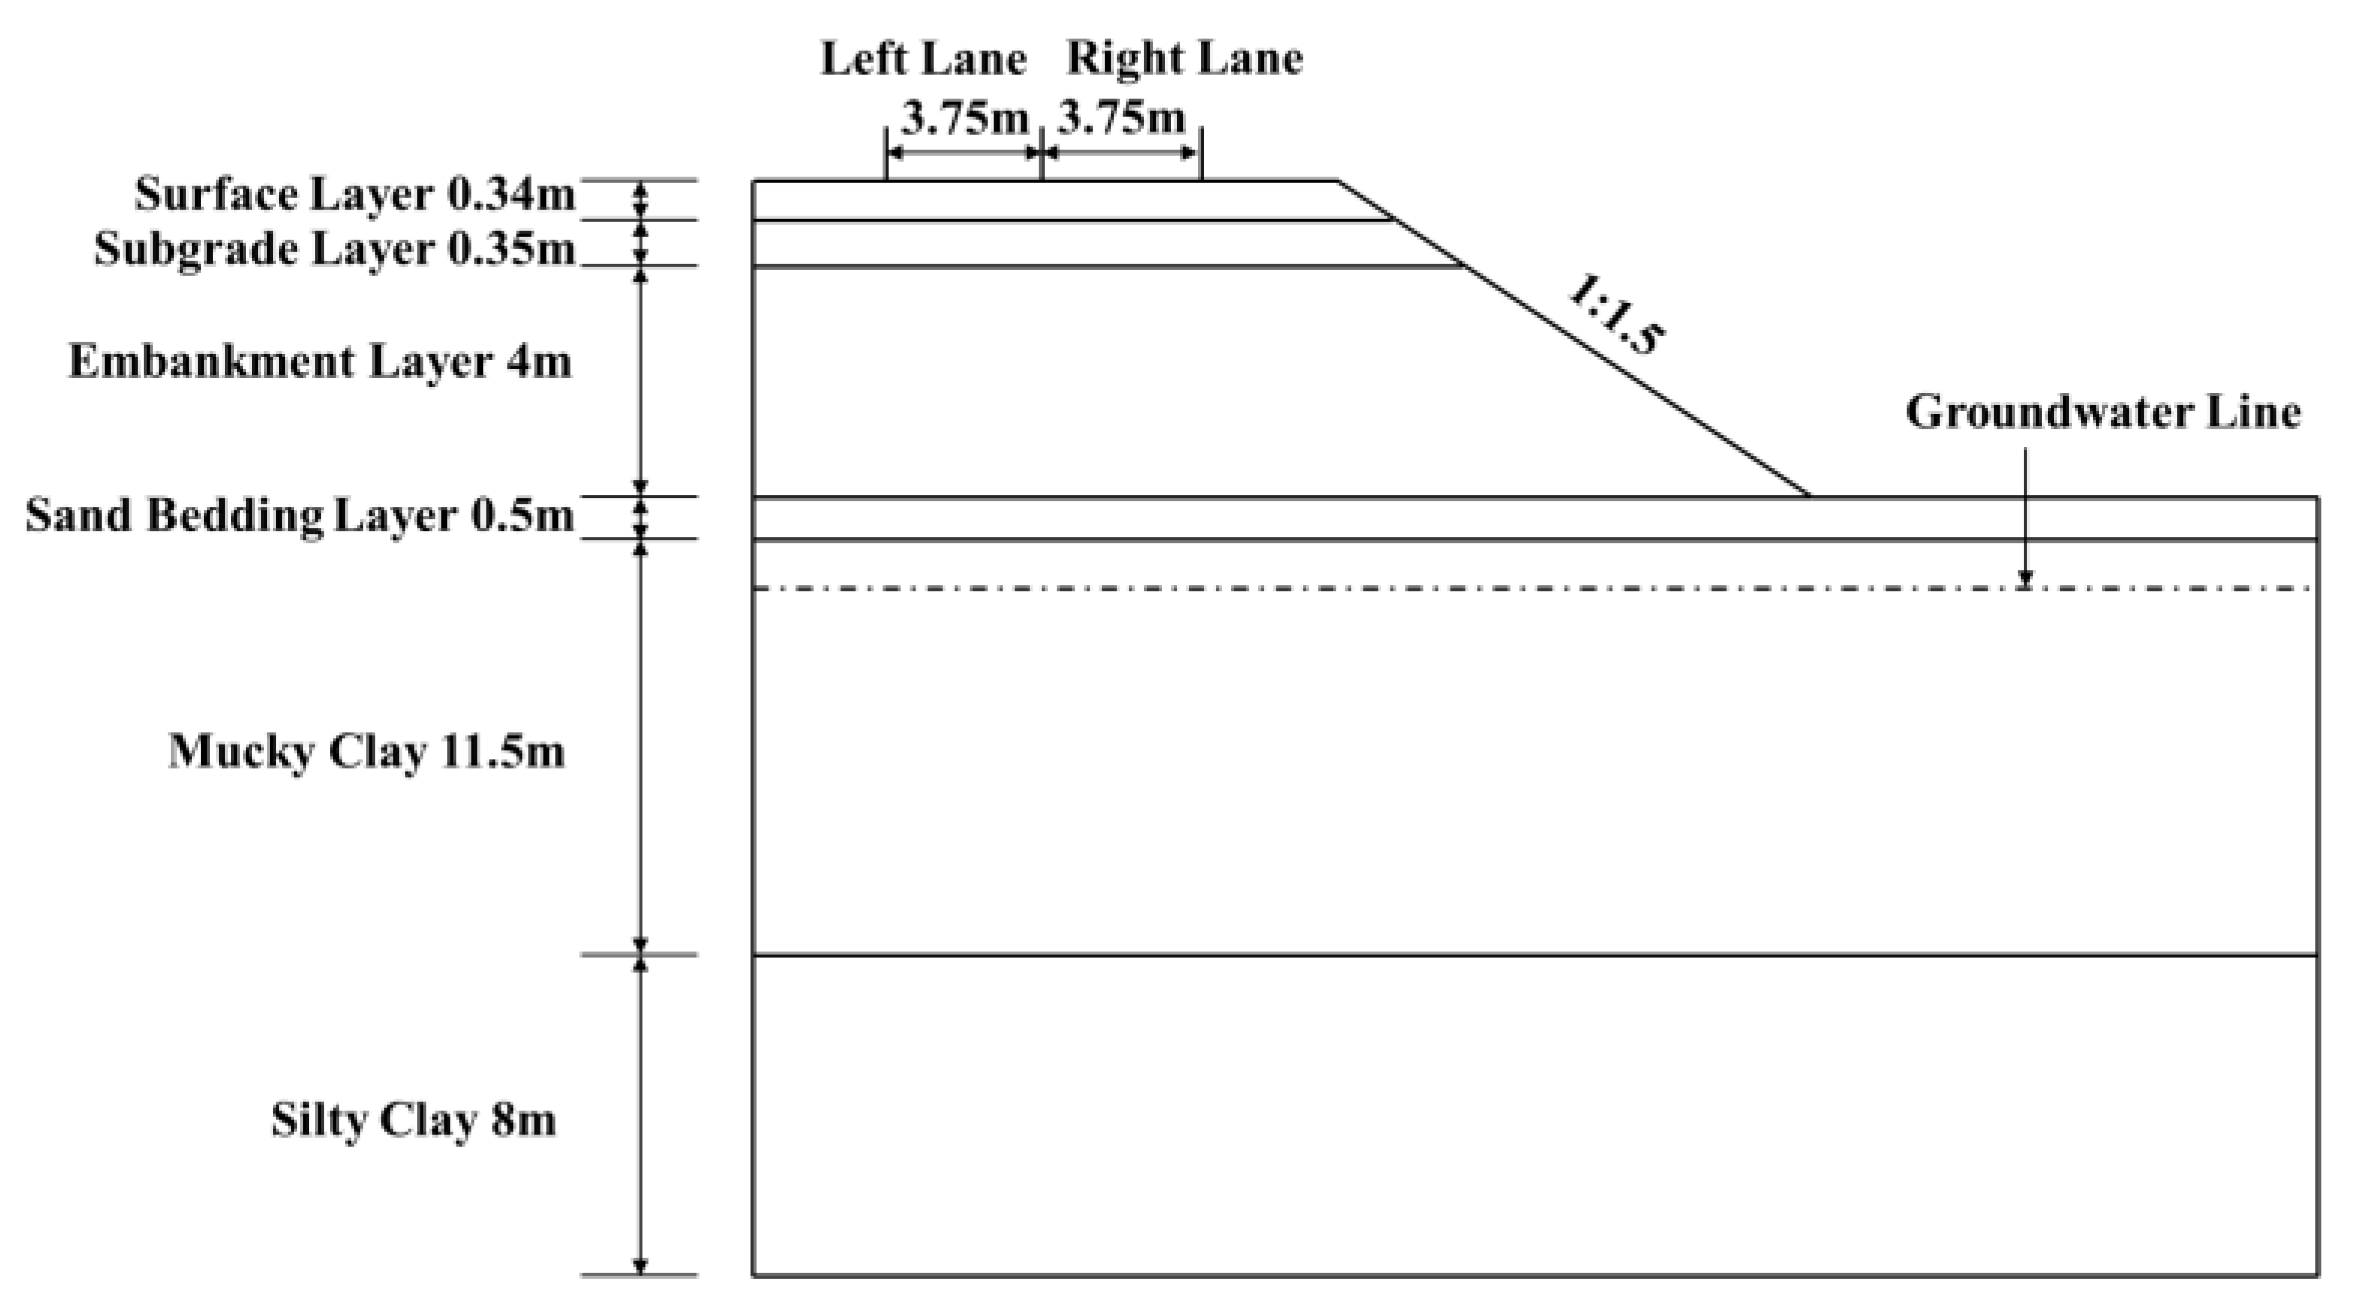
To further understand the influence of road settlement on road cross-slope variation, an actual project is selected for contrast analysis. The Laishan section of the Shandong Rongwu Highway in China is located in a soft soil area, designed for a speed of 80 km/h, 2% cross slope, with two lanes in both directions having a lane width of 3.75 m. Mixing 4% of cement into the embankment ensures the structural stability of the highway built on soft ground. A typical pavement structure is shown in Figure 3, where the groundwater table line is located 1.0 m below the sand bedding level. The parameters of the soft ground model calculation are shown in Table 1. The observed traffic volume in 2020 is adopted as the base year traffic volume, and the analysis is conducted according to the traffic growth rates of 4%, 6%, and 8% as shown in Figure 4, respectively, in order to understand the impact of traffic growth rate on road deformation.

3.2. Practical Application Analysis

(1)
Solidification settlement
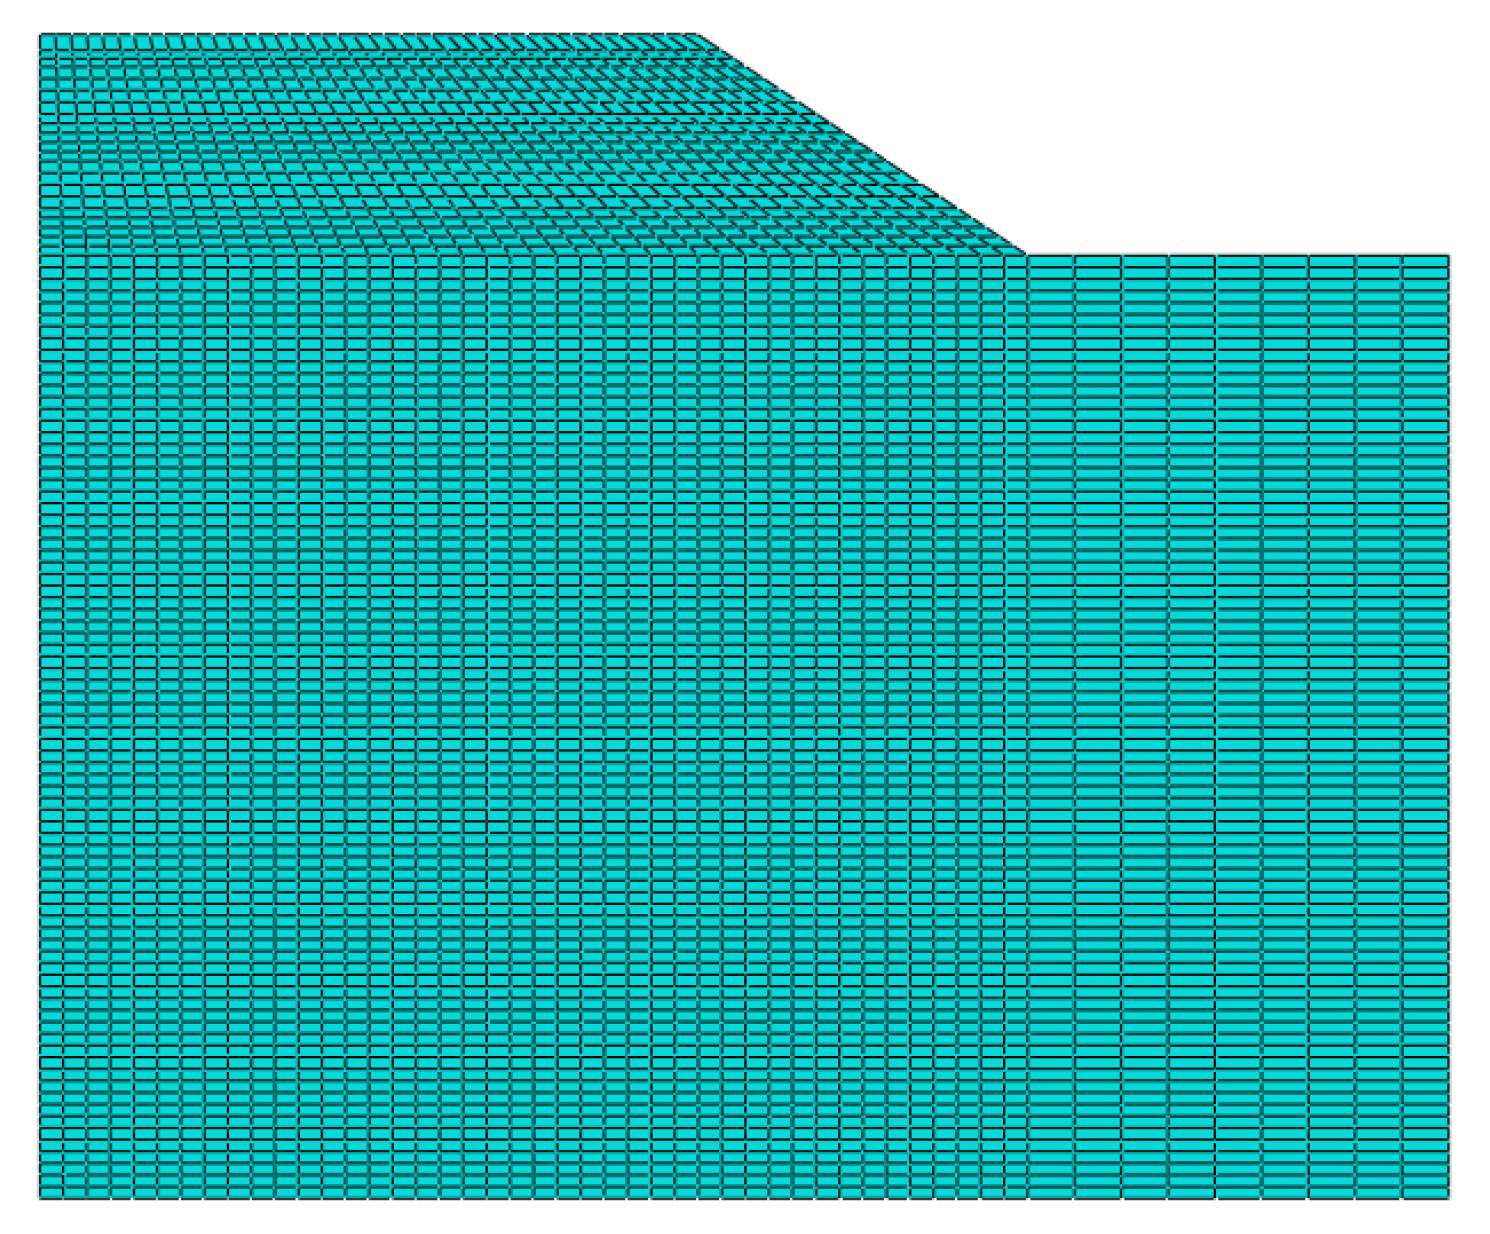
Four-node plane strain quadrilateral element were used to model the consolidation of the Rongwu Highway. The Drucker–Prager parameters and clay plasticity parameters for FEM analysis are shown in Table 2 and Table 3. The finite element mesh used to represent Rongwu Highway is shown in Figure 5. The grid size of the embankment and the area below is 0.5 m, while the grid size of the outer side of the road is 1 m. The distribution of road surface settlement under consolidation 10 years after the completion of the embankment is given in Figure 6. Settlement at the center of the pavement surface 1 year after the completion of the surface is 5.77 cm. In contrast, the settlement at the shoulder is 4.01cm, which means 1.76 cm of uneven settlement on the pavement surface. Uneven settlement of the pavement surface arrived at 2.51 cm 10 years after the completion of the road surface. It is noted that uneven settlement due to highway soil consolidation cannot be ignored, which will become increasingly obvious in the succeeding years. Variations in highway cross-sectional indicators occurred due to uneven settlement, affecting vehicle traffic safety.
(2)
Traffic load-induced settlement
Overall consideration of the effect of traffic load on the plastic deformation of highways is required from various factors, including traffic volume, vehicle speed, and materials of each layer. The current empirical model rarely considers the effect of deformation on road surface and subgrade because the permanent deformation of the asphalt layer under the cumulative load with only a few millimeters indicates that the deformation under the influence of vehicle loading is negligible. In addition, traffic load-induced settlement is less related to operating speed but more to vehicle load [25]. Consequently, only the effect of vehicle load on the settlement of the soil layer below the highway subgrade under traffic volume was considered. The axle weight of 100 kN for the single-axle-two-wheel load was adopted with a 0.213 m diameter of single-wheel grounding equivalent circle, for which the equivalent single axle loads were obtained according to the vehicle type. Assuming that passenger cars and trucks are free to travel in both lanes, dividing the two lanes equally into nine points from left-most to the right, the traffic load-induced settlement under different average annual growth rates were obtained. The parameters in Equation (1) for the typical section of Rongwu Highway are shown in Table 4. The calculated deviatoric stress and undrained shear strength variations in depth for different points are given in Table 5.
After 10 years of operation, the settlement of the highway under different loads is shown in Figure 7. It is observed that settlement from passenger cars only is quite limited with less than 5 mm, which has a monotonously decreasing trend along the road cross-section since traffic loads act only on the left lane. The trucks-induced settlement is more significant than that of passenger cars due to larger axle load, with parabolic pattern along the road cross-section. At the same time, the coupled efforts act in a saddle shape along the lateral. Distinctions in settlement caused by different traffic growth rates were not significant. After 10 years of highway operation the settlements at the center of the left lane were 3.97 cm, 3.98 cm, and 4.01 cm, with traffic growth rates of 4%, 6%, and 8%, while those of the right lane were 2.53 cm, 2.54 cm, and 2.57 cm, respectively. It should be emphasized that the axle load is 20 kN when only the passenger car is acting, for the purpose of comparing the effect of axle load on the settlement. One can find that the effect of axle load on settlement is more pronounced than the traffic growth rate.
(3)
Long-term deformation of highway cross-sections
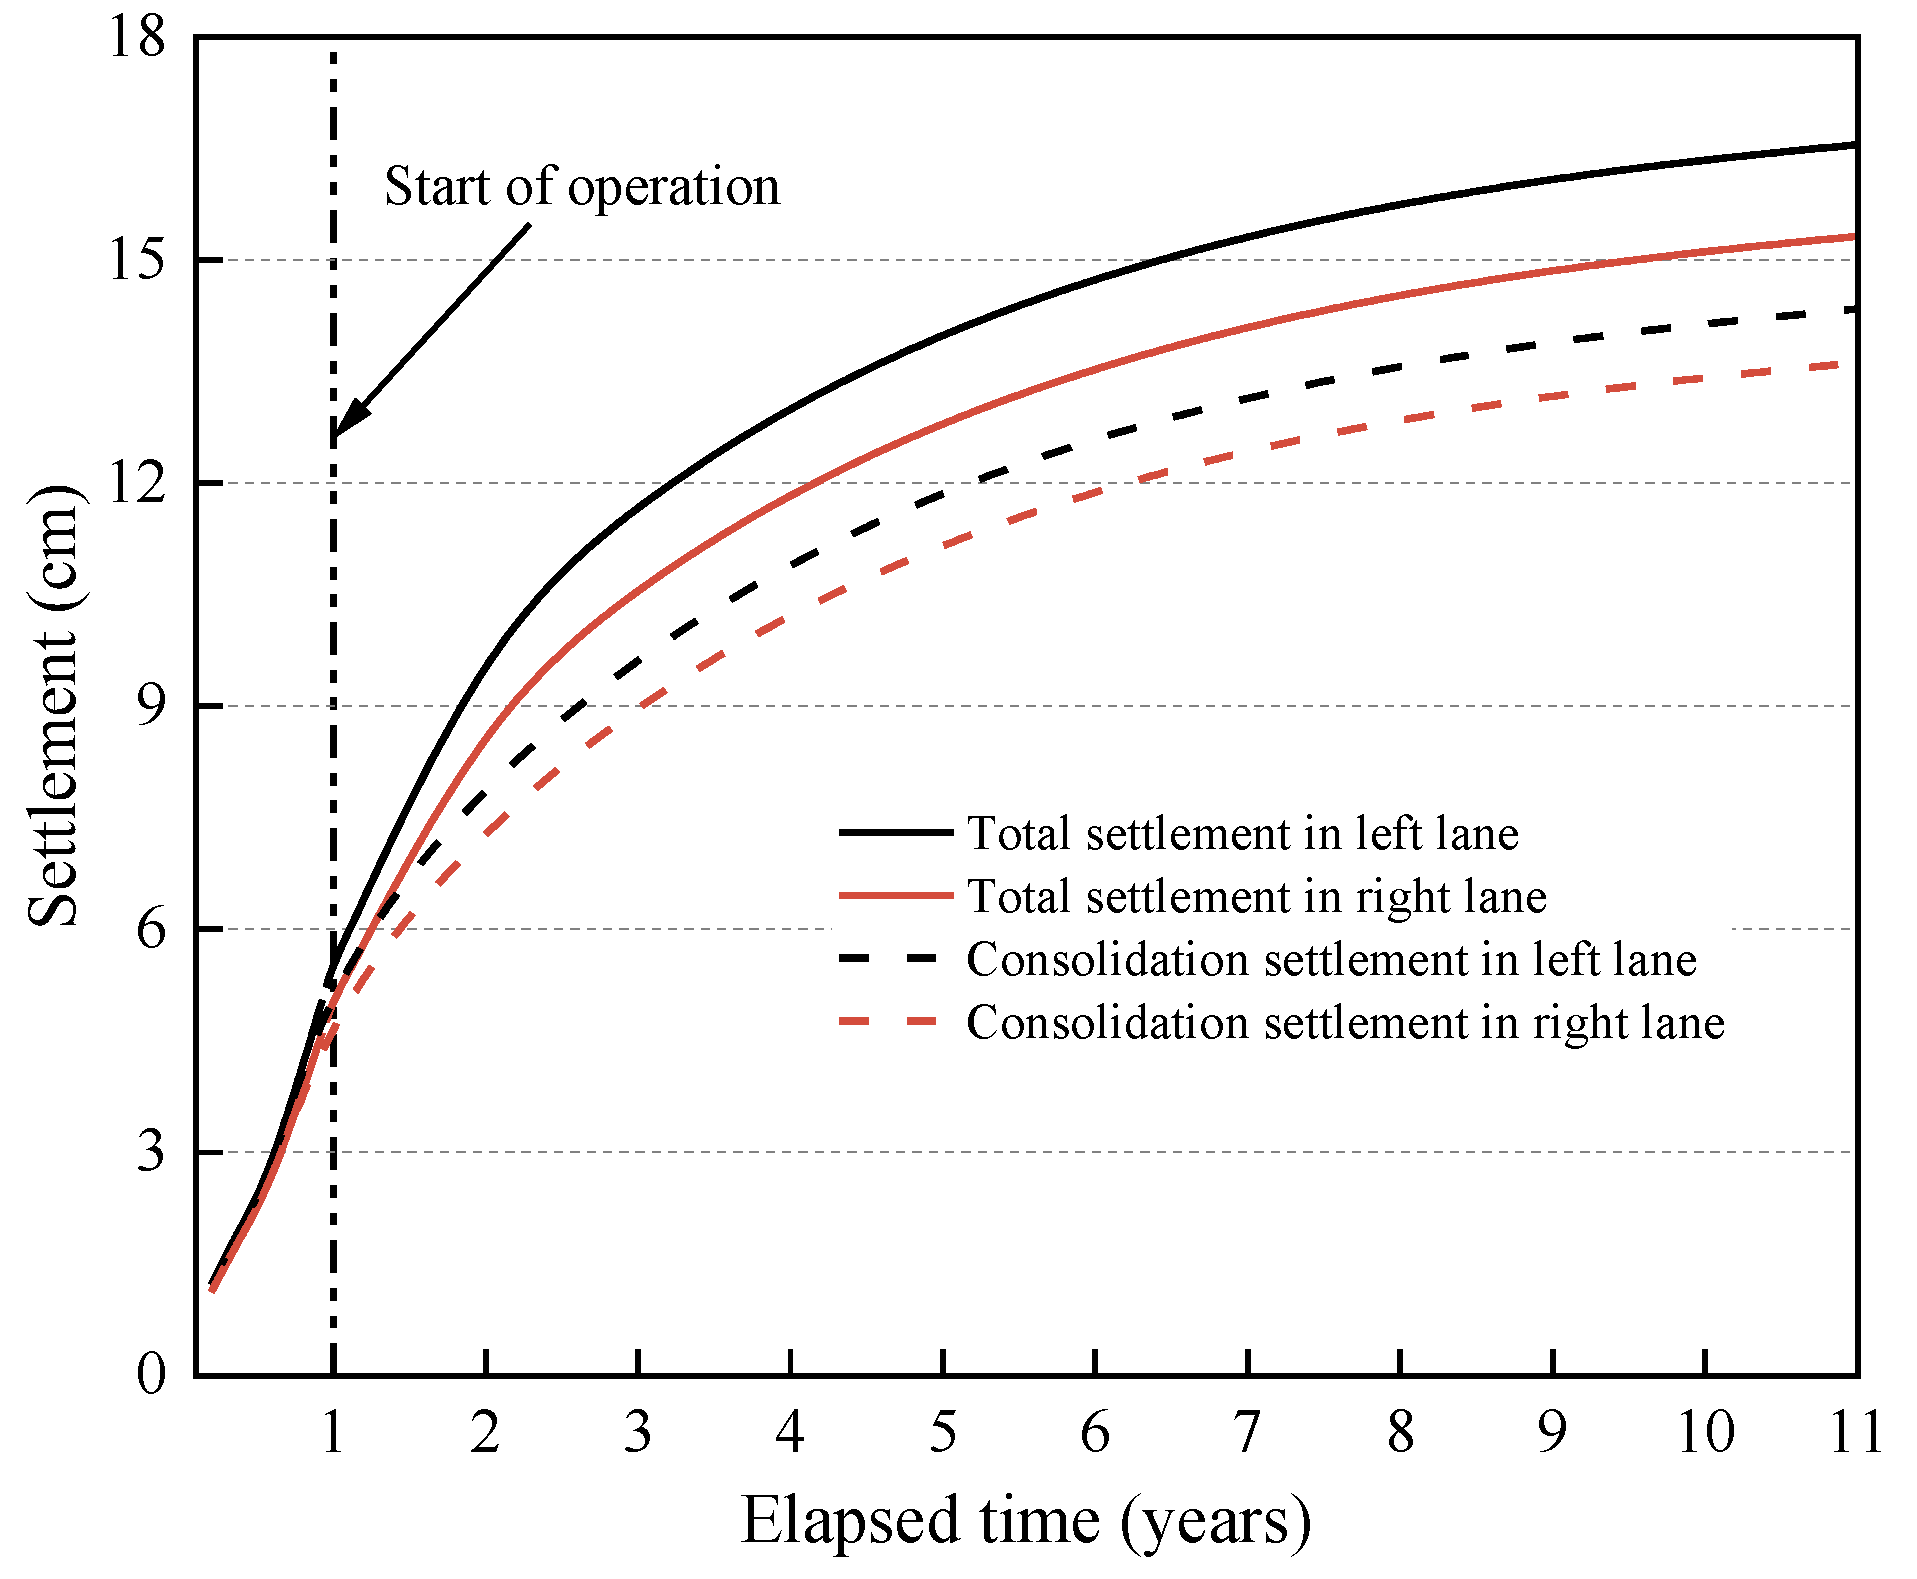
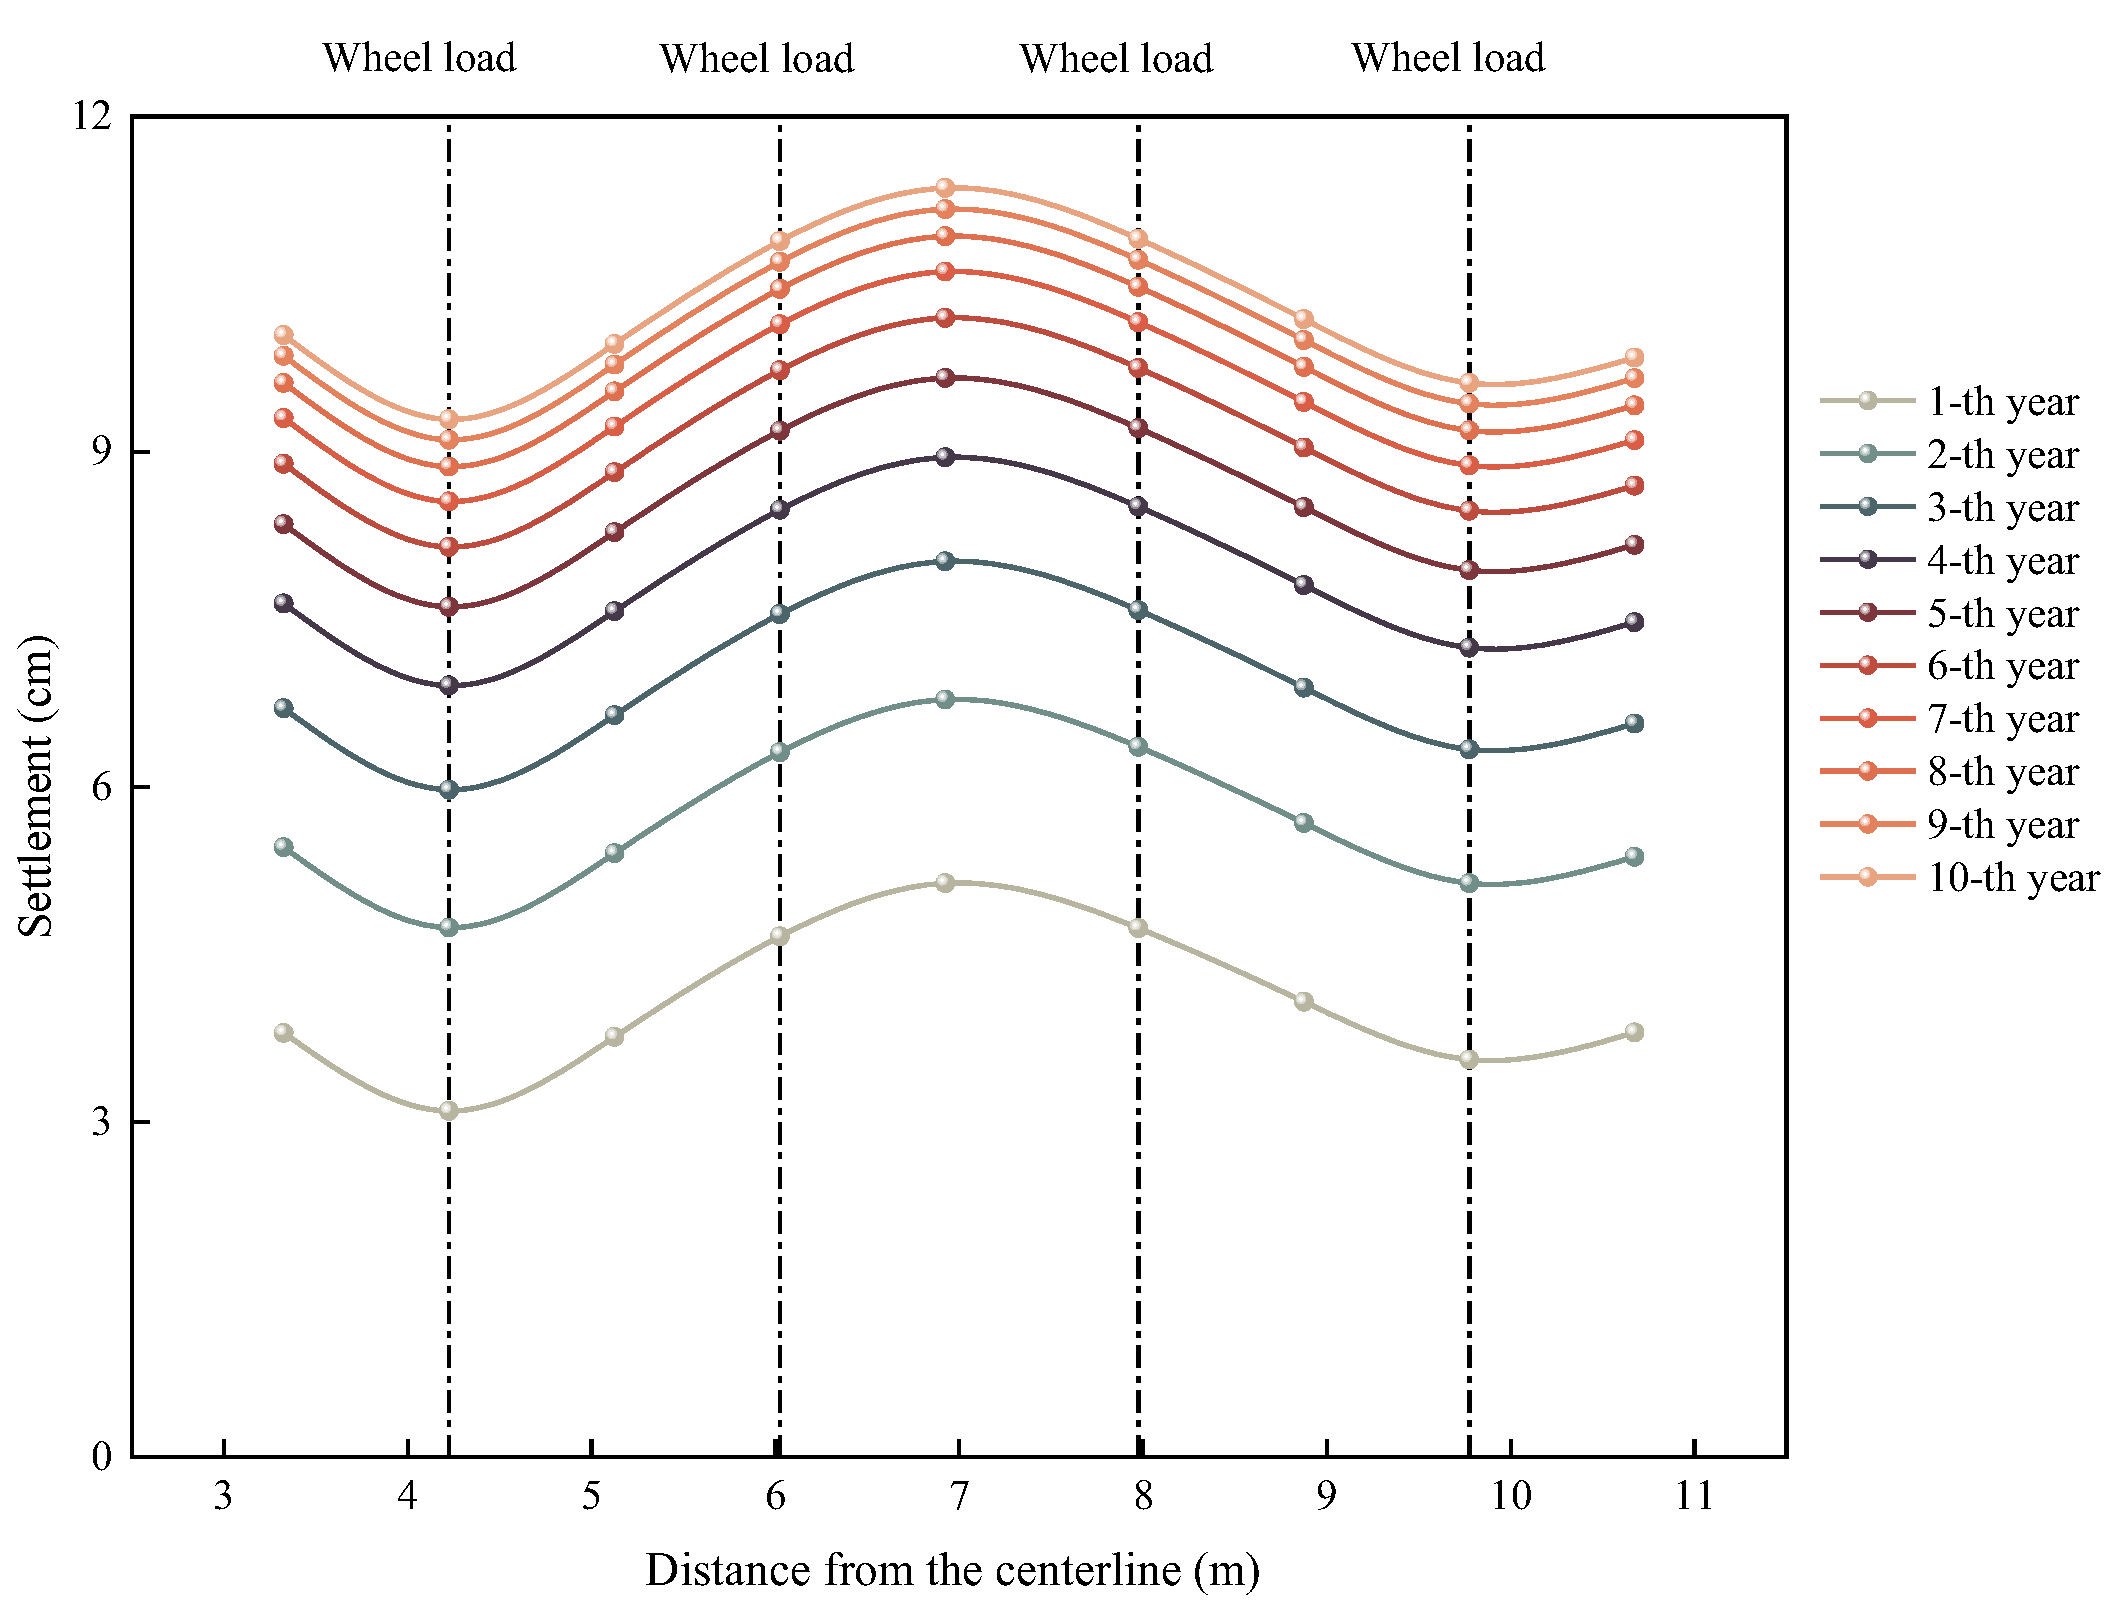
The long-term deformation of highway should be calculated considering the coupling effect of traffic load and consolidation settlement. Since there is no significant difference in the additional settlement at different traffic growth rates, the 8% traffic growth rate was chosen to assess the contribution of traffic load-induced settlement and consolidation settlement on road long-term deformation. Settlement at the midpoint of the two lanes under the coupled effect of traffic load and consolidation is shown in Figure 8. The settlement increases considerably during the initial period, followed by a gradual tendency of the settlement growth after three years of operation. After 10 years of road operation the settlement under coupled effect at two traffic lanes’ midpoints was 16.55 cm and 15.32 cm, while the settlement under consolidation effect was 14.34 cm and 13.62 cm, respectively. The contribution of settlement from consolidation can be obtained as 86.65% and 88.90%, respectively. Since the stiffnesses of pavement, subbase, and compacted embankment are much greater than soft subsoil, we can find that the long-term settlement was from the consolidation of natural soft subsoil. To illustrate that factor, the calculated crossroad surface settlement profile for Rongwu Highway is shown in Figure 9.
Figure 9 shows that settlement patterns under the coupled influence of traffic load with consolidation were different from traffic load-induced settlement. More settlement occurred in the junction of two lanes due to the simultaneous action of vehicle loads. After 10 years of operation, the settlement on the left-most part of the traffic lane was 10.04 cm with that of 9.84 cm on the right-most part, while the junction of two lanes was 11.36 cm. The general section of the highway is allowed a settlement of no more than 0.3 m after construction according to [26]. The calculated settlement indicates that could guarantee the permitted post-work settlement; however, the discrepancy in the settlement of carriageway may lead to rutting.
(4)
Variation in highway cross slope
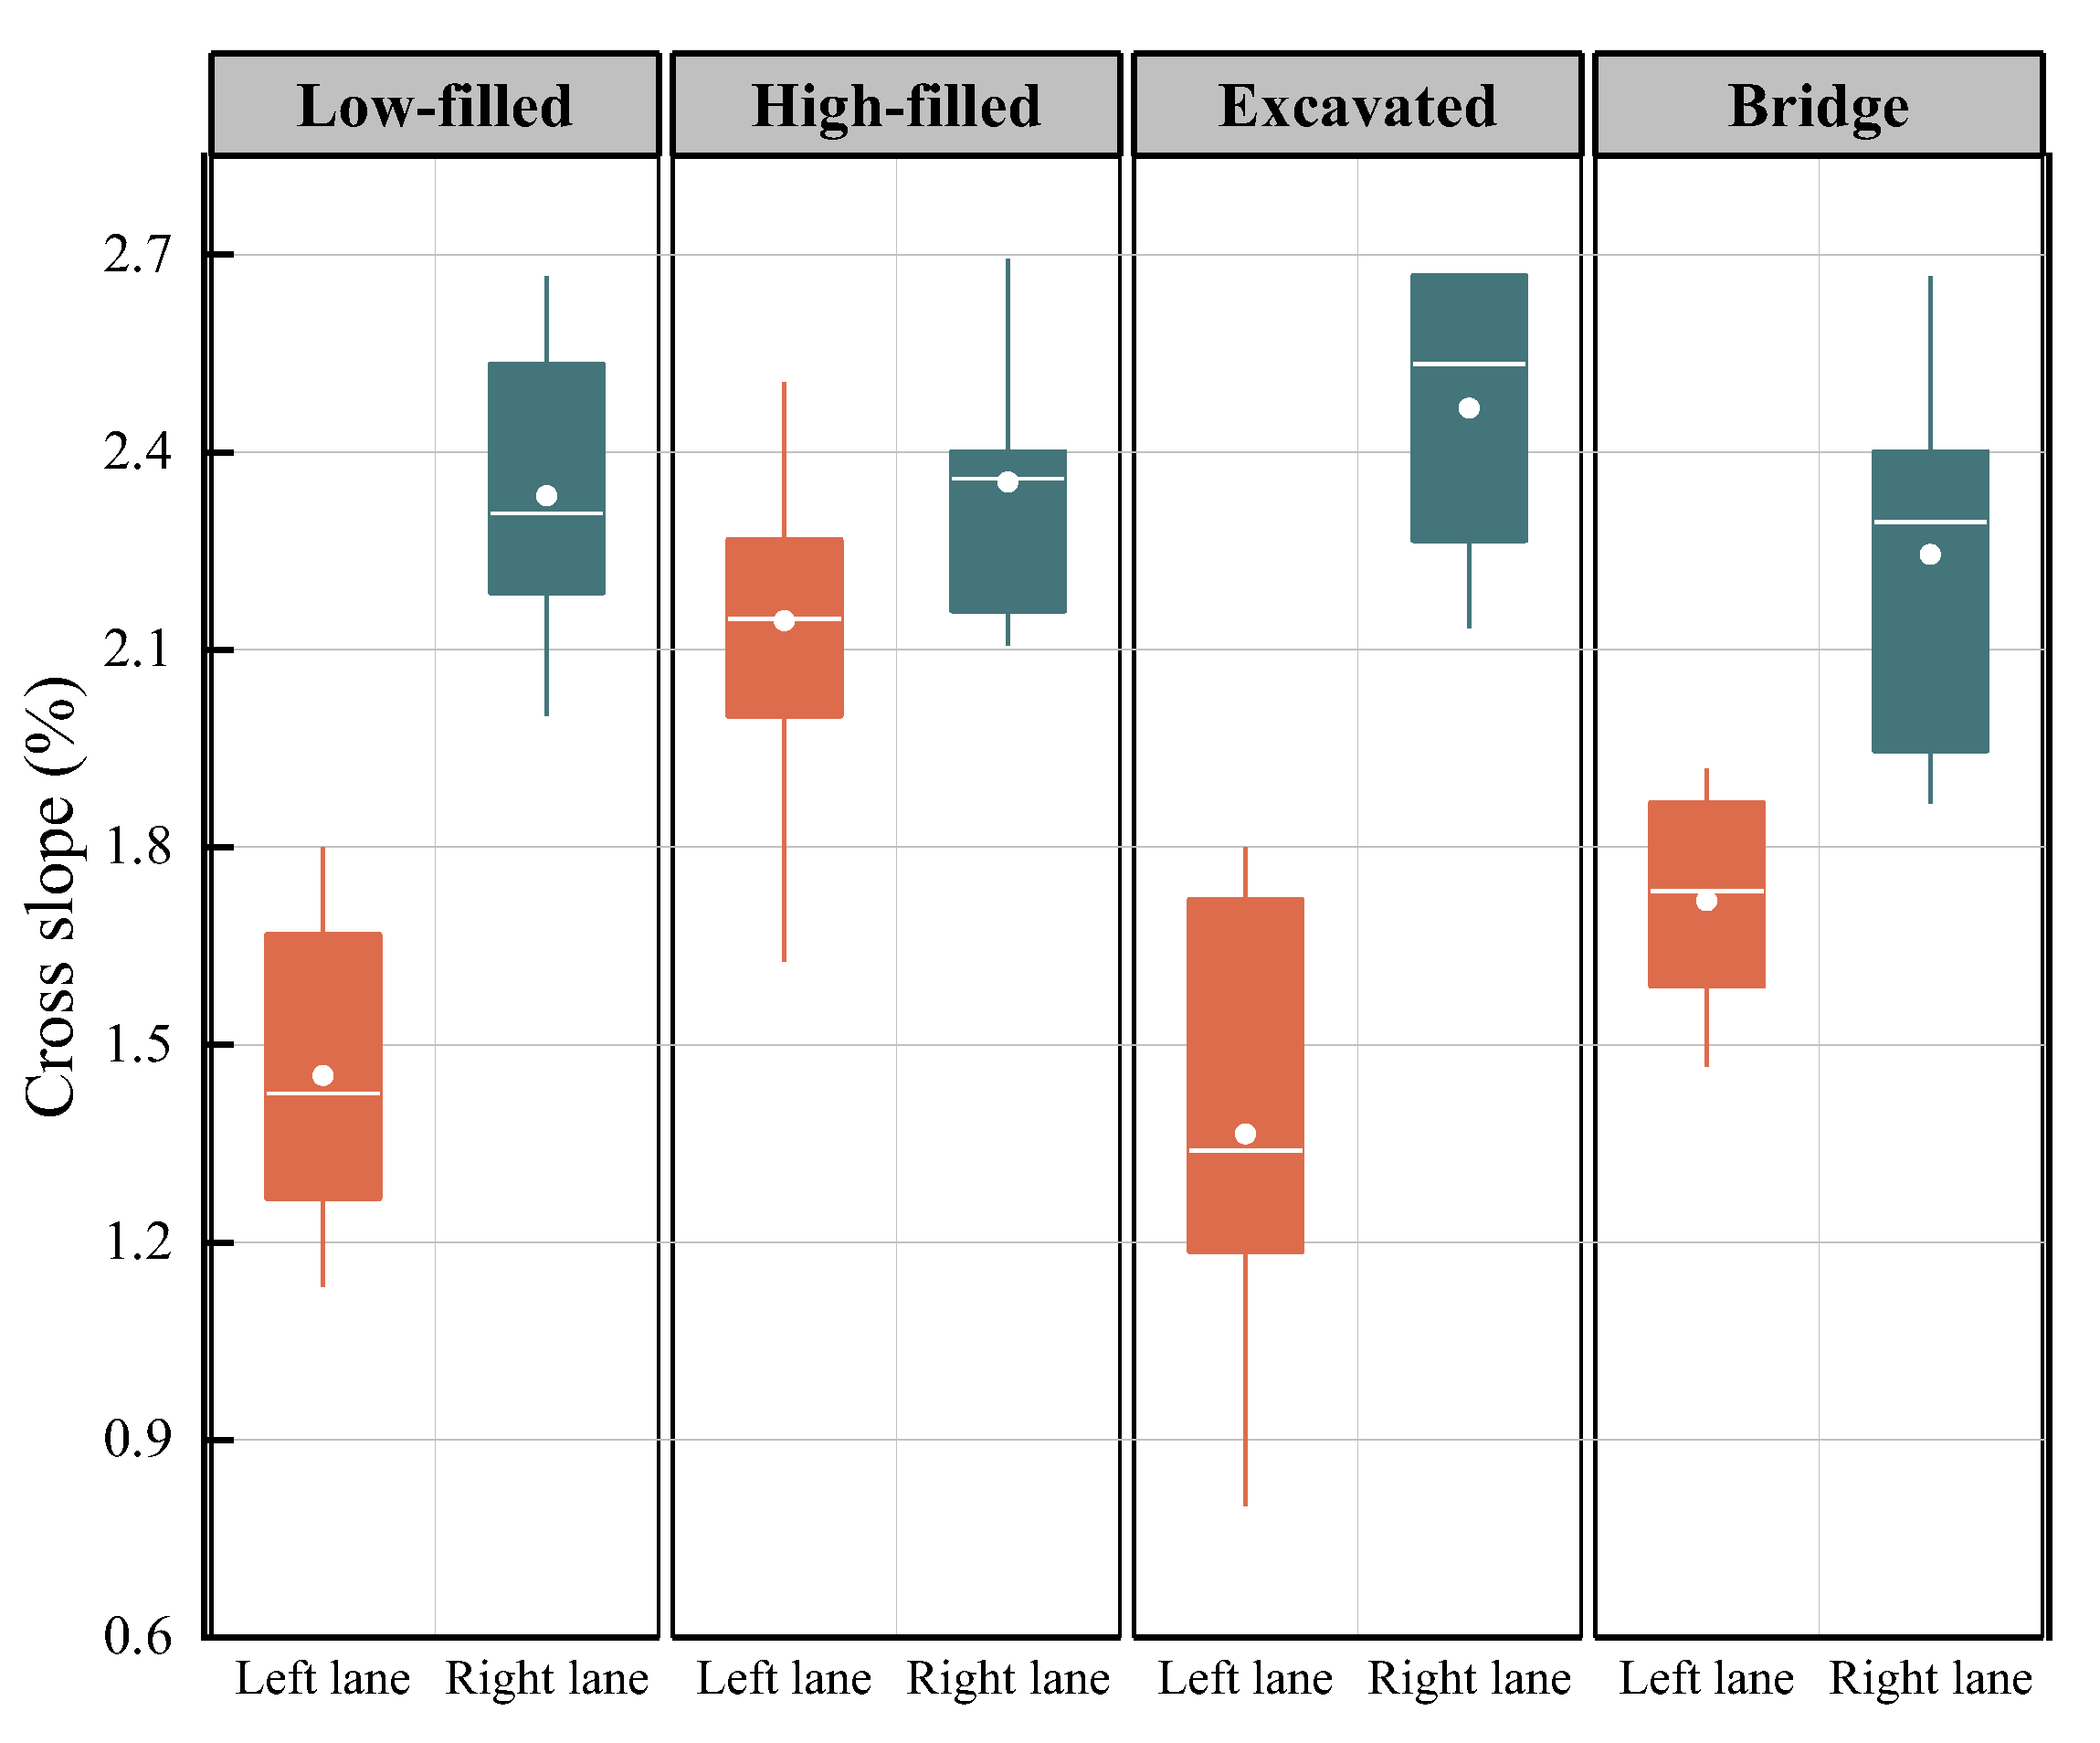
The differential settlement effect is attached to a certain cross slope of the highway, which causes variation in cross slope during usage, consequently affecting the driving stability of vehicles. The results of cross-slope variations, according to the calculated settlement during the service life of the highway, are shown in Table 6. To verify the accuracy of predicted results, the cross-slope values for different sections of the Rongwu Highway after ten years of usage were measured, as shown in Figure 10. The cross-slope values of the right lane are greater than the left lane, which is similar to the calculated results. After ten years of operation, mean values of left lane cross slope were 2.33%, 2.47%, and 2.25%, respectively, for low-filled, excavated, and bridge sections, while that of the right lane cross slope were 1.65%, 1.59%, and 1.66%, respectively. Because of the existence of climbing lanes in the high-fill section, the cross-slope difference between the left and right lanes was insignificant and the average cross slope of the climbing lanes was 3.56%. Bridge sections have the least variation in cross slope among all road sections because the concrete material properties of bridges, such as bending and tensile strength, are superior to those of regular roadbeds, resulting in less variation in road cross slope. Calculated results were compared with the measured figures, and the relative errors are 2.86% and 2.5% for the left and right lane cross slopes, respectively. A certain error exists, mainly that the load distribution during actual vehicle operation is not quite the same as the assumptions.
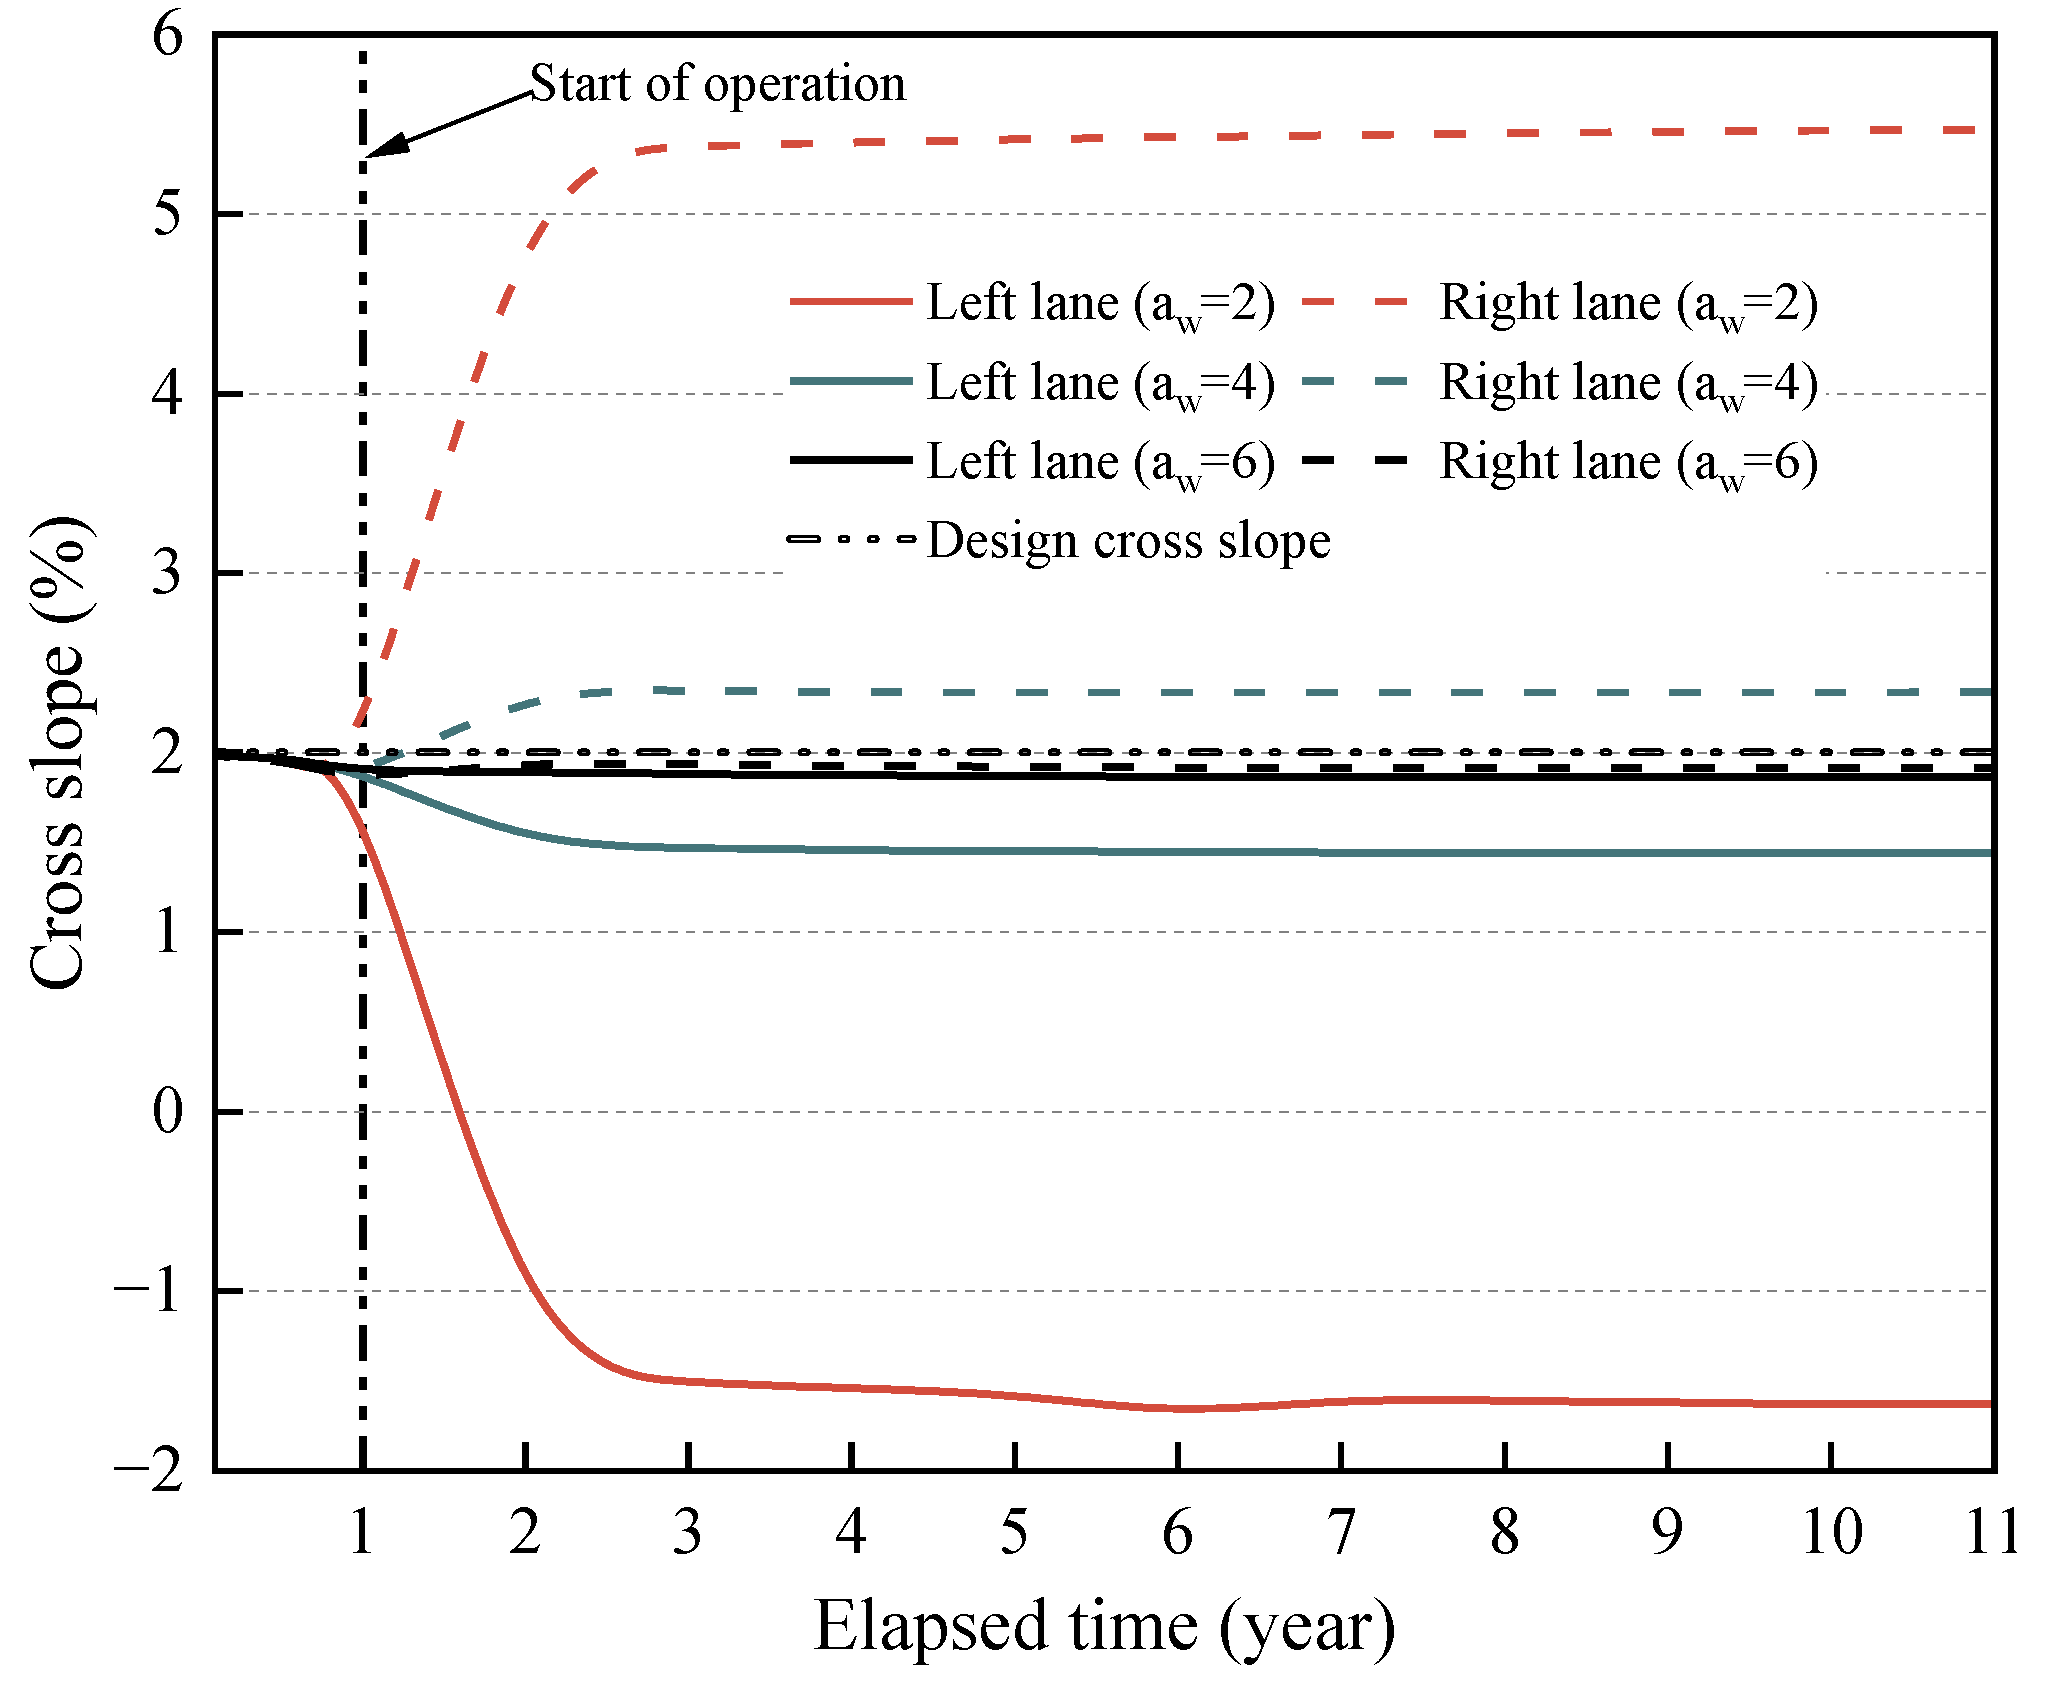
The impacts of compacted embankment strength on cross-slope variation should equally be considered. Stress sensitivity is able to reflect the strength of the embankment with different cement mixtures in a positive correlation [27]. The cross-slope values under different cement mixtures of embankment are shown in Figure 11. Since the traffic load-induced settlement reduces due to higher strength of compacted embankment with greater cement admixture, you can find that the cross-slope variation in highway was mainly from the traffic load.

4. Conclusions

A combined empirical equation and numerical method traffic load with the consolidation-induced settlement of highways in soft soil was developed to investigate the cross-slope variation. This method could consider the soil seepage, traffic load stress, confining pressure, soil structure, strength weakening and number of repeated traffic load applications to the settlement, and the cross-slope variation in highway in soft soil. Prediction of the settlement and cross slope of the Rongwu Highway was simulated to evaluate the proposed model. Comparisons between measured data and simulations demonstrate the good predictive ability of the proposed method.
The settlement of the highway with a filled embankment in soft soil is influenced mainly by consolidation rather than traffic load because of the limited impact of traffic loads on compacted embankment settlement with high strength. The distribution of cross-sectional road settlement induced by traffic load is related to the location of wheel load, while that caused by consolidation decreases from centerline to shoulder. The contribution of traffic load to settlement decreases with the increase in the embankment strength, with the similar pattern of road cross-slope variation. As road use increases, the cross slope for the passenger vehicle lane decreases while that of the heavy vehicle lane increases.
The method was applied to analyze the settlement and cross-slope variation in highways under different traffic growth rates, compacted embankment strength, and the elapsed time after the initiation of construction. The method can be used to predict cross-slope variation and calibrate the design of the road alignment indicator on soft subsoil. In future work, after validation of application on other road sections, the developed method in this paper can be applied to assess the effect of cross-slope variation on travel safety during service life.

Author Contributions

Conceptualization, J.X. and M.J.; methodology, J.X. and M.J.; formal analysis, M.J. and C.G.; resources, M.M. and G.E.; data curation, M.J., C.G., M.M. and G.E.; writing—original draft preparation, J.X. and M.J.; writing—review and editing, M.J.; supervision, J.X.; project administration, J.X., M.M. and G.E.; funding acquisition, J.X. All authors have read and agreed to the published version of the manuscript.

Funding

This research was funded by the Key Technology Projects in Transportation Industry of Ministry of Transport, grant number 2018-ZD1-001.

Data Availability Statement

Restrictions apply to the availability of these data. Data were obtained from Shandong Hi-Speed Group and are available from Miao Jia ([email protected]) with the permission of Chenwei Gu ([email protected]).

Conflicts of Interest

The authors declare no conflict of interest.

References

  1. Gargoum, S.A.; El-Basyouny, K.; Froese, K.; Gadowski, A. A Fully Automated Approach to Extract and Assess Road Cross Sections from Mobile LiDAR Data. IEEE Trans. Intell. Transp. Syst. 2018, 19, 3507–3516. [Google Scholar] [CrossRef]
  2. Biot, M.A. General Theory of Three-Dimensional Consolidation. J. Appl. Phys. 1941, 12, 155–164. [Google Scholar] [CrossRef]
  3. Santos, J.E. General Theory of Three-Dimensional Consolidation. Esaim Math. Model. Numer. Anal. 1986, 20, 49–50. [Google Scholar]
  4. Sandhu, R.S. Finite-Element Analysis of Seepage in Elastic Media. Proc. ASCE 1969, 95, 641–652. [Google Scholar] [CrossRef]
  5. Loganathan, N.; Balasubramaniam, A.S.; Bergado, D.T. Deformation Analysis of Embankments. J. Geotech. Eng. 1993, 119, 1185–1206. [Google Scholar] [CrossRef]
  6. Zhu, Z.D.; Zhou, L.H. Application of Logistic model in settlement prediction during complete process of embankment construction. Chin. J. Geotech. Eng. 2009, 31, 965–969. [Google Scholar]
  7. Liu, W.; Li, X.; Hu, W. Highway subsidence prediction based on neural network and hyperbolic hybrid model. Dongnan Daxue Xuebao Ziran Kexue Ban/J. Southeast Univ. Nat. Sci. Ed. 2013, 43, 380–383. [Google Scholar]
  8. Huang, J.J. Numerical Simulation Study on Soft Roadbed Settlement of Highway. J. Shandong Univ. Sci. Technol. (Nat. Sci.) 2006, 1, 117–119. [Google Scholar]
  9. Zhang, Q.; Zhang, J.; Liu, G.; Li, Y. Highway Subsidence Analysis Based on the Advanced InSAR Time Series Analysis Method. In Proceedings of the Dragon 3 Final Results and Dragon 4 Kick-Off, Wuhan, China, 4–8 July 2018; pp. 20–26. [Google Scholar]
  10. Monismith, C.L.; Ogawa, N.; Freeme, C.R. Permanent Deformation Characteristics of Subgrade Soils Due to Repeated Loading. Transp. Res. Rec. J. Transp. Res. Board 1975, 537, 1–17. [Google Scholar]
  11. Li, D.; Selig, E.T. Cumulative Plastic Deformation for Fine-Grained Subgrade Soils. J. Geotech. Eng. 1996, 122, 1006–1013. [Google Scholar] [CrossRef]
  12. Chai, J.C.; Miura, N. Cement/Lime Mixing Ground Improvement for Road Construction on Soft Ground-ScienceDirect. Ground Improv. Case Hist. 2015, 3–29. [Google Scholar] [CrossRef]
  13. Sakai, A.; Samang, L.; Miura, N. Partially-drained cyclic behavior and its application to the settlement of a low embankment road on silty-clay. J. Jpn. Geotech. Soc. 2008, 43, 33–46. [Google Scholar] [CrossRef] [Green Version]
  14. Wei, X.; Huang, M.S. A simple method to predict traffic-load-induced permanent settlement of road on soft subsoil. Rock Soil Mech. 2009, 30, 3342–3346. [Google Scholar]
  15. Zhuang, Y.; Li, S. Three-dimensional finite element analysis of arching in a piled embankment under traffic loading. Arab. J. Geosci. 2015, 8, 7751–7762. [Google Scholar] [CrossRef]
  16. Lü, X.L.; Fang, H.; Zhang, J.F. A theoretical solution for long-term settlement of soft subgrade induced by traffic loading. Rock Soil Mech. 2016, 37, 435–440. [Google Scholar]
  17. Xu, L.; Chen, Y.; Shang, Y.; Feng, D.; Ding, K. Long-term settlement calculation of soft soil foundation under traffic load based on mechanical-empirical model. J. Chang. Univ. Nat. Sci. Ed. 2021, 41, 1–10. [Google Scholar]
  18. Sun, L.; Cai, Y.-q.; Gu, C.; Wang, J.; Guo, L. Cyclic deformation behaviour of natural K (0)-consolidated soft clay under different stress paths. J. Cent. South Univ. 2015, 22, 4828–4836. [Google Scholar] [CrossRef]
  19. Chandler, R.J. The Third Glossop Lecture: Clay Sediments in Depositional Basins: The Geotechnical Cycle. Q. J. Eng. Geol. 2000, 33, 7–39. [Google Scholar] [CrossRef]
  20. Huang, M.S.; Yao, Y.M. Explicit model for cumulative strain of saturated clay subjected to cyclic loading. Chin. J. Geotech. Eng. 2011, 33, 325–331. [Google Scholar]
  21. Qu, S.; Liu, W.Z.; Nie, Z.H. Change law and prediction model for accumulative deformation of artificial structured soft soil under long-term cyclic loading. J. Eng. Geol. 2017, 25, 975–984. [Google Scholar]
  22. AASHTO. Mechanistic-Empirical Pavement Design Guide; Interim Edition: A Manual of Practice; AASHTO: Washington, DC, USA, 2015. [Google Scholar]
  23. Shan, Y.; Lu, Y.; Zhou, S.H.; Wang, B.L. Centrifugal model test study on lateral differential settlement between the trampile-plank subgrade and the road subgrade. Chin. J. Rock Mech. Eng. 2020, 39, 1049–1060. [Google Scholar]
  24. Cai, Y.; Chen, Y.; Cao, Z.; Ren, C. A combined method to predict the long-term settlements of roads on soft soil under cyclic traffic loadings. Acta Geotech. 2018, 13, 1215–1226. [Google Scholar] [CrossRef]
  25. Chen, S.; Wang, D.; Zhang, R.; Feng, D. The theoretical solution and mechanical analysis for elastic half-space under asymmetrical loading. China Sci. 2017, 12, 806–811. [Google Scholar]
  26. JTG D50-2017; Specifications for Design of Highway Asphalt Pavement. China Standard Press: Beijing, China, 2017.
  27. Liu, W.Z.; Shi, Z.G.; Zhang, D.W.; Qu, S. Long-term settlement calculation of structured soft clay foundation under traffic loading. J. Southeast Univ. Nat. Sci. Ed. 2018, 48, 726–735. [Google Scholar]
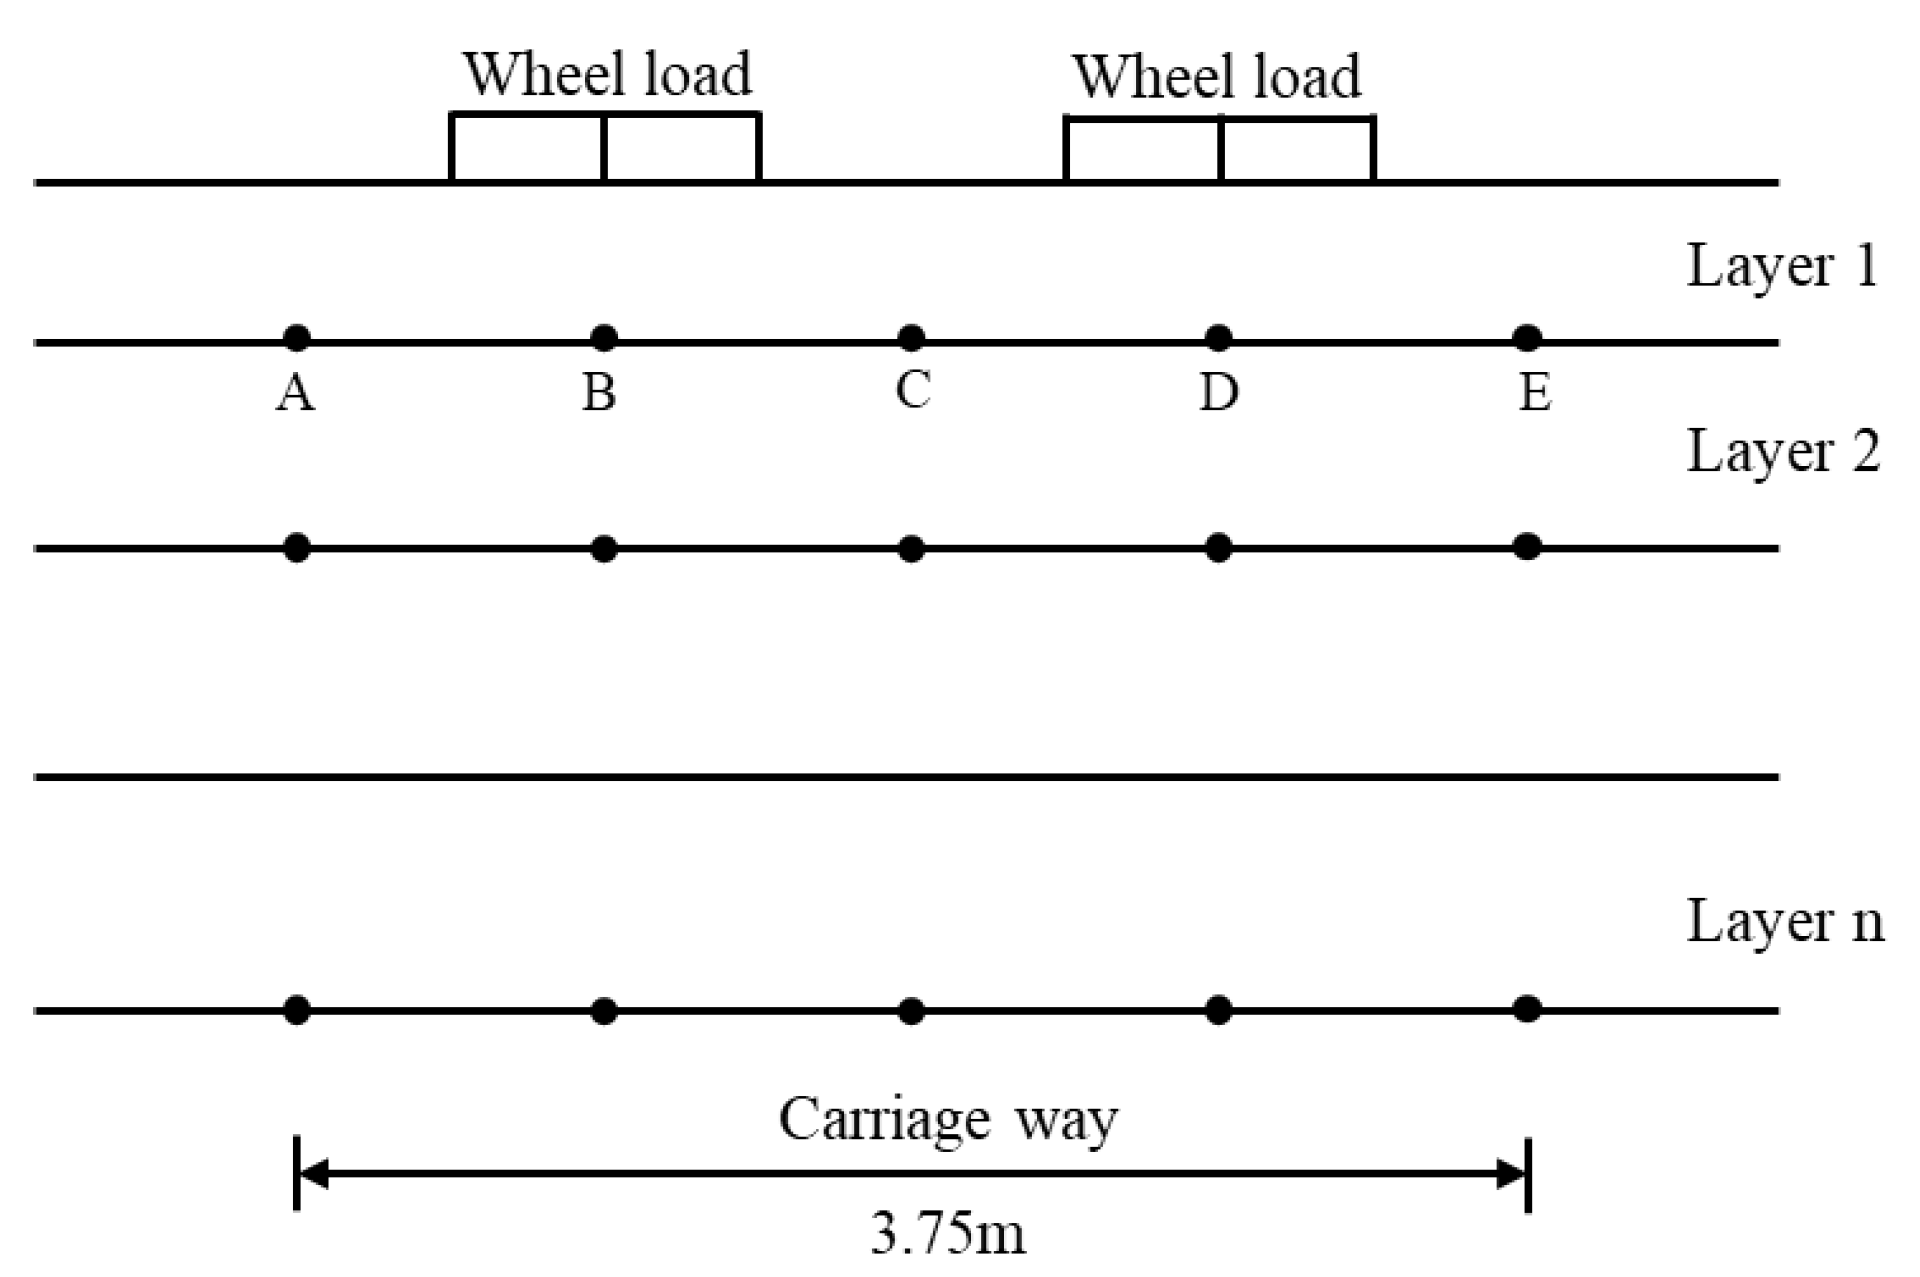
Figure 1. Calculation points distribution of mechanical response.
Sustainability 15 00033 g001
Figure 2. Frame chart of highway long-term cross-slope variation built on soft soil.
Sustainability 15 00033 g002
Figure 3. Typical cross-section of the Rongwu Highway.
Sustainability 15 00033 g003
Figure 4. Traffic volume under different traffic growth rates.
Sustainability 15 00033 g004
Figure 5. Typical finite element mesh discretization.
Sustainability 15 00033 g005
Figure 6. Cross-sectional and elapsed time of highway with consolidation settlement distribution: (a) Consolidation settlement with elapsed time and distance from the centerline of road surface; (b) Cross-sectional with elapsed time consolidation settlement profile; (c) Cross-sectional consolidation settlement profile; (d) Cross-sectional differential consolidation settlement curve.
Sustainability 15 00033 g006
Figure 7. Traffic load-induced settlement curves under different traffic growth rates.
Sustainability 15 00033 g007
Figure 8. Calculated settlement at the lanes’ midpoints.
Sustainability 15 00033 g008
Figure 9. Crossroad surface permanent settlement profiles of Rongwu Highway.
Sustainability 15 00033 g009
Figure 10. Measured cross slope of four sections (Rongwu Highway).
Sustainability 15 00033 g010
Figure 11. Cross slope of traffic lanes under different cement content of embankment.
Sustainability 15 00033 g011
Table 1. Soil parameters of Rongwu Highway.
Soil LayerThickness (m)Unit Weight (kN/m3)Young’s Modulus
(MPa)
Poisson’s
Ratio
Cohesion (kPa)Angle of
Friction   φ (°)
Permeability Coefficient (m/d)
Surface0.3524.212000.3---
Subgrade0.3523.610000.3---
Embankment418.3200.429.336.5-
Sand bedding 0.520500.3---
Mucky clay11.517.62.50.358240.00012
Silty clay817.86.00.3122.431.60.00006
Table 2. Drucker–Prager parameters for FEM analysis.
Soil Layer β (°) k ψ (°)
Embankment28.71.0028.7
Mucky clay35.31.0035.3
Table 3. Clay plasticity parameters for FEM analysis.
Soil Layer κ λ M β K e 1  
Silty clay0.020.071.271.001.001.02
Table 4. Parameters related to long-term settlement prediction.
Soil Layer S σ χ a c m n b k
Embankment4.50.6021.60.7672.50.50.24743
Mucky clay3.10.6021.60.76730.50.323,100,000
Silty clay5.40.6021.60.76720.50.7382,000,000
Table 5. Calculated deviatoric stresses and shear strength for different points.
Soil LayerDepth (m) q s (kPa) q ult (kPa) q d   ( kPa )
ABCDEFGHI
Embankment114.318.67.538.067.636.856.206.53 7.01 7.26 6.88
220.426.56.596.816.365.675.265.57 6.08 6.43 6.23
326.533.66.126.145.314.273.754.22 5.24 6.05 6.23
432.639.45.375.324.553.152.332.98 4.22 5.12 5.29
Mucky clay661.945.41.351.531.681.771.821.78 1.68 1.51 1.30
878.155.90.030.030.040.050.060.05 0.04 0.03 0.03
1094.466.60.00.00.00.00.00.00.00.00.0
12110.677.60.00.00.00.00.00.00.00.00.0
14126.988.80.00.00.00.00.00.00.00.00.0
16143.1101.90.00.00.00.00.00.00.00.00.0
Silty clay18197.532.80.00.00.00.00.00.00.00.00.0
20217.931.60.00.00.00.00.00.00.00.00.0
22238.230.30.00.00.00.00.00.00.00.00.0
24258.629.20.00.00.00.00.00.00.00.00.0
Table 6. Calculated cross slope of Rongwu Highway in operation.
Operation Years012345678910
Left lane1.901.491.471.461.451.451.441.441.441.441.44
Right lane1.842.352.342.342.342.332.332.332.332.342.34
Disclaimer/Publisher’s Note: The statements, opinions and data contained in all publications are solely those of the individual author(s) and contributor(s) and not of MDPI and/or the editor(s). MDPI and/or the editor(s) disclaim responsibility for any injury to people or property resulting from any ideas, methods, instructions or products referred to in the content.