Article

Mapping Soil Organic Matter Content during the Bare Soil Period by Using Satellite Data and an Improved Deep Learning Network

1
Key Laboratory of Environmental Change and Natural Disaster of Ministry of Education, Beijing Normal University, Beijing 100875, China
2
College of Tourism, Resources and Environment, Zaozhuang University, Zaozhuang 277160, China
*
Authors to whom correspondence should be addressed.
Sustainability 2023, 15(1), 323; https://doi.org/10.3390/su15010323
Submission received: 30 November 2022 / Revised: 20 December 2022 / Accepted: 21 December 2022 / Published: 25 December 2022

Abstract

:
Soil function degradation has impaired global work in the implementation of sustainable development goals (SDGs), and soil organic matter (SOM) is a basic and the most important indicator. The deep learning neural network (i.e., DL network) has become a popular tool for mapping SOM content at a regional scale. However, outlier sample data caused by environmental factors (e.g., moisture and vegetation) and uncertain noise (e.g., random noise and instability effects) have interfered with the determination of the function mapping relationship between target soil properties and spectral features, leading to DL networks with low generalization capability. Therefore, we introduced a spatial association module into a deep neural network to remove outlier sample data in order to construct an optimal sample set for calibrating an improved deep learning (IDL) network for SOM mapping. A total of 707 soil samples and a Sentinel-2B multispectral image were acquired during the bare soil period in Weibei, China. The variable importance in the projection approach was used to select the SOM-responsive spectral features for model inputs. Measured SOM contents were taken as the dependent variable, and the IDL network was constructed and applied to map SOM at the regional scale. The results showed that Band 11 was the most important band for SOM prediction. The band difference transformation method was able to integrate multiple-band information and enhance the absorption signal of SOM. The optimal SOM-responsive spectral features included B11, B1–B11, B2−B11, B3−B11, B4−B11, and B1−B12. The IDL network exhibited better performance (R2 = 0.92; RPIQ = 4.57) regarding SOM estimation compared with the DL model performance (R2 = 0.84; RPIQ = 2.84), being improved by 9.52% (for R2) and 60.92% (for RPIQ). After introducing the spatial association module, the DL network generalization capability was enhanced. SOM distribution showed a high-value (>20 g kg−1) area in the south, and a low-value (<6 g kg−1) area in the north of the study area (the area affected by seawater intrusion). These results provide a strategy based on an IDL network and satellite data for effectively and accurately mapping SOM at the regional scale.

1. Introduction

The Soil organic matter is a basic soil parameter and greatly influences soil fertility status and the global carbon cycle [1,2]. Traditional SOM monitoring has generally been achieved by high-density sampling and laboratory chemical analysis. Although high-precision mapping results can be obtained, traditional SOM monitoring consumes many financial and labor resources [3]. Optical remote sensing (RS) is an efficient earth observation technology that has attracted the attention and efforts of many scholars in recent decades. Optical remote sensing can map SOM content efficiently and nondestructively at the regional scale.
The quantitative remote sensing technique has become a powerful tool for quickly and cost-effectively determining SOM contents at the regional scale [4]. In 1980, Krishnan et al. [5] first used a spectrometric approach to assess the relationship between SOM and proximally sensed Vis-NIR spectra. They established a multivariate regression model for estimating SOM content. Similarly, Liu et al. [6] used the spectral bands in the spectral range from 550 to 810 nm as input variables to model SOM contents, and they achieved satisfactory accuracy. Additionally, Castaldi et al. [1], Mohamed et al. [7], Wang et al. [8], and Luo et al. [9] determined the correlation values between satellite spectral bands (e.g., Landsat-5, Landsat-8, Sentinel-2, EO-1, etc.) and SOM contents, and analyzed the spectral absorption characteristics of SOM in the Vis-NIR spectra in order to establish a quantitative remote sensing model that was used to map the distribution pattern of SOM. Hyperspectral satellite images are normally regarded as ideal data for SOM mapping because of their refined spectral resolution. However, lack of available data and high acquisition costs limit the application of hyperspectral data in SOM mapping at the regional scale [1]. Multispectral satellite data have greater availability and accessibility and are currently recognized as important satellite data sources for the regional mapping of SOM contents [10].
The primary multivariate regression model applied to RS-based SOM mapping consisted of partial least squares regression [1], multivariable linear regression [11], support vector machine [4], random forest [9], and other regression algorithms [8]. Deep learning (DL) (e.g., deep learning neural network) is a state-of-the-art technique for RS-based SOM mapping at a regional scale. Usually, the soil is a complex composite compound that is developed by the interaction of the parent materials, environmental factors, and human activities [12]. The relationships between soil properties and spectral signals are complicated and nonlinear. Thus, multivariable models based on a deep learning neural network (i.e., DL network) have a particular advantage in mapping soil physicochemical information at the regional scale [13,14]. For example, Odebiri et al. [14], Odebiri et al. [15], Shen et al. [16], and Pham et al. [17] constructed a deep learning neural network-based quantitative remote sensing model that yielded satisfactory results for SOM mapping. In addition, as an artificial intelligence method, the DL network shows excellent performance in the signal transformation from SOM contents to spectral reflectance values by increasing the number of hidden layers, structural parameters, and neural nodes [14]. However, field spectral samples (i.e., image pixels) were affected by environmental factors (e.g., moisture and crop residues) and uncertain noise (e.g., random noise and instability effects) due to the limited spatial resolution of multispectral images (e.g., Sentinel-2 images have up to 10-m spatial resolution), leading to soil information that has been weakened in the heterogeneous spectral samples. This problem has interfered with the determination of the function mapping relationship between target soil properties and spectral features, resulting in a DL network with lower generalization ability and poor performance accuracy for SOM mapping.
Two methods have been developed to reduce the negative influences of the heterogeneous samples on the DL network. The first method is to increase the number of field spectral samples. Thousands of field spectral samples taken as the label can be helpful for determining function mapping and for model fitting; the effects of heterogeneous samples on the DL network are minimum, but the computation and labor work would be increased. The second method was demonstrated by Shi et al. [18] and Bao et al. [19], who used multiple sample selection methods (e.g., random extraction, content status, spectral features, soil types, and Euclidean distance of soil spectra) to remove heterogeneous samples and to optimize calibrated sample sets for generating a satisfactory remote sensing model. Based on the above research, soil physicochemical data are regarded as the key parameters for optimizing calibration sample sets. However, a geographic object is not only characterized by physicochemical information, but is also characterized by location information in the geographic space. Furthermore, the first law of geography suggests that the closer the distance between two geographic objects, the stronger the correlation, while the heterogeneous samples show weak spatial association and regional specificity [20]. Still, how geographic location information can be used to optimize the calibration sample set remains unclear.
In this study, we introduced a spatial association module into a deep learning network to explore the spatial association of the samples and to optimize the calibration sample set for building an improved deep learning (IDL) network for SOM mapping. A spatial association module was developed by the spatial weight matrix that can be detected by the spatial association of samples. The calculated spatial weights can be used to quantitatively identify heterogeneous samples [21]. Additionally, the DL network depended on a series of independent covariates, and 99.9% of the convolutional and pooling layers with an activation function in prediction can cover any cases without considering the spatial association among the sample data [22]. The heterogeneous sample is a critical point for influencing the performance of the RS-based DL network. Thus, we try to introduce the spatial association information of each sample into the calibration set to improve the RS-based DL network. Generally, the IDL network integrated with multispectral satellite data shows great potential in SOM mapping at the regional scale.
This objectives of this study were to (1) determine SOM spectral features from multispectral satellite data, (2) construct an IDL network for SOM estimation, and (3) obtain SOM maps at the regional scale.

2. Materials and Methods

2.1. Study Area

The Weibei area (118°37′ E–118°48′ E and 37°0′ N–37°15′ N) is located in the southern plain of Laihou Bay, China, and covers an area of 195 km2 (Figure 1). The Weibei area is characterized by a temperate continental climate, with an average annual temperature of 12.7 °C and an average annual precipitation of 594 mm. The geomorphic type of the study area is predominantly low plain. Elevation ranges from 1 m to 68 m. Wheat (Triticum aestivum L.) and corn (Zea mays L.) plantations account for most of the area, with only a few areas of north Weibei growing cotton (Gossypium hirsutum L.). The area is affected by slight soil salinization. Gleysol is the dominant soil type found in the Weibei area according to the classification criteria of the World Reference Base (WRB) [23].

2.2. Soil Sampling and Laboratory Analysis

Locations for 707 soil samples were predetermined by using ArcGIS 10.2 software while considering the land use, soil types, and hydrogeological conditions. At each sample location, a composite sample was collected based on the five-point sampling method: five subsamples (0–20 cm) were collected within a 50-m radius to ensure the representativeness of the geographical unit. All samples were collected on 2–8 January 2019, as the surface of the study area was mainly bare soil with little vegetation cover. According to the classification standard for bare soils (the normalized difference vegetation index was less than 0.3), the bare soil areas were recognized and the vegetation cover areas were removed accordingly [24]. When the collected soil samples were transported to the laboratory, outlier materials such as sticks, stones, and grass roots were removed. Then the soil samples were preprocessed by air-drying at 25 °C and sieving with a 1-mm screen. Finally, SOM contents were measured using the potassium dichromate oxidation-external heating method [25].

2.3. Satellite Data Acquisition and Preprocessing

The Sentinel-2B satellite was launched by the European Space Agency in 2017 with the goal of providing information for environmental monitoring and disaster support worldwide. The Sentinel-2B satellite was equipped with a multispectral instrument that provided 13 spectral bands within the wavelengths of 400 to 2500 nm. The satellite data was characterized by three spatial resolutions of 10-m (Band 2, Band 3, Band 4, and Band 8), 20-m (Band 5, Band 6, Band 7, Band 8a, Band 11, and Band 12), and 60-m (Band 1, Band 9, and Band 10). A Sentinel-2B image obtained on 17 January 2019 under cloudless conditions was freely acquired from the USGS website (https://glovis.usgs.gov, accessed on 20 November 2022), and the soil samples were collected at the same time as the image capture. Image preprocessing was performed to transform the raw values of top of atmosphere reflectance to bottom of atmosphere reflectance. Image preprocessing consisted of radiation correction and atmospheric correction. These procedures were performed with SNAP software (equipped with the Sen2Cor plug-in). Note that band 10 was not involved in the model calculations because it was designed for atmospheric detection. All bands were resampled to 10-m spatial resolution to facilitate SOM mapping.

2.4. Constructing Spectral Indices to Characterize SOM

The spectral absorption features of SOM in the Vis-NIR spectral range are non-specific and are influenced by various soil components such as iron oxides, salt, and clay minerals, resulting in the SOM spectral features’ weak and wide coverage. In addition, as the sample set size is small, using deep learning to extract the SOM’s spectral features would cause over-fitting of the model; thus, feature construction and selection are essential for acquiring a reliable regression model [13]. Spectral indices such as band difference index (DI), band ratio index (RI), and band normalization index (NDI) were applied to mine the SOM spectral features, and then the integrated single bands were used as inputs for modelling SOM. The equations for the spectral indices mentioned above are:
DIij = bi − bj
RIij = bi/bj
NDIij = (bibj)/(bi + bj)
where bi and bj are the reflection of the ith and jth spectral bands, respectively. Band transformation was completed using ENVI 5.3.1 software.
The variable importance in the projection (VIP) method can create an uncorrelated synthetic variable to assess the explanatory information ability for the dependent variable and to evaluate the significance of each explanatory variable to the targets [26]. This study recognized the VIP value as an important criterion for determining SOM spectral features [27]. The calculation of VIP is given as:
V I P = K × a = 1 A R d ( Y z t ) W 2 a = 1 A R d ( Y z t ) ,
where K is the number of explanatory variables, A denotes the number of principal components generated, t represents the principal component, Rd(Y, t) is the sum of squares of the target Y explained by the principal component a, and W2 is the importance of the explanatory variables in each principal component.

2.5. Improved Deep Neural Network Establishment

The improved deep learning (IDL) neural network was based on a deep learning neural network and can assess spatial association by introducing a spatial weight function module (Equations (5)–(7)). The optimal number of hidden layers and nodes can be determined easily in the IDL network and help improve effectiveness and stability in modeling the geographically heterogeneous data.
F = ( x i , y i , β i ( μ i , ν i ) ) ,
F i ( ϕ ) = exp ( d i k 2 + X i k 2 b 2 ) ,
t = i = 1 i = 5 ( L F 0 ( ϕ ) j = 1 p F i ( ϕ ) X j δ ) 2 ,
where μ i , ν i represent the longitude and latitude values of sample location i respectively, F indicates the functional relationship between the dependent variable yi, the independent variable xi, and the location information, F i ( ϕ ) is a gaussian function of the spatial weights at sample location I, L is the value of SOM content at sample location i, and δ is a random error term. dik indicates the distance between the ith sample and the adjacent kth samples. Xik represents the geographic elements differences between the ith sample and the adjacent kth samples. The smaller the t-value, the lower the region-specificity and the stronger the spatial association of the sample set.
Moreover, to improve the ability of the spatial weight function to evaluate the attributes and spatial information of the samples, Xj was set to auxiliary information for five geographic elements that are closely related to SOM and easily accessible, i.e., elevation data, normalized difference vegetation index, soil wetness index, distance to the sea, and temperature. Distance to the sea is the nearest distance to the sea for each sample point, determined by defining the shoreline boundary and then calculating the Euclidean distance using ArcGIS 10.2 software. Elevation data were freely accessed from the Geospatial Data Cloud website (http://www.gscloud.cn/, accessed on 20 November 2022). The normalized difference vegetation index, soil wetness index, and temperature data were calculated at the same time (23 January 2019) as the field sampling data were acquired. In addition, the collected auxiliary data were all resampled with 10 m.
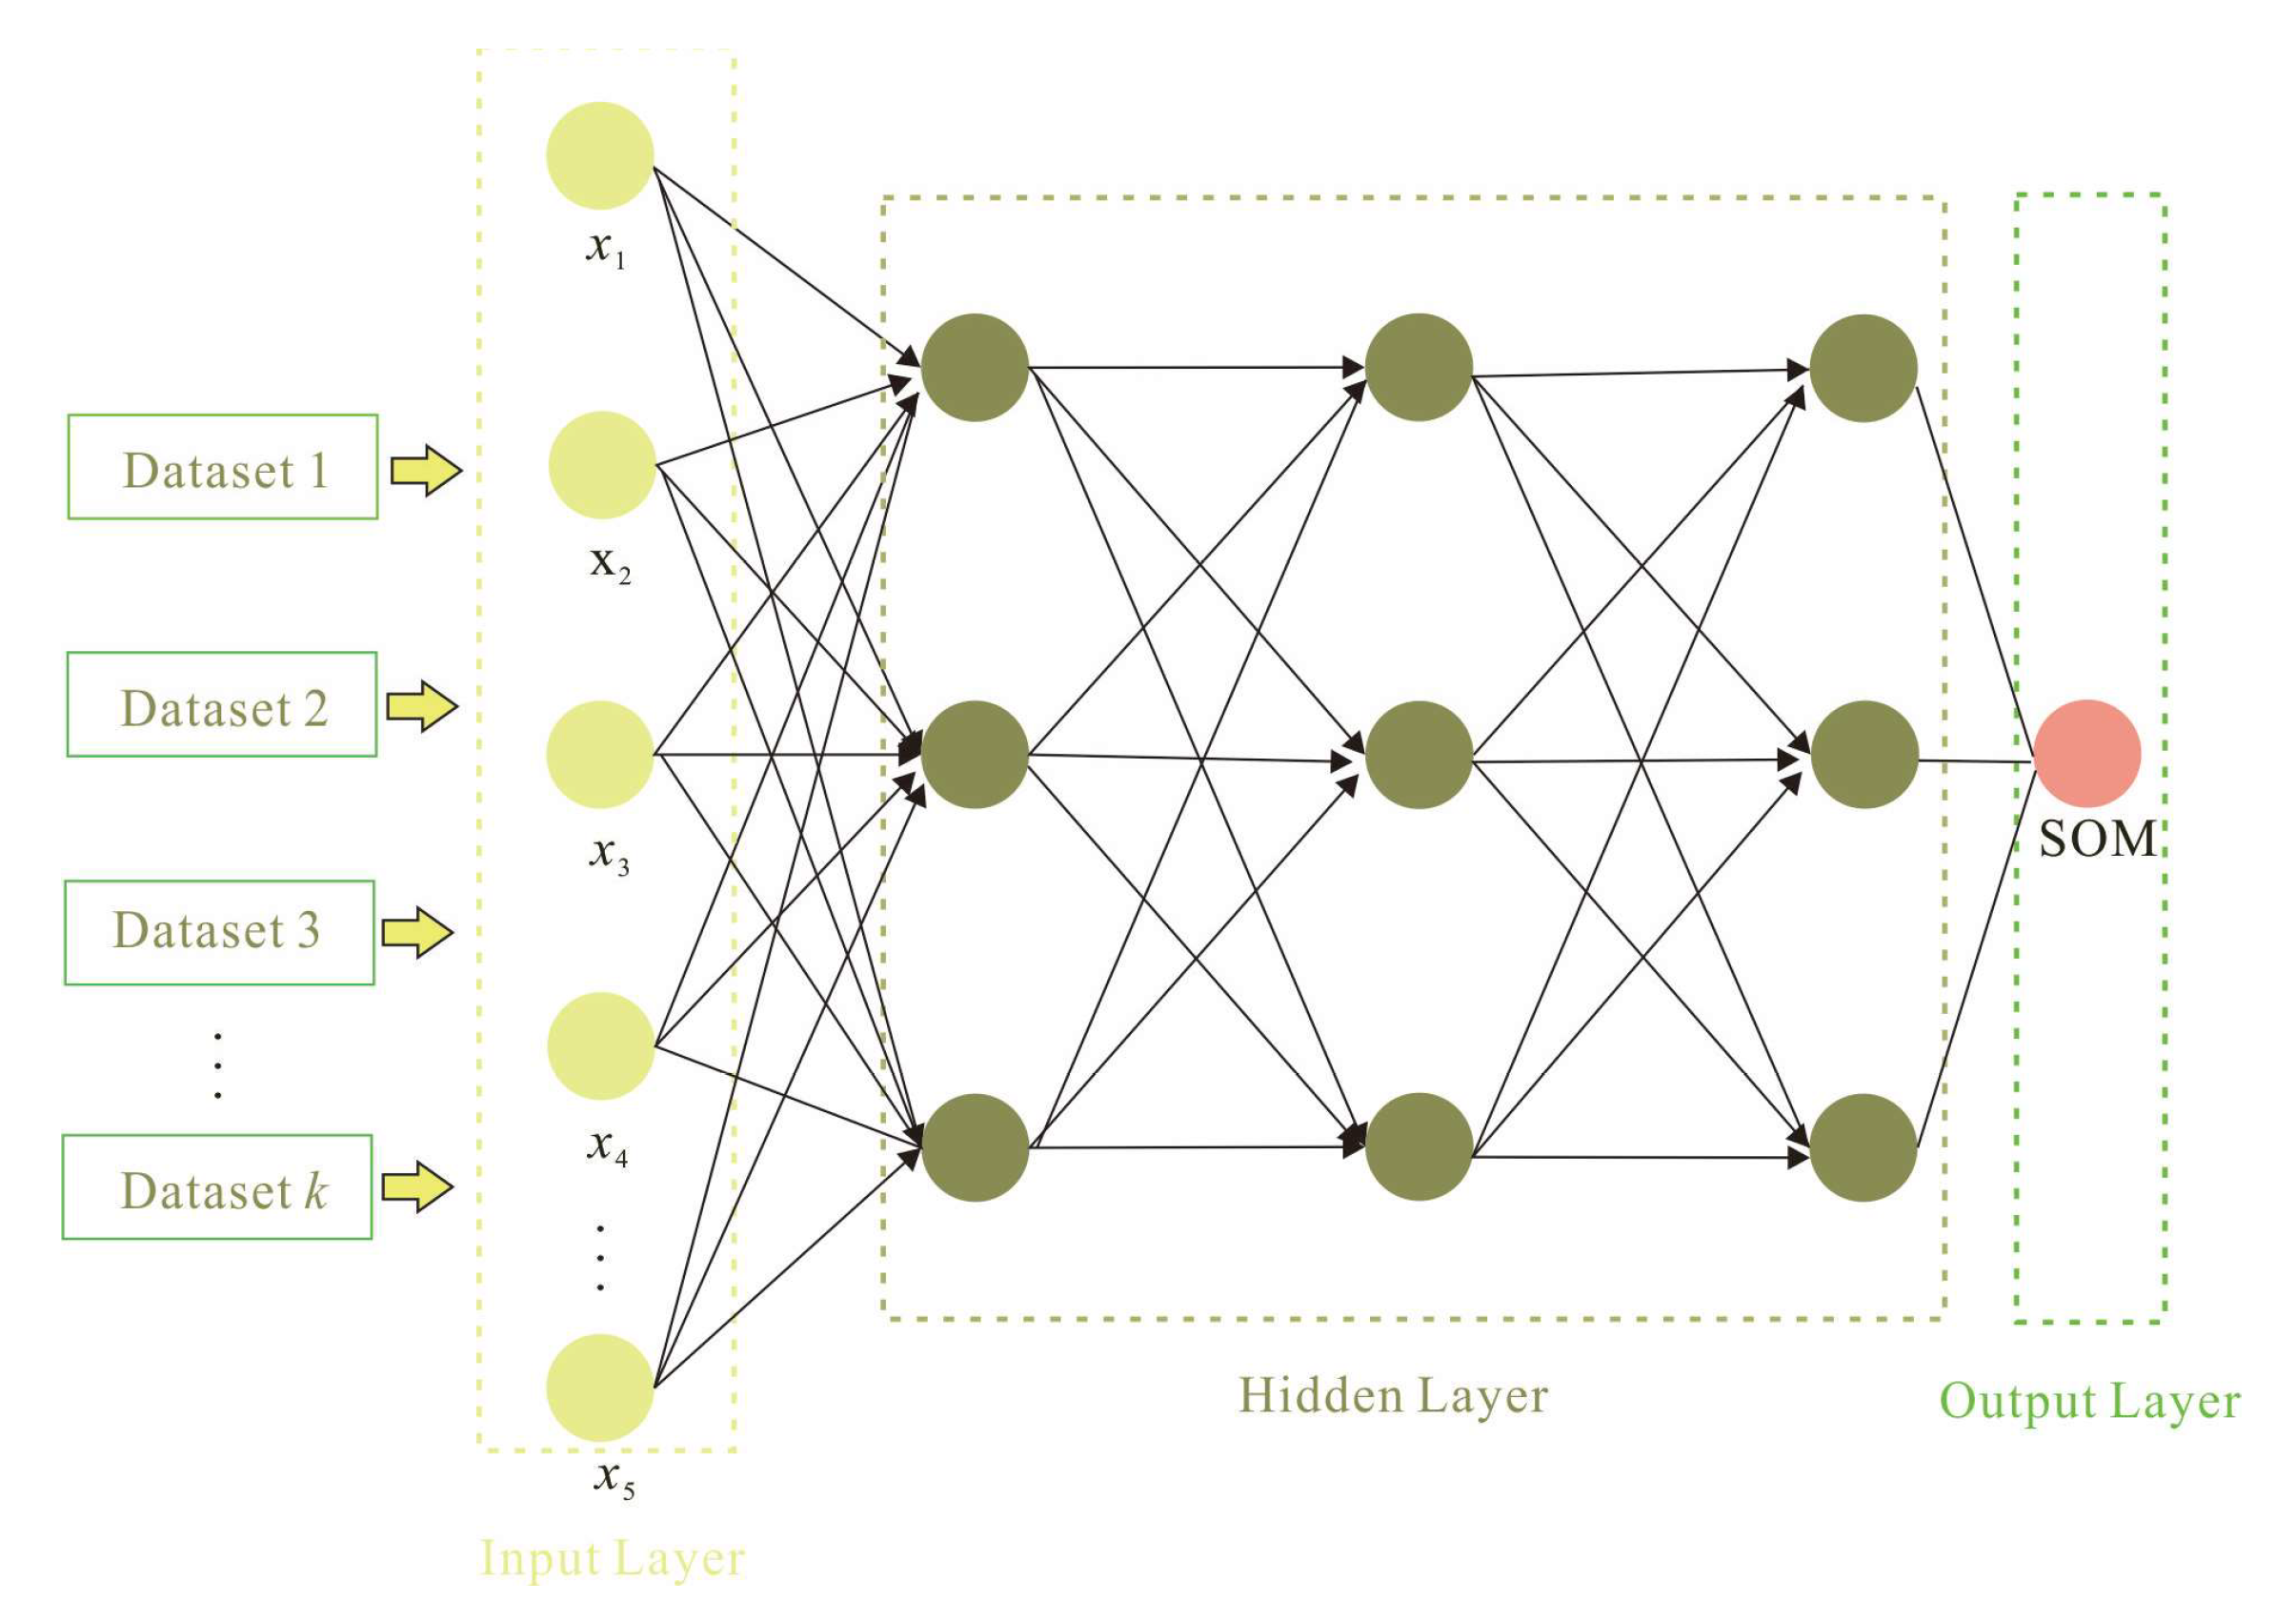
As shown in Figure 2, the IDL network was constructed from the calibration dataset (1, 2, …, k) formed at different t values input into the model for training, with the number of nodes in the input layer depending on the number of selected spectral features. The feature-to-label transition was made by adjusting the weights in the hidden layers. The hidden layers of an IDL network are generally determined by the sample data features, the total of sample data, and the training samples. Usually, two to five hidden layers are sufficient. On the basis of an initial hidden layer, the number and structure of neurons with the highest performance are selected after testing and tuning. ReLU was set for activating the functional relationship between input and output in the mapping. The learning rate and epoch were set to 0.001 and 10, respectively, and the Dropout module (0.01) was added to alleviate overfitting to improve estimation model accuracy. Both the DL network and the IDL network were programmed in Python 3.8 based on the PyTorch module. IDL can optimize the calibration sample set by removing outlier samples, and perform the model calibration for remote sensing estimation of SOM.

2.6. Accuracy Assessment

The calibration sample set (n = 632) was randomly selected from the total sample set (n = 701), and the remaining samples were regarded as the validation sample set (n = 69). Note that six soil samples were removed from the field soil dataset (n = 707) due to damage during transportation. Additionally, model performance was evaluated by the validation set’s coefficient of determination (R2), root mean square error (RMSE), and the ratio of performance to interquartile distance (RPIQ). R2 is the ratio of the total sum of squares to the residual sum of squares and can be used to reflect the model’s fitting level. RMSE is the square root of the variance between the measured SOM contents and the estimated SOM contents. RPIQ is the ratio of the quartile ranges of the validation set to the RMSE of the validation set. According to Bellon-Maurel et al. [28] and Wang et al. [29], when RPIQ >4.05, model accuracy is satisfactory. The estimation results are good when the RPIQ value is between 3.37 and 4.05. The model could provide an approximate estimation accuracy when the RPIQ value ranged from 2.70 to 3.37. When the RPIQ value is between 2.02 and 2.70, this indicates that the model performance is fair (i.e., no estimation capability). Generally, a satisfactory model is characterized by higher R2 and RPIQ as well as lower RMSE.

3. Results

3.1. Descriptive Statistical Characteristics of Soil Organic Matter Contents

The statistical characteristics of SOM contents are shown in Figure 3. The average SOM content of the total sample set was 12.59 g kg−1, and the maximum and minimum were 1.69 g kg−1 and 44.52 g kg−1, respectively. According to the three-level classification standard of the National Soil Nutrient Survey, the SOM contents of the sample set were primarily in the fourth level (10–20 g kg−1) and the fifth level (6–10 g kg−1), and only a few samples were classified in the third level (20–30 g kg−1). Overall, the SOM contents in the study area were low. The calibration and validation sets showed similar characteristics for sample data distribution (Log-normal distribution), indicating that the random sample extraction method was reliable. The coefficient of variation was used to evaluate the fluctuation of the sample data distribution. The coefficients of variation of the three sample sets were greater than 0.36, indicating a high level of variability [30]. Kurtosis and skewness are critical parameters for describing the centralized and double-tailed sample data distributions. The skewness values of the three sample sets were all greater than 0, indicating a positive bias that suggested that human activities and environmental factors had interfered with SOM data distribution [31]. Generally, the occurrence of spatial variation in SOM was evident and may have been influenced by environmental factors and anthropogenic activities. Thus, the following statistical analysis and modelling are needed.

3.2. Selecting the Spectral Features for the Model Inputs

The VIP values of 210 spectral features (12 single bands, 66 DI, 66 RI, and 66 ND) are shown in Figure 4. B11 showed the highest VIP value. The spectral bands in the short-wave infrared range (e.g., B11 and B12) were characterized by higher VIP values than other spectral bands. The narrow bands of B8 and B8a also suggested obvious correlations with SOM contents. B8 and B8a have similar spectral ranges, and thus the VIP values were the same. B4, B5, B6, and B7 were the SOM-sensitive bands in the near-infrared range, with central wavelengths at 665, 705, 740, and 775 nm, respectively. The VIP values for the remaining bands were less than 1, indicating no obvious correlation with SOM.
The spectral indices highlighted the spectral absorption signals for SOM content. The band difference indices were the optimal method and showed the strongest response to SOM (Figure 4). The two ranges in the coordinate system of the DI’s VIP values were higher than other regions, consisting of B11 and B12 in the range B1 to B5, and B8 and B8a in the range B1 to B3, for a total of 16 DIs. B1 to B5 had the lowest VIP values in the variable importance assessment of the single bands, while the spectral indices constructed after the band difference transformation increased the correlation levels with SOM. The spectral index was not only composed of multiple-band information, but could also enhance the spectral absorption signals of SOM while attenuating noise. Lastly, the optimal SOM spectral features were determined based on consideration of the number of hidden layers and nodes of the model, and on the VIP values of the spectral features, including B11, B1–B11, B2–B11, B3–B11, B4–B11, and B1–B12.

3.3. Performance of the Estimation Model and SOM Maps

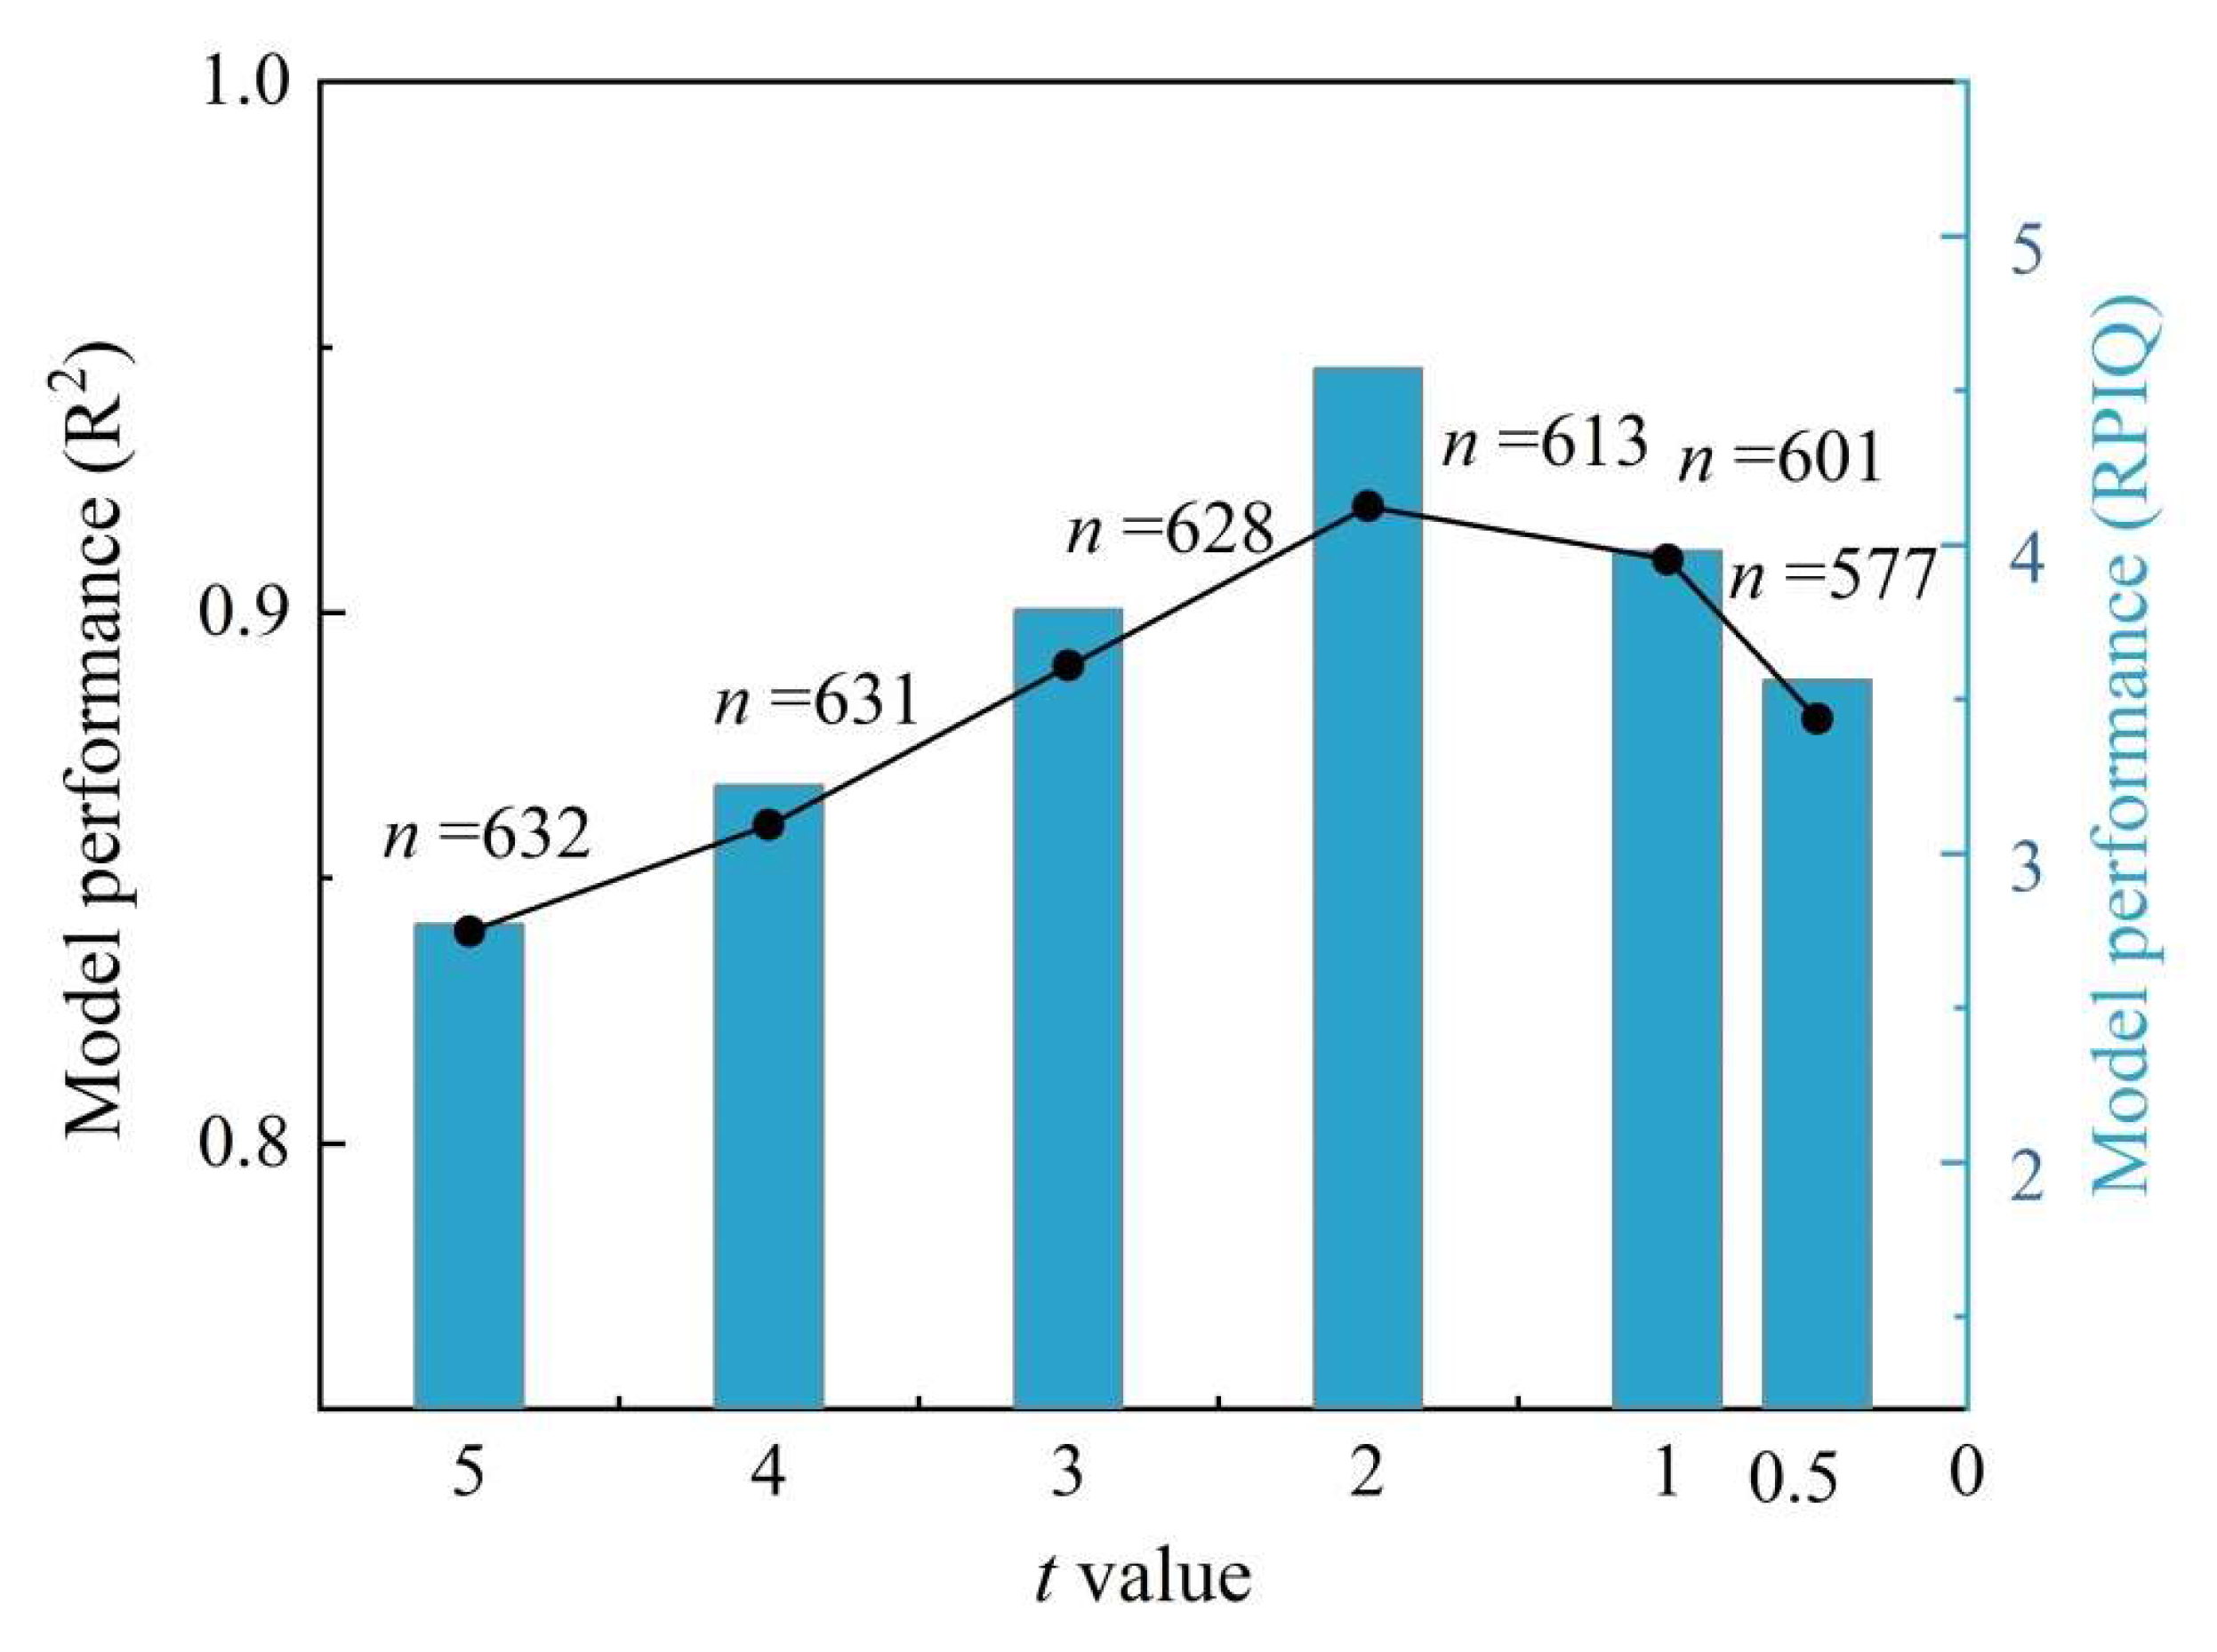
The selected spectral features were used as the independent variables in the spectral-based models constructed using the DL and IDL networks. The estimation results for the DL network are shown in Figure 5a. The points of estimated values versus measured values were located around the 1:1 line (R2 = 0.84; RMSE = 2.78; RPIQ = 2.84), but overestimation and underestimation issues also occurred, indicating that the estimation results were acceptable. The optimal calibration sample set (n = 613) was obtained, as indicated by the t value of 2. The calibrated model (i.e., IDL network) exhibited better performance (R2 = 0.92; RMSE = 1.73; RPIQ = 4.57) for SOM estimation (Figure 5b). The estimated and measured SOM values were on both sides of the 1:1 line with small deviations. Compared with the DL network, the accuracy parameters (R2 and RPIQ) were increased by 9.52% and 60.92%, respectively.
The constructed IDL network was applied to the entire study area in order to verify the model reliability to mapping SOM contents. SOM contents gradually increased from north to south over the Weibei area, and there were high-value (>20 g kg−1) SOM areas around reservoirs and wetland reserves. Estimated SOM ranged from 0.60 to 55.20 g kg−1 (Figure 6), and measured SOM ranged from 0.69 to 44.52 g kg−1. The statistical characteristics of the SOM mentioned above were basically consistent. Overall, SOM distribution was affected by the distance from the sea and agricultural activities. As the distance from the sea declined from south to north, the shallow saline water increased and became more abundant, and soil water evaporation and salt crystallization seriously increased in the surface soil layer, resulting in land degradation and decreased SOM content. The saltern development further intensified SOM variation and explained the low SOM (SOM < 6 g kg−1) areas in the northern saltern area. In addition, the reservoirs and lakes in the southern part of the Weibei area are rich sources of freshwater irrigation that can be used to flush salt from the soil and maintain soil fertility, resulting in the higher SOM content in the southern part of the study area.

4. Discussion

4.1. Using the Band Combination Indices for Characterizing the SOM Spectral Features

Characterizing the spectral features of SOM was the basis for establishing the IDL network. Initially, the 12 satellite bands were used to analyze the relationship with SOM, but the limited multispectral bands could not comprehensively illustrate the spectral signals of SOM. Furthermore, the three band combination methods (i.e., spectral indices) were used to mine the spectral signals of SOM. The spectral index can highlight the SOM spectral features and diminish the irrelevant information from other soil components [8]. Consequently, the constructed DI’s VIP value was higher than the VIP values for single bands and showed a significant correlation with SOM content (Figure 3). However, the VIP values of RI and NDI were lower than the single bands, suggesting that the combination types affected the feature characterization of SOM spectral signals. Similarly, Hong et al. [32] and Liu et al. [33] indicated that band combination methods were correlated with the types of soil physicochemical properties such as mineral components, moisture, and clay. Overall, band combination indices are an effective method for characterizing the spectral features of SOM. Still, the application of band combination indices outside the research area should be compared and selected.
Mechanism analysis of the selected spectral parameters can be useful for identifying the influential predictor variables and decreasing the uncertainties in the IDL-based remote sensing model. According to the VIP assessment, the optimal spectral features of SOM were B11, B1–B11, B2–B11, B3–B11, B4–B11, and B1–B12. B11 is a single multispectral band that belongs to the short-wave infrared range. Miloš et al. [34], Viscarra Rossel and Hicks [35], and Wang et al. [36] have reported that the SOM-responsive bands were in the short-wave infrared wavelength range and were dominated by C-H vibrations, kaolinite, soil adsorbed water, and Al-OH clay minerals. In contrast, Liu et al. [33] found that the B3 and B6 bands in the visible wavelength range were closely correlated with SOM content of black soils. Obviously, there are some differences in the satellite bands and spectral ranges that respond to SOM contents around the world. Furthermore, Silvero et al. [37] conducted a correlation analysis between multispectral satellite bands and SOM contents in the southern Brazilian farmland. They concluded that the spectral bands in the visible spectral wavelength range were important to SOM, and that the soil showed a yellow-brown color thus SOM content was in the low level (mean value <20 g kg−1, class IV); the features in the visible spectral band were affected by the fact that dark soil color is related to high SOM content [38]. Soils in the Weibei area showed slight salinization due to seawater intrusion, decreased SOM contents, and increased spectral absorption of O-H bonds (i.e., SOM-responsive bands in the short-wave infrared range). Additionally, B9 and B9-based spectral indices were all poorly correlated with SOM and, therefore, can be excluded in future SOM spectral estimation research to reduce the computational work. Overall, SOM content status was well explained by the B11 band and band difference spectral indices. Band combination methods (i.e., spectral indices) and SOM spectral features selection were vital for improving the remote sensing estimation model.
In addition, environmental covariates (such as vegetation coverage) are commonly used in constructing the RS-based SOM mapping model. Although the model built with the environmental covariates performed well in a complex landscape area, it is more sensitive to the seasons and terrain in the local area and is unsuitable in the coastal plain. Additionally, information duplication and redundancy among the environmental covariates in the DL network need attention. In the future, a spectral index can be designed in this specific environmental condition and will improve the RS-based IDL network.

4.2. Applicability of the IDL Network for Regional SOM Mapping and the Uncertainty Analysis

The IDL network was developed considering the spatial association information among the input samples data. The traditional DL network in remote sensing estimation of SOM simulated the signal transformation process of soil information to spectral reflectance by deepening the neural network’s depth and width to improve the model’s accuracy and effectiveness. However, the model typically assumes that the sample data exist independently within two-dimensional geographical space and cannot be judged by spatial association for heterogeneous sample data [39], resulting in the calibrated model’s overfitting and low generalization capability. SOM content has significant variability in time and space, and the mapping relationship between soil properties and spectral reflectance was different over different regions. Thus, a model that considers the spatial association among the sample data is essential for achieving high estimation accuracy. Indeed, obtaining a large number of soil samples can help determine the mapping relationship for the reflection transmission process. Still, the labor costs associated with field sample collection and chemical analysis are increased. The IDL model is incorporated into the spatial weight function module to evaluate spatial heterogeneity and the association of the sample data to optimize the training sample set, decrease the transfer calculation of neural network nodes, and avoid the overfitting issue.
The t value represents the levels of randomness and heterogeneity of the sample data in the computation of the IDL network: the smaller the t value, the stronger the sample data associations and the less regional-specificity of the sample data. The calibration sample set in the IDL model with different t values is shown in Figure 7. A total of 632 samples was used in the IDL model calculation when the t value was less than 5, where the RPIQ value was 2.77. As the t value decreased, the number of heterogeneous sample data was reduced. When the t value was 2, a total of 613 samples was used to calibrate the IDL model, as indicated by the best accuracy (R2 = 0.92; RPIQ = 4.57). Next, as the number of calibration samples declined as the t value decreased, the model could not be fully trained, and the estimation accuracy dropped. Overall, the IDL model exhibited satisfactory accuracy and stability for SOM estimation by introducing the spatial association module. On the other hand, a certain number of representative field samples is also essential to obtain optimal model convergence speed and to achieve the training goal.
The RS-based IDL model produced an accurate SOM map that can support soil fertility assessment and environmental monitoring. Compared with a back propagation neural network, the feedback capability of the fully connected layers in the IDL network was enhanced and particularly suited to the function fitting for the surface electromagnetic transmission process. The study area was close to the sea, and soil physicochemical properties interacted with various environmental factors (vegetation, moisture, sea, topography, and parent material). Thus, mapping the soil properties is challenging. A spectral-based estimation model was established by Xu et al. [40] and Li et al. [41] in the Weibei area which exhibited acceptable results (R2 ranged from 0.64 to 0.80) for SOM estimation at the local scale. The IDL model established in our study had an R2 of 0.92 and has been extended from spectral estimation at the local scale to the regional scale.
There are some uncertainties in constructing the IDL network for regional SOM mapping. SOM is one of many factors influencing the spectral reflectance of the Sentinel-2B bands, and the diverse components of the soils may damage the IDL-based remote sensing model. Thus, in situ effects removal and the integration of the time-series images should be considered in a subsequent study. Furthermore, selected SOM spectral features have different VIP values, suggesting that the importance of SOM is different; however, the IDL network did not consider this variation when the spectral features were used as inputs. If the importance weight of spectral features were considered in the IDL network, the number of neuron nodes and hidden layers would be determined accurately and effectively. In the end, the mixed pixel issue in remote sensing estimation is still an unavoidable problem. The spectral reflectance exhibited by a mixed pixel can weaken the spectral features of the ground target. The moderate spatial resolution (10-m) Sentinel-2 image was selected as the satellite data source, and non-bare soil areas such as roads, vegetation, and construction land were masked to weaken the interference of mixed pixels. Bayer et al. [42] and Allbed et al. [43] suggested that the mixed pixel decomposition method and high spatial resolution images can be used to improve the accuracy of remote sensing estimation and should be the focus of future studies.

5. Conclusions

The aim of this study was to detect the heterogeneous samples for optimizing a calibration sample set and then to build an IDL network to improve SOM content mapping at the regional scale. B11 was the most important band for estimating SOM content. The short-wave infrared range in the satellite data was the sensitive spectral area for SOM content when the soil exhibited slight salinization. Band difference indices can synthesize the multiple-band information and can significantly highlight the absorption signal of SOM contents. The optimal SOM spectral indices were B1–B11, B2–B11, B3–B11, B4–B11, and B1–B12. The IDL network yielded the best estimation accuracy (R2 = 0.92; RMSE = 1.73; RPIQ = 4.57). Compared with the estimation model built with the DL network (R2 = 0.84; RMSE = 2.78; RPIQ = 2.84), the accuracy indices (RPIQ) were increased by 60.92%. The generalization capability was improved, and the generated SOM maps were more accurate. The spatial distribution of SOM content showed a high-value (>20 g kg−1) area in the south and a low-value area in the north. The low-value (6 g kg−1) area was influenced by seawater intrusion. These results show that the IDL network combined with multispectral satellite data was able to accurately map SOM contents at the regional scale. In the future, an SOM spectral index for bare soil can be designed in this specific environmental condition and will decrease the selection work of spectral covariates on the IDL network. Additionally, the importance weight of selected spectral features should be considered in the IDL network structure, as this could improve the model efficiency and accuracy.

Author Contributions

Conceptualization, methodology, investigation, writing—review and editing, X.X.; funding acquisition and writing—review and editing, X.Z. All authors have read and agreed to the published version of the manuscript.

Funding

The authors are grateful for the financial support provided by the Key Laboratory of Environmental Change and Natural Disaster of the Ministry of Education, Beijing Normal University (Project No. 2022-KF-14).

Institutional Review Board Statement

Not applicable.

Informed Consent Statement

Not applicable.

Data Availability Statement

Preprocessed images, reference data, and produced maps presented in this study are available from the corresponding author upon request.

Conflicts of Interest

The authors declare no conflict of interest.

References

  1. Castaldi, F.; Hueni, A.; Chabrillat, S.; Ward, K.; Buttafuoco, G.; Bomans, B.; Vreys, K.; Brell, M.; van Wesemael, B. Evaluating the capability of the sentinel 2 data for soil organic carbon prediction in croplands. ISPRS J. Photogramm. 2019, 147, 267–282. [Google Scholar] [CrossRef]
  2. Li, H.; Li, Y.; Yang, M.; Chen, S.; Shi, Z.J.L.D. Development. Strategies for efficient estimation of soil organic content at the local scale based on a national spectral database. Land Degrad. Dev. 2022, 33, 1649–1661. [Google Scholar] [CrossRef]
  3. Nawar, S.; Mouazen, A.M. Optimal sample selection for measurement of soil organic carbon using on-line vis-nir spectroscopy. Comput. Electron. Agr. 2018, 151, 469–477. [Google Scholar] [CrossRef]
  4. Zhang, M.; Zhang, M.; Yang, H.; Jin, Y.; Zhang, X.; Liu, H. Mapping regional soil organic matter based on sentinel-2a and modis imagery using machine learning algorithms and google earth engine. Remote Sens. 2021, 13, 2934. [Google Scholar] [CrossRef]
  5. Krishnan, P.; Alexander, J.D.; Butler, B.; Hummel, J.W. Reflectance technique for predicting soil organic matter. Soil Sci. Soc. Am. J. 1980, 44, 1282–1285. [Google Scholar] [CrossRef]
  6. Liu, H.; Zhang, Y.; Zhang, B. Novel hyperspectral reflectance models for estimating black-soil organic matter in Northeast China. Environ. Monit. Assess. 2009, 154, 147–154. [Google Scholar] [CrossRef]
  7. Mohamed, E.S.; Baroudy, A.; El-beshbeshy, T.; Emam, M.; Belal, A.; Elfadaly, A.; Aldosari, A.A.; Ali, A.; Lasaponara, R. Vis-nir spectroscopy and satellite landsat-8 oli data to map soil nutrients in arid conditions: A case study of the northwest coast of egypt. Remote Sens. 2020, 12, 3716. [Google Scholar] [CrossRef]
  8. Wang, X.; Zhang, F.; Kung, H.-t.; Johnson, V.C. New methods for improving the remote sensing estimation of soil organic matter content (somc) in the ebinur lake wetland national nature reserve (elwnnr) in northwest china. Remote Sens. Environ. 2018, 218, 104–118. [Google Scholar] [CrossRef]
  9. Luo, C.; Wang, Y.; Zhang, X.; Zhang, W.; Liu, H. Spatial prediction of soil organic matter content using multiyear synthetic images and partitioning algorithms. Catena 2022, 211, 106023. [Google Scholar] [CrossRef]
  10. Xu, X.; Chen, Y.; Wang, M.; Wang, S.; Li, K.; Li, Y. Improving estimates of soil salt content by using two-date image spectral changes in Yinbei, China. Remote Sens. 2021, 13, 4165. [Google Scholar] [CrossRef]
  11. Bhunia, G.S.; Kumar Shit, P.; Pourghasemi, H.R. Soil organic carbon mapping using remote sensing techniques and multivariate regression model. Geocarto Int. 2019, 34, 215–226. [Google Scholar] [CrossRef]
  12. McBratney, A.B.; Santos, M.M.; Minasny, B. On digital soil mapping. Geoderma 2003, 117, 3–52. [Google Scholar] [CrossRef]
  13. Ou, D.; Tan, K.; Lai, J.; Jia, X.; Wang, X.; Chen, Y.; Li, J. Semi-supervised dnn regression on airborne hyperspectral imagery for improved spatial soil properties prediction. Geoderma 2021, 385, 114875. [Google Scholar] [CrossRef]
  14. Odebiri, O.; Mutanga, O.; Odindi, J. Deep learning-based national scale soil organic carbon mapping with sentinel-3 data. Geoderma 2022, 411, 115695. [Google Scholar] [CrossRef]
  15. Odebiri, O.; Mutanga, O.; Odindi, J.; Naicker, R. Modelling soil organic carbon stock distribution across different land-uses in south africa: A remote sensing and deep learning approach. ISPRS J. Photogramm. 2022, 188, 351–362. [Google Scholar] [CrossRef]
  16. Shen, Z.; Ramirez-Lopez, L.; Behrens, T.; Cui, L.; Zhang, M.; Walden, L.; Wetterlind, J.; Shi, Z.; Sudduth, K.A.; Baumann, P.; et al. Deep transfer learning of global spectra for local soil carbon monitoring. ISPRS J. Photogramm. 2022, 188, 190–200. [Google Scholar] [CrossRef]
  17. Pham, V.; Weindorf, D.C.; Dang, T. Soil profile analysis using interactive visualizations, machine learning, and deep learning. Comput. Electron. Agric. 2021, 191, 106539. [Google Scholar] [CrossRef]
  18. Shi, Z.; Ji, W.; Rossel, R.A.V.; Chen, S.; Zhou, Y. Prediction of soil organic matter using a spatially constrained local partial least squares regression and the Chinese vis–nir spectral library. Eur. J. Soil Sci. 2015, 66, 679–687. [Google Scholar] [CrossRef]
  19. Bao, Y.; Meng, X.; Ustin, S.; Wang, X.; Zhang, X.; Liu, H.; Tang, H. Vis-swir spectral prediction model for soil organic matter with different grouping strategies. Catena 2020, 195, 104703. [Google Scholar] [CrossRef]
  20. Tobler, W.R. A computer movie simulating urban growth in the detroit region. Econ. Geogr. 1970, 46, 234–240. [Google Scholar] [CrossRef]
  21. Fotheringham, A.S.; Brunsdon, C.; Charlton, M. Geographically Weighted Regression: The Analysis of Spatially Varying Relationships; John and Wiley and Sons: Hoboken, NJ, USA, 2003. [Google Scholar]
  22. Padarian, J.; Minasny, B.; McBratney, A.B. Using deep learning for digital soil mapping. Soil 2019, 5, 79–89. [Google Scholar] [CrossRef] [Green Version]
  23. Nachtergaele, F.O.; Spaargaren, O.; Deckers, J.A.; Ahrens, B. New developments in soil classification: World reference base for soil resources. Geoderma 2000, 96, 345–357. [Google Scholar] [CrossRef]
  24. Davis, E.; Wang, C.; Dow, K. Comparing sentinel-2 msi and landsat 8 oli in soil salinity detection: A case study of agricultural lands in coastal north carolina. Int. J. Remote Sens. 2019, 40, 6134–6153. [Google Scholar] [CrossRef]
  25. Lu, R.J. Technology Press, B. Analysis methods of soil agricultural chemistry. China Agric. Sci. Technol. Press Beijing 2000, 107, 147–150. [Google Scholar]
  26. Wold, S.; Martens, H.; Wold, H. The multivariate calibration problem in chemistry solved by the pls method. In Matrix Pencils; Springer: Berlin/Heidelberg, Germany, 1983; pp. 286–293. [Google Scholar]
  27. Castaldi, F.; Palombo, A.; Santini, F.; Pascucci, S.; Pignatti, S.; Casa, R. Evaluation of the potential of the current and forthcoming multispectral and hyperspectral imagers to estimate soil texture and organic carbon. Remote Sens. Environ. 2016, 179, 54–65. [Google Scholar] [CrossRef]
  28. Bellon-Maurel, V.; Fernandez-Ahumada, E.; Palagos, B.; Roger, J.-M.; McBratney, A. Critical review of chemometric indicators commonly used for assessing the quality of the prediction of soil attributes by nir spectroscopy. TrAC Trends Anal. Chem. 2010, 29, 1073–1081. [Google Scholar] [CrossRef]
  29. Wang, J.; Hu, X.; Shi, T.; He, L.; Hu, W.; Wu, G. Assessing toxic metal chromium in the soil in coal mining areas via proximal sensing: Prerequisites for land rehabilitation and sustainable development. Geoderma 2022, 405, 115399. [Google Scholar] [CrossRef]
  30. Wilding, L. Soil spatial variability. Workshop (Las Vegas NV 1984-11-30). In Proceedings of the Spatial Variability: Its Documentation, Accomodation and Implication to Soil Surveys, Soil Spatial Variability, Las Vegas, NV, USA, 30 November–1 December 1984; pp. 166–194. [Google Scholar]
  31. Lv, J.; Liu, Y.; Zhang, Z.; Dai, J. Factorial kriging and stepwise regression approach to identify environmental factors influencing spatial multi-scale variability of heavy metals in soils. J. Hazard. Mater. 2013, 261, 387–397. [Google Scholar] [CrossRef]
  32. Hong, Y.; Yu, L.; Chen, Y.; Liu, Y.; Liu, Y.; Liu, Y.; Cheng, H. Prediction of soil organic matter by vis–nir spectroscopy using normalized soil moisture index as a proxy of soil moisture. Remote Sens. 2018, 10, 28. [Google Scholar] [CrossRef] [Green Version]
  33. Liu, H.; Zhang, M.; Yang, H.; Zhang, X.; Meng, X.; Li, H.; Tang, H.J. Invertion of cultivated soil organic matter content combining multi-spectral remote sensing and random forest algorithm. Trans. CSAE 2020, 36, 134–140. [Google Scholar]
  34. Miloš, B.; Bensa, A. Prediction of soil organic carbon using vis-nir spectroscopy: Application to red mediterranean soils from croatia. Remote Sens. Environ. 2021, 252, 112–117. [Google Scholar] [CrossRef]
  35. Rossel, R.A.V.; Hicks, W.S. Soil organic carbon and its fractions estimated by visible–near infrared transfer functions. Environ Pollut. 2020, 267, 438–450. [Google Scholar]
  36. Wang, Q.; Wu, C.; Chen, K.; Ba, D.; Zhao, S.; Wei, Y.; Liu, J.; Su, X.; Zhang, X. Estimating topsoil organic matter in qinghai lake basin using multi-spectral remote sensing images. Soils 2019, 1, 160–167. [Google Scholar]
  37. Silvero, N.E.Q.; Demattê, J.A.M.; Amorim, M.T.A.; Santos, N.V.d.; Rizzo, R.; Safanelli, J.L.; Poppiel, R.R.; Mendes, W.d.S.; Bonfatti, B.R. Soil variability and quantification based on sentinel-2 and landsat-8 bare soil images: A comparison. Remote Sens. Environ. 2021, 252, 112117. [Google Scholar] [CrossRef]
  38. Gholizadeh, A.; Saberioon, M.; Ben-Dor, E.; Viscarra Rossel, R.A.; Boruvka, L. Modelling potentially toxic elements in forest soils with vis-nir spectra and learning algorithms. Environ. Pollut. 2020, 267, 115574. [Google Scholar] [CrossRef]
  39. Burt, J.E.; Barber, G.M.; Rigby, D.L. Elementary Statistics for Geographers; Guilford Press: New York, NY, USA, 2009. [Google Scholar]
  40. Xu, X.; Lu, J.; Wu, Q.; Yu, Q.; Zhou, X.; Cao, J. Prediction of soil organic matter based pca-mlr and pca-bpn algorithm using field vnir spectroscopy in coastal soils of southern laizhou bay. Spectrosc. Spect. Anal. 2018, 38, 2556–2562. [Google Scholar]
  41. Li, Y.; Tang, J.; Wang, D.; Wang, C.; Zhang, C. Spectral analysis and retrieval of soil organic matter in coastal zone of laizhou bay. Geogr. Geo-Inf. Sci. 2012, 4, 79–82. [Google Scholar]
  42. Bayer, A.D.; Bachmann, M.; Rogge, D.; Müller, A.; Kaufmann, H. Combining field and imaging spectroscopy to map soil organic carbon in a semiarid environment. IEEE J.-STARS 2016, 9, 3997–4010. [Google Scholar] [CrossRef]
  43. Allbed, A.; Kumar, L.; Aldakheel, Y.Y. Assessing soil salinity using soil salinity and vegetation indices derived from ikonos high-spatial resolution imageries: Applications in a date palm dominated region. Geoderma 2014, 230, 1–8. [Google Scholar] [CrossRef]
Figure 1. Geographic location of the study area (a,b) and soil sampling sites (c).
Sustainability 15 00323 g001
Figure 2. The architecture of the improved deep learning neural network.
Sustainability 15 00323 g002
Figure 3. Statistical characteristics of soil organic matter contents in (a) the total set, (b) the calibration set, and (c) the validation set.
Sustainability 15 00323 g003
Figure 4. Variable importance in the projection (VIP) of the (a) band difference indices (DI), (b) band ratio indices (RI), (c) band normalized difference indices (NDI), and (d) multispectral single bands.
Sustainability 15 00323 g004
Figure 5. Scatter plots of measured soil organic matter (SOM) contents versus estimated SOM contents obtained using (a) a deep learning (DL) network and (b) an improved deep learning (IDL) network.
Sustainability 15 00323 g005
Figure 6. Map of estimated soil organic matter contents in Weibei, China.
Sustainability 15 00323 g006
Figure 7. The performance difference of the deep learning network model with various t values (n represents the number of calibration samples).
Sustainability 15 00323 g007
Disclaimer/Publisher’s Note: The statements, opinions and data contained in all publications are solely those of the individual author(s) and contributor(s) and not of MDPI and/or the editor(s). MDPI and/or the editor(s) disclaim responsibility for any injury to people or property resulting from any ideas, methods, instructions or products referred to in the content.