Abstract
The choice of transportation system has an important impact on the production efficiency and economic behavior of underground mines. Trackless vehicle transportation has gradually become the main method in underground mines because mining companies have realized that mining efficiency can be improved using advanced vehicle mechanization and automation in the mining process. The extracted ore is loaded onto trucks by loaders in situ, then the trucks drive to ore passes for unloading Trucks load and unload ore in a cyclical manner between stopes and ore passes. Numerous trucks drive in tunnels simultaneously to achieve production targets, and there are interactions and influences among trucks, such as blocking and queuing, due to limited underground space. To address this issue, a transportation route model was built, and the ore transportation process was divided into three parts, including ore loading, truck transportation, and ore unloading. The simulation method was applied to optimize the number of loaders and trucks under the constraints of stope production capacity, transportation route and capacity, and vehicle capacity, to achieve the optimal vehicle utilization rate and transportation capability. The Monte Carlo simulation method was utilized to take the uncertainties of the transportation parameters into account to improve the robustness of the simulation results. The model was verified using the case study of an underground gold mine located in Shandong Province, China, with the objective of accomplishing optimal truck–loader matching considering various stopes in a mining area.
1. Introduction
1.1. Overview of Underground Mine Transportation System
The transportation system of an underground mine is designed to transport ore, waste rock, materials, and miners, and plays an important role in mining and largely determines the productivity and economic efficiency of the mine. The transportation system of a large underground mine is a complex dynamic system influenced by multiple links, processes, and equipment. Transportation methods include trackless haulage, rail haulage, ore passes, and shaft hoisting, among others. With the continuous progress of mechanization and automation in mining enterprises, trackless transportation has gradually become the main transportation means used in underground mines. The optimization of trackless transportation systems has become a core concern for mining companies given the savings on production costs and increases in economic benefits involved [1].
The complexity of the transportation system of underground mines mainly manifests in the following two aspects:
- The transportation process is an extremely complex process that includes ore loading, vehicle avoidance, ore unloading, ore pass layout, rail haulage, and shaft hoisting, and a number of uncertain events that can result in differences in the time necessary to transport ore from the stopes to the processing plant may occur.
- Generally, a development layout including various routes and transportation branches are designed to approach the ore body. It is difficult to establish a transportation model containing the whole system due to layout complexity. It is hard to find the optimal solution even when a mathematical model is established.
1.2. Transportation System Optimization
The transportation systems of large underground mines are characterized by heavy transportation tasks, diversified transportation equipment, difficult-to-control transportation costs, and complex transportation routes. Therefore, it is of great significance to seek a scientific and reasonable optimization method to improve the production efficiency and economic benefits of a transportation system. Currently, mathematical programming is a widely used optimization method to find the optimal solution with the aid of a computer [2].
Trackless transportation systems can be optimized from two perspectives, i.e., transportation plan optimization, and trackless vehicle scheduling optimization. Vehicle scheduling problems are often tackled using simulation methods due to the discreteness of the vehicle transportation process. The objectives considered in transportation problems are usually divided into two categories: total transportation cost minimization, and optimal transportation arrangement to complete the task in the shortest time.
Several mine fleet management system models and algorithms have been proposed to optimize mine production and operation efficiency [3,4].
Zhen described a schedule optimizer for mobile mining equipment in underground mines. Algorithms used in this optimizer were proposed to provide theoretical support to make decisions that can considerably improve production efficiency and decrease working time. The optimizer could rapidly provide a solution to redesign the schedule when adverse events occur [5].
Schulze et al. presented a mixed-integer linear model to minimize the maximum completion time of excavations. The model, used on a small scale, could be solved with CPLEX. An advanced multi-start algorithm was also developed to tackle large-scale instances [6].
Astrand et al. considered the production scheduling model of an underground mine as a flow shop scheduling model. An equipment scheduling optimization method for each process of the underground mine was proposed by the authors and verified using actual mine data. The scheduling solution generated by the algorithm showed great improvement compared with manual scheduling [7].
Brickey et al. applied an advanced algorithm to the case of an underground gold mine. The achieved solutions indicated an increase in throughput greater than 2% and a decrease in development footage of as much as 11% [8]. Jie et al. proposed an integrated optimization model solved using an improved genetic algorithm to simultaneously optimize stope extraction sequencing and timing, extracted ore grade, and equipment dispatching for underground mining [9].
Hai, Elijah, et al. developed models using MATLAB software to optimize shovel–truck system performance in an open-pit mine using the queuing theory technique. The outputs of the models showed relationships between the truck fleet size and the queue length, waiting time in the queue, shovel utilization, and production, which gave a clear overview for the user to adjust the system to achieve minimal operation costs [10,11]. Furthermore, some scholars have considered the operational complexities and uncertainties occurring in dynamic circumstances to deal with truck allocation problems. An improvement of the haulage fleet dispatching policy was recommended to promote system efficiency and productivity [12,13].
1.3. Transportation System Simulation
The earliest research on the simulation of mining operations appeared in the late 1950s and was performed manually. Back then, the field of mining system simulation mainly focused on queueing theory, schedule planning, inventory systems, the yield evaluation method, and deposit modeling. Simulation models were generally programmed in general programming languages such as Fortran, which was time and capital consuming. Moreover, due to lack of reusability and portability, it was difficult to highlight the advantages of employing a simulation model. In the late 1980s, simulation software such as GPSS, SIMULA, GASP, and SIMAN emerged. Animation simulation technology was applied to directly express the process of simulation systems, enhancing the effectiveness of simulation models and leading to a revival of research on the application of system simulation technology in mining engineering. Currently, commonly used simulation software includes Auto Mod, Matlab, Promodel, Witness, Arena, and Flexsim [14].
With the improvement of the discrete-event simulation theory and the development of computer technology, computer simulation technology has been widely used in logistics systems. The simulation method has been successfully applied to truck–shovel matching, truck dispatching, mining equipment reliability assessment, and fleet productivity prediction in open-pit mines [15,16,17,18,19,20].
Underground mine transportation systems are no less complex than surface transportation systems. In such logistics systems, dynamic scheduling is the most complex task, so it is difficult to describe the entire transportation process using analytical methods [21]. Therefore, before investing a lot of time, money, and other resources, a newly designed logistics system should be extensively tested and optimized by converting a planned underground mine transportation system into a simulation model and running it on a computer [22,23].
The simulation of a transportation system is a complex continuous–discrete-event hybrid system simulation. It not only describes continuous state changes over time, but also describes the events that occur at discrete points in time; furthermore, it can reflect the simulation evaluation results of the system. Therefore, it is of great significance to apply simulation technology to a model and simulate the underground transportation system for guiding the mining process [24].
Sebeom et al. developed a program to simulate a transportation system with trucks and loaders of an underground mine using the GPSS/H simulation language. The program was shown to perform well in optimizing truck dispatching and to have practical value for mining operations [25]. Salama et al. used discrete-event simulations to compare the production rates of two different types of hauling units. An optimal solution was discussed for production improvement [26]. Hong et al. presented several simulation scenarios developed for bunker size analysis of an underground coal mine using discrete-event simulations. Strategies to address system bottlenecks to meet performance targets were evaluated to identify the most effective alternative [27].
We propose a simulation model of trackless vehicle scheduling programmed using the Python language based on an actual situation of mine production to evaluate the transportation efficiency of a trackless transportation system in a production area. The quantitative proportion of loaders and trucks was reasonably optimized to improve the trackless transportation capacity and the utilization rate of trackless equipment.
2. Optimization of Trackless Transportation Process in Underground Mines
2.1. Trackless Transportation Features
An ore transportation system needs to be designed once the mining method of an underground mine has been determined, as this directly determines the cost and efficiency of ore hauling. With the promotion and application of mechanization and automation equipment, trackless transportation has gradually become the main means of underground mine ore transportation. Compared with other methods, trackless transportation has the advantages of high mobility, flexible arrangement, and low initial investment with respect to the way in which ore is transported directly from stopes to unloading sites. This method can also be adapted to an environment where tracked transportation is unsuitable, such as high gradients, sharp turns, and narrow drifts.
After drilling, blasting, and other auxiliary processes in stopes, the mined ore is loaded onto a truck by a loader, unloaded at a secondary ore pass, transported to the main ore pass by an electric locomotive, and finally brought to the surface via a hoisting shaft. The trackless transportation of ore involves a large number of vehicles, which results in comprehensive scheduling being difficult. First, there are many stopes for mining at the same time, and all kinds of vehicles need to be dispatched accurately and function in highly coordinated operation. Second, there are no fixed routes for trackless vehicles. The arbitrariness and flexibility of trackless vehicles easily lead to blocking and queuing, thus affecting transportation efficiency.
2.2. Ore Transportation Process in Mining Areas
An example of the ore transportation process in a mining area is shown in Figure 1. Crushed ore from each stope is loaded onto trucks by loaders and then transferred to an ore pass. The trucks carry ore back and forth between stopes and ore passes, which not only meets the requirements of the flexible arrangement of stopes but also makes ore transportation fast and stable. The transportation system at each level of the underground mine consists of numerous drifts. Numerous trucks drive in drifts simultaneously to achieve production targets, and each truck has different tasks and destinations; therefore, there are interactions and influences among different trucks, such as blocking and queuing, due to the space constraints of underground mining.
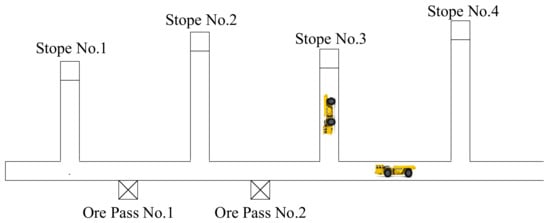
Figure 1.
Top view of mining area transportation system.
One ore pass is shared by multiple stopes, and multiple trucks can serve one stope at the same time. Truck queuing may occur in the ore loading or unloading process due to the space limitation of the tunnels. With the increase in trucks, the efficiency of ore transportation tends to rise and then fall because trucks crowd the tunnels. An increase in vehicle number not only raises the capital investment but also leads to a decrease in transportation efficiency, as shown in Figure 2. Therefore, devising the optimal configuration of trackless vehicles could improve the efficiency of ore transportation in underground mines.
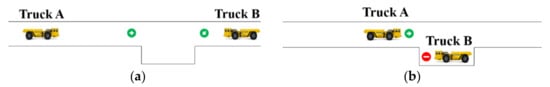
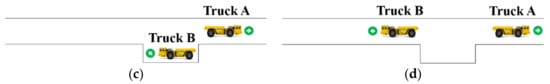
Figure 2.
Truck avoidance process. (a) Truck A meets truck B. (b) Truck B avoids truck A. (c) Truck A goes through the tunnel. (d) Truck B goes through the tunnel.
2.3. Transportation Network Modeling
Transportation network modeling is used to describe transportation paths, which is the basis to conduct ore transportation route planning and optimize truck scheduling in underground mines. A transportation network model provides information on transportation distance and driving time. The transportation distance is calculated according to the length of the route centerline based on the tunnel layout.
In network modeling, the transportation network is simplified and expressed using symbols. Figure 3a shows an example, and Figure 3b shows the schematic diagram of drifts in a mining area, where ◯ represent loading locations, ◆ represent junctions, and ● represent unloading locations.
Figure 3.
(a) Schematic diagram of drifts in a mining area. (b) Transportation network model.
The transportation network is described using a graph that contains nodes and edges. Driving routes are represented by the edges of the network graph, and the weight of the edge expresses the transportation distance. The nodes of the network graph represent stope, ore pass, and fork locations. The transportation network graph is the basis to conduct simulation and optimization. The transportation capacity can thus be evaluated, and a more economical and reasonable trackless vehicle transportation scheduling solution can be found by simulating the process of ore transportation from stopes to ore passes.
3. Ore Transportation Simulation Modeling
3.1. Simulation Scope
The process of ore transportation in mining areas can be treated as several steps, including ore loading, trackless vehicle transportation, and ore unloading, as shown in Figure 4. Currently, underground mines generally adopt the dispatching method of fixed truck allocation, which limits the utilization rate of trackless vehicles and transportation efficiency. Selecting a suitable ratio of loaders to trucks is essential to improve transportation efficiency. Therefore, a transportation route model was built, and the simulation method was applied to optimize the number of loaders and trucks under the constraints of stope production capacity, transportation route and capacity, and vehicle capacity to achieve the optimal vehicle utilization rate and transportation capability.
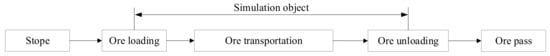
Figure 4.
Simulation scope.
3.2. Assumptions and Conditions
Ore transportation is affected by multiple factors in the mining process. Some assumptions were made to transform the transportation problem into a simulation model:
- Each step took the same time in the simulation. The transportation distance between the stopes and ore passes was assumed to be constant during the simulation.
- Ore from the same stope was assumed to be continuously extracted during the simulated period.
- All LHDs and trucks were of the same type, and the efficiency was constant and not affected by external factors.
- The storage capacity of each ore pass was not limited.
- The running times of empty and full trucks were obtained based on the weighted average of actual data, which already included truck avoidance time, so the model only considered the queuing time of trucks.
- The trackless vehicles were not maintained when operating. The vehicles had the same performance and were fully loaded when leaving a loading position.
3.3. Logic Model of Ore Transportation
Truck transportation is a circular process, and a truck’s loading location is not limited to a specific stope, nor is its unloading location limited to a specific ore pass. The logic model of ore transportation here proposed focuses on analyzing the ore transportation process, as shown in Figure 5. The model fully considers the dynamic characteristics of trackless transportation equipment. The modeling strategies include stope priority, distance priority, and queuing priority. The performance of all loaders and trucks is assumed to be the same, so that they can be allocated with the same possibility.
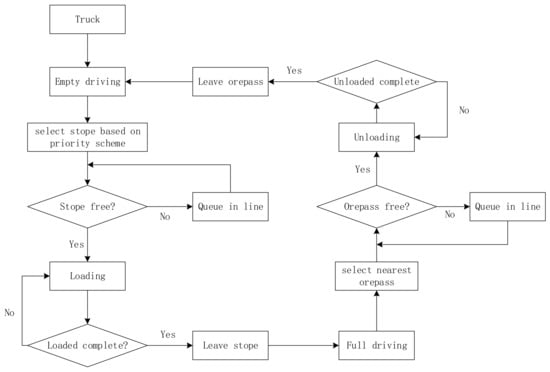
Figure 5.
Logic of ore transportation between stope and ore pass.
- All stopes are added to the alternative stope list in order by ore quantity. The stope with the most ore tonnage has priority in the allocation of loaders and trucks. Loaders are allocated to each stope equally according to the ore tonnage of stopes in the order from the largest to the smallest. The remaining stopes are attended to when the ore of the richest stopes has been transported completely according to the sequence of the stope list. Two scenarios of truck configuration are possible.
- Scenario I: When the number of trucks is less than or equal to the number of loaders, each truck is allocated to each loader equally based on the priority of the stope that the loader attends to. Loader that are not assigned a truck are idle.
- Scenario II: When the number of trucks is greater than the number of loaders, the average number of trucks assigned to each loader equals the integer obtained from the number of trucks divided by the loader number, and the remaining trucks are allocated equally to the priority stopes with more ore.
- An empty truck runs to a stope according to the priority scheme for ore transportation. The empty truck loads the ore directly if the loader is free; otherwise, it queues and waits until the previous trucks have been loaded.
- The truck leaves the stope when fully loaded, and the trucks in the queue start loading.
- The fully loaded truck runs to the nearest ore pass and transports ore to it. If the ore pass is free, the truck unloads the ore directly; otherwise, it waits in the queue. If several trucks travel to the same ore pass, then the trucks are sorted according to their arrival time; thus, the first truck to arrive has unloading priority, while the rest of the trucks wait in line.
- The truck unloads ore at the ore pass and then goes back to the stope on the same route if the stope still has ore to transport. If there is no ore left in that stope, the depleted stope is removed from the alternative stope list. Then, the available loader and truck select the stope with the maximum amount of ore among the stopes waiting to be attended to.
- When there are no stopes that need to be attended to, free loaders and trucks go to other mining areas.
3.4. Simulation Model Execution Logic
The ore transportation process can be approximately abstracted to a complex discrete dynamic system. The entity-oriented activity scanning method is used in simulation modeling to express the law of state change over time and describe the events occurring at discrete time points.
The logical model of ore transportation is an important component of simulation models. Here, the state changes of a trackless transportation system are simulated in chronological order. The system states are reset and recorded at regular intervals, and some important information is saved. The recorded state information includes the ore tonnage stockpiled at the stope to be transported, the remaining time for trucks to reach the stope or ore pass, and the queuing time of each truck. The total time for the accomplishment of the transportation task, the total queuing time of trucks, and the total transportation distance are accumulated. The simulation model execution process is shown in Figure 6.
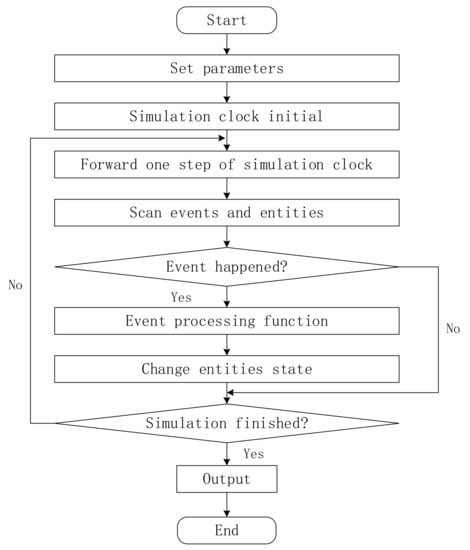
Figure 6.
Simulation model execution process.
The entities in our simulation model include stopes, transportation paths, trucks, and ore passes. The entity parameters include the ore tonnage of the stopes, the distance from the stope to the ore pass, and the truck number. The state parameters include the truck state (loaded, driving, or unloaded), the stope state (loading or free), and the ore pass state (unloading or free). The performance parameters include the truck running speed, the truck load capacity, the ore loading efficiency, and the ore unloading efficiency.
4. Case Study and Results
4.1. Simulation Scenario
An underground gold mine located in Shandong Province, China, that adopts the backfilling mining method was used as a case study. The development of shafts, declines, and drifts is designed to haul ore and waste. Trackless vehicles are used in a wide range to transport ore from stopes to ore passes. An optimization simulation model was established based on the trackless transportation process at the −375 m level. Shovel loaders Atlas Copco ST 3 are used for loading ore or waste, and dump trucks ASJK-12 are used for transporting ore or waste. Trackless vehicles drive along drifts as shown in Figure 7. There are six stopes and two ore passes in this mining area. Currently, the ore of stopes 1, 2, 3, and 4 has been extracted and is stocked in situ.
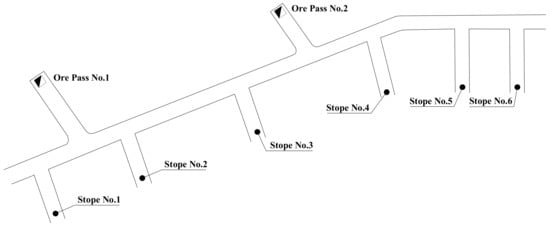
Figure 7.
Transportation routes.
The transportation routes were modeled as shown in Figure 8. The ore tonnage values of the stopes were 206, 230, 251, 220, 190, and 241, respectively. The distances between different stopes and the distances from the stopes to the ore passes are shown in Table 1.
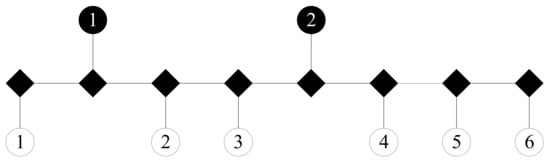
Figure 8.
Transportation route modeling.

Table 1.
Distances between different stopes and distances between stopes and ore passes.
4.2. Simulation Parameters
It is necessary to collect and analyze the production data when a transportation simulation model is established. The bucket volume of Atlas Copco ST is 3 m3, and the loading capacity of ASJK-12 is 12 tons. Due to uncertainties that may occur during mining operations, the parameters of the efficiency of vehicles, speed of movement, and loading time can fluctuate within a range. Through the investigation of mining data on-site, the probability distribution of each parameter was obtained statistically, such as the efficiency of the loader in loading ore or waste, the discharge time of the truck, and the average driving speed of the truck when empty and fully loaded, as shown in Figure 9.
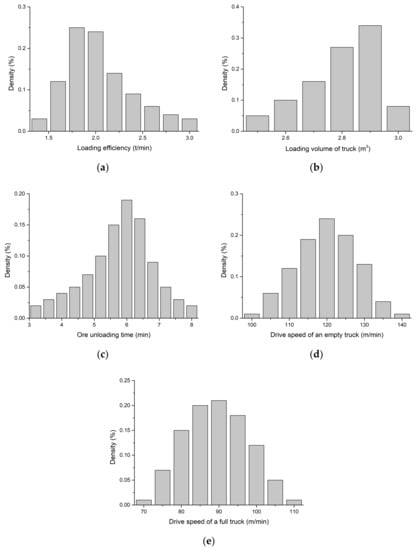
Figure 9.
Probability distribution of transportation parameters. (a) Density of ore unloading time. (b) Density of loading volume of truck. (c) Density of ore unloading time. (d) Density of driving speed of an empty truck. (e) Density of driving speed of a full truck.
4.3. Simulated Results and Analysis
The process of shovel loading and trackless transportation was treated as the simulated object. The simulation model was programmed using Python, based on the activity scanning method. The transportation efficiency using different numbers of trackless vehicles was obtained. The working duration of three shifts was 24 h. The simulation time was taken as 16 h, as we deducted 8 h dedicated to drilling, blasting, and supporting. The simulated time step was set as one minute.
The simulation results include the total time taken by different numbers of loaders and trucks, and the average utilization rates of trucks, as shown in Table 2 and Table 3. A total of 5000 Monte Carlo simulations were conducted to consider the uncertainties of the transportation parameters.
Table 2.
Average time needed to finish task with different numbers of trucks and loaders.
Table 3.
Average truck utilization rates with different numbers of trucks and loaders.
The simulation model was run on an Intel (R) Xeon (R) with a 2.3 GHz CPU processor and 64 GB RAM. The computation time for one simulation process was approximately 35 s. The simulation results are shown and compared in Figure 10 and Figure 11.
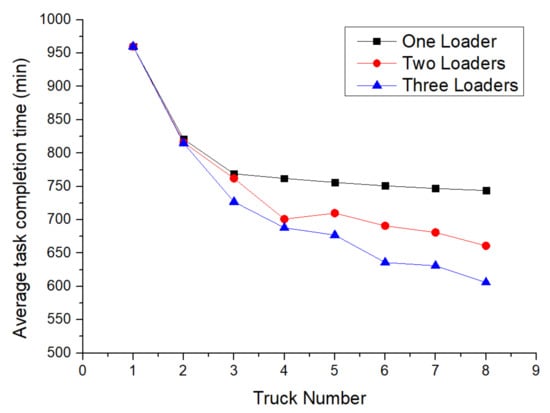
Figure 10.
Average task completion time changes with different numbers of loaders and trucks.
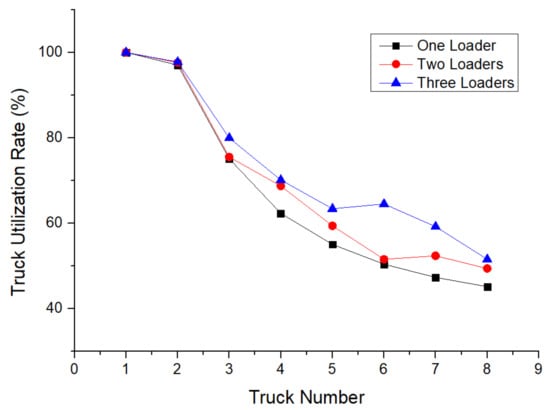
Figure 11.
Average utilization rates of trucks when the number of trucks and loaders changed.
The simulated results show that when the number of trucks increased, the time needed to finish the ore transportation task generally tended to decrease. The task could not be completed regardless of the number of loaders if the truck number was one. The task completion time was reduced sharply when the truck amount was increased from one to two. When the number of trucks increased from two to ten, the downward trend gradually decreased; the task completion time may have increased when the truck number was increased due to the presence of more trucks causing traffic congestion. The amount of time reduction increased with the increase in loaders. The time reduction amount obtained with the increase from one loader to two loaders was greater than that obtained with the increase from two loaders to three loaders.
As the number of trucks increased, the probability of waiting to load at a stope and waiting to unload at an ore pass increased, and the number of times and the duration of avoidance events in the operation process increased. Therefore, the average utilization rates of trucks also showed a decreasing trend, because the non-working time of trucks increased. The utilization rate decreased with the increase in the number of trucks. The utilization rate was below 80% when the truck number was increased to three. The improvement of the truck utilization rate was not obvious when the number of loaders was increased from one to two.
The appropriate ratio between the number of trucks and loaders could be selected comprehensively according to the task completion time, the average utilization rate of trucks, and the transportation cost. In general, the scenario of one loader and two trucks could finish the task within the working time using the lowest number of vehicles. The utilization rate of trucks was 97.03% in this case. The increase in the number of vehicles generally increases the cost of transportation. Therefore, the optimal result was allocating one loader and two trucks in this mining area. More vehicles increase the operation cost and lead to traffic congestion; in addition, trucks can be blocked in the tunnel, which results in a low utilization rate.
The results show that the simulation model could feasibly and viably optimize the numbers of loaders and trucks in the mining area of the considered underground mine. The modeling process and framework could also be useful for other underground mines. However, it would be necessary to modify the simulated parameters based on the specific conditions.
5. Conclusions
A simulation model was designed to optimize the numbers of loaders and trucks in the mining area of underground mines to improve ore transportation efficiency. The process of ore transportation in mining areas was divided into different steps, including ore loading, trackless vehicle transportation, and ore unloading. The entity-oriented activity scanning method was applied to the simulation model to describe the events occurring at discrete time points. The logic of truck transportation and simulation execution was built and programmed using Python. A case study of an underground mine in China was adopted to verify the model. Our research enriches the method for ore transportation optimization in underground mines.
A trackless vehicle transportation scheme suitable for actual production was optimized using the simulation method, and the optimal trackless vehicle configuration scheme that could effectively reduce the collision avoidance events of trucks, improve the transportation speed, improve the utilization rate of trucks, and realize the efficient cooperation of trucks, was obtained.
The Monte Carlo simulation method was used in this simulation process. The uncertainties of the trackless transportation parameters were fully considered in this simulation to improve the robustness of the simulation results. In conclusion, this simulation method has strong applicability to problem solving in trackless transportation. By adopting the simulation model, transportation schemes can be evaluated and optimized before investing a lot of money, time, and other resources.
Author Contributions
Methodology, G.L.; Software, H.W.; Validation, L.C.; Resources, N.H.; Data curation, J.H. and G.L.; Writing—original draft, J.H.; Writing—review & editing, J.H. All authors have read and agreed to the published version of the manuscript.
Funding
This research was supported by National Key R&D Program of China (No. 2022YFC2903905), National Natural Science Foundation of China (No. 52074022), and Anhui Mine IOT and Security Monitoring Technology Key Laboratory (grant No. 2109Y-09-03).
Institutional Review Board Statement
Not applicable.
Informed Consent Statement
Not applicable.
Data Availability Statement
Not applicable.
Conflicts of Interest
The authors declare no conflict of interest.
References
- Krzyzanowska, J. The impact of mixed fleet hauling on mining operations at Venetia mine. J. S. Afr. Inst. Min. Metall. 2007, 107, 215–224. [Google Scholar]
- Ercelebi, S.G.; Bascetin, A. Optimization of shovel-truck system for surface mining. J. S. Afr. Inst. Min. Metall. 2009, 109, 433–439. [Google Scholar]
- Afrapoli, A.M.; Askari-Nasab, H. Mining fleet management systems: A review of models and algorithms. Int. J. Min. Reclam. Environ. 2017, 33, 42–60. [Google Scholar] [CrossRef]
- Nehring, M.; Topal, E.; Knights, P. Dynamic short term production scheduling and machine allocation in underground mining using mathematical programming. Min. Technol. 2013, 119, 212–220. [Google Scholar] [CrossRef]
- Song, Z.; Schunnesson, H.; Rinne, M.; Sturgul, J. Intelligent Scheduling for Underground Mobile Mining Equipment. PLoS ONE 2015, 10, e0131003. [Google Scholar] [CrossRef]
- Schulze, M.; Rieck, J.; Seifi, C.; Zimmermann, J. Machine scheduling in underground mining: An application in the potash industry. OR Spektrum 2015, 38, 365–403. [Google Scholar] [CrossRef]
- Åstrand, M.; Johansson, M.; Zanarini, A. Fleet Scheduling in Underground Mines Using Constraint Programming. In Integration of Constraint Programming, Artificial Intelligence, and Operations Research; Springer: Berlin/Heidelberg, Germany, 2018; pp. 605–613. [Google Scholar]
- Brickey, A.; Chowdu, A.; Newman, A.; Goycoolea, M.; Godard, R. Barrick’s Turquoise Ridge Gold Mine Optimizes Underground Production Scheduling Operations. INFORMS J. Appl. Anal. 2021, 51, 106–118. [Google Scholar] [CrossRef]
- Hou, J.; Li, G.; Wang, H.; Hu, N. Genetic algorithm to simultaneously optimise stope sequencing and equipment dispatching in underground short-term mine planning under time uncertainty. Int. J. Min. Reclam. Environ. 2019, 34, 307–325. [Google Scholar] [CrossRef]
- Hai, D.V.; Masniyom, M. Application of queuing theory in analysing shovel-truck haulage system in vietnam surface mine. Int. J. Adv. Sci. Eng. Technol. 2016, 4, 42–45. [Google Scholar]
- Elijah, K.; Joseph, G.; Samuel, M.; Mauti, D. Optimisation of shovel-truck haulage system in an open pit using queuing approach. Arab. J. Geosci. 2021, 14, 973. [Google Scholar] [CrossRef]
- Jung, D.; Baek, J.; Choi, Y. Stochastic Predictions of Ore Production in an Underground Limestone Mine Using Different Probability Density Functions: A Comparative Study Using Big Data from ICT System. Appl. Sci. 2021, 11, 4301. [Google Scholar] [CrossRef]
- Moniri-Morad, A.; Pourgol-Mohammad, M.; Aghababaei, H.; Sattarvand, J. A Methodology for Truck Allocation Problems Considering Dynamic Circumstances in Open Pit Mines, Case Study of the Sungun Copper Mine. Rud. Geološko-Naft. Zb. 2019, 34, 57–65. [Google Scholar] [CrossRef]
- Forsman, B.; Rönnkvist, E.; Vagenas, N. Truck dispatch computer simulation in Aitik open pit mine. Int. J. Surf. Min. Reclam. Environ. 2008, 7, 117–120. [Google Scholar] [CrossRef]
- Afrapoli, A.M.; Tabesh, M.; Askari-Nasab, H. A multiple objective transportation problem approach to dynamic truck dispatching in surface mines. Eur. J. Oper. Res. 2019, 276, 331–342. [Google Scholar] [CrossRef]
- Tabesh, M.; Upadhyay, S.P.; Askari-Nasab, H. Discrete Event Simulation of Truck-Shovel Operations in Open Pit Mines1. MOL Annu. Rep. Seven 2016, 7, 77–93. [Google Scholar]
- Tan, Y.; Takakuwa, S. A practical simulation approach for an effective truck dispatching system of open pit mines using VBA. In Proceedings of the 2016 Winter Simulation Conference (WSC), Washington, DC, USA, 11–14 December 2016. [Google Scholar]
- Torkamani, E.; Nasab, H.A. A linkage of truck-and-shovel operations to short-term mine plans using discrete-event simulation. Int. J. Min. Miner. Eng. 2015, 6, 97. [Google Scholar] [CrossRef]
- Yeganejou, M.; Badiozamani, M.; Moradi-Afrapoli, A.; Askari-Nasab, H. Integration of simulation and dispatch modelling to predict fleet productivity: An open-pit mining case. Min. Technol. 2022, 131, 67–79. [Google Scholar]
- Yuriy, G.; Vayenas, N. Discrete-event simulation of mine equipment systems combined with a reliability assessment model based on genetic algorithms. Int. J. Min. Reclam. Environ. 2008, 22, 70–83. [Google Scholar] [CrossRef]
- Greberg, J.; Salama, A.; Gustafson, A.; Skawina, B. Alternative Process Flow for Underground Mining Operations: Analysis of Conceptual Transport Methods Using Discrete Event Simulation. Minerals 2016, 6, 65. [Google Scholar] [CrossRef]
- Fioroni, M.M.; Dos Santos, L.C.A.; Franzese, L.A.; Seixas, J.C.; Penna, B.S.; De Alkmim, G.M. Logistic evaluation of an underground mine using simulation. In Proceedings of the Winter Simulation Conference 2014, Savannah, GA, USA, 7–10 December 2014. [Google Scholar]
- Runciman, N.; Vagenas, N.; Baiden, G. Evaluation of Underground Development Mining Systems Using Discrete-Event Simulation. Simulation 2016, 72, 4–11. [Google Scholar] [CrossRef]
- Saayman, P.F.R.; Craig, I.K.; Camisani-Calzolari, F.R. Optimization of an autonomous vehicle dispatch system in an underground mine. J. S. Afr. Inst. Min. Metall. 2006, 106, 77–86. [Google Scholar]
- Park, S.; Choi, Y.; Park, H.-S. Optimization of truck-loader haulage systems in an underground mine using simulation methods. Geosyst. Eng. 2016, 19, 222–231. [Google Scholar] [CrossRef]
- Salama, A.; Greberg, J.; Schunnesson, H. The use of discrete event simulation for underground haulage mining equipment selection. Int. J. Min. Miner. Eng. 2014, 5, 256. [Google Scholar] [CrossRef]
- Hong, S.-Y.; Bal, A.; Badurdeen, F.; Agioutantis, Z.; Hicks, S. Evaluation of bunker size for continuous/discrete flow systems by applying discrete event simulation: A case study in mining. Simul. Model. Pract. Theory 2020, 105, 102155. [Google Scholar] [CrossRef]
Disclaimer/Publisher’s Note: The statements, opinions and data contained in all publications are solely those of the individual author(s) and contributor(s) and not of MDPI and/or the editor(s). MDPI and/or the editor(s) disclaim responsibility for any injury to people or property resulting from any ideas, methods, instructions or products referred to in the content. |
© 2022 by the authors. Licensee MDPI, Basel, Switzerland. This article is an open access article distributed under the terms and conditions of the Creative Commons Attribution (CC BY) license (https://creativecommons.org/licenses/by/4.0/).