1. Introduction
The world today is still facing many challenges from the aspects of economy, society, and ecology. Effectively overcoming these problems via sustainable development according to the sustainability guidelines is very dependent on the healthy development of the education system and the guarantee of people’s educational opportunities [
1,
2,
3]. In “the 17 Goals” of Sustainable Development proposed by the United Nations, “Quality Education” asks people to ensure inclusive and equitable quality education and promote lifelong learning opportunities for all [
4]. Achieving this goal of sustainable development not only requires us to pay attention to primary and secondary education but also to higher education [
5,
6]. Existing studies have shown that the return rate of higher education is higher than that of vocational training or high school education [
7], and its role in social development itself is self-evident. In addition, the issues related to higher education and sustainable development have become an urgent need instead of an option in effective social progress [
8]. As citizens continue to focus on how to join forces to make society more sustainable, improvements in education levels and lifelong learning opportunities can enable citizens to achieve a certain level in terms of sharing and discovering knowledge, promoting collaboration with the business world, improving the level of science and technology and creativity, improving personal and social moral systems, and inheriting fine cultural heritage [
9,
10,
11,
12], etc. This is an important prerequisite for all people to contribute to sustainable development.
For a country, the number of students enrolled in higher education is an important indicator reflecting the level of its higher education development, and higher education itself can also enhance citizens’ willingness and effectiveness of lifelong learning and provide guarantees for the sustainable development in education [
13,
14]. For individuals, obtaining a higher education degree from a university is a major academic achievement that provides the foundation for numerous lifelong economic, social, and health-related benefits [
15,
16]. However, statistics show that the number of people who can receive higher education in each country is still very limited, which has a great impact on the living standards of individuals and the sustainable development of the country and the world [
17].
According to Sustainable Development Goal 4, the sustainable development of education requires “ensuring inclusive and equitable quality education and promoting lifelong learning opportunities for all” [
18]. Therefore, only a development that achieves sufficient enrollment numbers, provides sufficient enrollment opportunities, and ensures that the enrollment of colleges and universities is relatively equal in all regions can be considered sustainable development. In terms of opportunities, some scholars have pointed out that the expansion of higher education means increases in the number of educational opportunities [
19], and some empirical studies demonstrated an increased probability for students from disadvantaged strata become enrolled in higher education [
20,
21,
22]. Therefore, if the latest enrollment situation of Chinese colleges and universities can still ensure that people have the opportunity to enter higher education institutions and if there will be significant changes in the development of enrollment in future, then the initial and basic guarantees for the sustainable development of Chinese colleges and universities will be attained. Another more important factor affecting the sustainable development of Chinese university enrollment is equality. Unfortunately, due to China’s economic development showing an obvious pattern of “high in the east and low in the west”, the level of economic and social development in the eastern region is relatively high, so there is a large gap in education between different regions and the education in different regions is still unequal [
23]. For the enrollment of Chinese colleges and universities, since the unbalanced economic development of various regions in China has always existed, and it has also become a realistic background for the formation of unequal educational enrollment in various regions, the important issue at present is whether the first mover advantage of the development of college enrollment in developed regions is shrinking under the background of the large gap in initial education, which can only be judged after analyzing the development of enrollment in various regions of China.
2. Literature Review
Aiming at the enrollment and development of colleges and universities, some scholars have studied these factors from different perspectives. Some scholars regard the enrollment of higher education as a dependent variable, and they study what factors can increase or decrease the enrollment of colleges and universities. Relevant conclusions include the following: The decrease in veterans’ employment led to an increase in college enrollment [
24]; participation in academic activities has a positive impact on college admissions [
25]; expanded student loan eligibility criteria led to higher enrollments for men and lower-income areas [
26]; digital messaging impacts college enrollment positively [
27]; COVID-19 led to a decline in university enrollments for men [
28], etc. Some scholars regard the enrollment of higher education as an independent variable, and they study what other phenomena will be caused by the increase or decrease in college enrollment. For example, Gamze Sart found that in EU countries, higher education enrollments and globalization indices have an important impact on the sustainable development goals in the long-term and short-term process. Among them, the impact of globalization on sustainable development goals is relatively higher than that of higher education on sustainable development [
29]. In addition, an increase in college enrollment has an impact on college premiums for different students [
30]. Other scholars have found that higher education has a positive impact on health based on enrollment data [
31]. Moreover, it can also bring about changes in the labor market [
32]. It can be found that most of these studies that use the number of university enrollments as an independent variable to examine its impact on other factors take China as the research object, which is due to China’s education reform policy that used the expansion of college enrollment as a solution to economic and employment problems [
33]. Clearly, such policies can increase the overall access to higher education for all social classes [
34], However, it will also cause a waste of social resources, reduce the quality of teaching, and increase the burden of residents’ education expenses, and so on [
35]. Based on this, China has further optimized the policy of college enrollment expansion, focusing on improving the quality of higher education in an all-round way [
36]. For a developing country such as China with a population of 1.44 billion [
37], various studies on the number of students enrolled in higher education can provide important references for future decisions related to the sustainable development of education. However, there is a fundamental problem that has been overlooked here, i.e., what changes have taken place in the number of students enrolled in higher education in China and the ratio of enrollment in different types of colleges or universities in recent years. If we can clarify the laws inherent in China’s higher education enrollment data in recent years, such as not only observing whether the enrollment increased or decreased generally but also analyzing the changes in the growth rate and the stability of the growth, we will be able to predict the trends of future development. This can provide an important reference for future research and decision making that takes the number of college enrollment as an independent variable.
According to existing research, for higher education, even within a country, differences in geographical factors can lead to inequalities in educational opportunities, which is mainly reflected in three aspects. First, differences in the degree of economic development in different regions will lead to unequal opportunities for higher education. For example, studies have pointed that “living in a city, especially in the capital, provides better opportunities for education to all young men, irrespective of social origin” [
38], and empirically, differences in socioeconomics in different regions have a direct impact on college enrollment [
39]. There are also some specific examples that illustrate this issue. For example, Greater London has twice as many registered higher education institutions per head than Greater Manchester, the second largest conurbation, which highlights how uneven provision has created a more complex distribution than the standard rural, urban dichotomy [
40]. Second, the location of different types of higher education institutions is unevenly distributed along the geographic dimension, and internationally there still seem to exist differences in educational attainment according to geographical distance to a higher education institution, which also leads to the inequality of opportunities in higher education. In England [
40], in the USA [
41], in Germany [
42], in the Netherlands [
43], and in Sweden [
44] there have been found small but significantly negative effects of geographic distance on the likelihood of starting a university education. Third, there are considerable cultural differences between different regions of the country, which further leads to the deviation of teaching resources and enrollment. For example, the cultural climate in one part of the country is more in favor of technical fields of study, than in other parts. If there is no regulation, resource allocation and enrollment opportunities will continue to magnify with this difference in atmosphere [
45]. For China, there are also the above-mentioned differences brought about by geographical factors because the distribution of enrollment resources of Chinese higher education organizations varies from region to region [
46]. Due to the implementation of the enrollment expansion policy, China has some unique characteristics in the relationship between geographical factors and educational inequality. Some scholars argue that regional differences in college enrollment are justified due to systematic differences between regions [
47,
48]. However, other scholars argue that this disparity contributes to inequality in China’s higher education system [
49,
50]. In addition, some studies have shown that after the expansion of college enrollment, the impact of the number of enrollments on regional innovation ability significantly improved, and there are significant differences in the innovation effect among different regions [
51]. These studies all deal with the differences in enrollment caused by regional factors and other effects. However, it does not involve the laws and predictions of the development sequence of the number of college students enrolled in Chinese provinces in recent years. In addition, whether regional factors have an impact on the changes and stability of the number of college students in various provinces in China has not yet been analyzed in detail. Based on this, it is necessary for this paper to explore the relationship between regions and changes in enrollment numbers. If the region has an impact on the change and development of the number of students enrolled, when making policy recommendations on the enrollment of Chinese colleges and universities in the future, different plans should be proposed to adapt to the different laws of sustainable development in each region.
Based on the above literature review, the current body of research on the sustainable development of Chinese university enrollments lacks an exploration examining the development and changes in the past ten years. Therefore, this study takes the enrollment of Chinese universities as the independent variable or the dependent variable, and it will be limited by ignoring the changing law of enrollment development and only reflecting the enrollment number or rate in the model. In addition, there is currently a lack of a reliable and dynamic predictive model based on the latest data regarding the enrollment of Chinese colleges and universities. This shows that the relevant work on the sustainable development of Chinese university enrollment is only based on existing data instead of referring to the prediction interval, making it more accurate and scientific for judging the direction. Finally, if the development and differences in the law related to enrollment changes in various regions of China are not well understood, it is bound to reduce the reliability of decision making when making sustainable decisions about Chinese university enrollment in a unified and holistic manner due to differences in various regions within China, making it difficult to adapt measures to local conditions.
Therefore, according to the above background and research gap, this paper attempts to raise the following research questions on the changes in the number of college students by means of statistical analysis and computational modeling: (1) Overall, what is the development sequence for the number and the chain growth rate of students enrolled in Chinese universities? How does one make reasonable predictions about the future development direction based on this sequence? (2) In terms of different regions, what are the differences in the development sequence for the number and the chain growth rate of students enrolled in Chinese universities in various provinces of China? Is this difference related to the geographical location of the provinces? (3) What is the development sequence of the admission ratio of undergraduates and junior colleges in China generally and in each province? How do we predict the development direction of the future enrollment ratio? In the following, we will attempt to answer the above research questions by using empirical methods.
3. Materials and Methods
3.1. Data Sources
The original data for this paper come from the education section in the China Statistical Yearbook published by the National Bureau of Statistics in China [
52]. The range of data collected is the relevant education data from 2010 to 2020 published in the China Statistical Yearbook from 2011 to 2021. Statistical data include the following: first, the total number of students, the number of undergraduate students, and the number of college students enrolled in the entire country and each province; second, the proportion of undergraduate enrollment calculated based on the number of undergraduate enrollments and the total number of undergraduates in the entire country and provinces each year. Third, the chain growth rate calculated based on the above-mentioned various enrollment numbers and ratios. Fourth, other statistics obtained by the region for the above data, such as mean, standard deviation, normalized regression coefficient, and so on.
In addition, to verify the validity of the regression model and the accuracy of the prediction, the data in the 2021 National Statistic Gazette of the Educational Development were collected here as the verification standard of the model [
53]. Since the document only gives an approximate value of the data, the method we adopted was to observe whether the value falls within the prediction interval of the 95% confidence level predicted by the model built on the relevant data in 2021.
3.2. Research Methods
The method used in this paper is a quantitative research method based on statistical models. The statistical models used mainly include polynomial regression, one-way ANOVA, and Holt’s exponential smoothing prediction.
Polynomial regression describes the relationship between independent variable
x and dependent variable
y as a polynomial relationship of
N-order. As far as the constructed fitting curve is concerned, when
, there is a linear relationship between the fitting value of
y and independent variable
x, and when
, there is a nonlinear relationship between them. However, essentially, even though polynomial regression fits a nonlinear model to the data, it is a linear statistical estimation problem because the regression function
E(
y|
x) is linear in the unknown parameters inferred from the data [
54]. A generic form of the
nth order polynomial regression equation with a single independent variable can be given as follows.
In Equation (1), is the expected response variable, and x is the independent variable. In polynomial regression, there is still a coefficient of determination, , reflecting that the proportion of the variation in the response variable is concentrated around its mean. Therefore, the higher the , the better the regression model matches the data. In the following, time will be used as an independent variable, and the polynomial regression method will be used to fit the development of the number of college students.
One-way ANOVA is used to describe a statistical method for determining whether the means of two or more groups differ, using categorical data as the independent variable and numerical data as the dependent variable [
55,
56]. Since this method is relatively common in statistics, it will not be repeated here.
Holt’s exponential smoothing prediction is one of the exponential smoothing methods, which is a weighted average of past values from an observed process that assigns a decreasing weight to past values [
57]. Holt’s exponential smoothing prediction comes from single exponential smoothing with only one smoothing coefficient, and it uses the linear combination of the predicted value and the observed value for a period as the predicted value of the
t + 1 period.
In Equation (2),
is the actual observation value of period
t,
is the predicted value of period
t,
α is the smoothing coefficient (0 <
α < 1), and 1 −
α is the damping coefficient. However, since single exponential smoothing did not include the trend factor, Holt’ corrected it and considered the smoothing value and the trend item at the same time [
58]. The calculation of the smoothed value of Holt’s exponential smoothing model includes both the actual value and the synthesis of the last predicted value and trend, as shown in Equation (3).
In Equation (3),
St is the exponential smoothing value,
Yt is the actual observed value, and
Tt is the trend value. The trend value can be updated by the method shown in Equation (4).
Equation (4) considers the previous trend value and the difference between two exponential smoothing values before and after at the same time, and it adjusts the weight between them with coefficient
. According to the above two equations, the predicted value of
k periods in the future can be determined, as shown in Equation (5).
According to the above two equations, the predicted value of the future k period can be determined, as shown in Equation (5). That is, the predicted value of the future k period is the sum of the smoothed value and the product of several trend values. In this manner, Holt’s exponential smoothing model successfully completes the integration of the exponential smoothing value and trend, and it can be used to predict trend series.
3.3. Research Process
The research process is mainly divided into four steps: data collation, data representation, model building and prediction, and result analysis.
The first step is data collation. The obtained data for the number of enrollments, number of undergraduates, and number of specialists are sorted in chronological order according to the “national” and “provincial” range, and the “undergraduate ratio” is obtained via calculations to form new data. The chain growth rate of the enrollment number and the proportion of undergraduates are solved, respectively, and the corresponding chain growth rate data is obtained. The provinces involved in all the above data are marked according to their locations, and the marking basis is the National Statistic Gazette of the Educational Development [
53] in 2021.
The second step is data representation. For the various data obtained in the first step, a time series development sequence diagram is drawn to show the changes that occurred during the time series.
The third step is model building and prediction. The main two predictive models used here are polynomial regression and Holt’s exponential smoothing prediction model. Among them, polynomial regression is a relatively traditional and mechanical prediction model. It fits a polynomial equation with an independent variable which is based on the time of all data currently available, and substituting time into the equation can predict the future number of college enrollment and its chain growth rate. Because polynomial regression treats all existing data as equally important, its accuracy is limited. Therefore, it is only regarded as a preliminary prediction model in this paper. In the development trend of each province, it is necessary to use this method to obtain a regularized regression coefficient with good fitting results to determine the growth rate of each province.
According to the results of the second step of data representation, if the relevant data of Chinese university enrollment does not show obvious seasonal characteristics, Holt’s exponential smoothing prediction model can be used to make more accurate predictions. According to Equations (2) to (5), Holt’s exponential smoothing prediction is an iterative prediction method, and it considers both the real value and the predicted value of the previous year. Therefore, this study starts from the data of 2010 and 2011, and it produces gradual year-by-year iterations according to Equations (2) to (5), predicting and smoothing the predicted value of the next year. One of the outstanding advantages of this model is its dynamic nature. In the absence of new data, the model can make future predictions based on past data. Although it has a high accuracy rate, the prediction interval will become greater, and the amount of information will decrease. However, if new data are obtained, the model can guarantee a high accuracy rate and a large amount of information at the same time. This adaptive dynamic method will ensure that users can selectively obtain feasible prediction intervals or optimal prediction intervals according to the situation. In this research, the data from 2010 and 2011 are continuously iterated until 2020. In this manner, the latest and clearly released actual data for 2021 can be used to verify the accuracy of the prediction interval based on the data from 2010 to 2020. If it is necessary to continue to predict the next few years, one method is to iteratively predict directly based on the existing data from 2010 to 2020. In this manner, the development trend of the next ten years can be obtained, and the feasible prediction interval can be specified. Another method is to continuously add the latest real data to the model as time goes by so that the optimal prediction interval can be dynamically obtained. According to this method, decision makers can predict in advance the possible development trend of future enrollments in Chinese universities. When the state in the prediction interval is abnormal or unfavorable toward sustainable development, decision makers can actively take measures to intervene or avoid adverse consequences or risks.
The fourth step is the result analysis. After the data representation in the second step and the model establishment and prediction in the third step, the results can be further analyzed to explore the differences in the development of enrollment in different regions and geographical locations in China. In this study, the region is used as the independent variable, and the normalized regression coefficient, the chain growth rate of the enrollment, and the fluctuation of the chain growth rate are regarded as the dependent variables; moreover, one-way ANOVA is performed to obtain the degree of influence of the region or geographical location on each dependent variable. Furthermore, the analysis results can be used to determine the differences and patterns in the development of enrollment in different regions of China.
4. Experiments and Results
This part mainly conducts experiments and reports results on the two types of data: the number of Chinese university enrollment and the proportion of undergraduates in the enrollment. Each section includes an analysis of raw data and growth rates. Using various quantitative methods, we can understand the development of the number and type of enrollment in Chinese universities, and based on this, we can provide predictions for further sustainable development in future. In addition, it can examine the influence of different regions in China on the number of enrollments and then clarify the relationship between geographical location and enrollment in colleges and universities.
4.1. Regression Prediction and the Effect of Region on Enrollment
This section first takes China as a whole, and it conducts a time series analysis and prediction of the data on the total number of university enrollments. Then, data analyses were conducted on the number of college students enrolled in various provinces in China. We establish a linear regression equation for each province’s enrollment data to examine its development trend, and we use an analysis of variance (ANOVA) to explore the role of the region on the normalized regression coefficient of the enrollment number in Chinese colleges and universities.
4.1.1. Multinomial Regression Model and Prediction of the Total Number of Enrolled Students in Chinese Universities
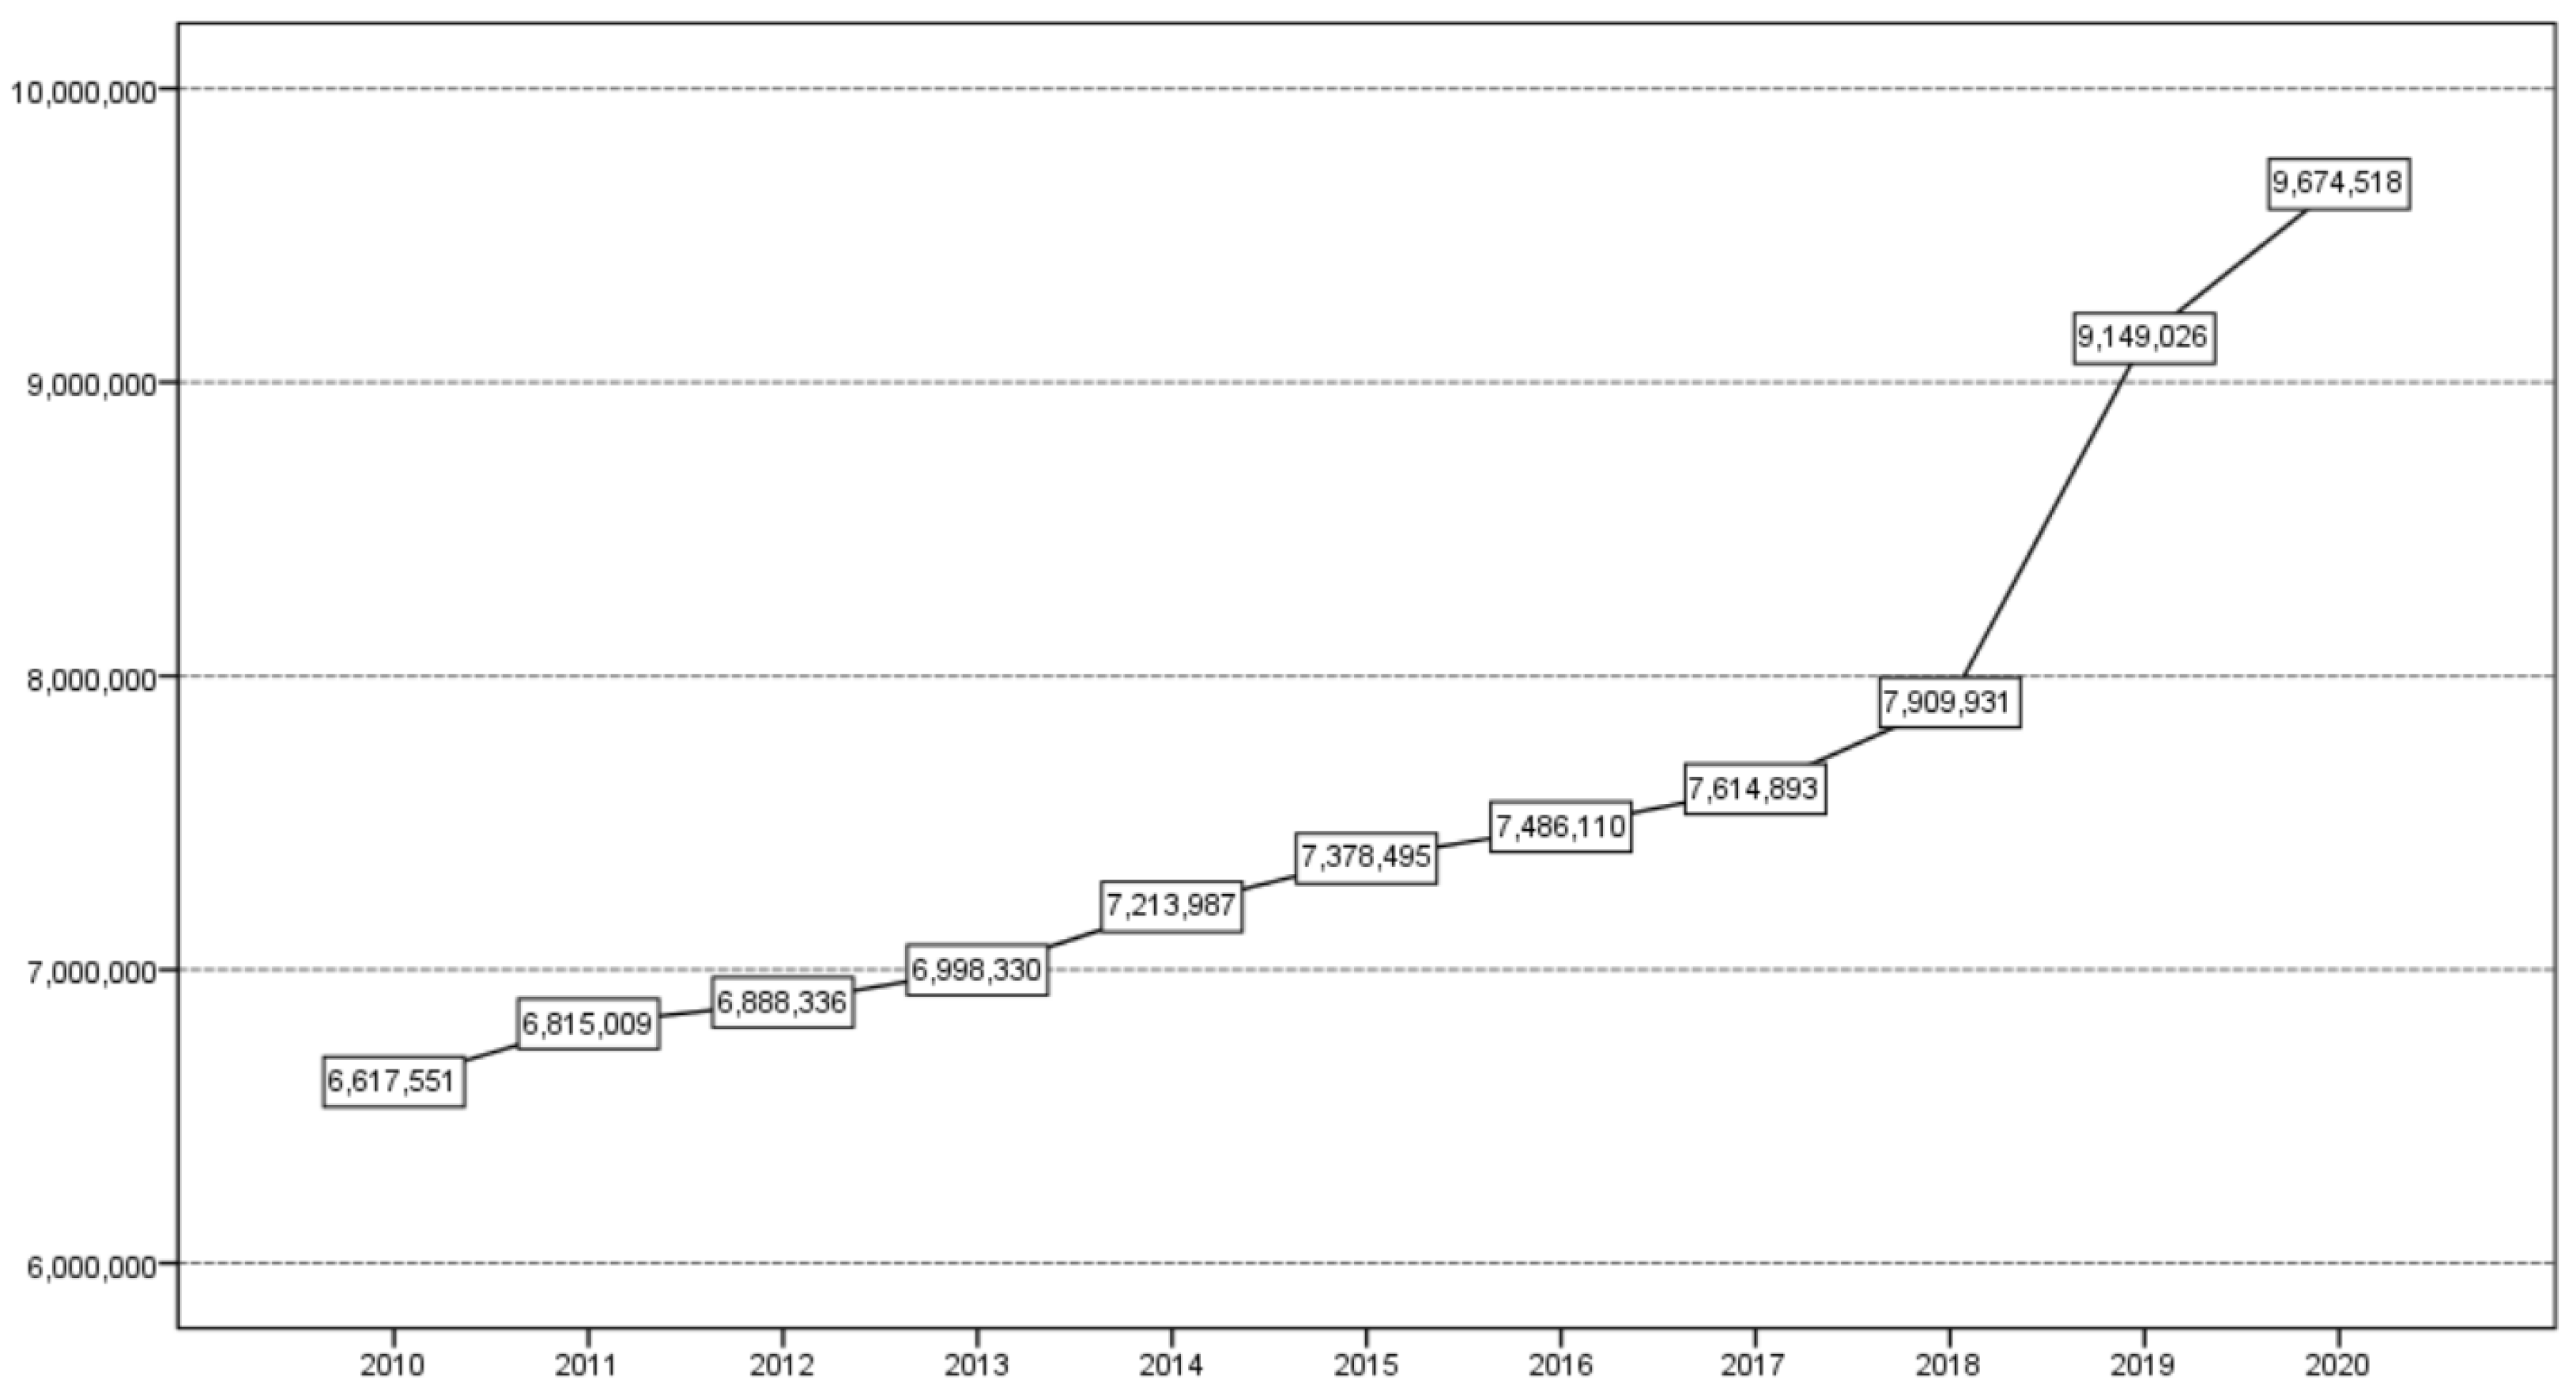
From 2010 to 2020, the number of students enrolled in Chinese colleges and universities has been on the rise, and the specific development sequence is shown in
Figure 1.
From
Figure 1, it can be clearly found that the number of students enrolled in Chinese universities is on the rise. After establishing a polynomial regression model for it, it can be found that linear, quadratic, and cubic regression can fit the data well, and all significances are
. The coefficients of determination
of the three are increasing in turn, namely
,
, and
. Since the fitting effect of the cubic equation is the best, the cubic equation is used here to construct a regression model for the development of enrollment in Chinese universities, as shown in Equation (6).
The data can be preliminarily predicted by Equation (6), but it can be seen from
Figure 1 that the number of college students in China changed significantly since 2018. Therefore, there must be many problems in prediction only by the method of cubic polynomial regression. In addition, although Equation (6) has strong fitting abilities, it has the risk of overfitting. Since the seasonality of the curve is not obvious, Holt’s exponential smoothing prediction model can be used for prediction, and the prediction results are shown in
Figure 2.
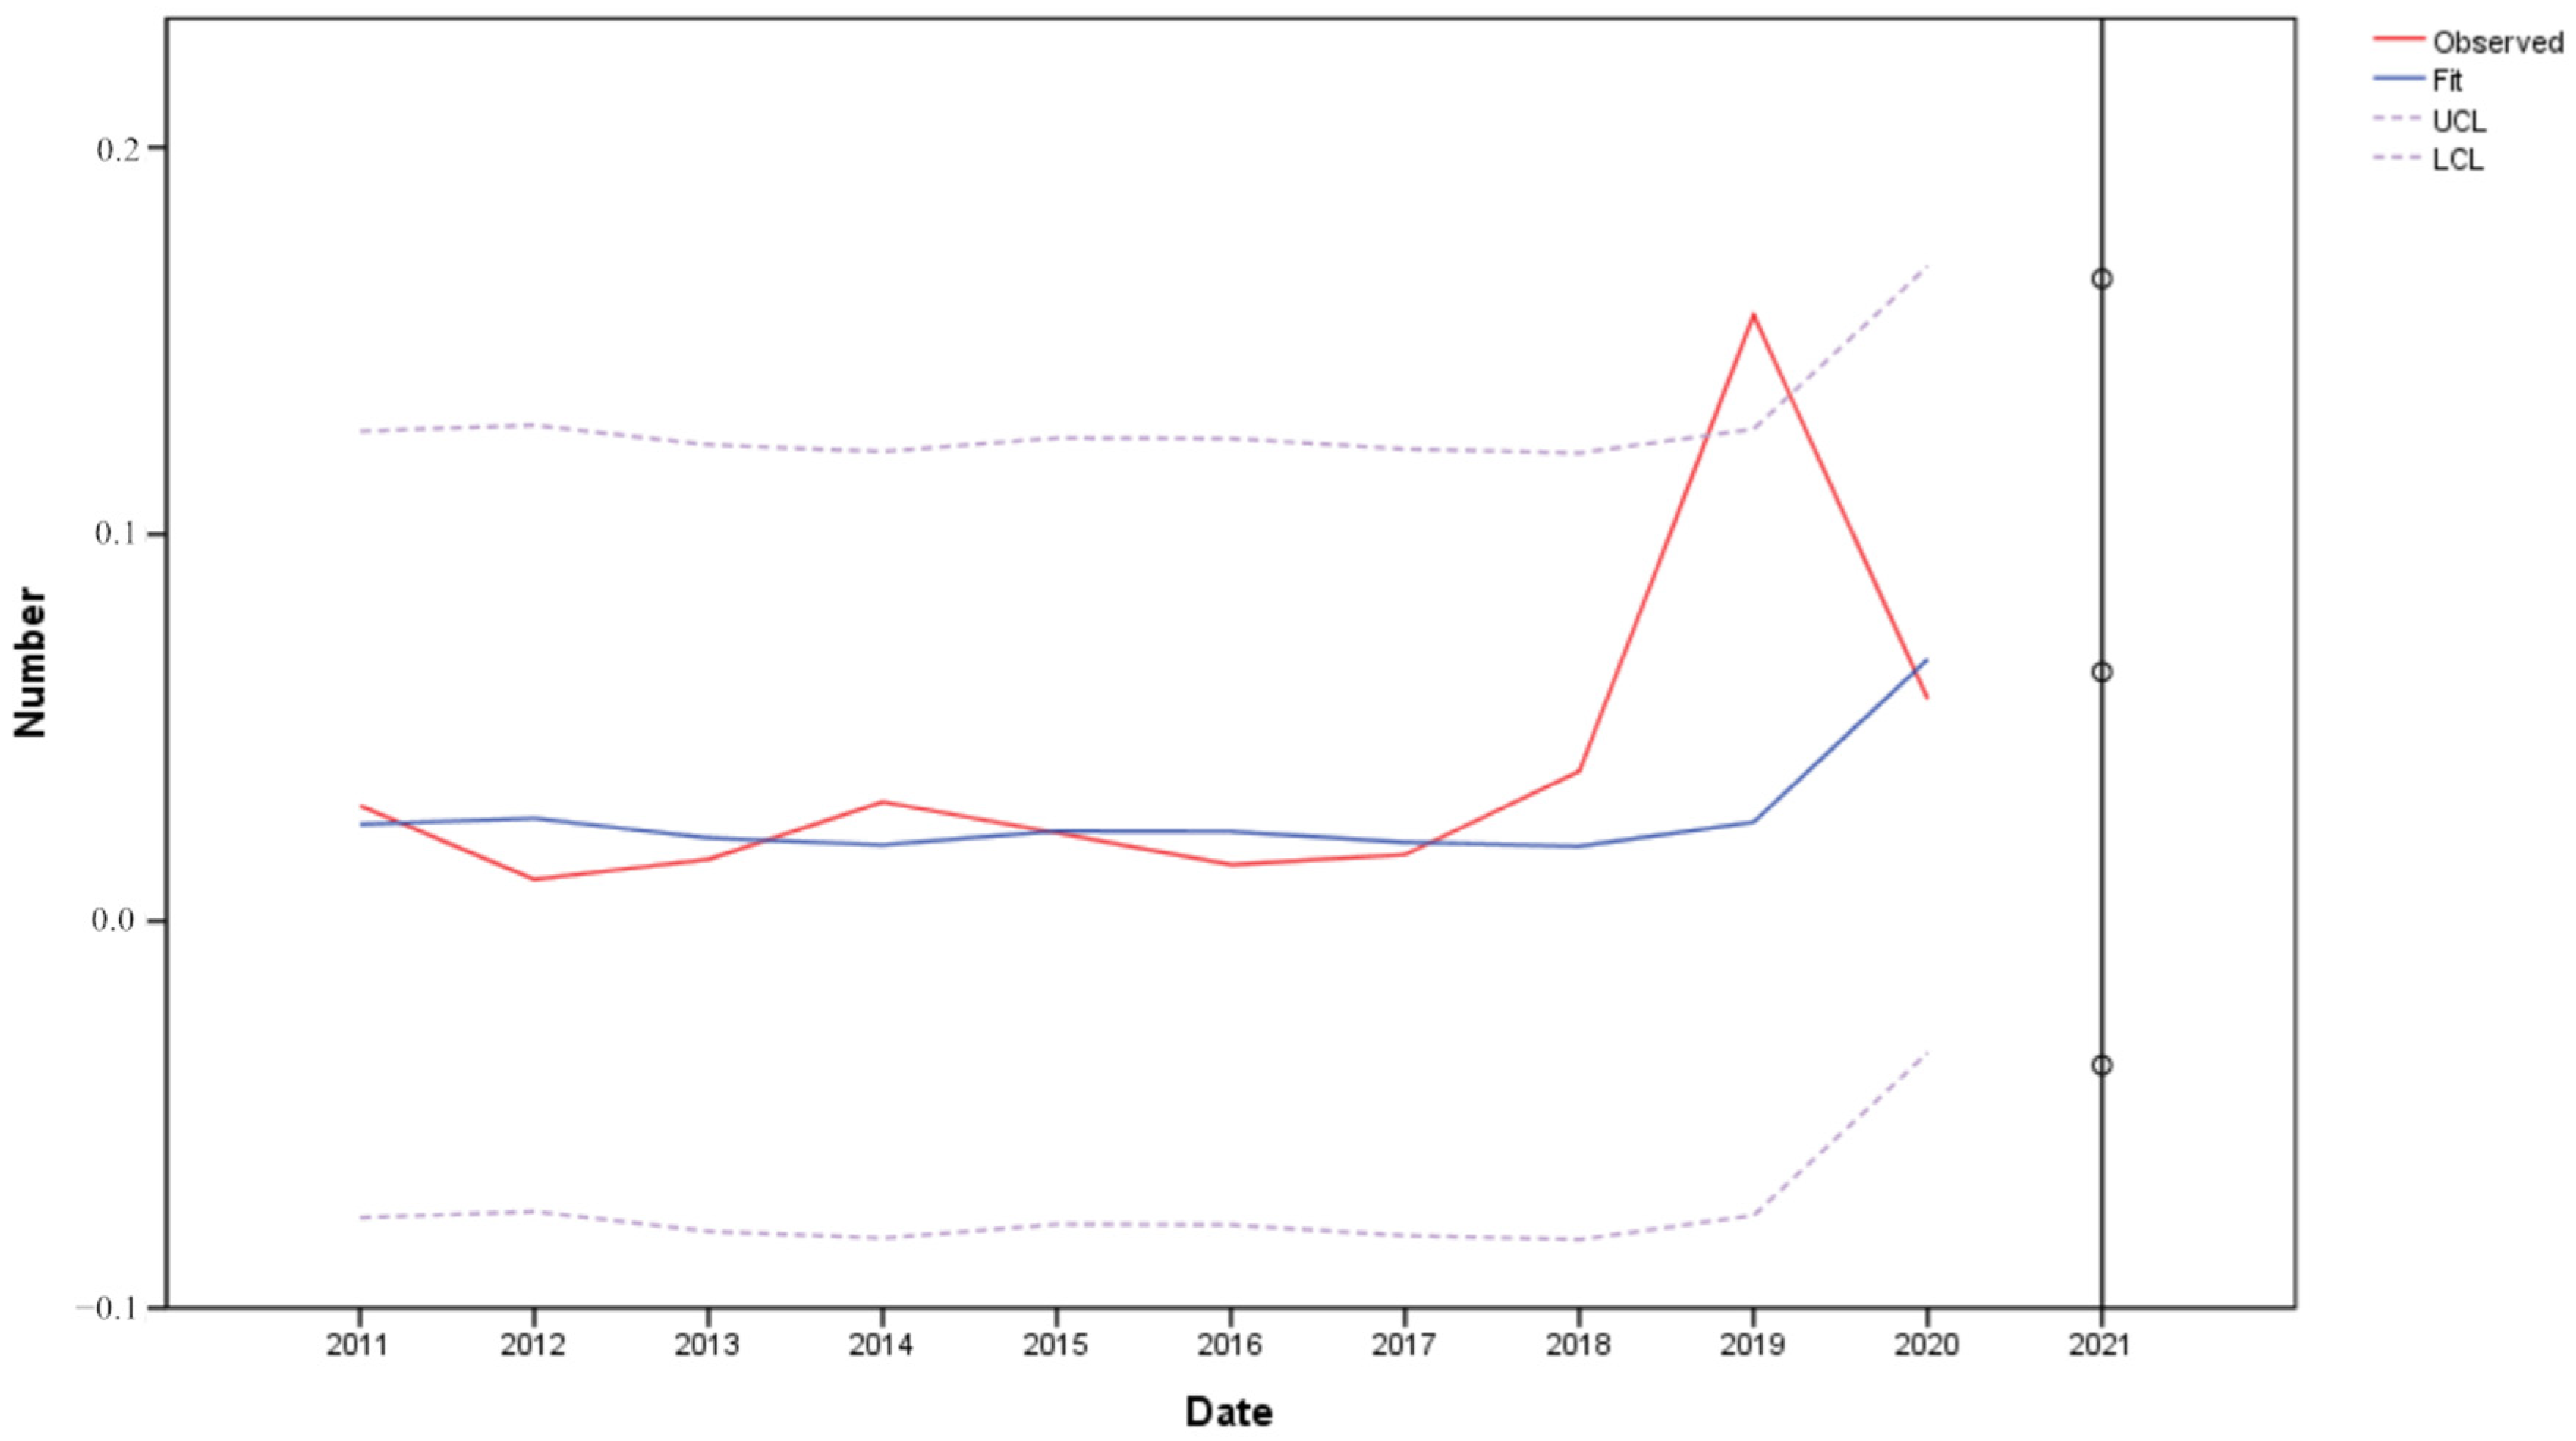
In
Figure 2, the red line represents the actual enrollment number, and the blue line is the fitting curve obtained using Holt’s exponential smoothing prediction model. The two dashed lines mark the range of the prediction interval with a 95% confidence level, and the 3 white circles are prediction in 2021 According to model fit statistics, the coefficient of determination of the exponential smoothing prediction is
, and the smooth curve fits the original data well. From this model, the prediction interval of the 95% confidence level of the number of Chinese university enrollment in 2021 is [9,449,768, 11,058,527]. According to the 2021 National Statistic Gazette of the Educational Development [
53], the number of undergraduates enrolled in Chinese colleges and universities is about 10.0132 million, which falls within the prediction interval of the model for 2021, which can verify the validity of the model from an objective and practical point of view.
4.1.2. Regression Model of University Enrollment Numbers in China’s Provinces and the Influence of Regions on Its Development
Next, a linear regression model is established for the enrollment numbers of colleges and universities in various provinces in China, and its sustainable development law is explored. Overall, the number of students enrolled in most provinces in China reflected an upward trend in recent years, and a few provinces have remained flat or declined.
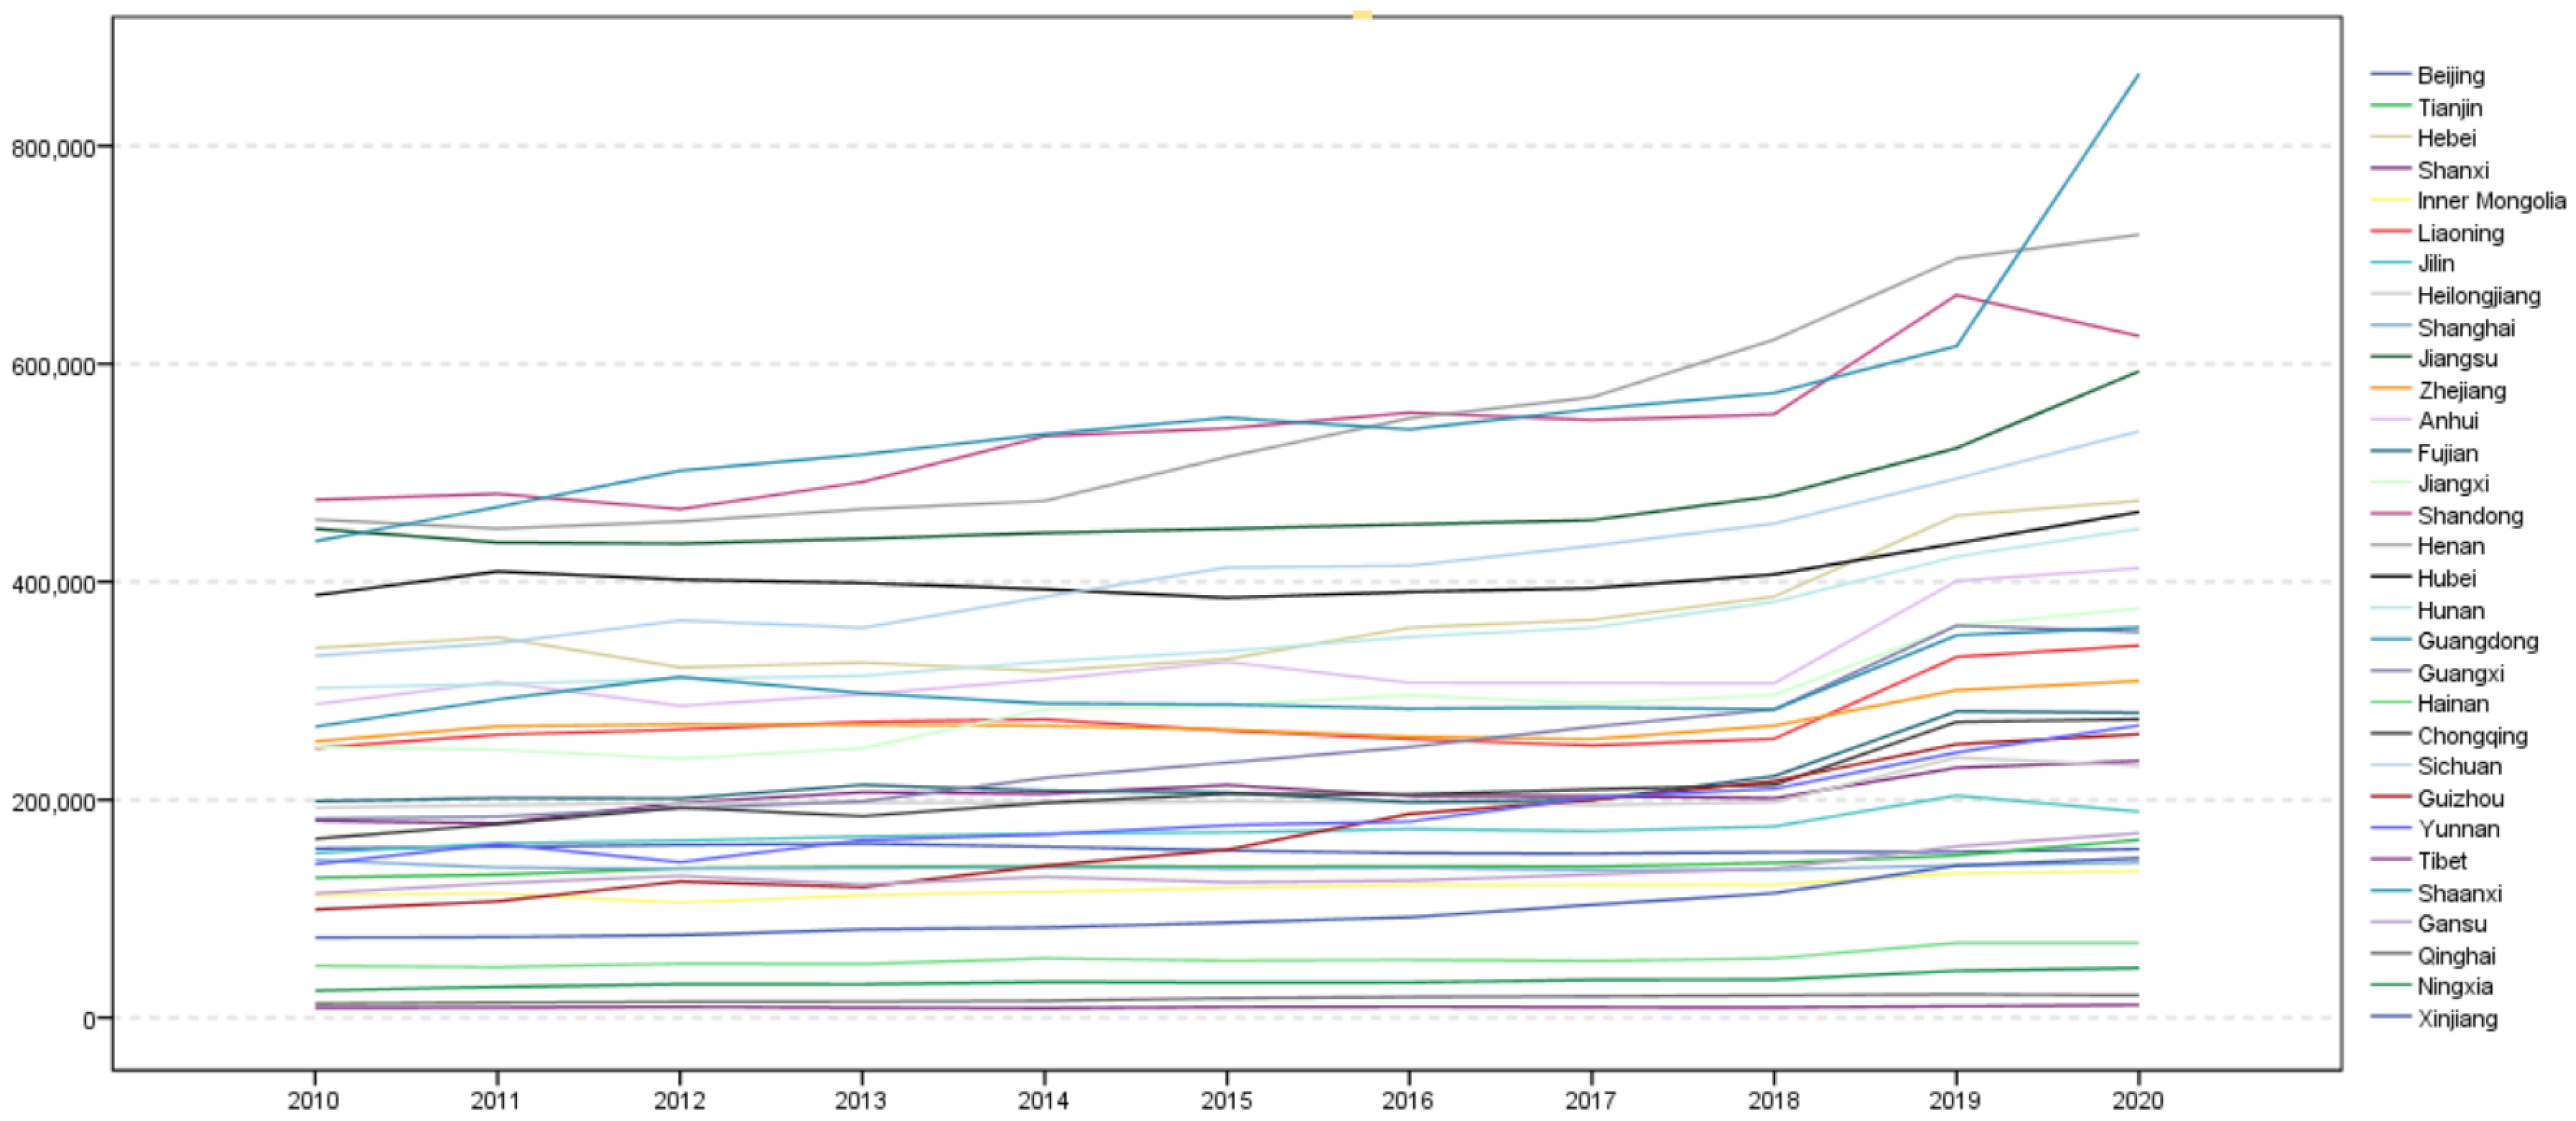
Figure 3 shows the number of students enrolled in each province.
From
Figure 3, the number of students enrolled in Guangdong, Henan, Shandong, Jiangsu, and other provinces has been at a high level, and the mean enrollments from 2010 to 2020 are 560,435.8, 543,074.9, 539,517.5, and 468,794.7, respectively. On the contrary, Tibet, Qinghai, Ningxia, and Hainan have very few students, and the mean enrollments are 9824.6, 17,361.1, 33,678.5, and 54,276.9, respectively. The statistical results shown in
Table 1 can be obtained by performing linear regression on the data of each province.
Table 1 presents the experimental results of the linear regression for the number of students enrolled in each province in China. First, according to the results of the significance test, it can be found that the enrollment situation of Shanghai (
) and Shaanxi (
) cannot be well fitted by the linear equation. Therefore, these two provinces need to be analyzed separately and will not be included in the queue of the linear regression equation. The values of regression coefficient
are provided for other provinces and cities. However, due to differences in the population of various provinces and cities, the base for the number of enrolled students itself is different. Therefore, to compare the growth rate of enrollment in various provinces and cities in recent years,
can be normalized to obtain the “normalized regression coefficient” (marked as “Norm.” in the table). The normalized regression coefficient is calculated by Equation (7).
The “Mean” in Equation (7) represents the average number of students enrolled in each province from 2010 to 2020, multiplied by 100 to scale it to the range of for easy observation. According to the normalized regression coefficient, it can be found that Guizhou, Xinjiang, Guangxi, and other places have the largest increase, while the coefficient in Beijing is negative, i.e., the enrollment number is declining.
Table 1 provides information on the increase in the number of enrollments in each province in China; to examine whether this increase is related to the region, one-way ANOVA can be used to investigate whether the region is an influencing factor of a normalized regression coefficient. The results of ANOVA show that region has a significant impact on the normalized regression coefficient (
). To examine the specific impact of regions on the normalized regression coefficients, a sorted bar chart can be drawn with regions as the horizontal axis and the mean of the normalized regression coefficients in each region as the vertical axis, as shown in
Figure 4.
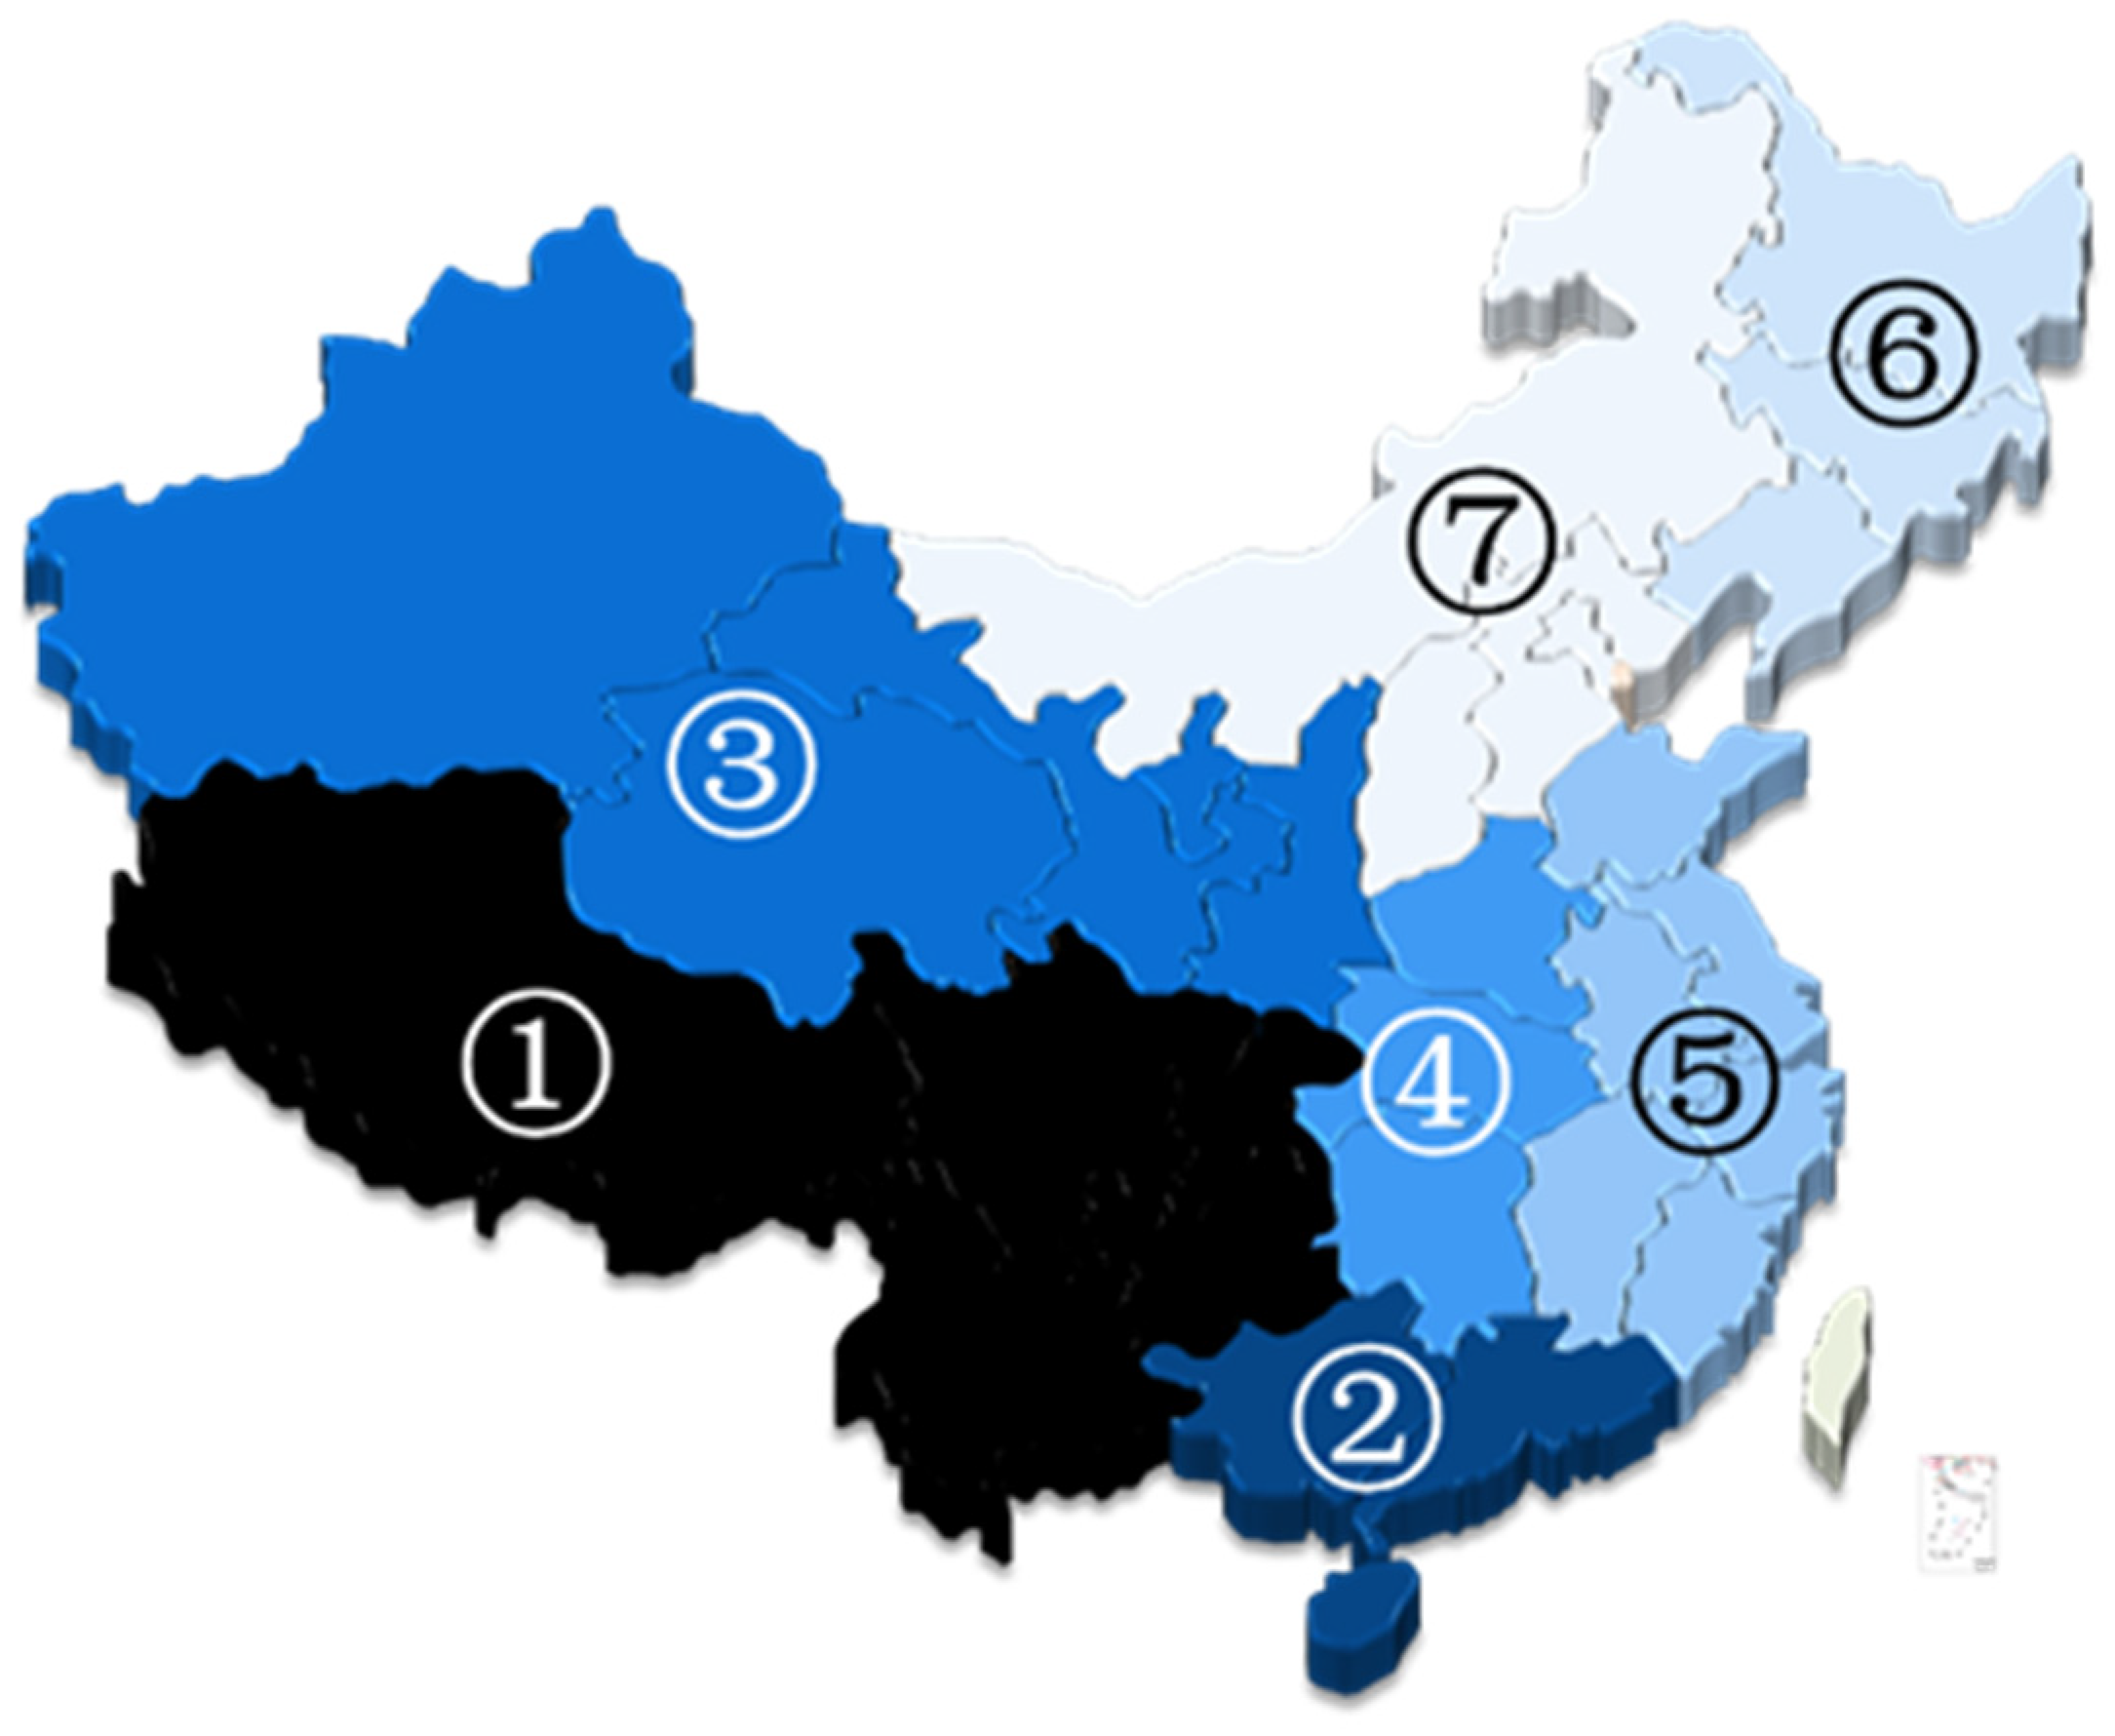
Figure 4 sorts the mean values of the normalized regression coefficients from large to small, and the locations of the regions are southwest, south, northwest, central, east, northeast, and north. The size relationship of the normalized regression coefficients is shown on the map, and the result shown in
Figure 5 can be obtained.
Figure 5 shows the relationship between the size of the normalized regression coefficients in each region with shades of color. The darker the color, the larger the normalized regression coefficients, and the lighter the color, the smaller the coefficient. Similarly, the size of the number is used here to indicate the size relationship; for example, numbers from ① to ⑦ are used indicate the size from strong to weak. An amazing result is yielded from the map. Thus, regions that lean towards the west and south of China have experienced a greater increase in enrollment in recent years, while regions that lean towards the east and north have observed a smaller increase in enrollment in recent years. This can fully explain the influence of geographical factors on the increase in enrollment, and this law can play an important role in decision making for the sustainable development of higher education in future.
4.2. Prediction and Stability Analysis of the Chain Growth Rate of Enrollment in Chinese Colleges and Universities
After discussing the experiment and results for the number of enrolled students in Chinese universities, we can examine the relevant development laws of the chain growth rate. The chain growth rate is a statistic used to reflect the ratio of data growth in the two years before and after, and its definition is shown in Equation (8).
In Equation (8), represents the data value of the next year, and represents the data value of the previous year. By calculating the chain growth rate , the growth rate of the next year compared with the previous year can be obtained. Analyzing the chain growth rate can further clarify the development law for the number of enrollments, and then provide a reference for the sustainable development of colleges and universities.
4.2.1. The Exponential Smoothing Prediction for the Chain Growth Rate of Enrollment in Chinese Universities
Since the chain growth rate requires data from the previous year, the start and end of the chain growth rate calculated based on the data from 2010 to 2020 are 2011 to 2020, respectively. The development sequence diagram of the chain growth rate is shown in
Figure 6.
According to
Figure 6, the chain growth rate of each year is greater than 0, which indicates that from 2010 to 2020, the number of enrollments in Chinese universities has sustainably developed and is in the increasing stage. Overall, the chain growth rate showed a slight increase periodically, but in 2019, there was a substantial increase. This makes fitting the curve by regression less accurate. However, this does not affect our prediction using Holt’s exponential smoothing prediction model, and the prediction results are shown in
Figure 7.
From
Figure 7, with the exception for the data in 2019, the fitting degree of other data points is better. However, due to the impact of 2019 data points, the forecast interval has become very wide. The 3 white circles in
Figure 7 are prediction in 2021. The predicted value of the chain growth rate in 2021 is 0.0812, and the prediction interval is
. According to the data in 2021 National Statistic Gazette of the Educational Development [
53], the chain growth rate in 2021 is about 0.035; this chain growth rate can also fall into the prediction interval.
4.2.2. The Development and Stability Analysis for the Chain Growth Rate of College Enrollment Numbers in Various Provinces in China
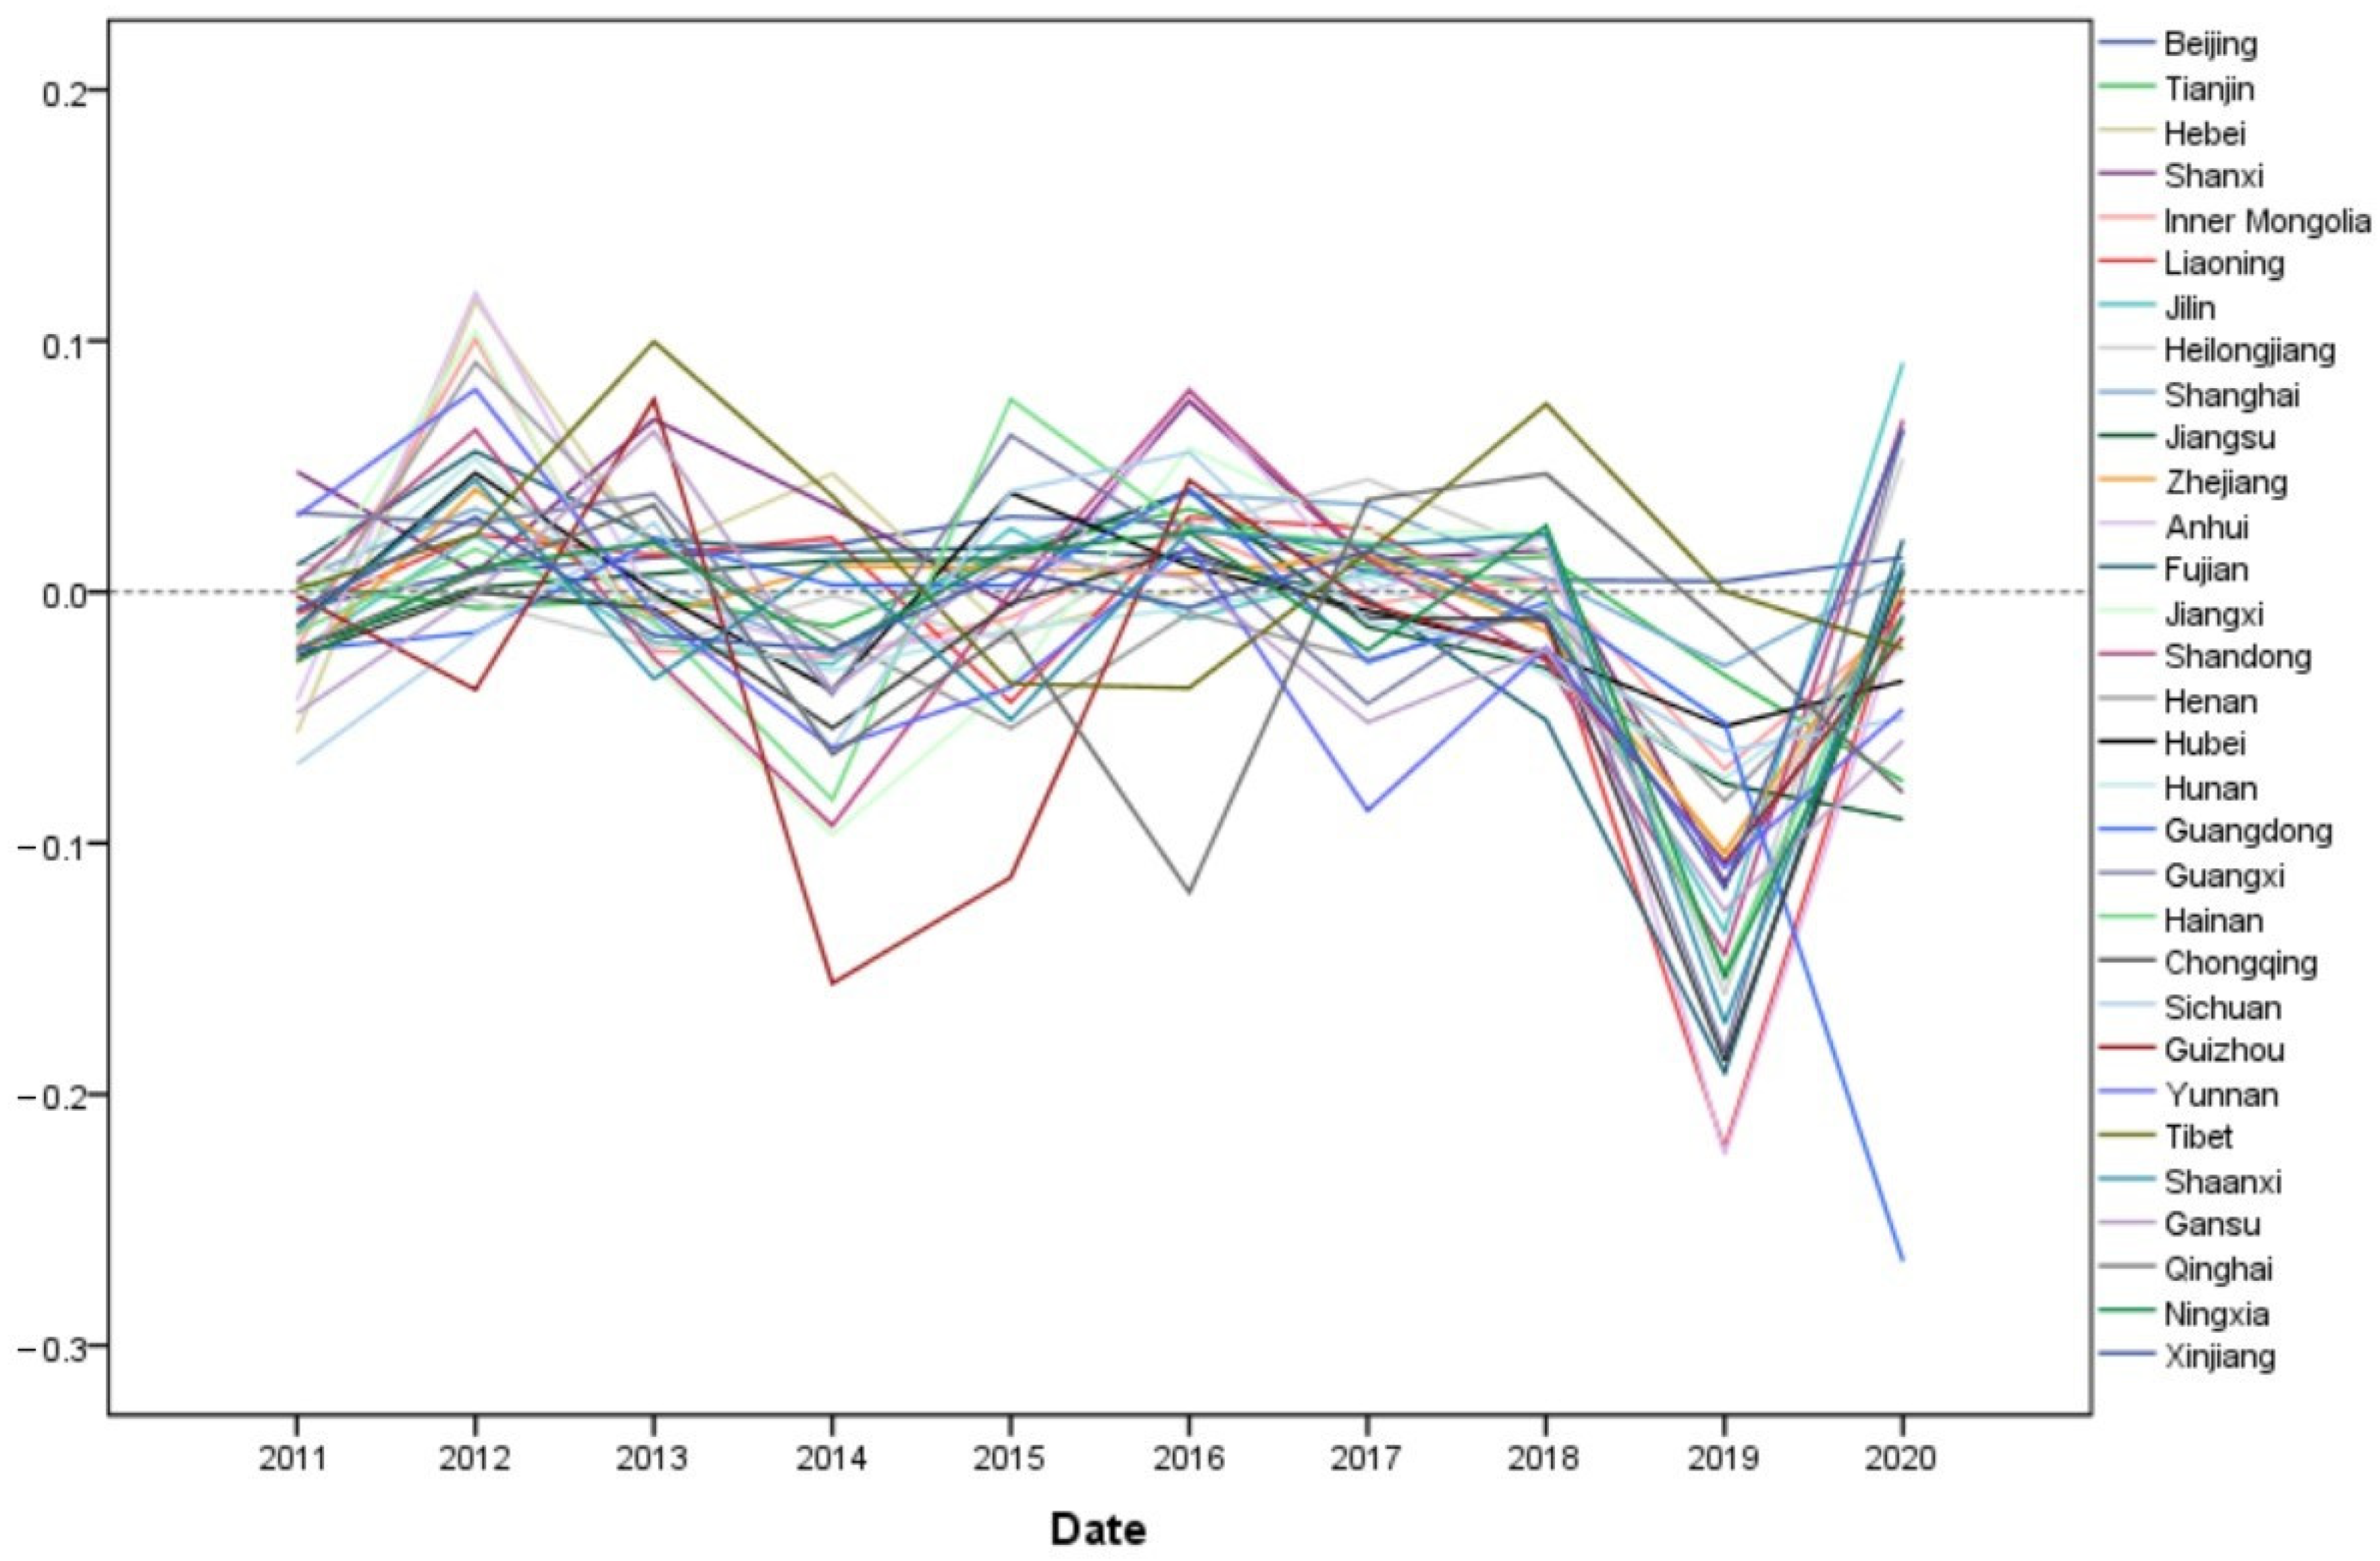
Next, we will introduce the development for the chain growth rate of enrollment in colleges and universities in various provinces in China. Firstly, a sequence diagram for the development sequence of the chain growth rate for college enrollment numbers in various provinces in China is made, as shown in
Figure 8.
In
Figure 8, overall, the area where the line position is higher than 0.0 is higher than the area where the line position is lower than 0.0, which can indicate that the number of enrollments is increasing. The degree of fluctuation of the lines in different provinces is also different. For example, the degree of fluctuation in Guangdong, Anhui, Liaoning, Shandong, and other places is relatively large, while the degree of fluctuation in Beijing and Shanghai is relatively small. This can reflect whether the sustainable development of college enrollment is stable. Notably, most provinces saw a significant increase in 2019 and returned to their original position in 2020. This shows that the enrollment situation in 2019 has a greater increase than other years.
Similarly, to examine whether the chain growth rate is consistent across regions, i.e., whether the region has an impact on the chain growth rate of each region, one-way ANOVA can be used to determine the degree of influence of the region on the chain growth rate. The results show that regions have a significant impact on the chain growth rate (
). To examine the specific impact of regions on the chain growth rate, a sorted bar graph can be drawn with regions as the horizontal axis and the average chain growth rate of each region as the vertical axis, as shown in
Figure 9.
According to
Figure 9, the chain growth rate in each region is greater than 0, so the number of students enrolled in each region increased in recent years. However, there are still obvious differences in the chain growth rate of various regions. According to the order of chain growth rate from large to small, they are south, southwest, northwest, central, east, northeast, and north. The geographical distribution map of the chain growth rate is drawn, and the results are shown in
Figure 10.
In
Figure 10, the color shades represent the size relationship of the chain growth rate in each region. The darker the color, the larger the chain growth rate, and the lighter the color, the smaller the chain growth rate. Similarly, the size of the number here indicates the size relationship, i.e., numbers ranging from ① to ⑦ mean that the size is sorted from strong to weak. According to the figure, the following rule can also be obtained: The chain growth rate of enrollment in the southern and western regions of China is greater than that in the eastern and northern regions. This rule can clarify the speed of enrollment expansion in various places.
To examine the stability and sustainability for the development of various regions, it is necessary to explore the fluctuation degree of the chain growth rate. The standard deviation of the chain growth rate of each province is obtained here, and ANOVA is performed on it, and the region also has a significant impact on the standard deviation of the chain growth rate (
). To examine the specific impact of regions on chain growth rate fluctuations, a sorted bar graph can be drawn with regions as the horizontal axis and the mean of the chain growth rate standard deviation in each region as the vertical axis, as shown in
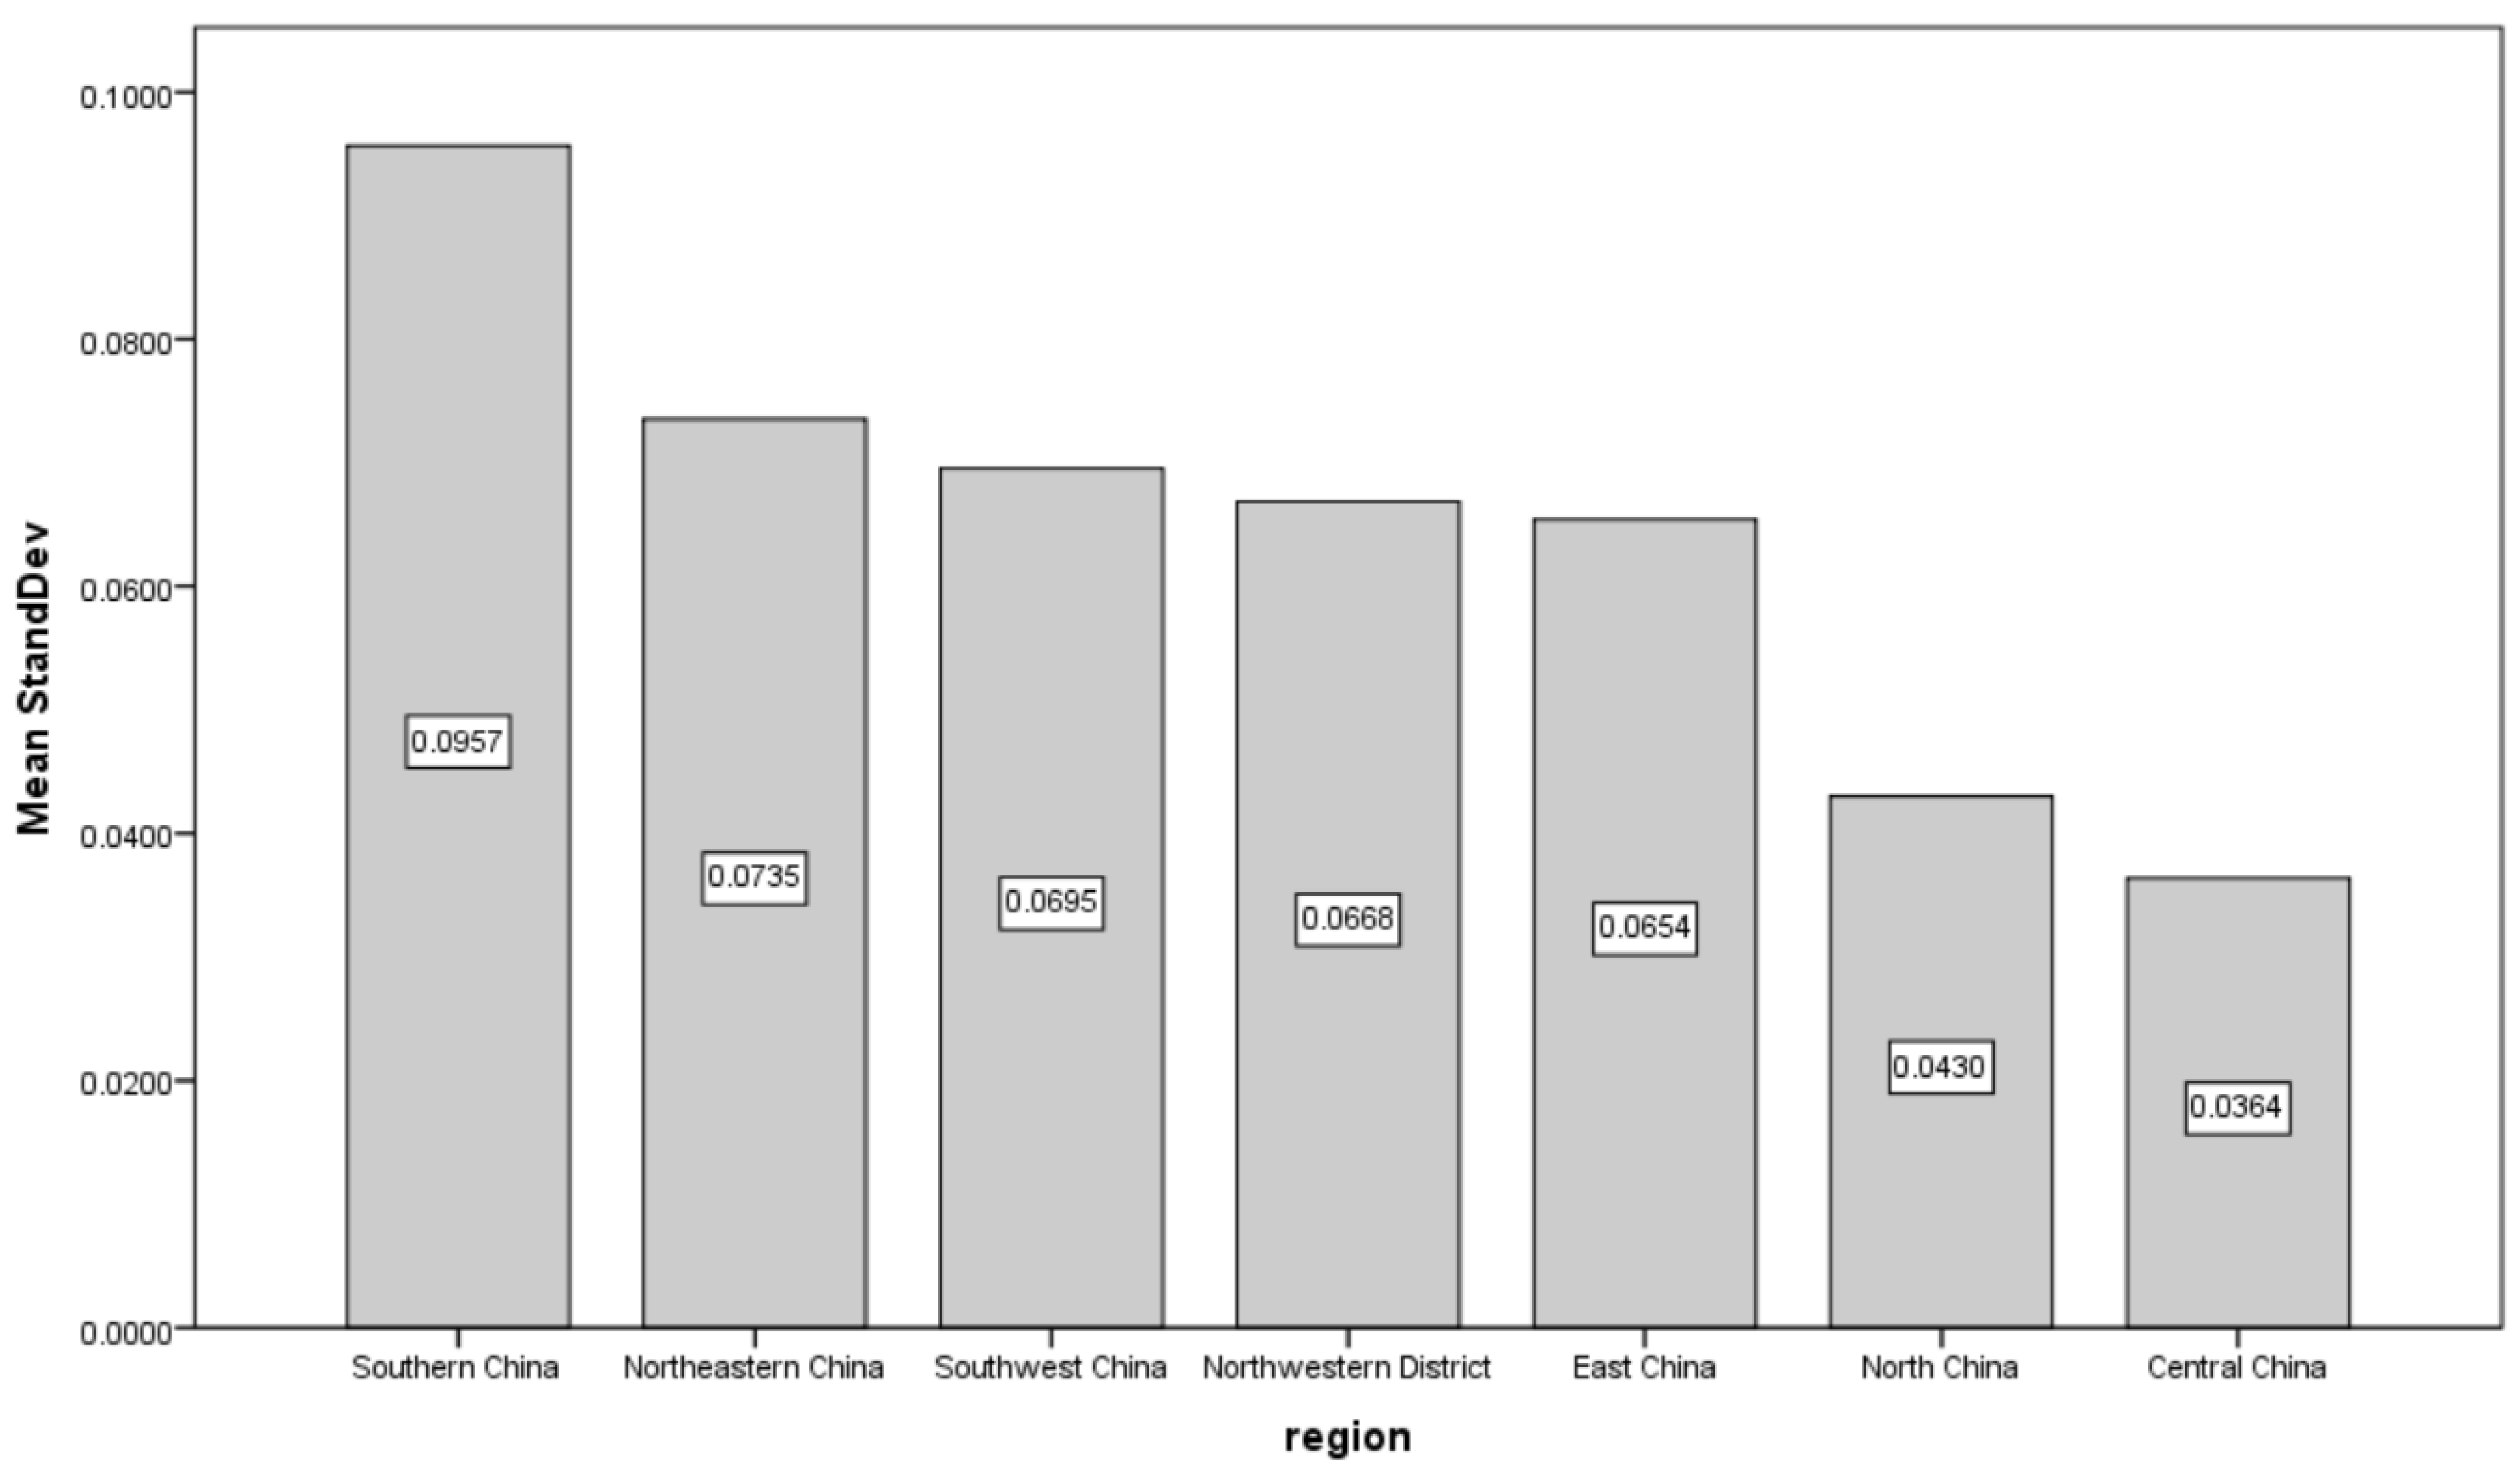
Figure 11.
From
Figure 11, the fluctuations of chain growth rates in various regions of China are also quite different, and the order from large to small is south, northeast, southwest, northwest, east, north, and central.
Figure 12 shows the geographical distribution of chain growth rate fluctuations in various regions of China.
Figure 12 also uses color shades and serial numbers to indicate the magnitude relationship between chain growth rate fluctuations. It can be found that the development of the regions close to the center of China is relatively stable, while the development of the regions close to the periphery is more volatile. Combined with the average value of chain growth rate, there has been a relatively large increase in the south and southwest of China, while the fluctuations in the northeastern region have been relatively large, and the development of other regions has been relatively stable.
4.3. Model, Prediction and Regional Differences of Undergraduate Enrollment Proportion in Chinese Colleges and Universities
Next, the undergraduate admission proportion of Chinese colleges and universities is considered. According to the Higher Education Law of the People’s Republic of China, specialist education should enable students to master the basic theories, specialized knowledge, and have the basic skills and preliminary ability to engage in the practical work necessary for their major. Undergraduate education should enable students to systematically master the basic theories and basic knowledge necessary for the subject and major; master the basic skills, methods, and related knowledge; and have the preliminary ability to engage in practical work and research work in their major [
59]. Therefore, junior colleges pay more attention to the cultivation of specialized knowledge applicable to work skills, while undergraduates pay more attention to the cultivation of basic knowledge applicable to scientific research and academic aspects. In the current China Statistical Yearbook, the enrollment situation of Chinese colleges and universities is counted as specialists and undergraduates [
52]. Therefore, the proportion of undergraduates or specialists can be calculated from it. Since the number of students enrolled in data is the sum of the number of undergraduates and specialists, by only calculating the proportion of undergraduates, the proportion of specialists can be obtained naturally. The calculation for the proportion of undergraduate enrollment is shown in Equation (9).
In Equation (9), “” represents the number of undergraduates enrolled, and “” represents the number of specialists enrolled. “” and “” represent the proportion of undergraduates and specialists in all enrollments, respectively. Accordingly, this paper mainly uses the proportion of undergraduates as the data to study the ratio of undergraduates and specialists in enrollment in China.
4.3.1. The Quadratic Polynomial Regression Sequence Model and Prediction of Undergraduate Enrollment Proportion in Chinese Universities
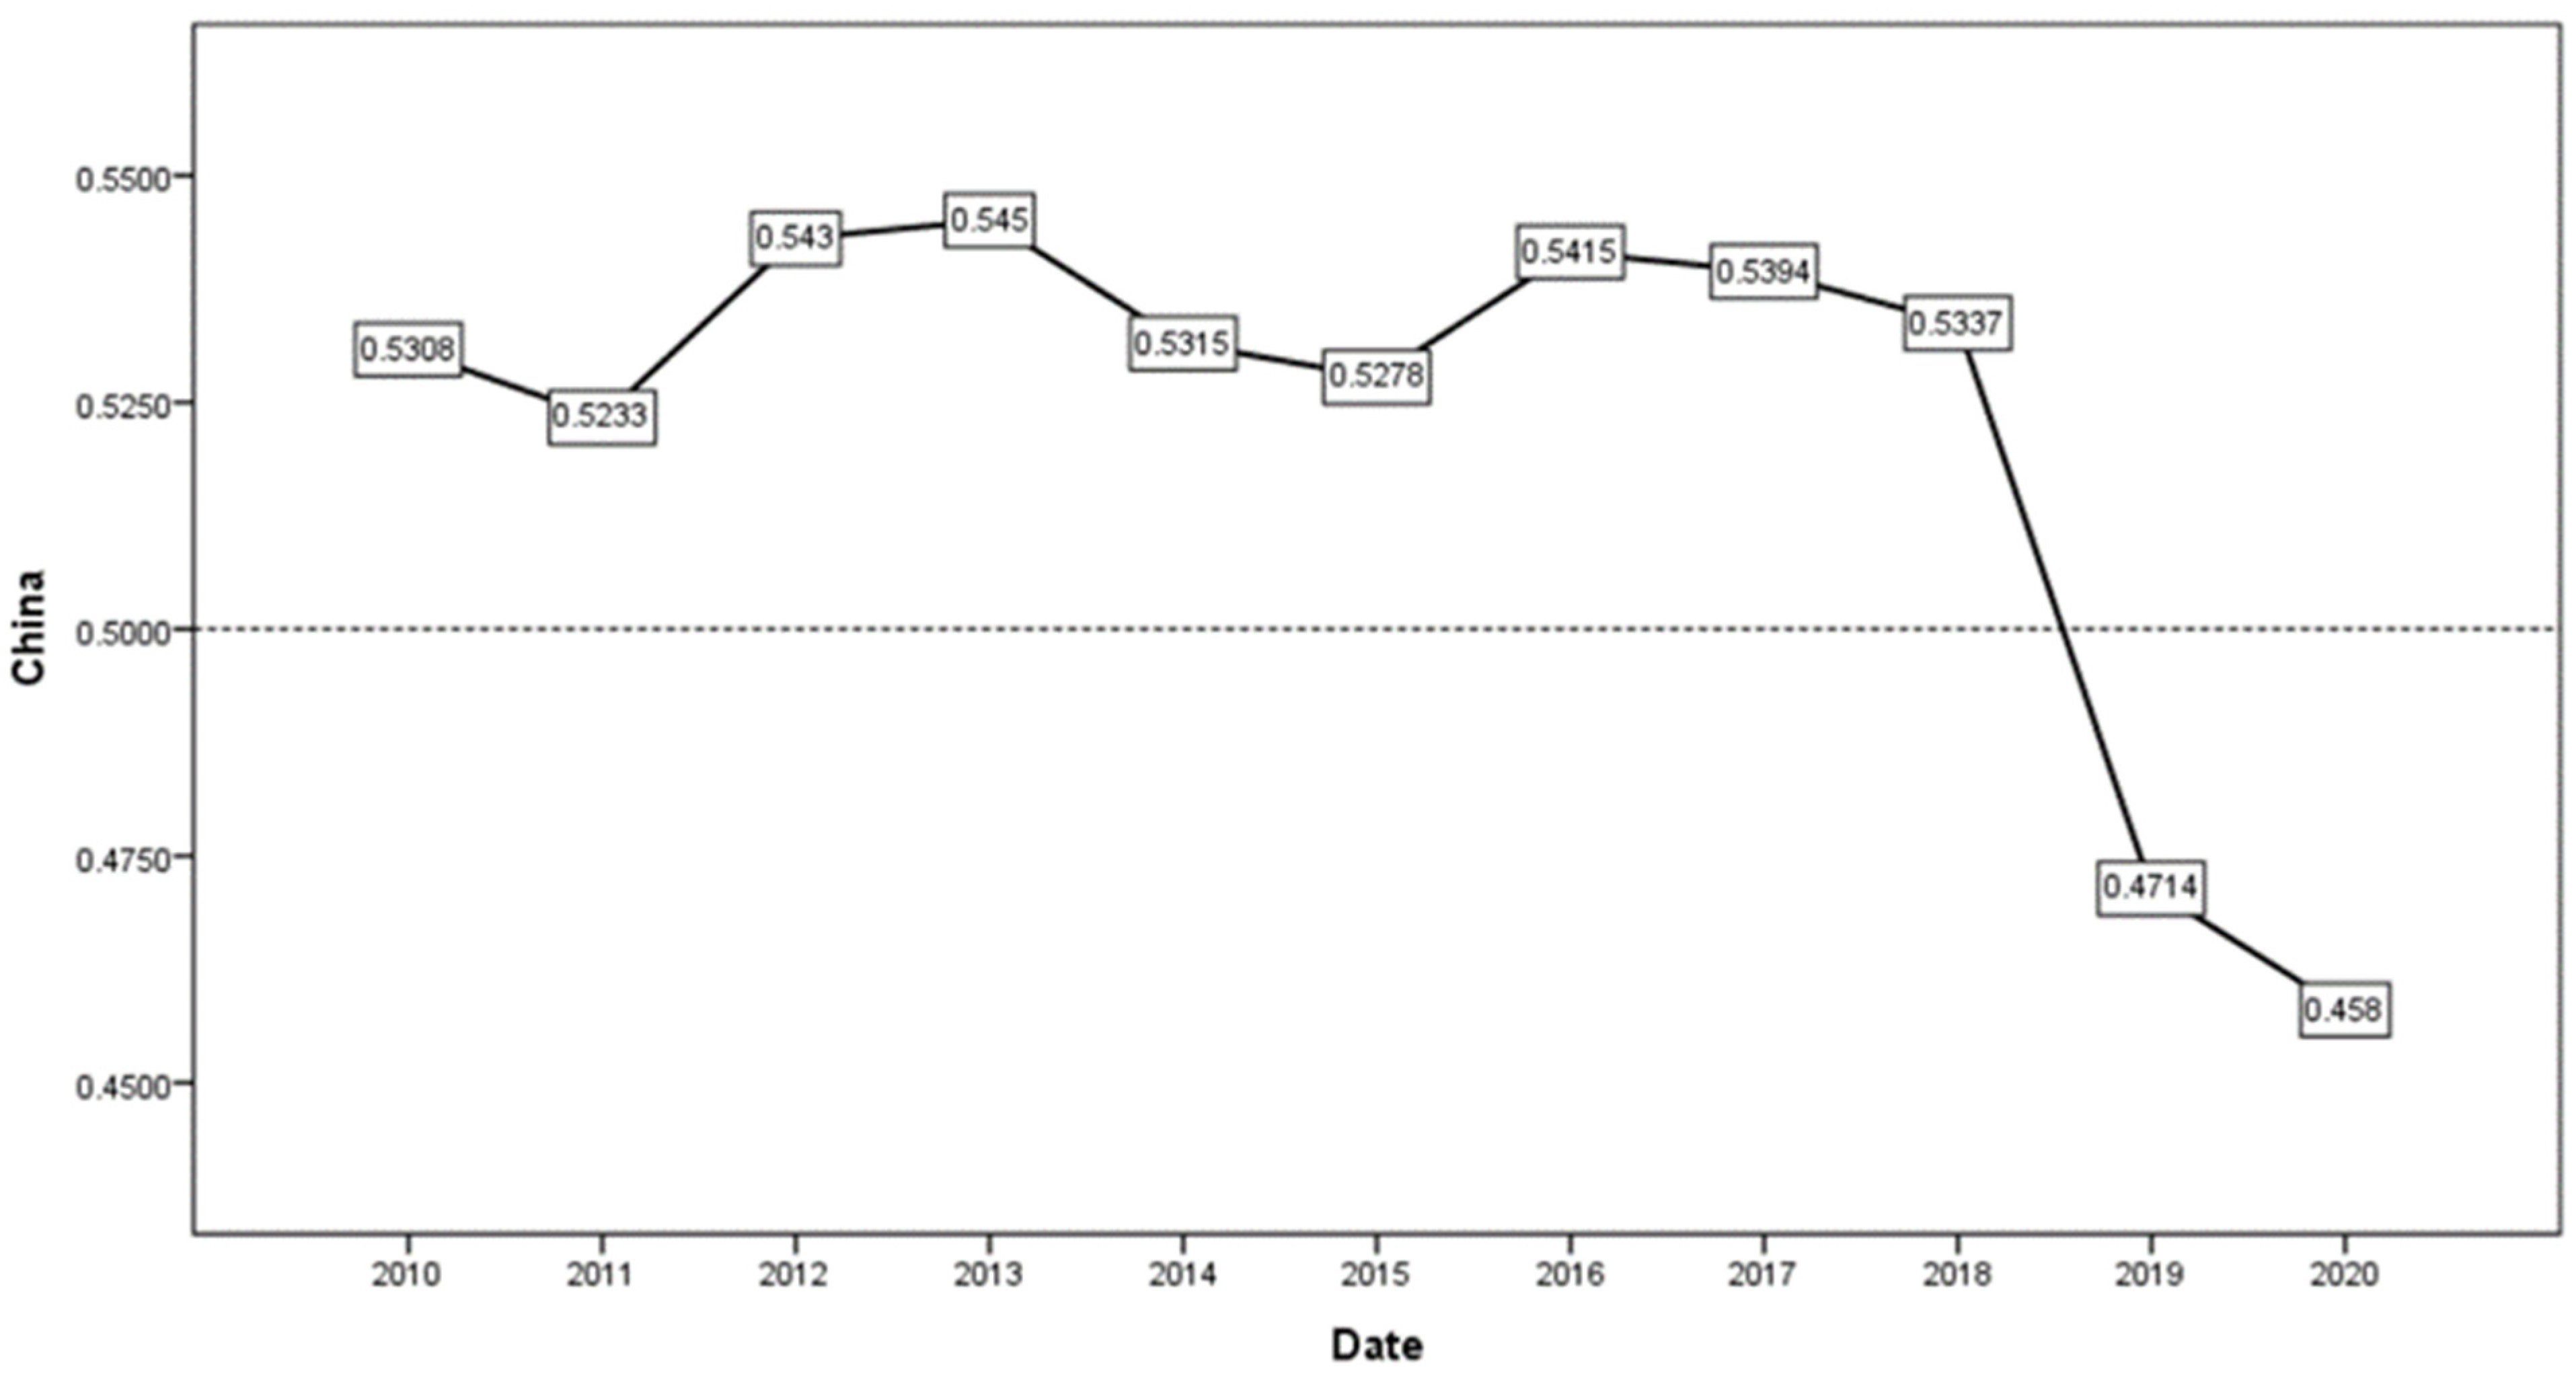
Here, we first study the changes in the proportion of undergraduate enrollment in Chinese colleges and universities over time generally. A time series chart for the proportion of undergraduates enrolled in Chinese universities from 2010 to 2020 is drawn, as shown in
Figure 13.
It can be seen from
Figure 13 that before and in 2018, the number of undergraduate enrollments in Chinese universities was greater than the number of junior college enrollment, i.e., the undergraduate enrollment ratio was greater than 0.5. However, after 2019, the number of undergraduate enrollments in Chinese universities will be smaller than the number of junior college enrollments, which reflects the trend of China’s emphasis on vocational education. The sequence diagram has a relatively obvious trend, and the regression equation can be used to fit this development curve. Establishing a regression model for it, the linear, quadratic, and cubic regression can fit the data well, and their significances are
and
, respectively. As far as the coefficient of determination is concerned, the
of the three increases in turn, i.e.,
. Weighing the significance, the fitting effect of the quadratic equation is the best. Here, a quadratic equation is used to construct a regression model for the development of undergraduate enrollment proportion in Chinese universities, as shown in Equation (10).
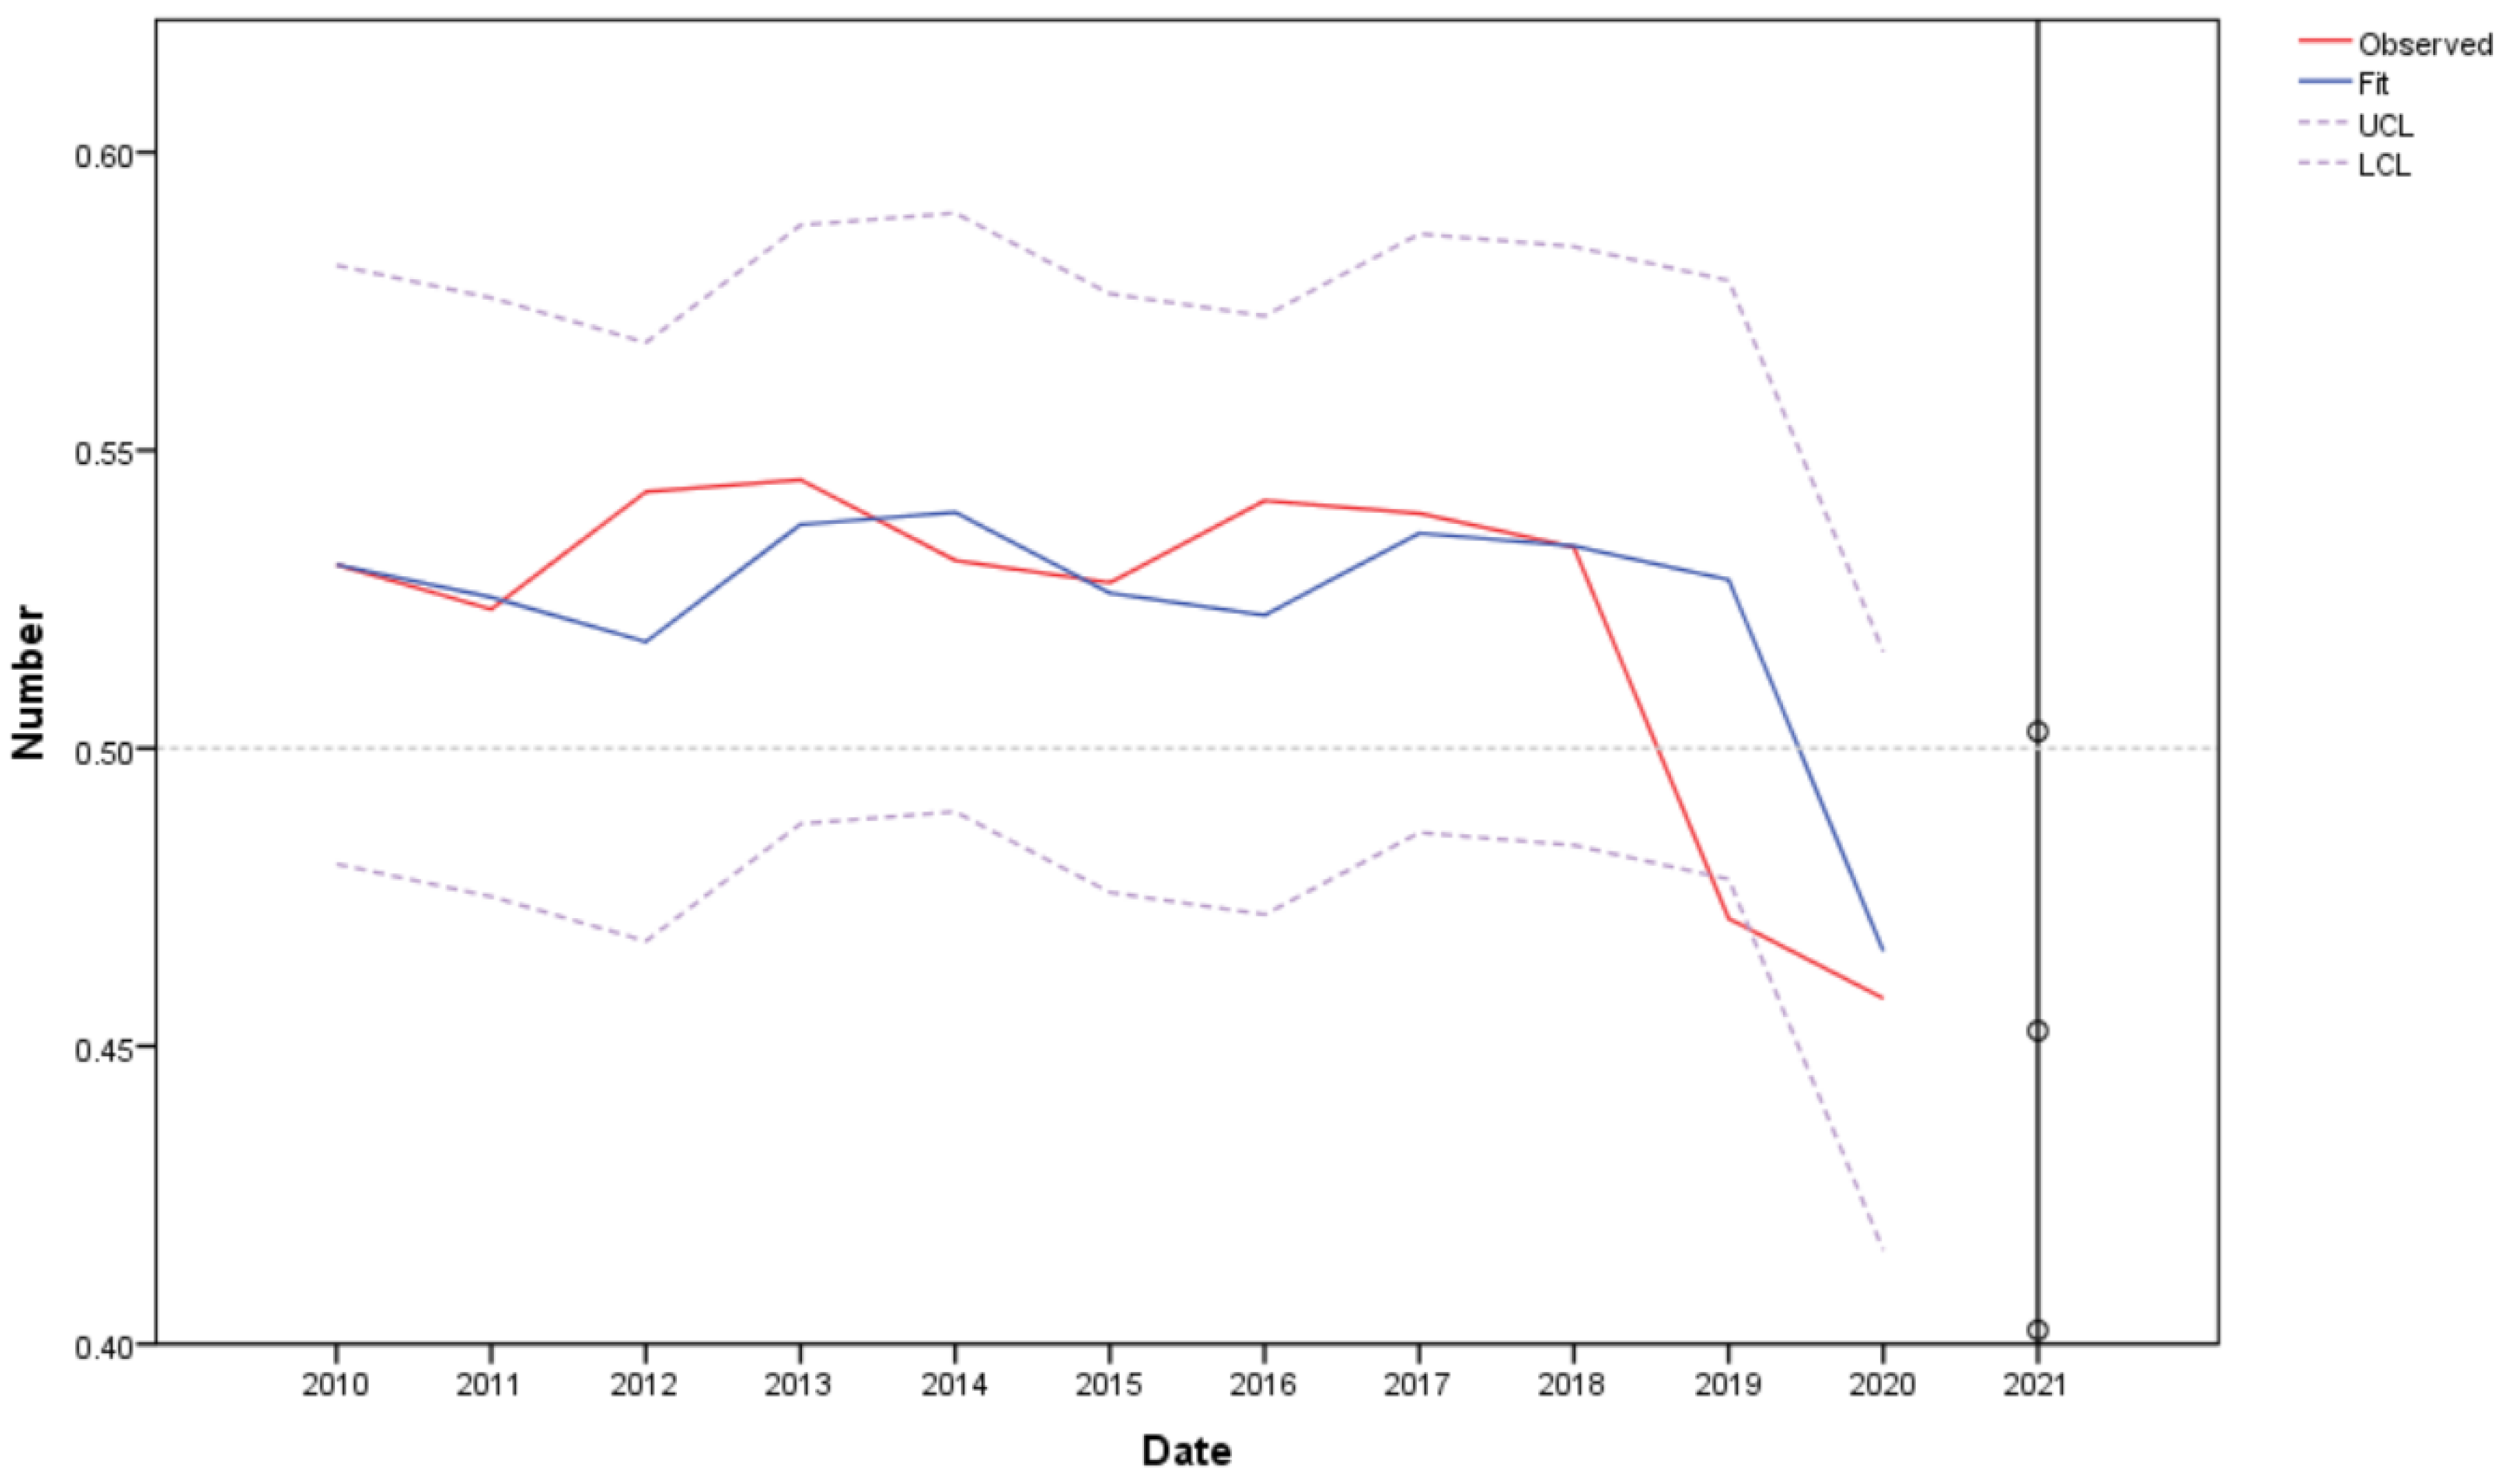
It can be preliminarily predicted by Equation (10). However, due to the large difference between before and in 2018 and after 2019, to prevent overfitting, it is a better choice to use Holt’s exponential smoothing model for predictions. The predicted results are shown in
Figure 14.
In
Figure 14, the red line is the true scale observation, and the blue line is the fitted value given from the data. The figure’s coefficient of determination is
, belonging to the case of a medium degree of fitting. The two curves represent the prediction intervals at the 95% confidence level, and the 3 white circles are prediction in 2021. With the exception for the data in 2019, which is slightly lower than the prediction interval, the actual observations in other years are all within the prediction interval. According to the prediction model, the predicted value of the proportion of undergraduates enrolled in Chinese universities in 2021 is 0.4526, and the prediction interval is
. According to the National Statistic Gazette of the Educational Development in 2021 [
53], the undergraduate enrollment proportion of Chinese colleges and universities is about 0.4440. The gap between the data and the predicted value is not large, and its range falls within the prediction interval of the model for 2021, which can also verify the validity of the prediction from an objective and practical perspective.
4.3.2. Analysis of the Undergraduate Enrollment Proportion and Its Growth Rate of Colleges and Universities in Various Provinces in China
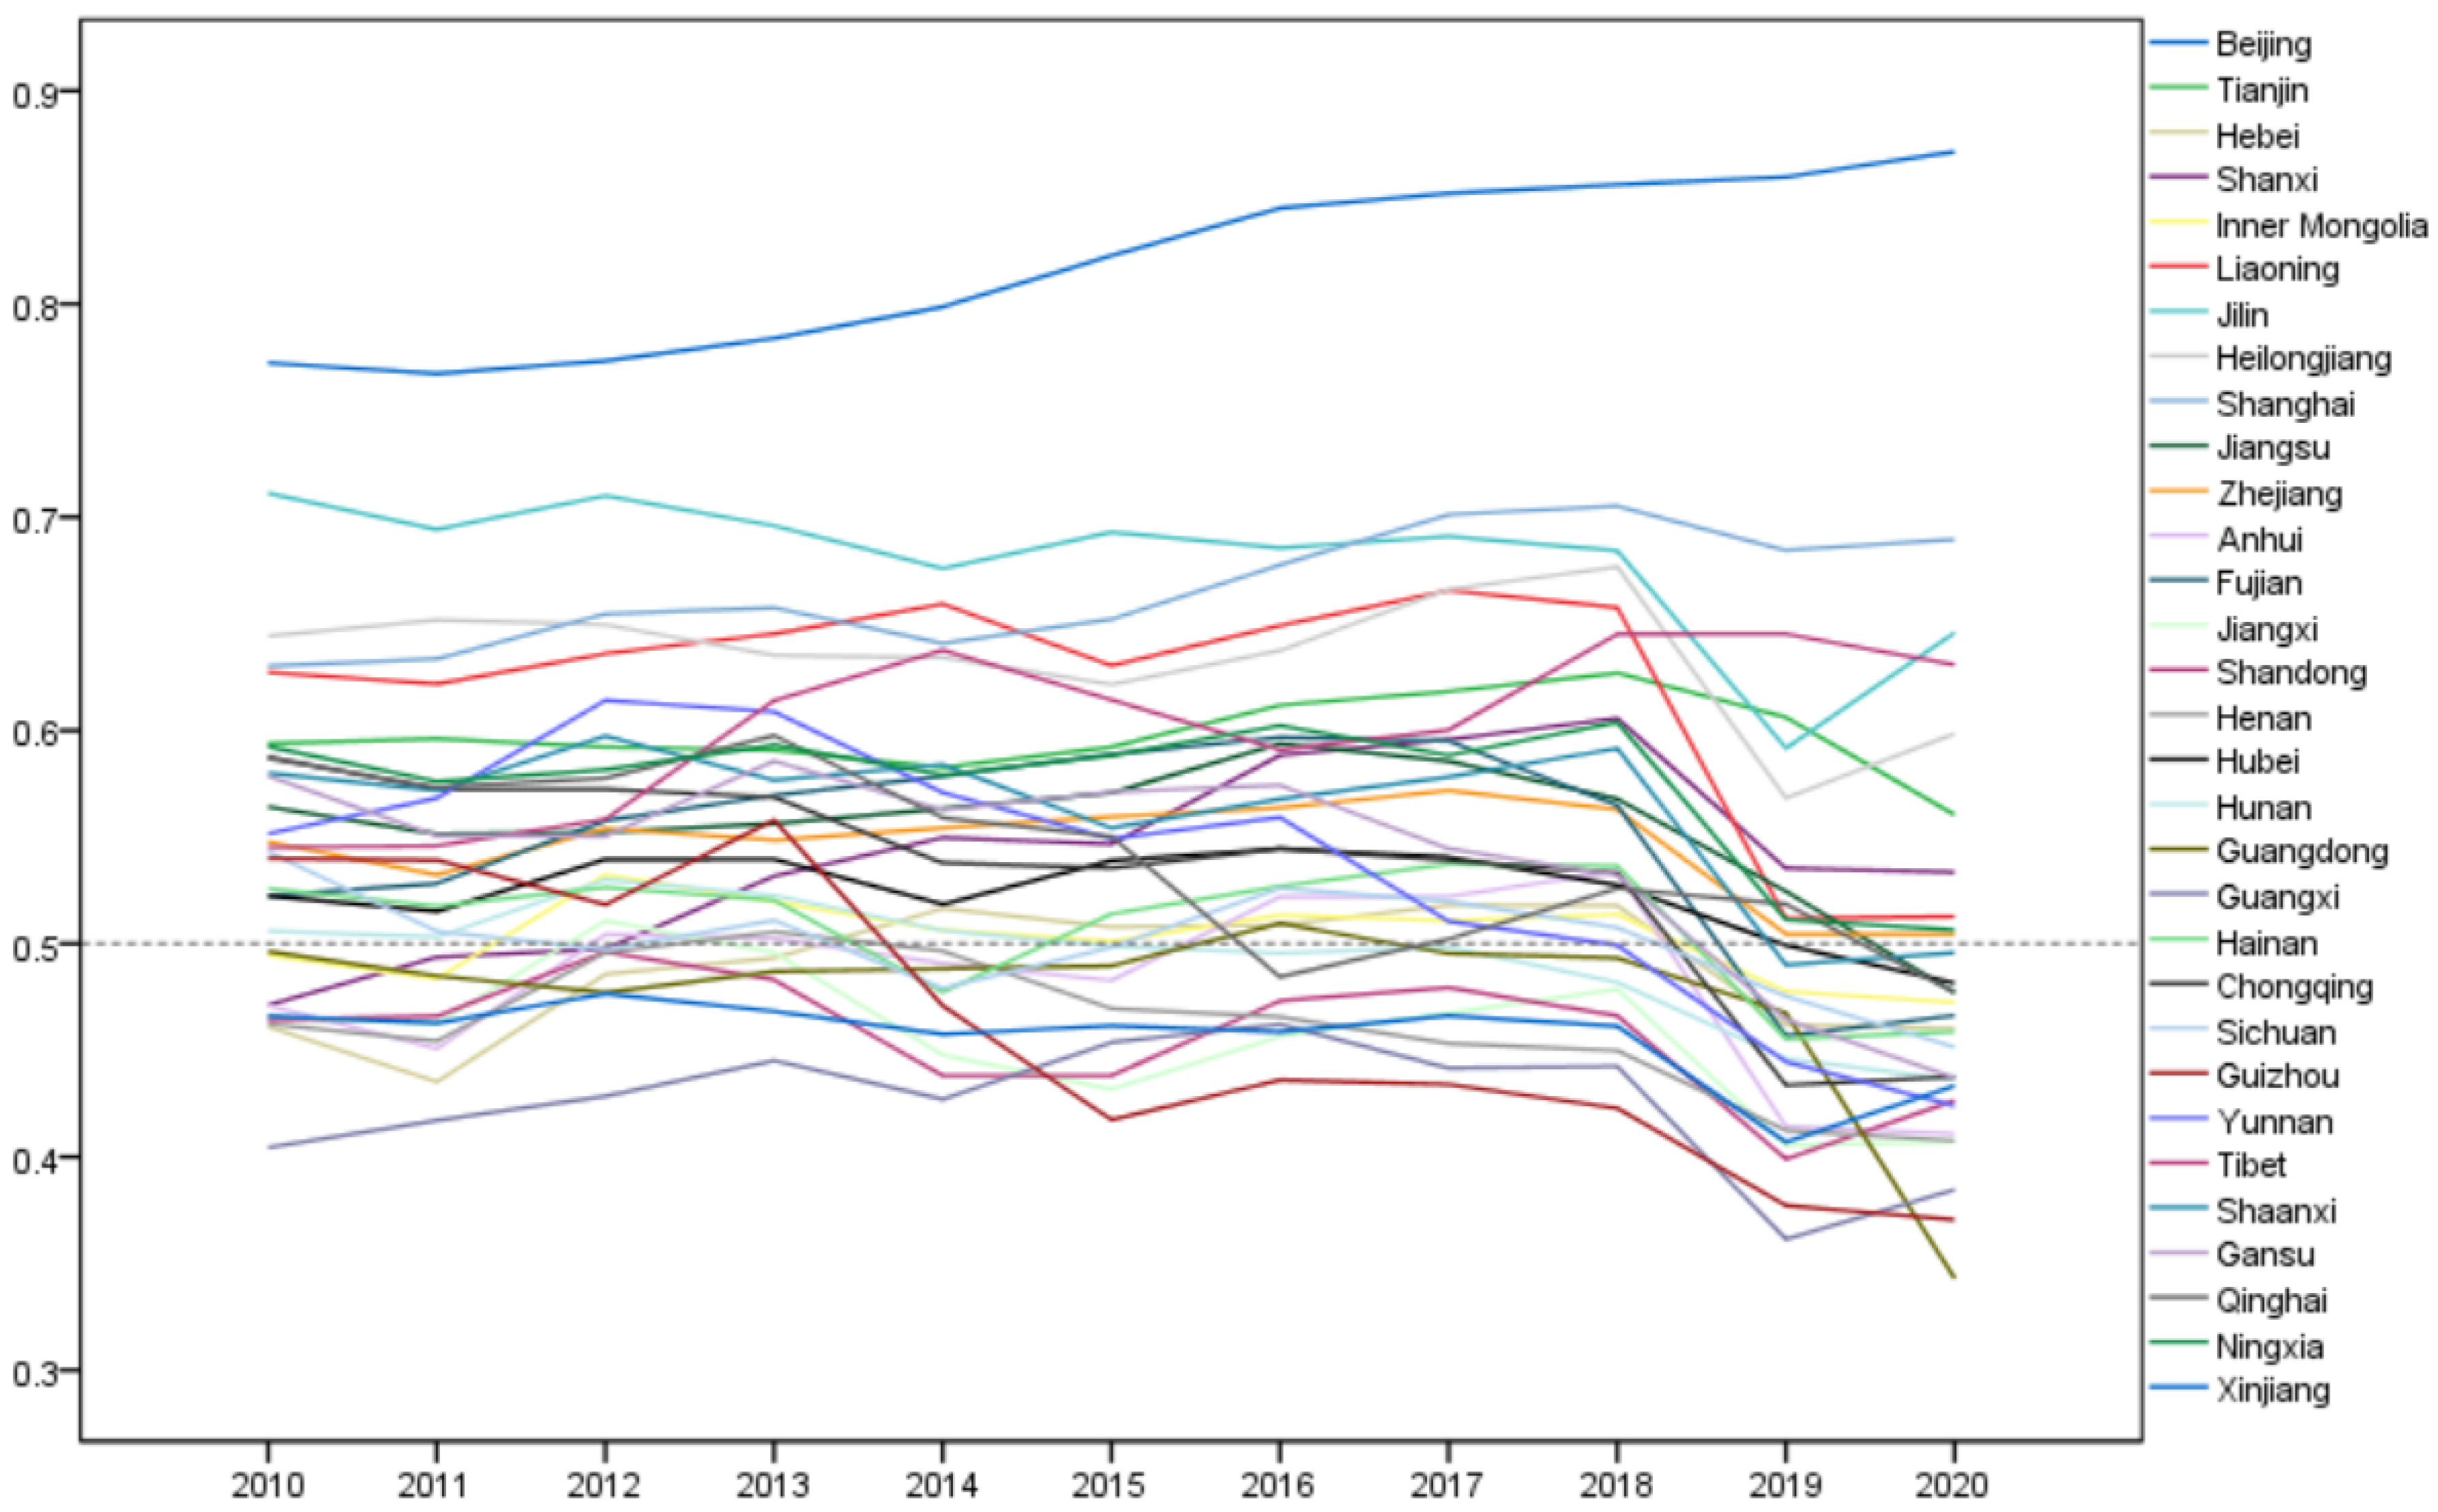
Next, a regression model is established for the undergraduate enrollment ratio of colleges and universities in various provinces in China and its sustainable development law is explored. First, a time series diagram for the development of undergraduate enrollment ratios in colleges and universities in various provinces in China is drawn, as shown in
Figure 15.
According to
Figure 15, overall, Beijing has the highest proportion of undergraduates in enrollment, and Shanghai and Jilin also have relatively high proportions, whereas the proportion of undergraduates in Guangxi, Shandong, and Guizhou is relatively low. In some provinces, the ratio of undergraduate enrollment has been higher than 0.5 from 2010 to 2020, i.e., their undergraduate enrollment has always been greater than that of specialists including Beijing, Tianjin, Liaoning, Jilin, Heilongjiang, Shanghai, Zhejiang, Tibet, and Ningxia. In contrast, there are also some provinces with undergraduate enrollment proportions that are lower than 0.5 from 2010 to 2020, i.e., their undergraduate enrollment has always been smaller than that of specialists, including Shandong, Guangxi, and Xinjiang. Most provinces are somewhere in between, i.e., in some years, the number of undergraduate enrollments is greater than that of specialists, and in some years, it is the opposite.
To understand the development and changes in the undergraduate enrollment proportion in each province and to prepare for the sustainable development of the undergraduate enrollment proportion, a chain growth rate analysis of undergraduate enrollment proportion data should reflect new information. First, a sequence diagram for the chain growth rate of undergraduate enrollment proportion in Chinese universities is drawn, as shown in
Figure 16.
In
Figure 16, in addition to comparing the size of the area where the chain growth rate is positive and negative, it is possible to obtain information about the adjustment of the proportion of undergraduates in each province. It can be found that, in 2012, the chain growth rate of undergraduate enrollment proportion in most provinces increased, but in 2019, the chain growth rate for the proportion of undergraduates in almost all provinces dropped sharply for one year and the chain growth rate is negative. It shows that in 2019, most provinces further increased the proportion of junior college students in college enrollment. Combining
Figure 15 and
Figure 16, from the perspective of the overall trend, most provinces in China have made certain contributions in expanding vocational and technical education and promoting the sustainable development of specialist education.
5. Discussion
Here, the research questions are mainly answered according to the situation reflected by the experimental results, and suggestions are also made for the further sustainable development of Chinese university enrollment.
This paper begins with three main research questions. The first question is what is the development sequence for the number and the chain growth rate of students enrolled in Chinese universities? First, the enrollment of Chinese colleges and universities has been increasing, and the growth rate increased after 2018. Using exponential smoothing predictions, it was observed that the prediction interval in 2022 is
, and it will continue to expand in 2023; moreover, the prediction interval is
. It can be clearly found that the increase in the upper limit of the subsequent prediction interval is greater than the decline in the lower limit of the prediction interval. This shows that if there is no new policy intervention or other factors, the number of enrollments will increase according to the current trend. In addition, according to the Holt’s exponential smoothing prediction graph of chain growth rate, although the chain growth rate had a sudden change in 2019, the fitting curve of the chain growth rate has been in a slow growth process. This shows that in the next few years, the number of students enrolled in Chinese colleges and universities will not only gradually increase but the rate of growth will also increase. The study found that the college enrollment expansion policy can promote China’s economic growth, inject a large amount of human capital into the society, improve the production efficiency of enterprises, and promote the technological innovation of enterprises [
60]. However, as the number of college students continues to expand, problems such as financial risks and financial difficulties in Chinese colleges and universities may gradually become prominent. To continue to contribute to the sustainable development of education in terms of enrollment in Chinese colleges and universities, China should actively build an education investment and development model which is compatible with the development situation and actively explore the fund-raising model of governments and school fund-raising channels [
61]. In addition, when the number of students enrolled continues to increase, the problem of the decline in teaching quality due to a shortage of teachers in colleges and universities should also be focused on. In addition to increasing the quality and quantity of teachers in colleges and universities, the form of teaching organization can be appropriately improved to achieve the purpose that makes full and reasonable use of existing educational resources [
62]. To realize the sustainable development of colleges and universities, especially in local places, the rich reserves of human resources in colleges and universities can be promoted via the education and training of teaching and scientific research personnel and the flow of talents [
63]. Finally, increased enrollment in colleges and universities boosts employment in the short run, and this trend has a multiplier effect in stimulating sustainable human capital development. However, to sufficiently sustain the development of human resources to create long-term employment opportunities, it is necessary to combine education with other cooperant factors such as social safety nets, good governance, private sector development, and the efficient utilization of human and physical resources [
64].
The second research question is what are the differences in the development sequence for the number of college students and their chain growth rates in different provinces in China in terms of different regions? Is this difference related to the geographical location of the provinces? From the perspective of the development sequence of the number of college enrollments in various provinces in China, almost all provinces have shown a linear growth trend in college enrollment, but there are large differences in the growth rate in different regions. ANOVA shows that the geographical location makes a difference in the number of college students and their chain growth rate in different provinces in China, and the increase in the number of students in the west and south areas is greater than that in the east and north areas. Based on existing research, there are large differences in the number of high school graduates and college enrollment in China in different regions [
65]; moreover, the phenomenon of unbalanced economic development among different regions in China is obvious [
66], so the economically developed regions such as the southeast coast will inevitably widen the gap with the northwest region in terms of higher education training, resulting in a situation of educational inequality. However, the research results of this paper show that the growth rate in the west is greater than that in the east, which can reflect the current efforts made by China to reduce the regional education gap. Currently, in addition to examining regional differences, the government needs to consider the internal class differences in different regions. When a certain time is reached, the value orientation of China’s high-quality higher education admission opportunity regulation policy can change from compensatory equity to differential equity [
67].
The third research question is what type of development sequence does the enrollment ratio of undergraduates and junior colleges present in China overall and in each province? How does one predict the development direction for the future enrollment proportion? According to the experimental results, the undergraduate enrollment rate in China as a whole and in all provinces was higher than that of junior colleges before 2018. However, a sudden change occurred in and after 2019. The proportion of junior college students has been greater than that of undergraduate students, and the proportion of undergraduate students is still exhibiting a downward trend. The current trend of the number of students enrolled in colleges and universities should reflect China’s emphasis on colleges and the cultivation of high-quality technical and skilled personnel who can serve regional development [
68]. On this basis, the focus of research should be on improving the development level and promoting the high-quality development of higher vocational education.
According to SDG 4, which aims to ensure inclusive and equitable quality education and promote lifelong learning opportunities for all, two of the key elements involve providing educational opportunities and ensuring the fairness and equality of education. In terms of providing opportunities in education, studies have shown that in the late 1990s, Chinese higher education had a tendency of rapid expansion, when the Chinese government encouraged a much greater increase in the number of new entrants into higher education institutions [
69]. Judging from the time series data of Chinese university enrollment and the trend of Holt’s exponential smoothing prediction, the development of Chinese higher education in the past ten years is still in a process of steady development in terms of providing educational opportunities for most people, and without interventions, this growing trend will not change much in the short term. As far as the provinces are concerned, except for the slight decline in the number of students enrolled in Beijing in recent years, other provinces and cities maintained the same pace as the entire country. Therefore, the trend of higher education opportunities for Chinese citizens is moving towards SDG 4.
Regarding the fairness and equality of education, the ministry of education of China pointed out in 2022 that it is necessary to promote the fairness of higher education enrollment opportunities and proposed policy guidance on the equality of higher education enrollment in different regions: “Continue to increase the tilt towards the central and western regions and rural areas. Comprehensively consider factors such as the number of students, enrollment opportunities, and school conditions, and reasonably arrange the national support for the enrollment cooperation plan in the central and western regions, and give preference to the central and western regions and provinces with large candidates” [
70]. The model and data analysis results presented in this study can fully illustrate the progress China has made under the influence of such policies. According to
Figure 5 and
Figure 10, in recent years, the growth rate of enrollment in universities in the western region is greater than that in the eastern region, and this difference is significant. Currently, the reality of the large gap in economic development among different regions in China has not changed, but the results of this paper have shown, to a certain extent, that the formulation of relevant policies in recent years for improving educational enrollment opportunities in backward regions has achieved results. Combining the above two aspects, the results of the data analysis and prediction model of this study can empirically demonstrate that from the context of higher education in China, the current state of college enrollment is closer to “ensuring inclusive and equitable quality education and promoting lifelong learning opportunities for all” in SDG 4 with respect to at least from the two aspects of “improving educational opportunities” and “guaranteeing educational equity in different regions”. China’s achievements in promoting education for sustainable development can be supported by various statistical analysis results in terms of college enrollment.
This study has certain significance in presenting the development status in recent years and predicting the future trend of Chinese college enrollment, which can provide references for the sustainable development of higher education in future. Compared with the similar body of literature, the main advantages of this paper are reflected in the following aspects: First, a macroscopic and multi-level perspective is provided. In other studies, the prediction models for college enrollments are mainly based on the case study of a certain province or a certain university [
71,
72,
73]. This study not only focuses on the entire country of China but also conducts a detailed analysis of each region and each province, with a dual-level perspective of the country and the province. Second, the analysis of the degree of growth change. The only quantities related to enrollment that other studies can relate to include the number of enrollment or the gross enrollment ratio, but they do not use their chain growth rate as the basic data [
74,
75]. As a result, other research studies can only deal with the trend, but they do not have a deep grasp of the changes in the growth rate. Third, the adaptive and dynamic prediction model adopted in the study can obtain the feasible prediction interval when there are no new data and obtain the optimal prediction interval when there is new data. Decision makers can dynamically adjust the usage method according to the specific situation to obtain the prediction interval they need. Fourth, this article uses the latest data currently released by China, which can reflect the latest development of Chinese university enrollments and contribute to the latest sustainable development decisions.
However, this paper has some limitations that deserve further study. First, the research object of this paper is China, and it does not examine or compare the development of college enrollment in other countries at the same time. In future research, the enrollment situation of universities in other countries can be compared with the Chinese universities presented in this paper in order to provide more comprehensive assistance for the sustainable development of global education. Second, the main research work of this paper is to explore the development trend of college enrollments, but there is no follow-up survey on the whereabouts of graduates. Future research can obtain other conclusions from higher education and training by comparing the relationship between enrollment and graduation, and the studies may explore the sustainable development of teaching quality in the training process further. Third, the prediction method related to this article can not only be used to examine the enrollment of students, but similar methods can also predict students’ performances [
76], employment rate, etc. We hope that the detailed and in-depth analysis and prediction model of college enrollment in China and its provinces can provide reference and assistance for the global sustainable development of education.


