


Seismic Damage Identification of Composite Cable-Stayed Bridges Using Support Vector Machines and Wavelet Networks


Abstract
1. Introduction
2. Methodology
2.1. Damage Identification Method
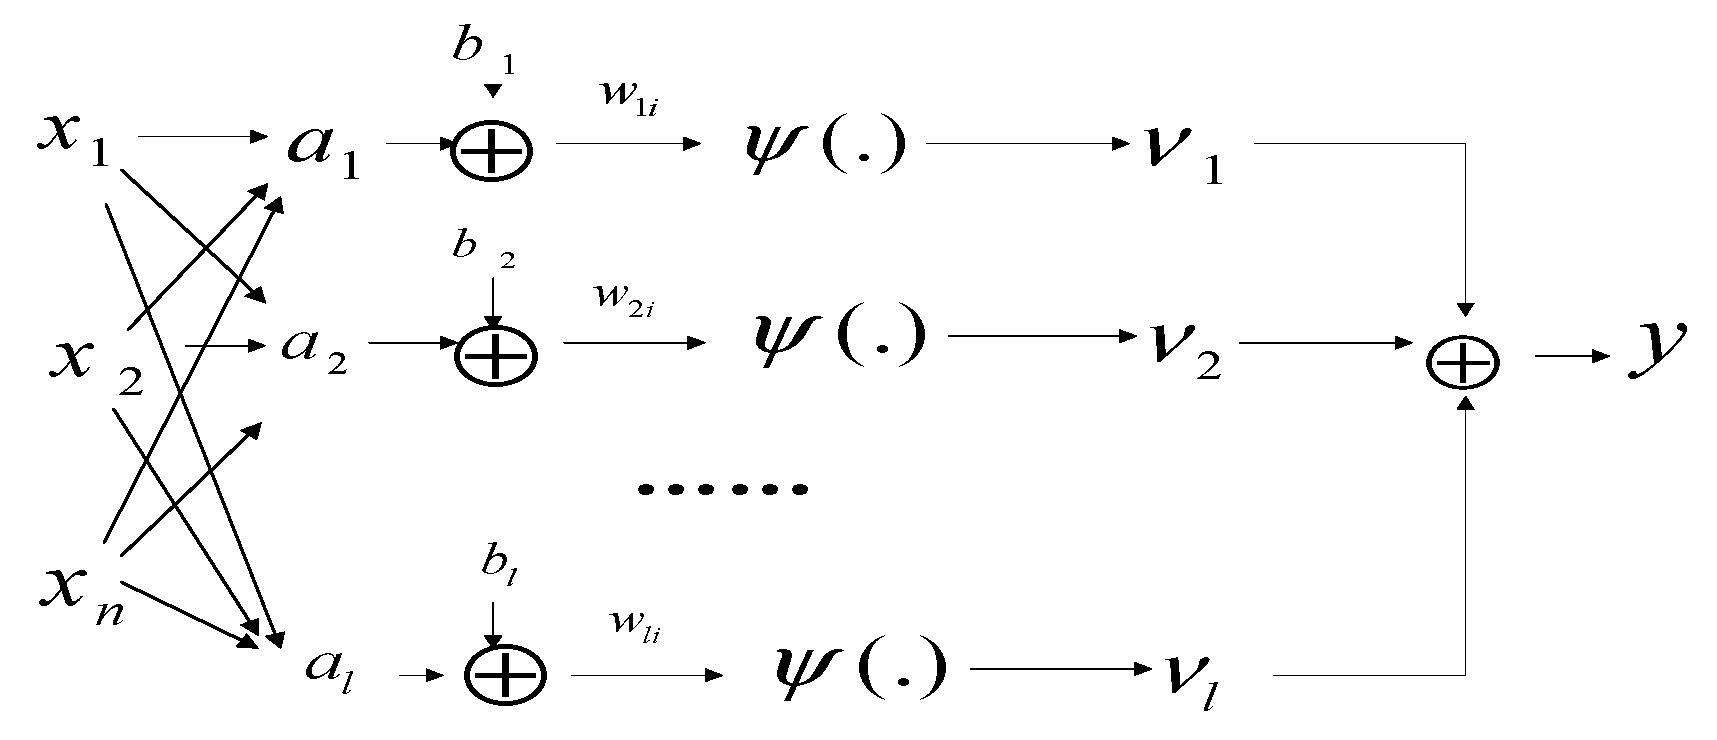
2.2. The Basic Principle of Support Vector Machines and Wavelet Networks
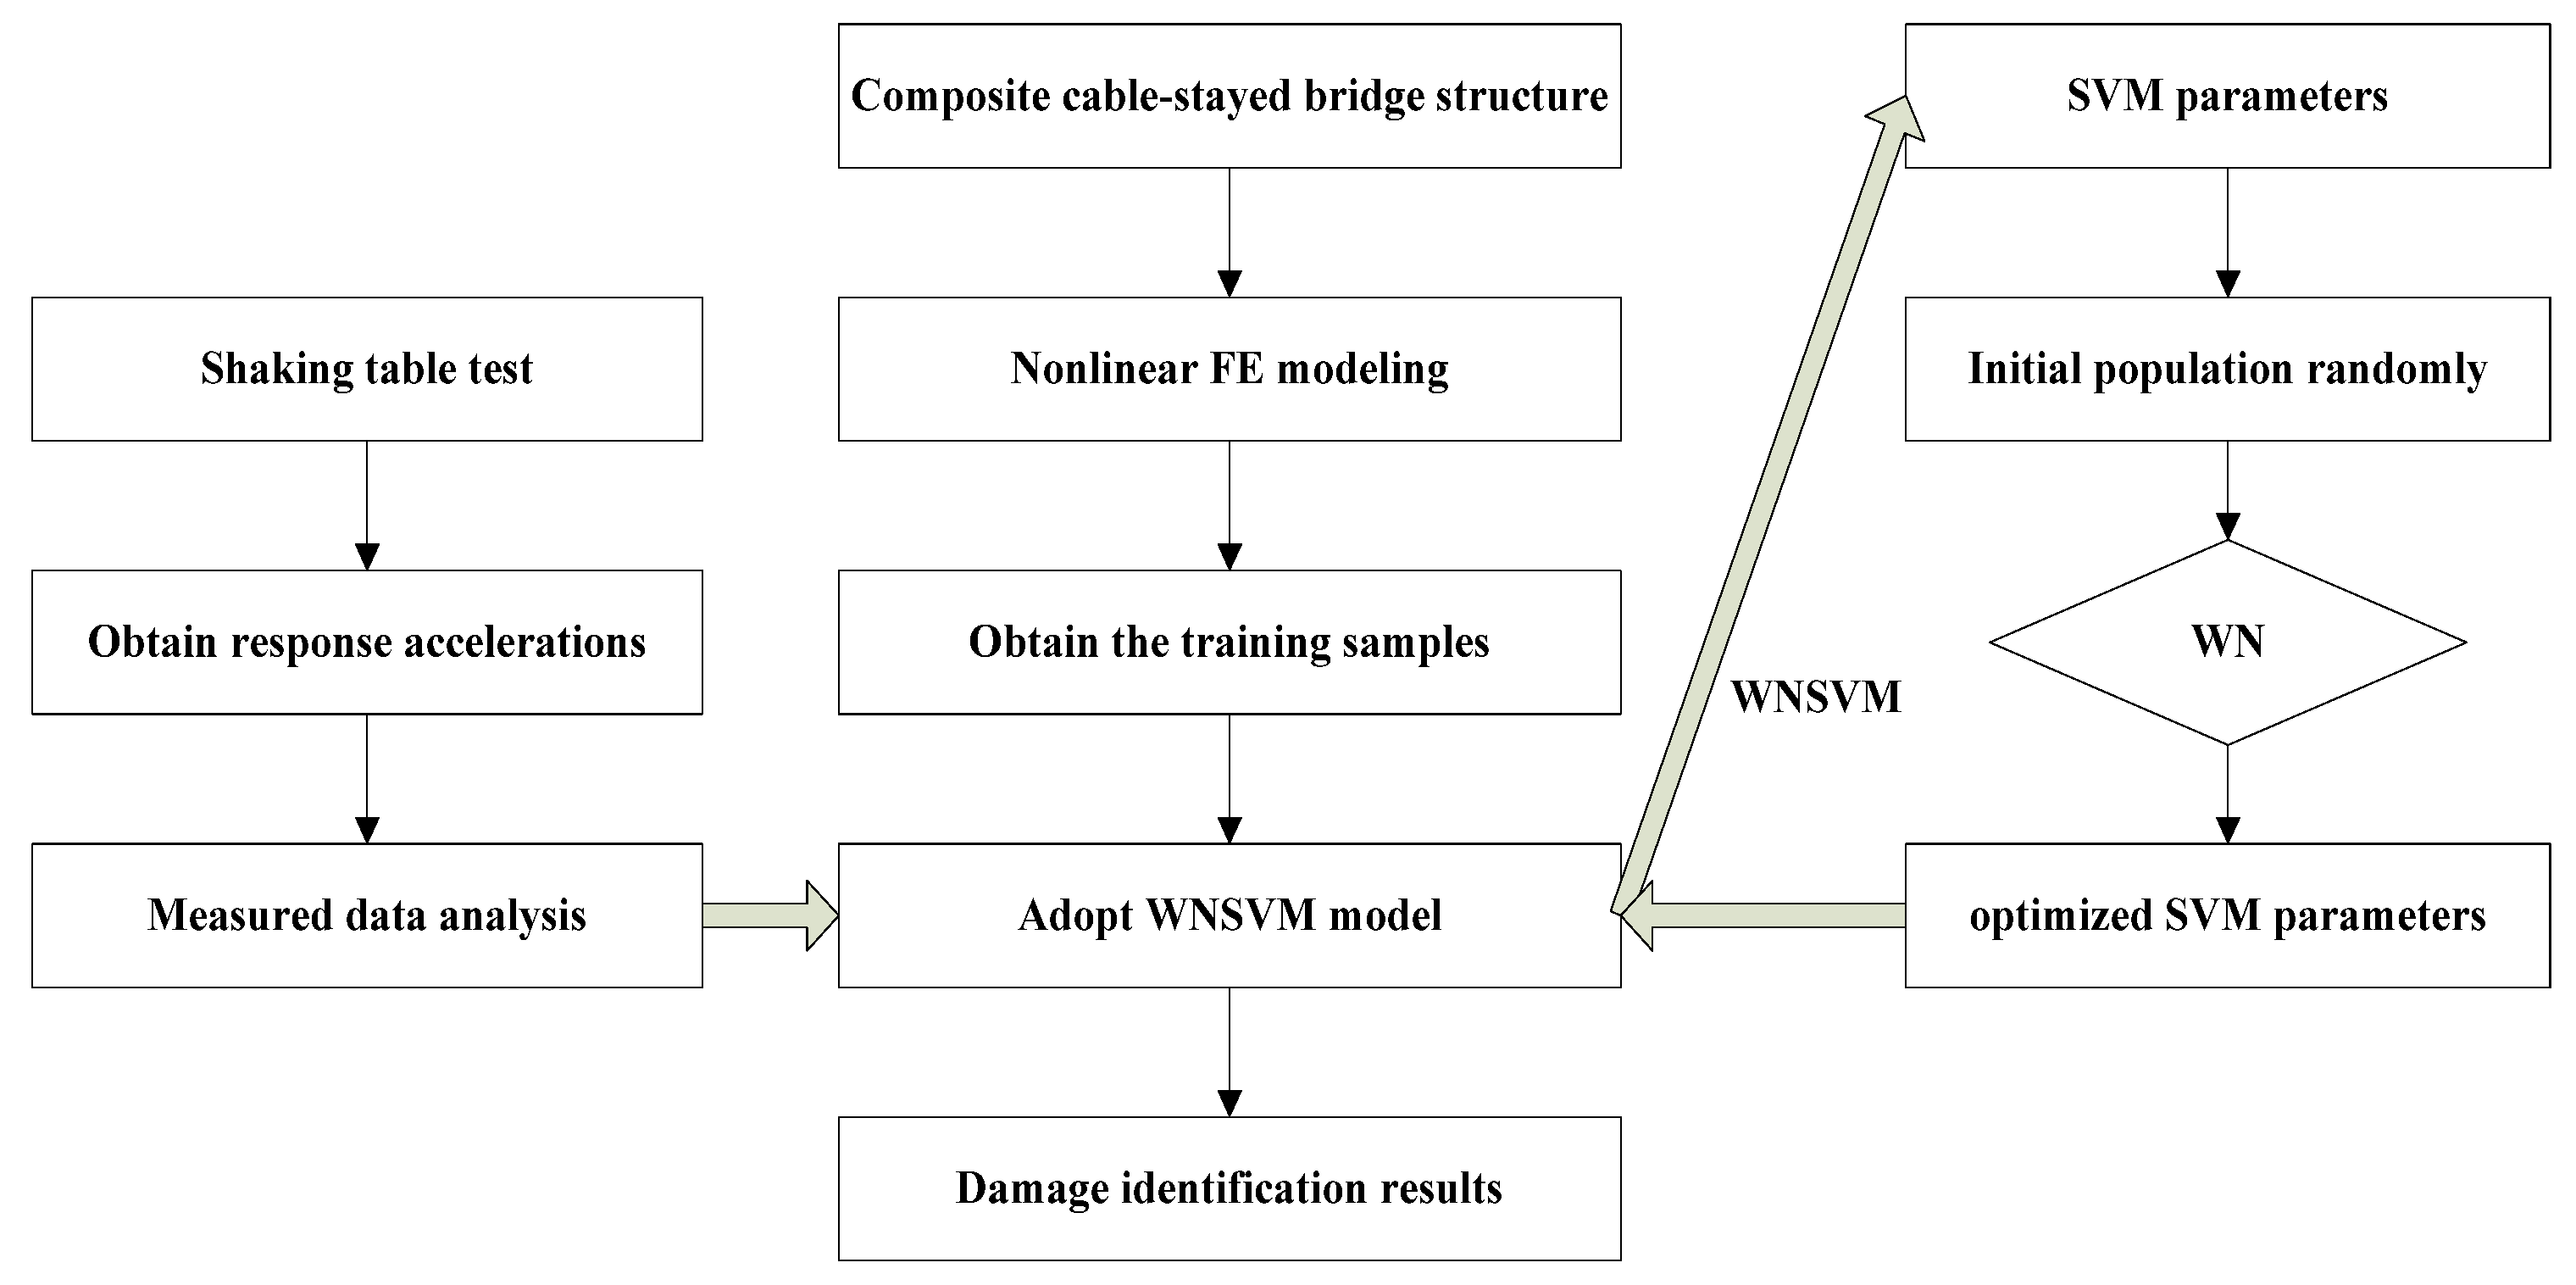
2.3. The Framework of Damage Identification Based on WNSVM
3. Shaking Table Tests
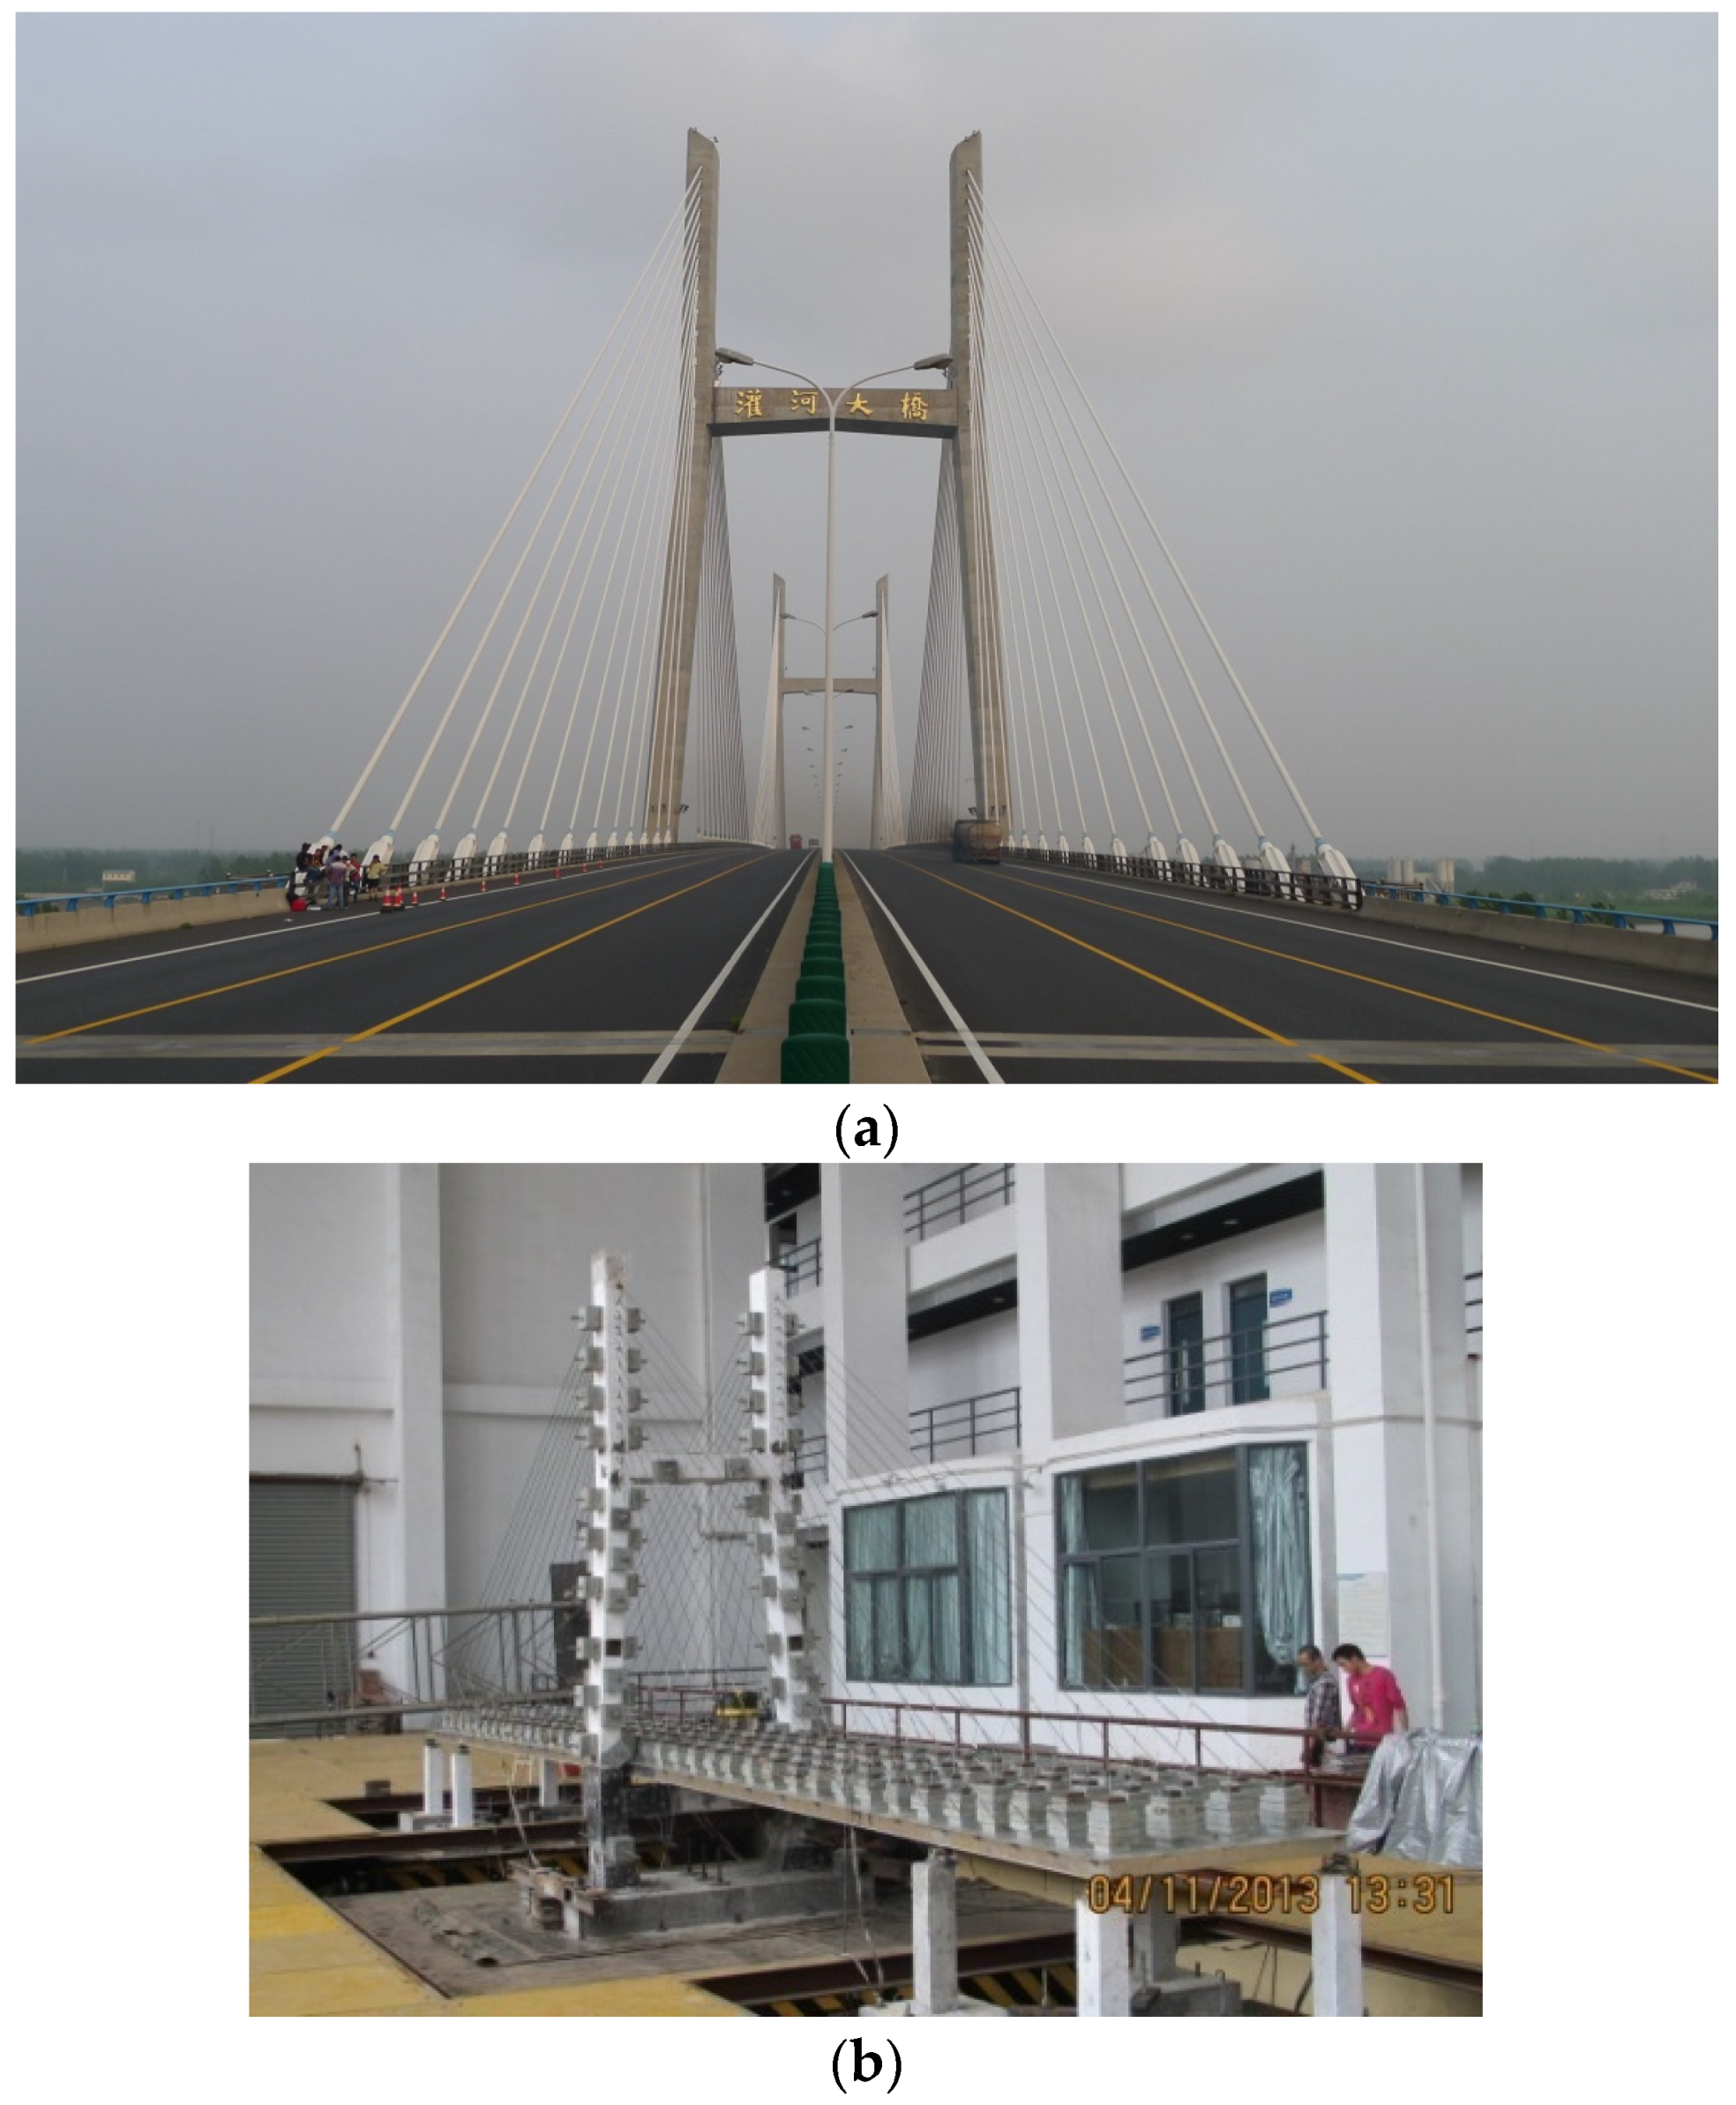
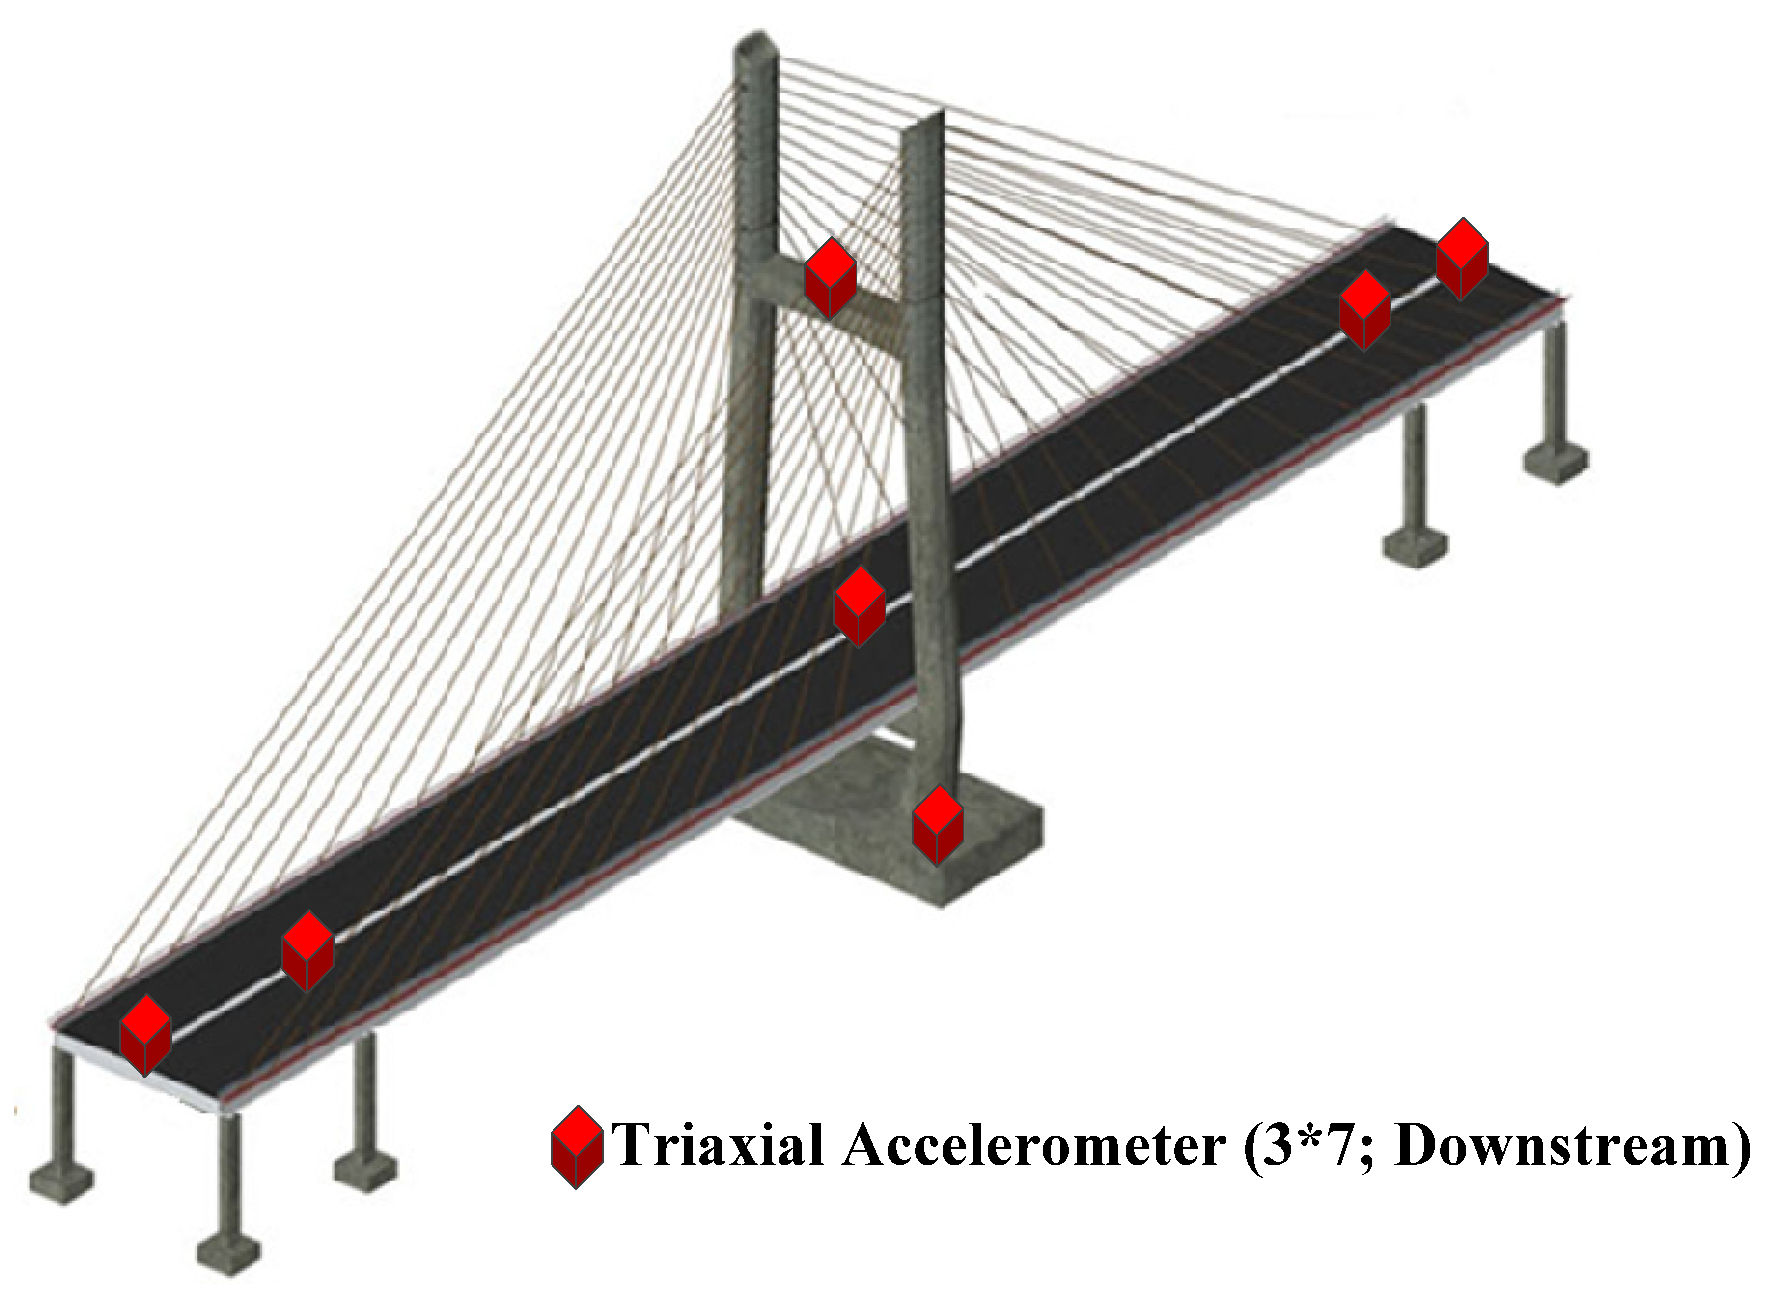
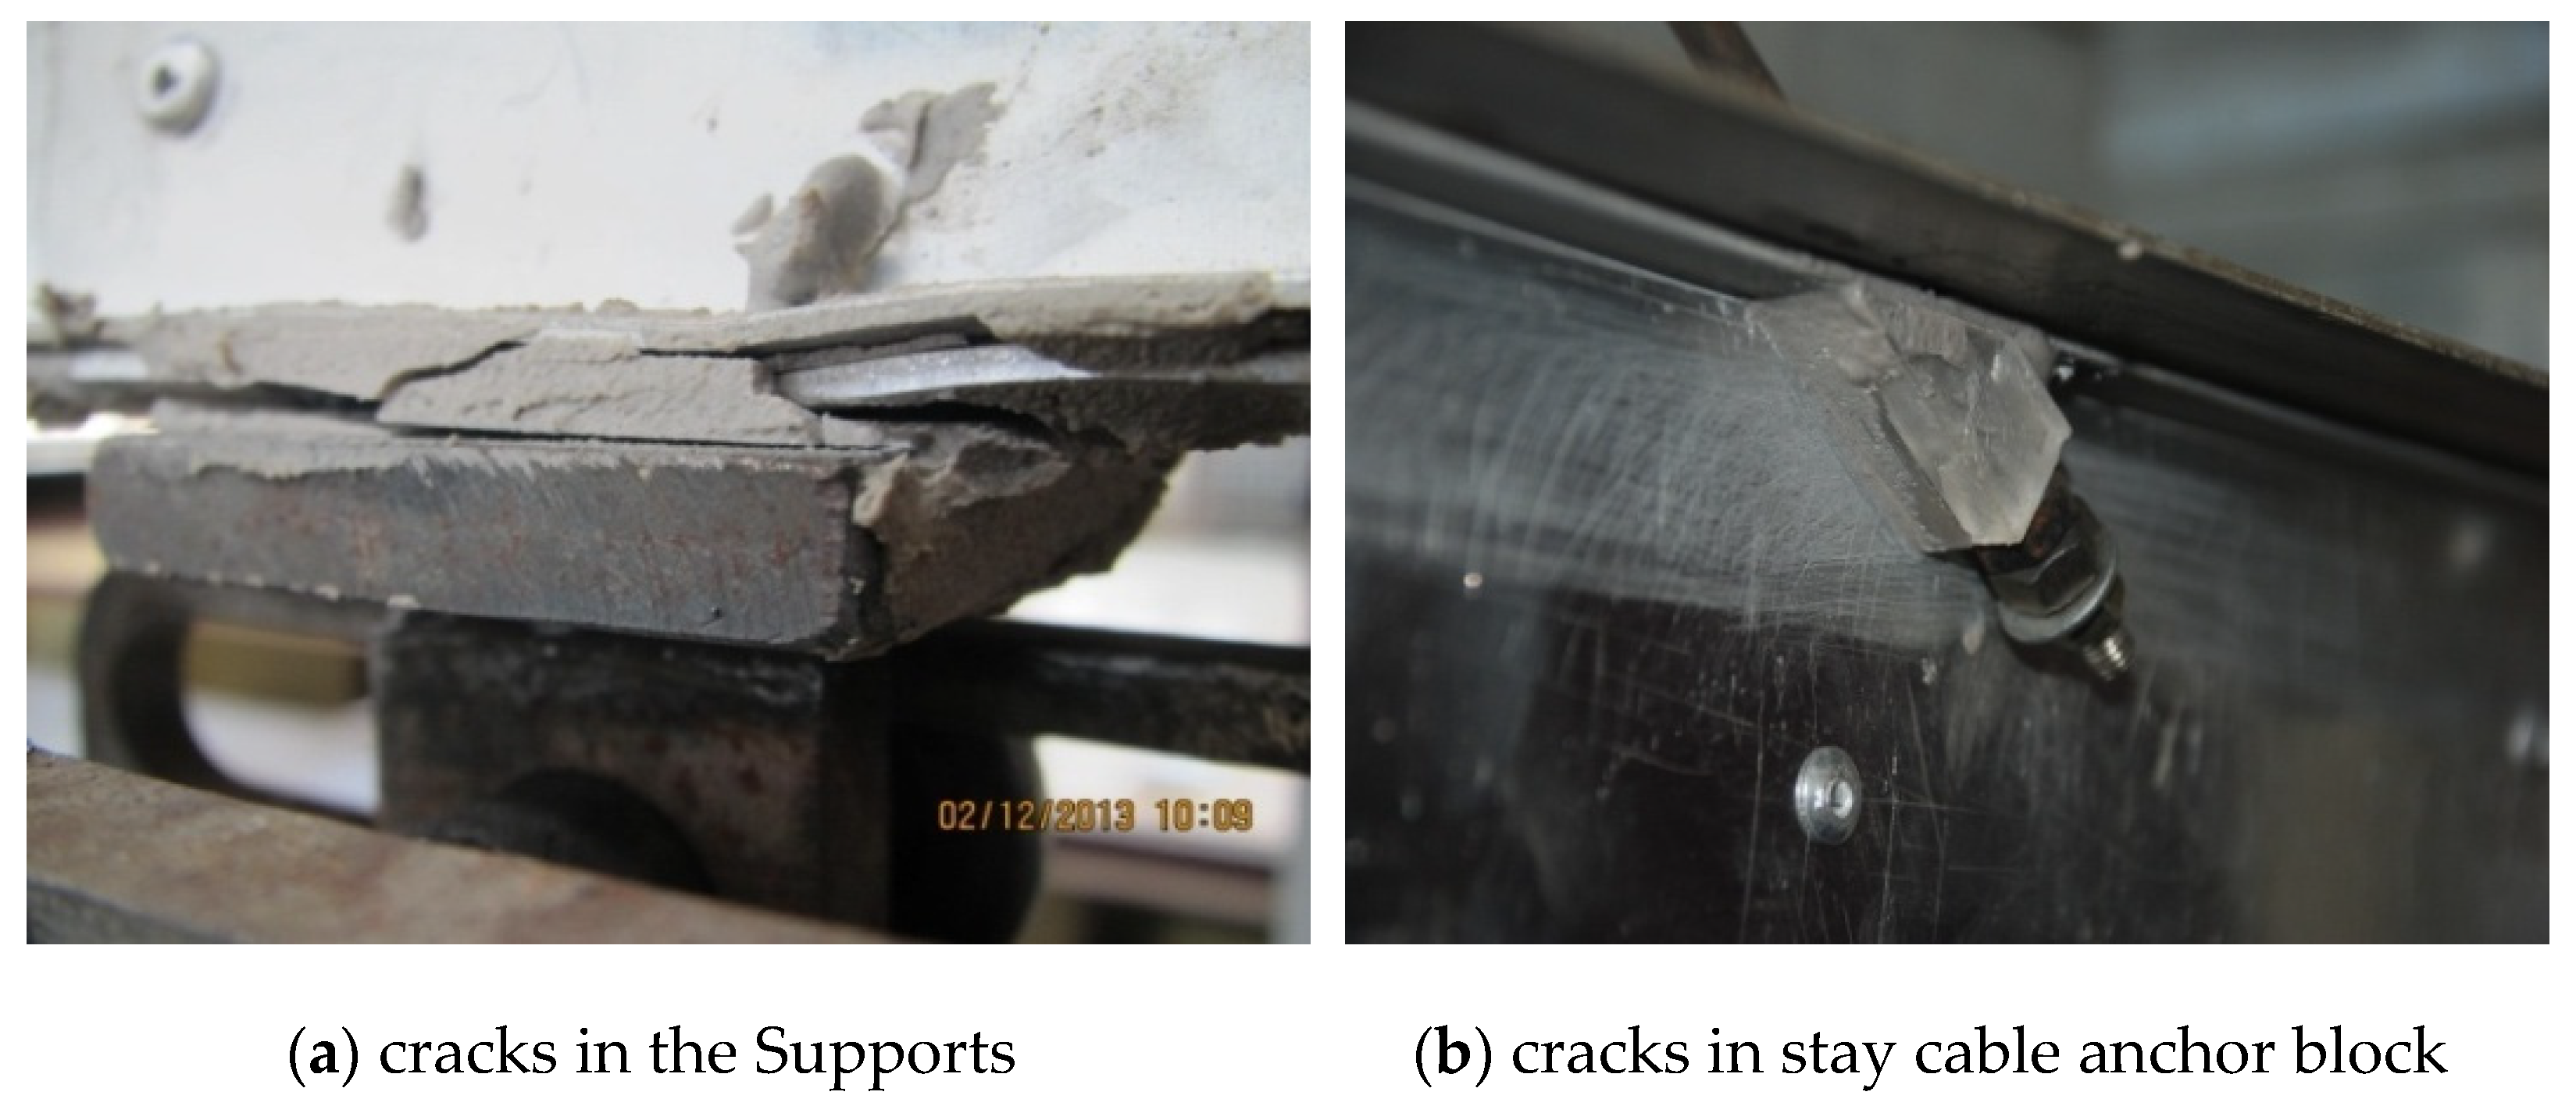
3.1. Experimental Description
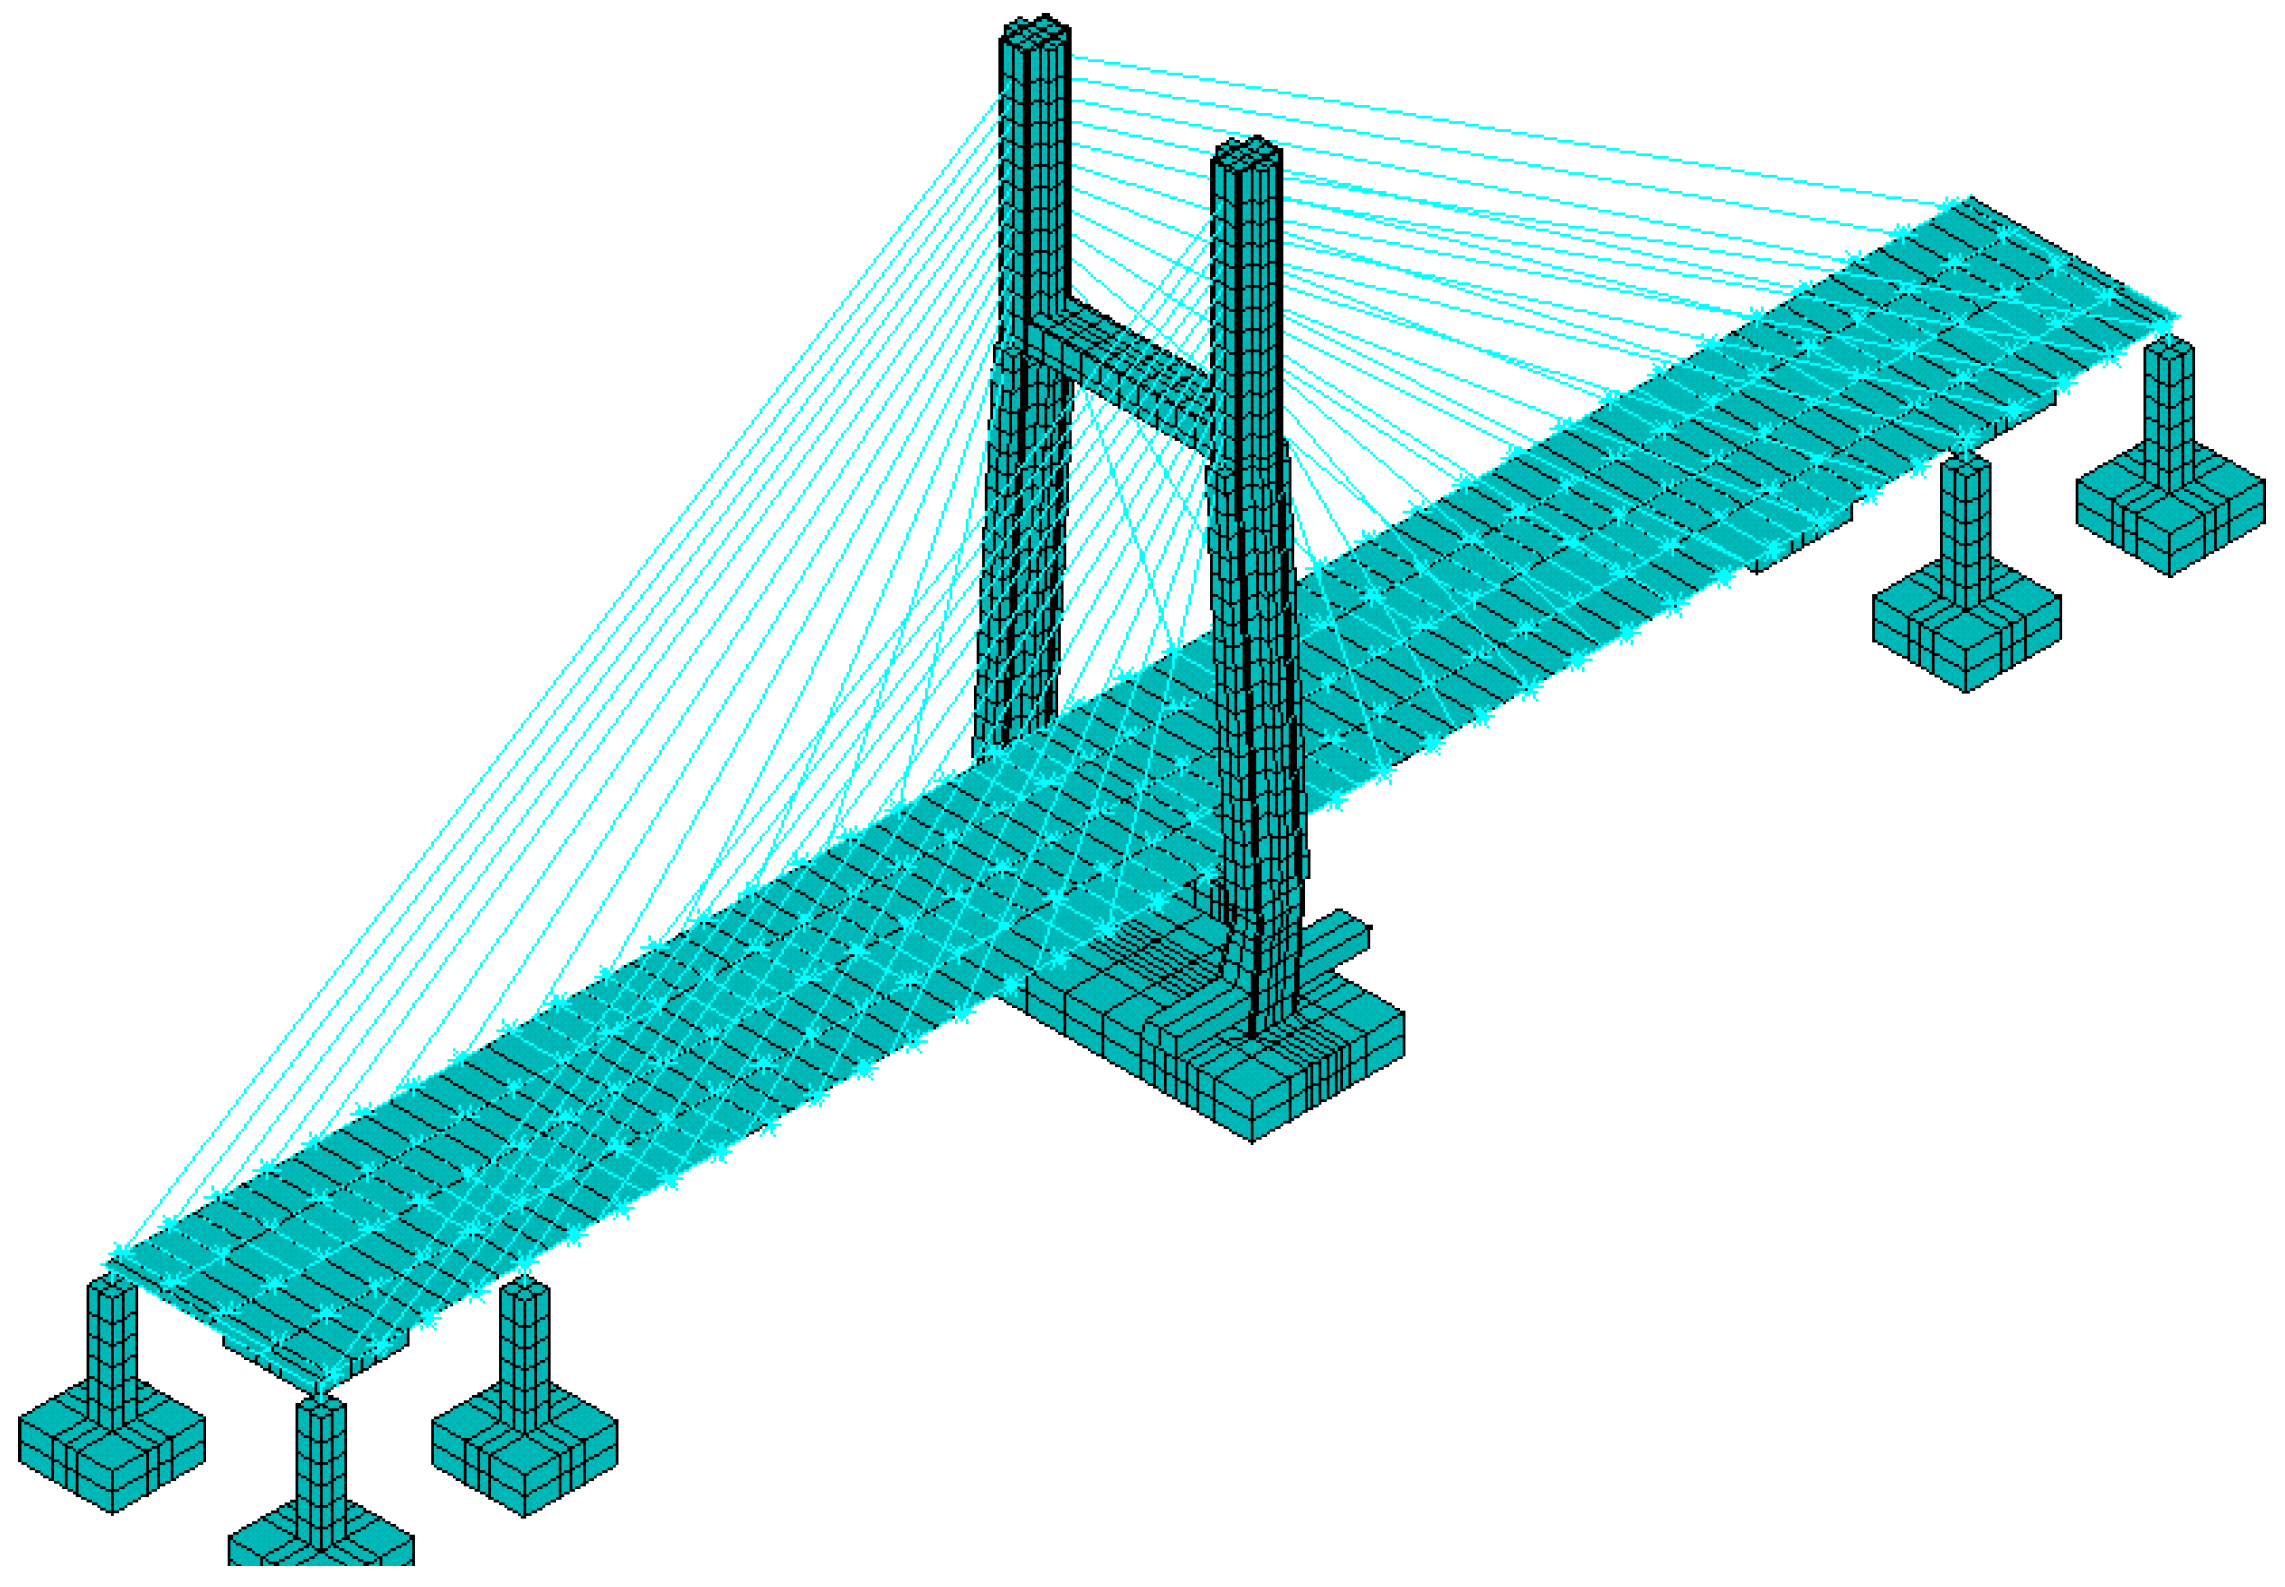
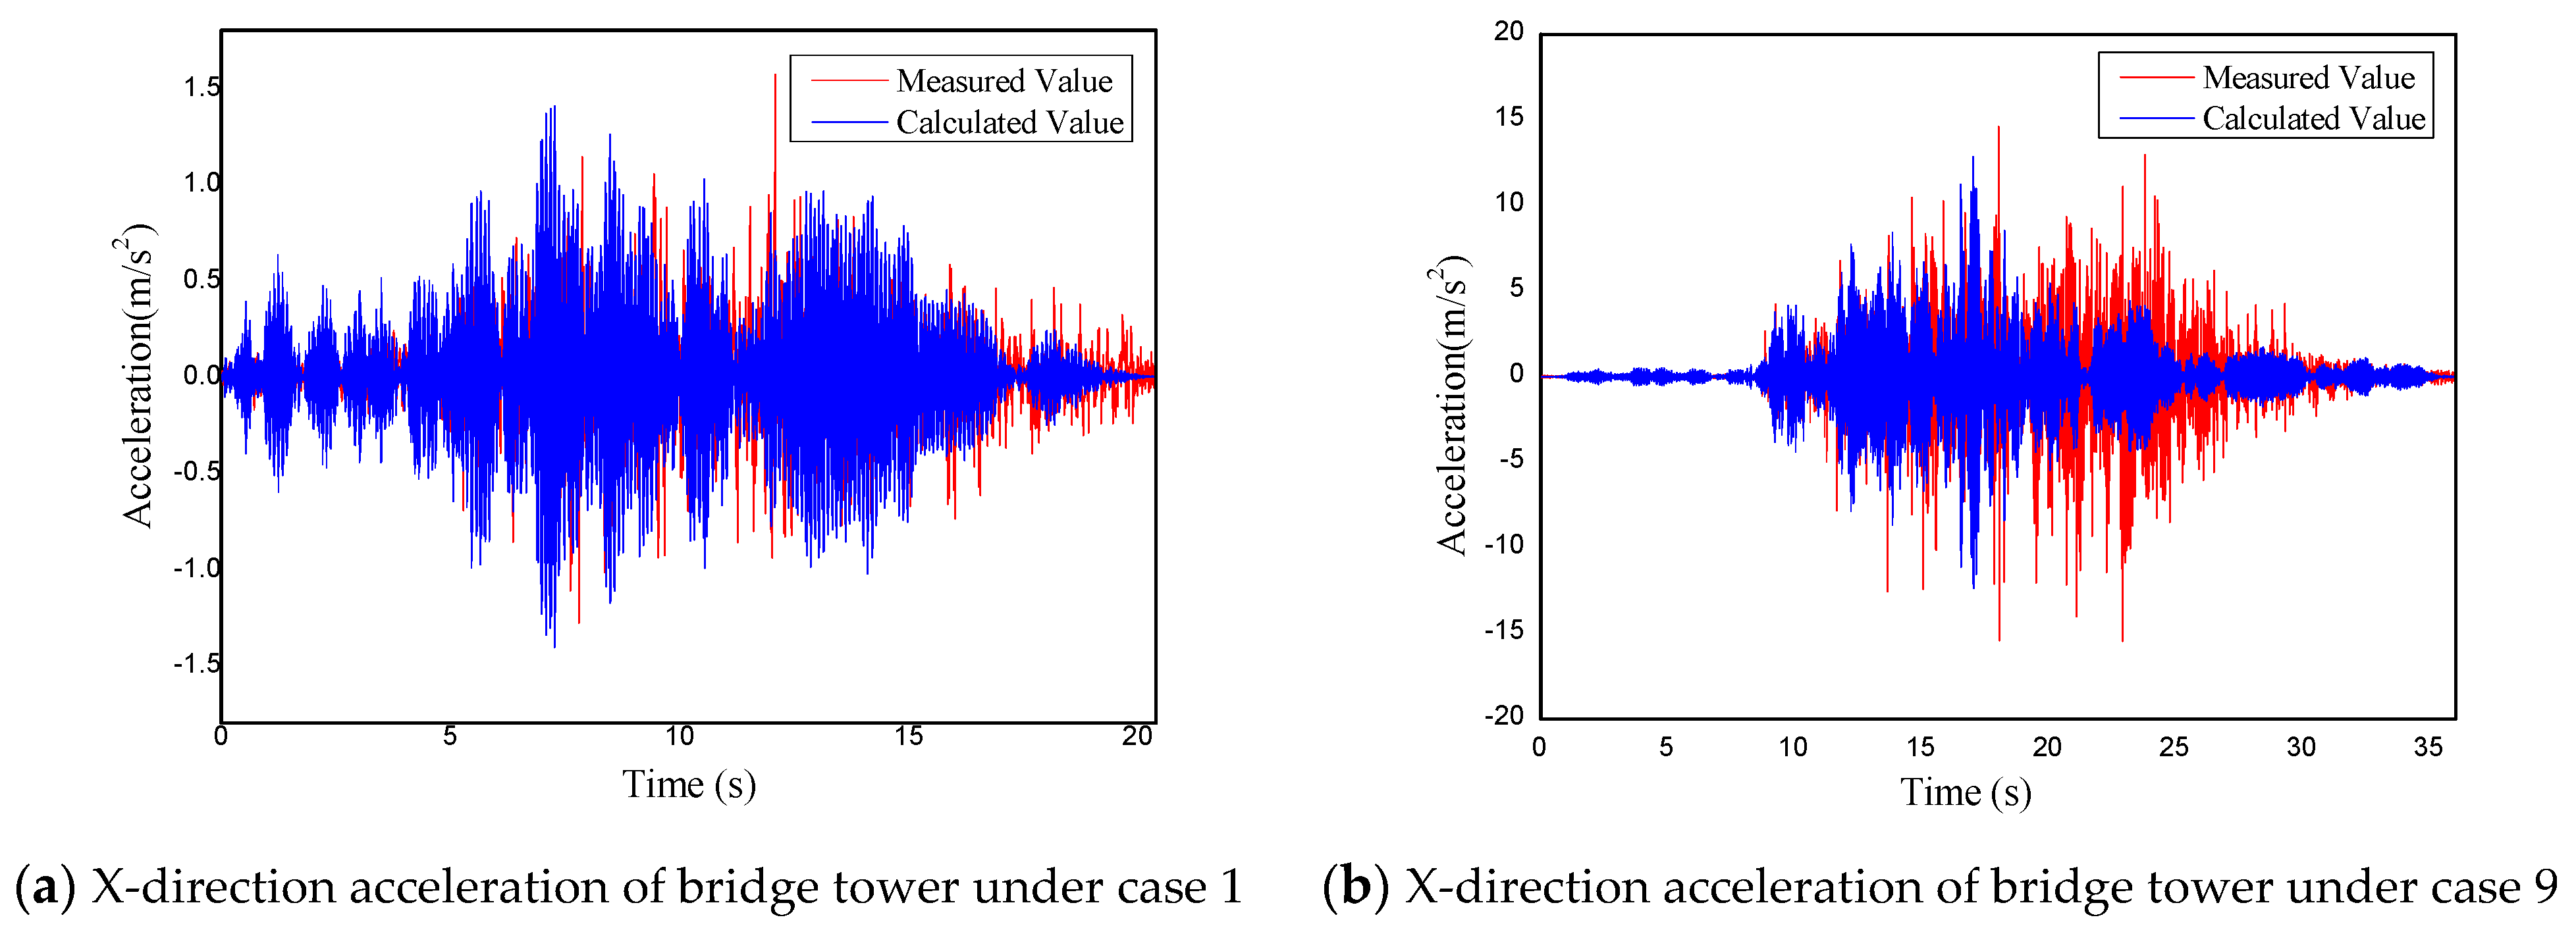
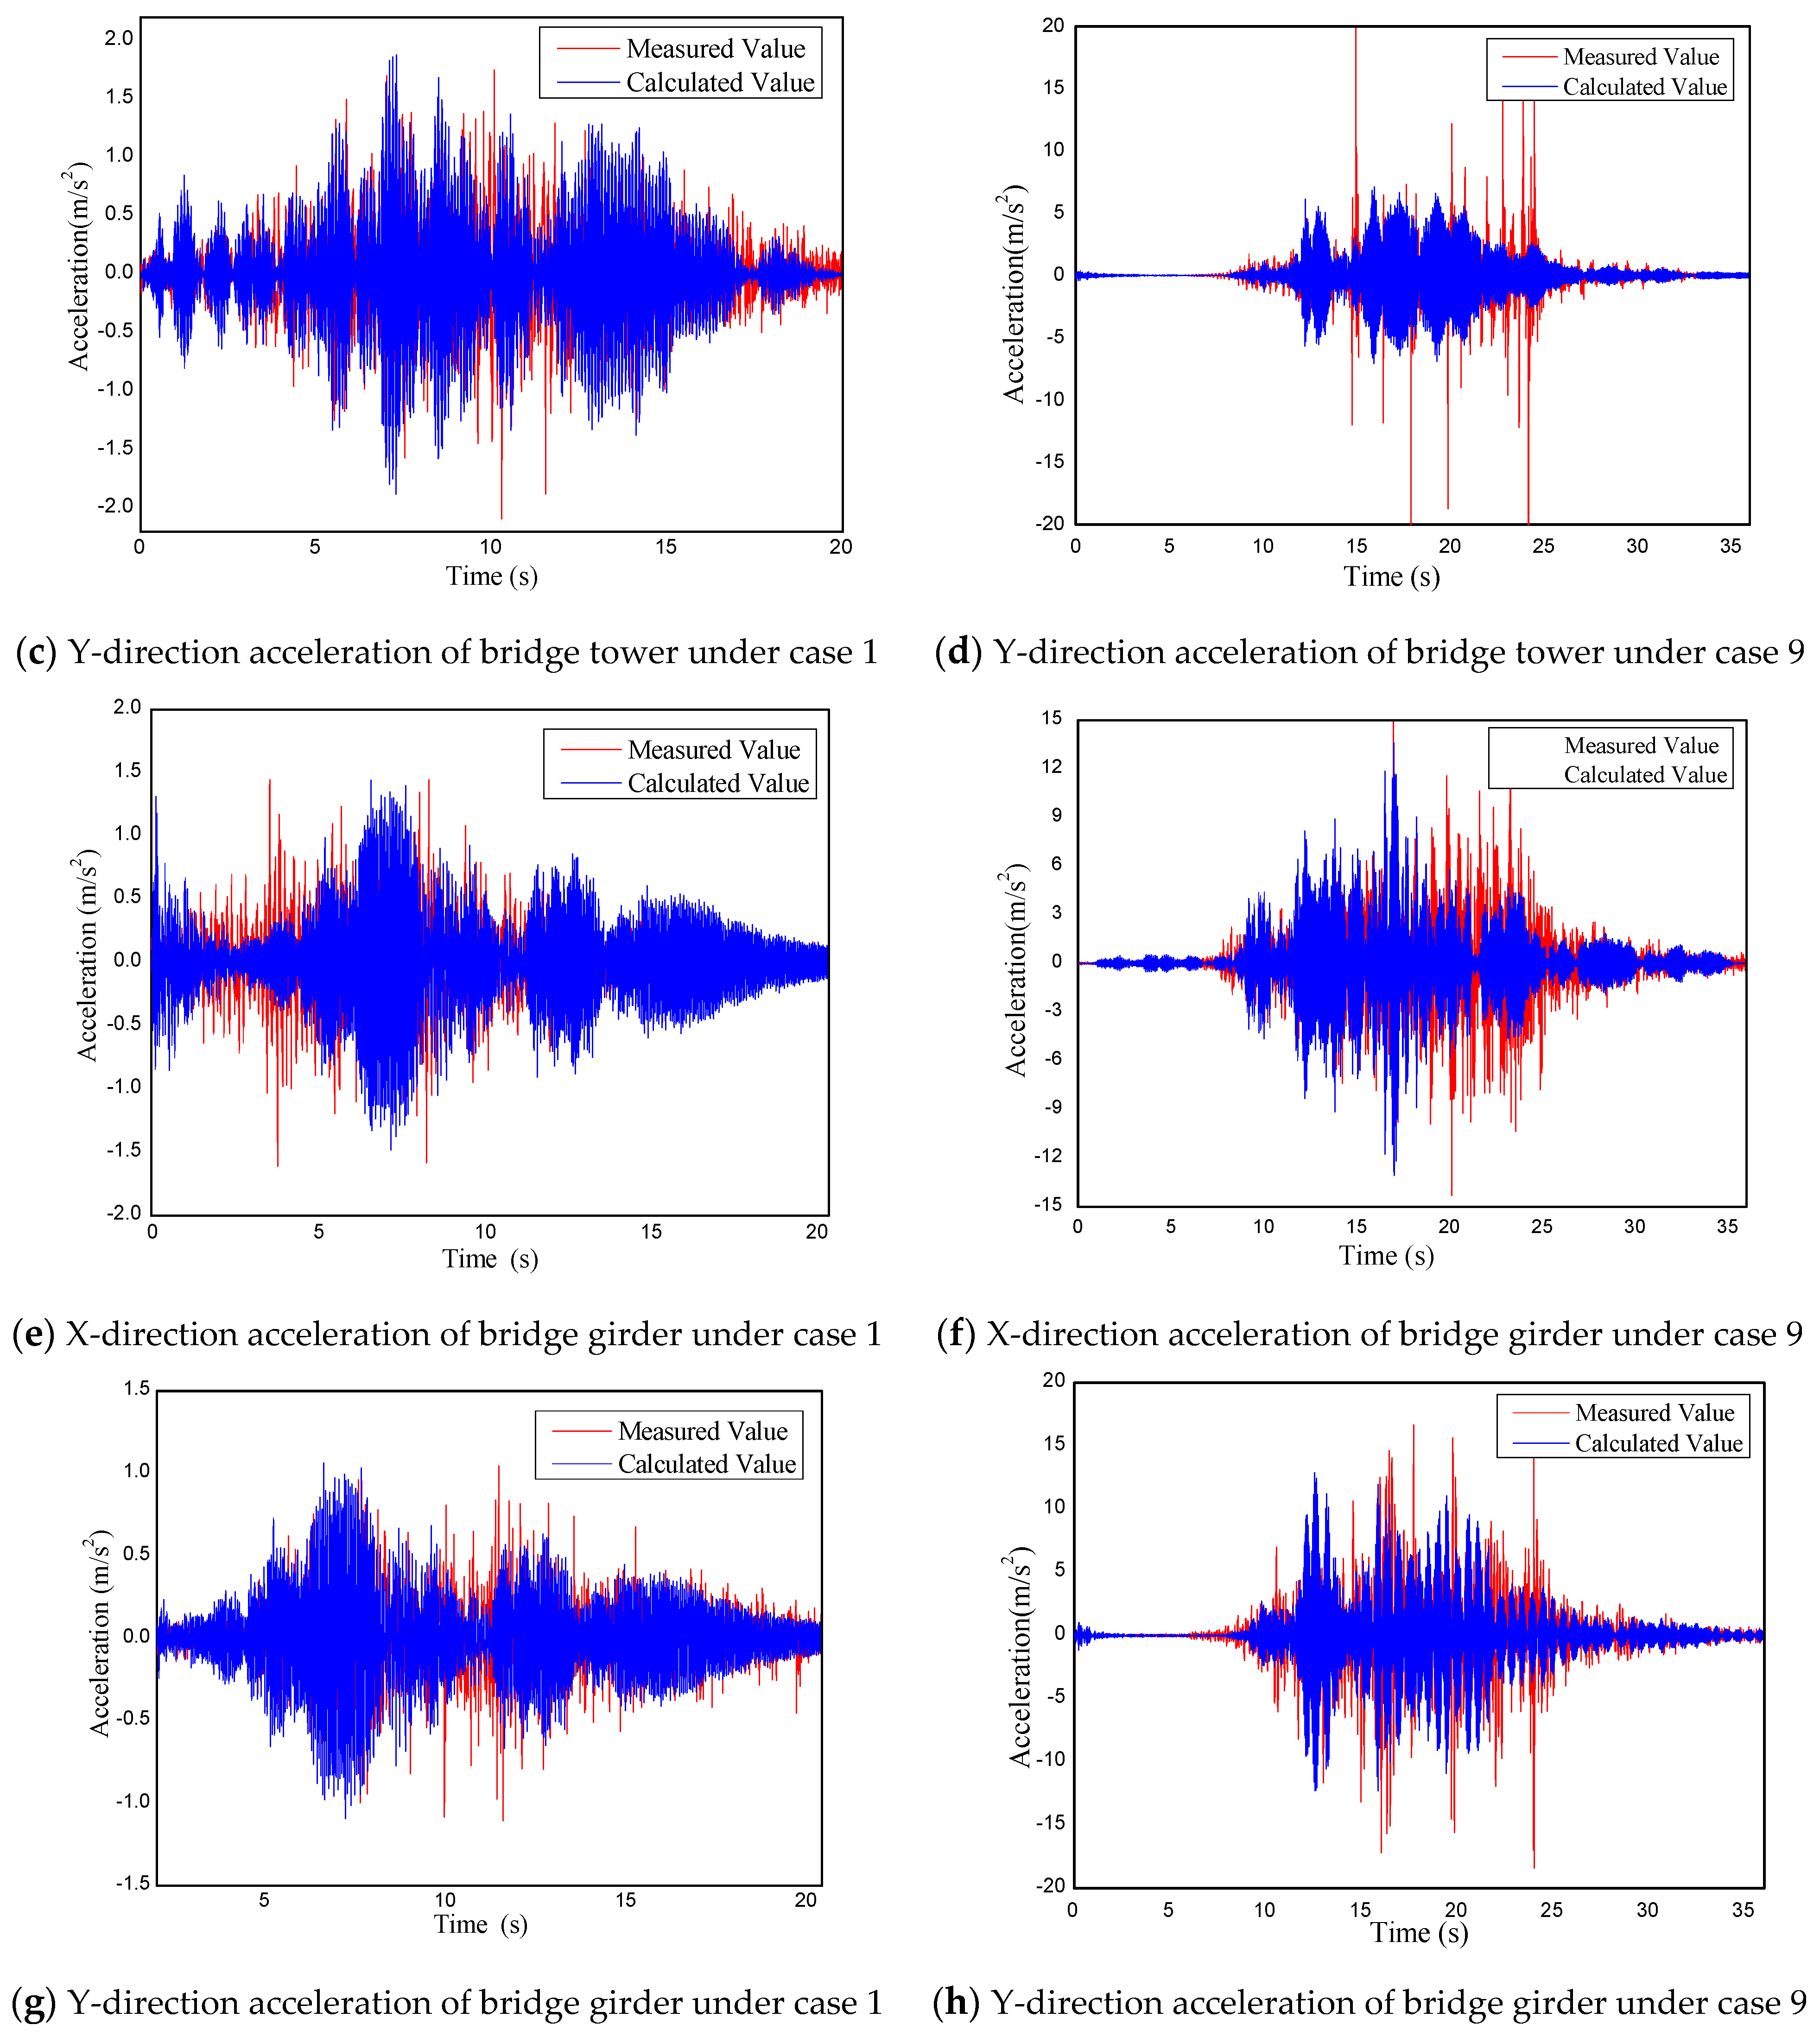
3.2. Nonlinear FEM Simulations
4. Damage Identification Using WNSVM
4.1. Damage Parameters Selection
4.2. Training and Testing of WNSVM for Damage Identification
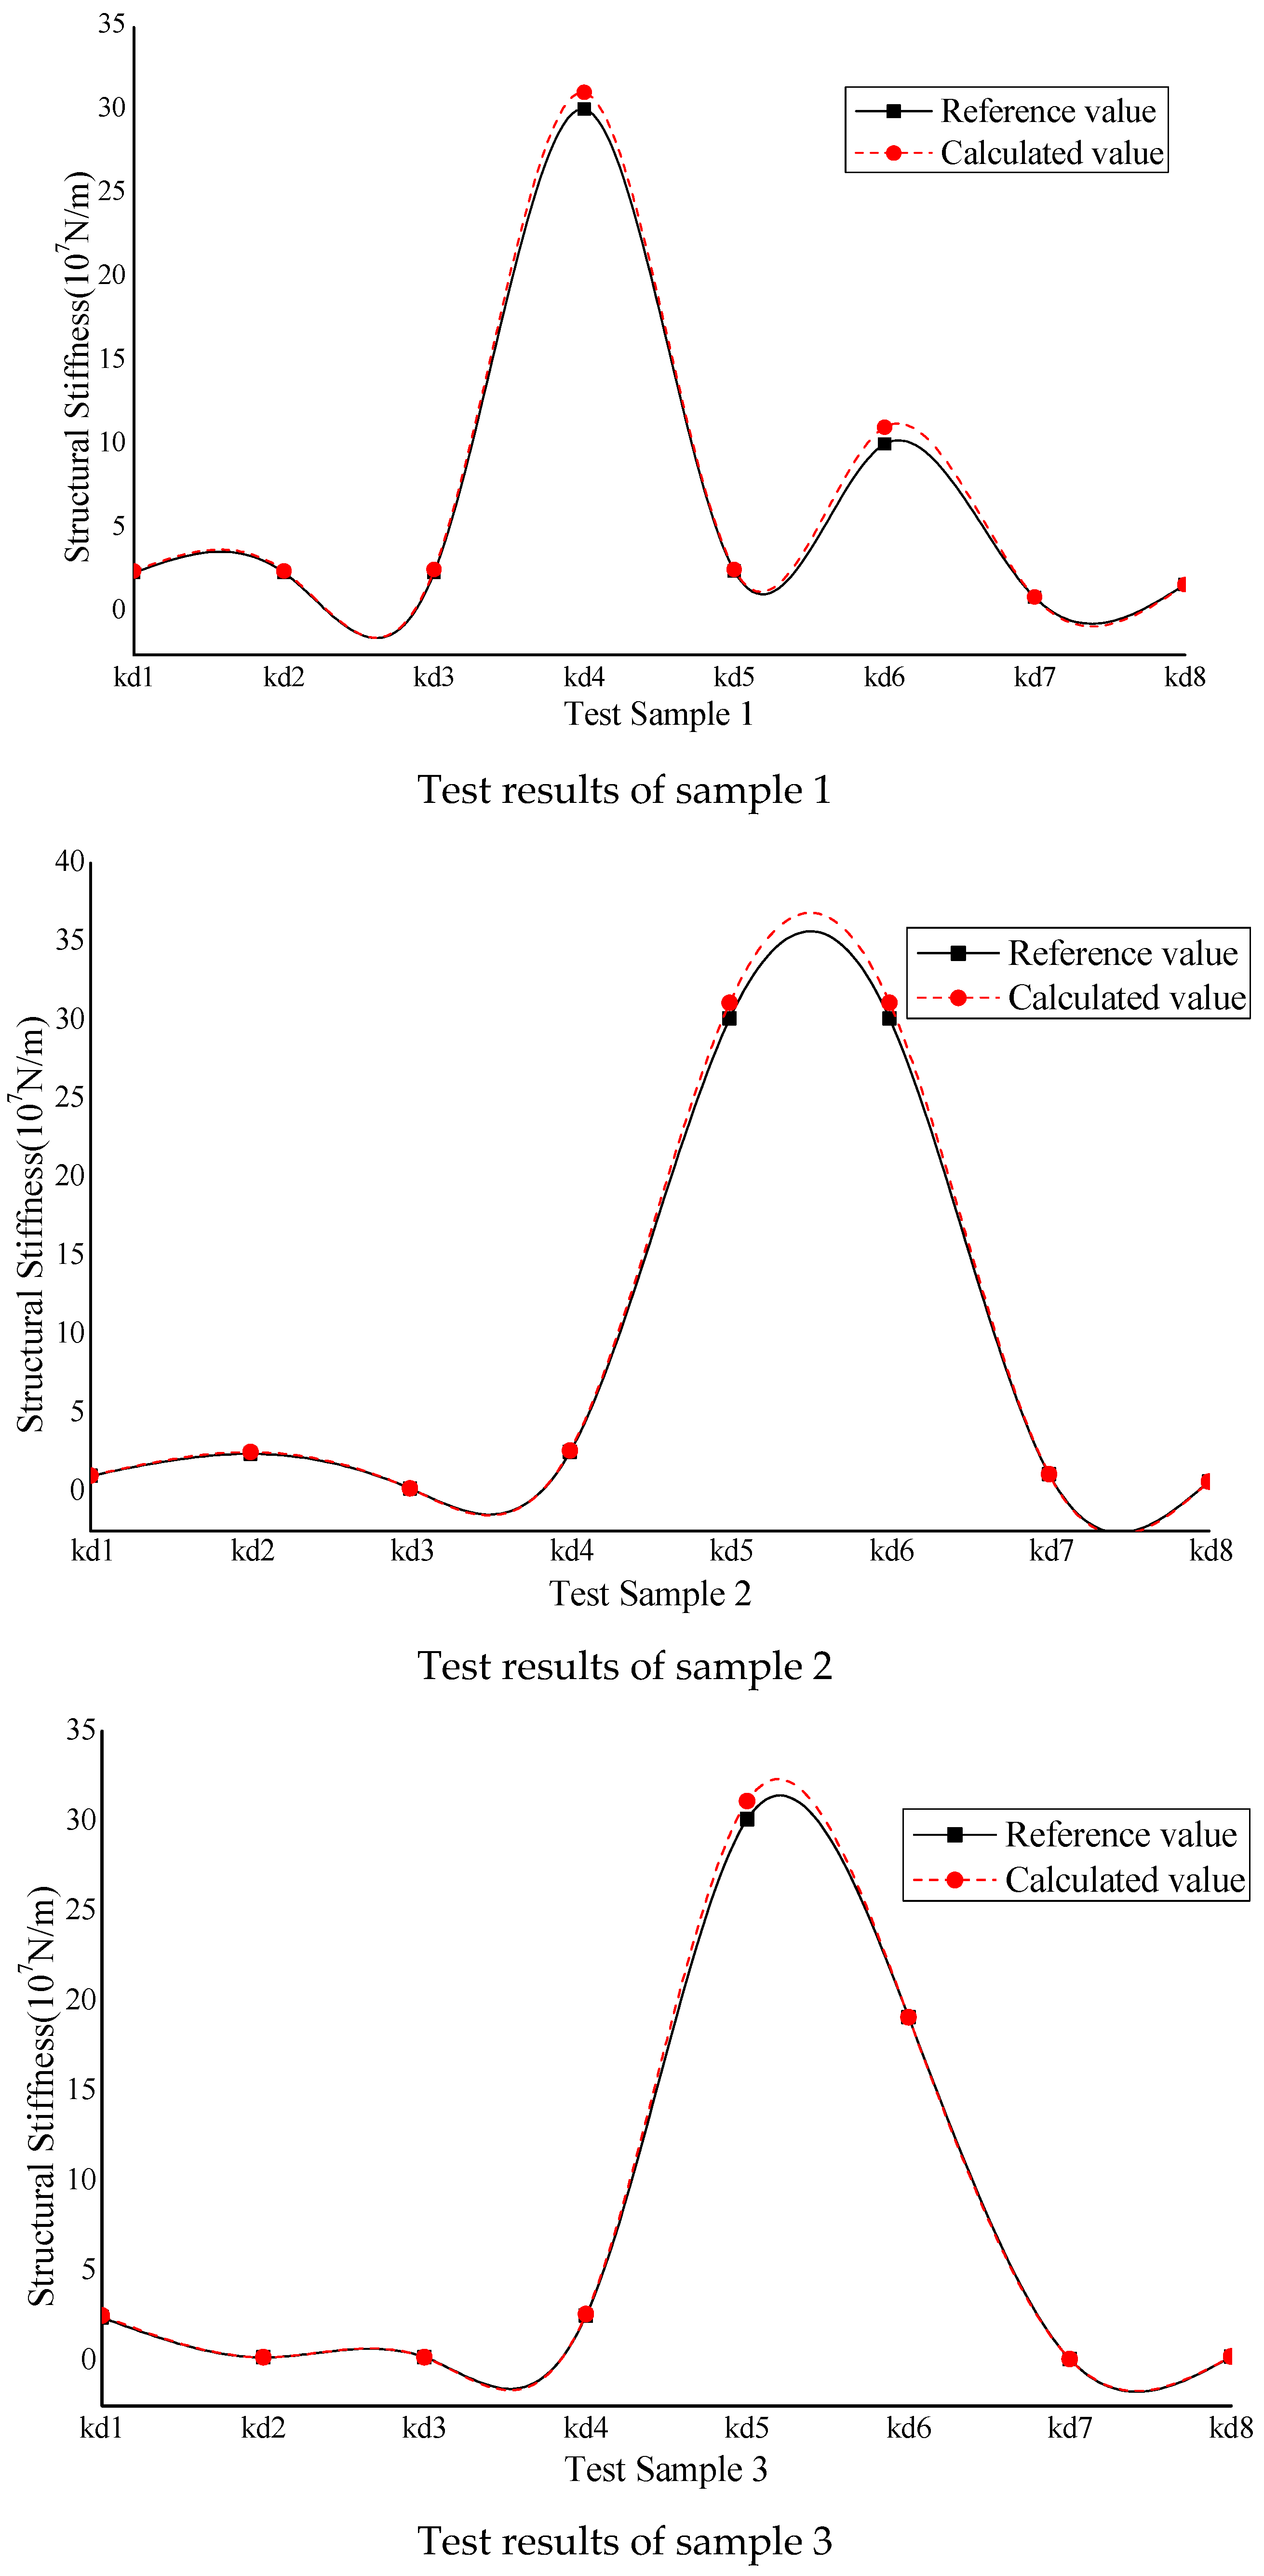
4.3. Seismic Damage Identification Based on WNSVM
5. Conclusions
- (1).
- The structure responses of single-tower cable-stayed bridge under earthquake excitations can be calculated based on the nonlinear FEM, the nonlinear FEM can correctly simulate the single-tower cable-stayed bridge model, and the learning samples of the WNSVM model in this study can be produced based on the nonlinear FEM.
- (2).
- The structural damage results identified by the WNSVM method are in good agreement with those obtained by the shaking table test, and the maximum error is less than 8%. Therefore, the WNSVM method can be used for the seismic damage identification of composite cable-stayed bridges.
Author Contributions
Funding
Institutional Review Board Statement
Informed Consent Statement
Data Availability Statement
Acknowledgments
Conflicts of Interest
References
- Sohn, H.; Farrar, C.R.; Hemez, F.M.; Shunk, D.D.; Daniel, W.S.; Nadler, B.R. A Review of Structural Health Monitoring Literature; Los Alamos National Laboratory Report LA-13976-MS; Los Alamos National Laboratory: Los Alamos, NM, USA, 2003. [Google Scholar]
- He, X.; Catbas, F.N.; Hattori, H.; Kawatani, M.; Furuta, H.; Hayashikawa, T.; Matsumoto, T. Bridge damage identification using vehicle-bridge interaction analysis and GA optimization, Safety, Reliability, Risk and Life-Cycle Performance of Structures and Infrastructures. In Proceedings of the 11th International Conference on Structural Safety and Reliability, ICOSSAR 2013, New York, NY, USA, 16–20 June 2013; pp. 4617–4624. [Google Scholar]
- Yeh, C.H.; Loh, C.H.; Tsai, K.C. Overview of Taiwan earthquake loss estimation system. Nat. Hazards 2006, 37, 23–37. [Google Scholar] [CrossRef]
- Pai, P.F.; Sundaresan, M.J. Space-wave number and time-frequency analysis for damage inspection of thin-walled structures. Struct. Health Monit. 2012, 11, 452–471. [Google Scholar] [CrossRef]
- Ou, J.; Li, H. Structural health monitoring in mainland china: Review and future trends. Struct. Health Monit. 2010, 9, 219–231. [Google Scholar]
- Cheng, M.Y.; Wu, Y.W. Multi-agent-based data exchange platform for bridge disaster prevention: A case study in Taiwan. Nat. Hazards 2013, 69, 311–326. [Google Scholar] [CrossRef]
- Xu, Z.; Lu, X.Z.; Guan, H.; Han, B.; Ren, A. Seismic damage simulation in urban areas based on a high-fidelity structural model and a physics engine. Nat. Hazards 2014, 71, 1679–1693. [Google Scholar] [CrossRef]
- Duzgun, H.S.B.; Yucemen, M.S.; Kalaycioglu, H.S. An integrated earthquake vulnerability assessment framework for an urban areas. Nat. Hazards 2011, 59, 917–947. [Google Scholar] [CrossRef]
- Richwalski, S.M.; Facke, A.; Parolai, S.; Stempniewski, L. Influence of Site and Source Dependent Ground Motion Scenarios on the Seismic Safety of Long-span Bridges in Cologne, Germany. Nat. Hazards 2006, 38, 237–246. [Google Scholar] [CrossRef]
- Lagaros, N.D.; Tsompanakis, Y.; Psarropoulos, P.N.; Georgopoulos, E.C. Computationally efficient seismic fragility analysis of geostructures. Comput. Struct. 2009, 87, 1195–1203. [Google Scholar] [CrossRef]
- Vafaei, M.; Adnan, A.; Abd, R.; Ahmad, B. A neuro-wavelet technique for seismic damage identification of cantilever structures. Struct. Infrastruct. Eng. 2014, 10, 1666–1684. [Google Scholar] [CrossRef]
- Hou, Z.; Noori, M.; Amand, R. Wavelet-based approach for structural damage detection. J. Eng. Mech. 2000, 126, 677–683. [Google Scholar] [CrossRef]
- Araújo, I.G.; Laier, J.E. Operational modal analysis using SVD of power spectral density transmissibility matrices. Mech. Syst. Signal Process. 2014, 46, 129–145. [Google Scholar] [CrossRef]
- Chiu, C.K.; Jean, W.Y.; Chuang, Y.T. Optimal design base shear forces for reinforced concrete buildings considering seismic reliability and life-cycle costs. J. Chin. Inst. Eng. 2013, 36, 458–470. [Google Scholar] [CrossRef]
- Chiu, C.K.; Noguchi, T.; Kanematsu, M. Optimal maintenance plan for RC members by minimizing lifecycle cost including deterioration risk due to carbonation. J. Adv. Concr. Technol. 2008, 6, 469–480. [Google Scholar] [CrossRef][Green Version]
- Chiu, C.K.; Lyu, Y.C.; Jean, W.Y. Probability-based damage assessment for reinforced concrete bridge columns considering the corrosive and seismic hazards in Taiwan. Nat. Hazards 2014, 71, 2143–2164. [Google Scholar] [CrossRef]
- Doebling, S.W.; Farrar, C.R.; Prime, M.B. Damage Identification and Health Monitoring of Structural and Mechanical Systems from Changes in Their Vibration Characteristics: A Literature Review; Report LA-13070-MS; Los Alamos National Laboratory: Los Alamos, NM, USA, 1996. [Google Scholar]
- Providakis, C.P.; Stefanaki, K.D.; Voutetaki, M.E.; Tsompanakis, Y.; Stavroulaki, M. Damage detection in concrete structures using a simultaneously activated multi-mode PZT active sensing system: Numerical modeling. Struct. Infrastruct. Eng. 2014, 10, 1451–1468. [Google Scholar] [CrossRef]
- Moyo, P.; Brownjohn, J.M.W.; Suresh, R.; Tjin, S.C. Development of fiber Bragg grating sensors for monitoring civil infrastructure. Eng. Struct 2005, 37, 1828–1834. [Google Scholar] [CrossRef]
- Pai, P.F.; Young, L.G.; Lee, S.Y. A Dynamics-Based Method for Crack Detection and Estimation. Struct. Health Monit. 2005, 4, 5–25. [Google Scholar] [CrossRef]
- Kim, C.W.; Kawatani, M. Pseudo-static approach for damage identification of bridges based on coupling vibration with a moving vehicle. Struct. Infrastruct. Eng. 2008, 4, 371–379. [Google Scholar] [CrossRef]
- Park, S.; Stubbs, N.; Bolton, R.; Choi, S.; Sikorsky, C. Field verification of the damage index method in a concrete box-girder bridge via visual inspection. Comput. -Aided Civ. Infrastruct. Eng. 2001, 16, 58–70. [Google Scholar] [CrossRef]
- Niu, J.; Zong, Z.H.; Chu, F.P. Damage identification method of girder bridges based on finite element model updating and modal strain energy. Sci. China Technol. Sci. 2015, 58, 126–138. [Google Scholar] [CrossRef]
- Li, H.; Bao, Y.Q.; Ou, J.P. Structural damage identification based on integration of information fusion and shannon entropy. Mech. Syst. Signal Process. 2008, 22, 1427–1440. [Google Scholar] [CrossRef]
- Li, J.; Hao, H. Damage detection of shear connectors under moving loads with relative displacement measurements. Mech. Syst. Signal Process. 2015, 60, 124–150. [Google Scholar] [CrossRef]
- Bayissa, W.L.; Haritos, N.; Thelandersson, S. Vibration-based structural damage identification using wavelet transform. Mech. Syst. Signal Process. 2008, 22, 1194–1215. [Google Scholar] [CrossRef]
- Moaveni, B.; He, X.; Conte, J.P.; De Callafon, R.A. Damage identification of a composite beam using finite element model updating. Comput. -Aided Civ. Infrastruct. Eng. 2008, 23, 339–359. [Google Scholar] [CrossRef]
- Ding, Y.L.; Li, A.Q.; Du, D.S.; Liu, T. Multi-scale damage analysis for a steel box girder of a long-span cable-stayed bridge. Struct. Infrastruct. Eng. 2010, 6, 725–739. [Google Scholar] [CrossRef]
- Oberkampf, W.L.; Roy, C.J. Verification and Validation in Scientific Computing; Cambridge University Press: London, UK, 2010. [Google Scholar]
- Zhong, R.M.; Zong, Z.H.; Liu, Q.Q.; Zhou, H.F. A Multiscale Finite Element Model Validation Method of Composite Cable-Stayed Bridge Based on Structural Health Monitoring System. Shock. Vib. 2015, 22, 601–612. [Google Scholar] [CrossRef]
- Zhong, R.; Zong, Z.; Niu, J.; Liu, Q.; Zheng, P. A multiscale finite element model validation method of composite cable-stayed bridge based on Probability Box theory. J. Sound Vib. 2016, 370, 111–131. [Google Scholar] [CrossRef]
- Figueiredo, E.; Figueiras, J.; Park, G.; Farrar, C.R.; Worden, K. Influence of the autoregressive model order on damage detection. Comput. -Aided Civ. Infrastruct. Eng. 2011, 26, 225–238. [Google Scholar] [CrossRef]
- Reich, Y. Machine learning techniques for civil engineering problems. Comput. -Aided Civ. Infrastruct. Eng. 1997, 12, 295–310. [Google Scholar] [CrossRef]
- Avci, O.; Abdeljaber, O.; Kiranyaz, S. Structural Damage Detection in Civil Engineering with Machine Learning: Current State of the Art. Sens. Instrum. Aircr./Aerosp. Energy Harvest. Dyn. Environ. Test. 2022, 7, 223–229. [Google Scholar]
- Yuan, X.; Chen, G.; Jiao, P.; Li, L.; Han, J.; Zhang, H. A neural network-based multivariate seismic classifier for simultaneous post-earthquake fragility estimation and damage classification. Eng. Struct. 2022, 255, 113918. [Google Scholar] [CrossRef]
- Zhong, J.; Shi, L.; Yang, T.; Liu, X.; Wang, Y. Probabilistic seismic demand model of UBPRC columns conditioned on Pulse-Structure parameters. Eng. Struct. 2022, 270, 114829. [Google Scholar] [CrossRef]
- Zhong, J.; Ni, M.; Hu, H.; Yuan, W.; Yuan, H.; Pang, Y. Uncoupled multivariate power models for estimating performance-based seismic damage states of column curvature ductility. Structures 2022, 36, 752–764. [Google Scholar] [CrossRef]
- Yang, T.; Yuan, X.; Zhong, J.; Yuan, W. Near-fault Pulse Seismic Ductility Spectra for Bridge Columns Based on Machine Learning. Soil Dyn. Earthq. Eng. 2023, 164, 107582. [Google Scholar] [CrossRef]
- Duan, W.; Congress SS, C.; Cai, G.; Liu, S.; Dong, X.; Chen, R.; Liu, X. A hybrid GMDH neural network and logistic regression framework for state parameter–based liquefaction evaluation. Can. Geotech. J. 2021, 99, 1801–1811. [Google Scholar] [CrossRef]
- Duan, W.; Zhao, Z.; Cai, G.; Pu, S.; Liu, S.; Dong, X. Evaluating model uncertainty of an in situ state parameter-based simplified method for reliability analysis of liquefaction potential. Comput. Geotech. 2022, 151, 104957. [Google Scholar] [CrossRef]
- González-Pérez, C.; Valdés-González, J. Identification of structural damage in a vehicular bridge using artificial neural networks. Struct. Health Monit. 2011, 10, 33–48. [Google Scholar] [CrossRef]
- Jack, L.B.; Nandi, A.K. Fault detection using support vector machines and artificial neural networks augmented by genetic algorithms. Mech. Syst. Signal Process. 2002, 16, 373–390. [Google Scholar] [CrossRef]
- Jack, L.B.; Nandi, A.K. Genetic algorithms for feature extraction in machine condition monitoring with vibration signals. IEEE Proc. Vis. Image Signal Process. 2002, 14, 205–212. [Google Scholar]
- Samanta, B.; Al-Balushi, K.R.; Al-Araimi, S.A. Artificial neural networks and support vector machines with genetic algorithm for bearing fault detection. Eng. Appl. Artif. Intell. 2003, 16, 657–665. [Google Scholar] [CrossRef]
- Huang, X.; Zhang, L.; Li, P. A multiscale feature fusion approach for classification of very high resolution satellite imagery based on wavelet transform. Int. J. Remote Sens. 2008, 29, 5923–5941. [Google Scholar] [CrossRef]
- Sarp, G.; Erener, A.; Duzgun, S.; Sahin, K. An approach for detection of buildings and changes in buildings using orthophotos and point clouds: A case study of Van Ercis earthquake. Eur. J. Remote Sens. 2014, 47, 627–642. [Google Scholar] [CrossRef]
- Kim, Y.; Chong, J.W.; Chong, K.H.; Kim, J.M. Wavelet-based AR–SVM for health monitoring of smart structures. Smart Mater. Struct. 2013, 22, 015003. [Google Scholar] [CrossRef]
- Zhang, Q. Using wavelet network in nonparametric estimation. IEEE Trans. Neural Netw. 1997, 8, 227–236. [Google Scholar] [CrossRef]
- Catbas, N.; Gokce, H.B.; Frangopol, D.M. Predictive analysis by incorporating uncertainty through a family of models calibrated with structural health monitoring data. J. Eng. Mech. 2013, 139, 712–723. [Google Scholar] [CrossRef]
- Patil, S.G.; Mandal, S.; Hegde, A.V. Genetic algorithm based support vector machine regression in predicting wave transmission of horizontally inter-laced multi-layer moored floating pipe breakwater. Adv. Eng. Softw. 2012, 45, 203–212. [Google Scholar] [CrossRef]
- Zhong, R.M.; Zong, Z.H.; Niu, J.; Yuan, S.J. A damage prognosis method of girder structures based on wavelet neural networks. Math. Probl. Engineering. 2014, 2014, 1188–1199. [Google Scholar] [CrossRef]
- Vapnik, V.N. Estimation of Dependences Based on Empirical Data; Springer: Berlin/Heidelberg, Germany, 1982. [Google Scholar]
- Can, D.; Xu, J.; Xu, L. ISHM-based intelligent fusion prognostics for space avionics. Aerosp. Sci. Technol. 2013, 29, 200–205. [Google Scholar]
- Chopra, A.K. Dynamics of Structures: Theory and Applications to Earthquake Engineering, 2nd ed.; Prentice Hall: Upper Saddle River, NJ, USA, 2001. [Google Scholar]
- Sake, O.S. A Computer Program for Inelastic Response of R/C Frames to Earthquakes; UILU-Eng-74-2029; University of Illinois, Urbana-Champaign: Champaign, IL, USA, 1974. [Google Scholar]
- Huang, X.Y.; Zong, Z.H.; Li, Y.L.; Xia, Z.H. Nonlinear Dynamic Response Analysis of Cable-stayed Bridge with Single Tower under Strong Earthquake Excitations. J. Southeast Univ. 2015, 45, 354–359. [Google Scholar]
- Lautour, O.R.; Omenzetter, P. Prediction of seismic-induced structural damage using artificial neural networks. Eng. Struct. 2009, 31, 600–606. [Google Scholar] [CrossRef]
- Ni, Y.Q.; Zhou, X.T.; Ko, J.M. Experimental investigation of seismic damage identification using PCA-compressed frequency response functions and neural networks. J. Sound Vib. 2006, 29, 242–263. [Google Scholar] [CrossRef]
- Mohammadreza, V.; Azlan, A.; Ahmad, B.; Abd, R. Real-time Seismic Damage Detection of Concrete Shear Walls Using Artificial Neural Networks. J. Earthq. Eng. 2012, 17, 137–154. [Google Scholar]


| Case | Seismic Waves | Peak Ground Acceleration (m/s2) | Damage Descriptions | |
|---|---|---|---|---|
| X-Direction | Y-Direction | |||
| 1 | Lander-amboy | 0.5 | 0.394 | No obvious cracks |
| 2 | Cerro Prieto | 0.5 | 0.538 | No obvious cracks |
| 3 | Chi-chi | 0.5 | 0.495 | No obvious cracks |
| 4 | El-Centro | 0.5 | 0.308 | No obvious cracks |
| 5 | Cerro Prieto | 1 | 1.076 | Minor cracks in X-direction support |
| 6 | El-Centro | 2 | 1.23 | Lots of cracks in X-direction support |
| 7 | Chi-chi | 2 | 1.98 | Lots of cracks in X-direction support |
| 8 | El-Centro | 3 | 2.818 | Lots of cracks in X-direction support, Minor cracks in Y-direction support and stay cable anchor block |
| 9 | Chi-chi | 3 | 2.951 | Lots of cracks in X-direction and Y-direction support, Minor cracks in stay cable anchor block and bridge tower |
| 10 | Chi-chi | 4 | 5.981 | lots of major cracks appeared |
| Structural Stiffness | k1, k2, k3 (N/m) | k4, k5, k6 (N/m) | k7 (N/m) | k8 (N/m) |
|---|---|---|---|---|
| Stiffness of Support in x Direction | Stiffness of Support in y Direction | Stiffness of Bridge Tower in y Direction | Stiffness of Bridge Tower in x Direction | |
| initial values | 2 × 10⁶ | 2.5 × 10⁷ | 9.32 × 10⁵ | 2.39 × 10⁶ |
| Samples | 1 | 2 | 3 | … | 161 | 162 | 163 | ||
|---|---|---|---|---|---|---|---|---|---|
| Case | 0.05 g Lander-Amboy | 0.05 g Cerro Prieto | 0.05 g EL-Centro | 0.05 g Cerro Prieto | 0.05 g EL-Centro | 0.05 g Chi-Chi | |||
| K(N/m) | Support | k1 | 2.0 × 10⁷ | 2.0 × 10⁷ | 2.0 × 10⁷ | … | 2.0 × 10⁷ | 2.0 × 10⁷ | 2.0 × 10⁷ |
| k2 | 2.0 × 10⁷ | 2.0 × 10⁷ | 2.0 × 10⁷ | … | 2.0 × 10⁷ | 2.0 × 10⁷ | 2.0 × 10⁷ | ||
| k3 | 2.0 × 10⁷ | 2.0 × 10⁷ | 2.0 × 10⁷ | … | 2.0 × 10⁷ | 2.0 × 10⁷ | 2.0 × 10⁷ | ||
| k4 | 2.5 × 10⁸ | 2.5 × 10⁸ | 2.5 × 10⁸ | … | 2.5 × 10⁸ | 2.5 × 10⁸ | 2.5 × 10⁸ | ||
| k5 | 2.5 × 10⁸ | 2.5 × 10⁸ | 2.5 × 10⁸ | … | 2.5 × 10⁸ | 2.5 × 10⁸ | 2.5 × 10⁸ | ||
| k6 | 2.5 × 10⁸ | 2.5 × 10⁸ | 2.5 × 10⁸ | … | 2.5 × 10⁸ | 2.5 × 10⁸ | 2.5 × 10⁸ | ||
| Bridge tower | k7 | 9.3 × 10⁶ | 9.3 × 10⁶ | 9.3 × 10⁶ | … | 9.3 × 10⁶ | 9.3 × 10⁶ | 9.3 × 10⁶ | |
| k8 | 2.4 × 10⁷ | 2.4 × 10⁷ | 2.4 × 10⁷ | … | 2.4 × 10⁷ | 2.4 × 10⁷ | 2.4 × 10⁷ | ||
| Kd(N/m) | Support | kd1 | 2.4 × 10⁷ | 1.0 × 10⁷ | 2.4 × 10⁷ | … | 1.3 × 10⁷ | 2.4 × 10⁷ | 2.4 × 10⁷ |
| kd2 | 2.0 × 10⁶ | 2.4 × 10⁷ | 2.4 × 10⁷ | … | 2.0 × 10⁷ | 2.4 × 10⁷ | 2.0 × 10⁶ | ||
| kd3 | 1.3 × 10⁷ | 2.0 × 10⁶ | 2.4 × 10⁷ | … | 2.4 × 10⁷ | 2.4 × 10⁷ | 2.0 × 10⁶ | ||
| kd4 | 3.0 × 10⁸ | 2.5 × 10⁷ | 3.0 × 10⁸ | … | 2.5 × 10⁷ | 2.5 × 10⁷ | 2.5 × 10⁷ | ||
| kd5 | 2.5 × 10⁷ | 3.0 × 10⁸ | 2.5 × 10⁷ | … | 6.5 × 10⁷ | 3.0 × 10⁸ | 3.0 × 10⁸ | ||
| kd6 | 2.5 × 10⁷ | 3.0 × 10⁸ | 1.0 × 10⁸ | … | 1.4 × 10⁷ | 1.2 × 10⁸ | 1.9 × 10⁸ | ||
| Bridge tower | kd7 | 9.3 × 10⁵ | 1.1 × 10⁷ | 9.4 × 10⁶ | … | 1.1 × 10⁷ | 1.1 × 10⁷ | 9.3 × 10⁵ | |
| kd8 | 2.9 × 10⁷ | 6.3 × 10⁶ | 1.7 × 10⁷ | … | 1.1 × 10⁷ | 2.8 × 10⁷ | 2.4 × 10⁶ | ||
| A (m/s2) | Support | a1 | 0.43 | 0.34 | 0.31 | … | 0.34 | 0.31 | 0.40 |
| a2 | 0.43 | 0.34 | 0.31 | … | 0.34 | 0.31 | 0.40 | ||
| a3 | 0.32 | 0.25 | 0.23 | … | 0.25 | 0.23 | 0.30 | ||
| a4 | 0.21 | 0.26 | 0.08 | … | 0.26 | 0.08 | 0.11 | ||
| a5 | 0.21 | 0.26 | 0.08 | … | 0.26 | 0.08 | 0.11 | ||
| a6 | 0.18 | 0.22 | 0.07 | … | 0.22 | 0.07 | 0.10 | ||
| Bridge tower | a7 | 0.62 | 0.48 | 0.45 | … | 0.48 | 0.45 | 0.58 | |
| a8 | 0.98 | 1.21 | 0.38 | … | 1.21 | 0.38 | 0.52 | ||
| Ad(m/s2) | Support | ad1 | 0.40 | 0.52 | 0.19 | … | 0.50 | 0.21 | 0.27 |
| ad2 | 2.24 | 0.26 | 0.24 | … | 0.34 | 0.23 | 1.71 | ||
| ad3 | 0.40 | 1.08 | 0.22 | … | 0.74 | 0.24 | 1.51 | ||
| ad4 | 0.16 | 0.83 | 0.06 | … | 0.83 | 0.43 | 0.35 | ||
| ad5 | 0.76 | 0.26 | 0.35 | … | 0.22 | 0.08 | 0.08 | ||
| ad6 | 0.92 | 0.14 | 0.07 | … | 0.24 | 0.12 | 0.10 | ||
| Bridge tower | ad7 | 2.85 | 0.36 | 0.45 | … | 0.36 | 0.34 | 3.62 | |
| ad8 | 0.89 | 3.75 | 0.39 | … | 3.19 | 0.39 | 1.62 | ||
| Samples | 1 | 2 | 3 | Samples | 1 | 2 | 3 | Samples | 1 | 2 | 3 |
|---|---|---|---|---|---|---|---|---|---|---|---|
| k1 | 2.0 × 10⁷ | 2.0 × 10⁷ | 2.0 × 10⁷ | a1 | 0.31 | 0.34 | 0.40 | ad1 | 0.19 | 0.52 | 0.27 |
| k2 | 2.0 × 10⁷ | 2.0 × 10⁷ | 2.0 × 10⁷ | a2 | 0.31 | 0.34 | 0.40 | ad2 | 0.24 | 0.26 | 1.71 |
| k3 | 2.0 × 10⁷ | 2.0 × 10⁷ | 2.0 × 10⁷ | a3 | 0.23 | 0.25 | 0.30 | ad3 | 0.22 | 1.08 | 1.51 |
| k4 | 2.5 × 10⁸ | 2.5 × 10⁸ | 2.5 × 10⁸ | a4 | 0.08 | 0.26 | 0.11 | ad4 | 0.06 | 0.83 | 0.35 |
| k5 | 2.5 × 10⁸ | 2.5 × 10⁸ | 2.5 × 10⁸ | a5 | 0.08 | 0.26 | 0.11 | ad5 | 0.35 | 0.26 | 0.08 |
| k6 | 2.5 × 10⁸ | 2.5 × 10⁸ | 2.5 × 10⁸ | a6 | 0.07 | 0.22 | 0.10 | ad6 | 0.07 | 0.14 | 0.10 |
| k7 | 9.3 × 10⁶ | 9.3 × 10⁶ | 9.3 × 10⁶ | a7 | 0.45 | 0.48 | 0.58 | ad7 | 0.45 | 0.36 | 3.62 |
| k8 | 2.4 × 10⁷ | 2.4 × 10⁷ | 2.4 × 10⁷ | a8 | 0.38 | 1.21 | 0.52 | ad8 | 0.39 | 3.75 | 1.62 |
| Samples | 1 | 2 | 3 | ||||||
|---|---|---|---|---|---|---|---|---|---|
| Reference Value | Calculated Value | Error (%) | Reference Value | Calculated Value | Error (%) | Reference Value | Calculated Value | Error (%) | |
| kd1 | 2.4 × 10⁷ | 2.5 × 10⁷ | 3.52 | 1.0 × 10⁷ | 1.0 × 10⁷ | 1.37 | 2.4 × 10⁷ | 2.5 × 10⁷ | 5.13 |
| kd2 | 2.4 × 10⁷ | 2.5 × 10⁷ | 2.66 | 2.4 × 10⁷ | 2.5 × 10⁷ | 3.15 | 2.0 × 10⁶ | 2.1 × 10⁶ | 5.83 |
| kd3 | 2.4 × 10⁷ | 2.6 × 10⁷ | 6.83 | 2.0 × 10⁶ | 2.0 × 10⁶ | 2.33 | 2.0 × 10⁶ | 2.1 × 10⁶ | 3.14 |
| kd4 | 3.0 × 10⁸ | 3.1 × 10⁸ | 4.18 | 2.5 × 10⁷ | 2.6 × 10⁷ | 5.67 | 2.5 × 10⁷ | 2.6 × 10⁷ | 2.25 |
| kd5 | 2.5 × 10⁷ | 2.6 × 10⁷ | 2.35 | 3.0 × 10⁸ | 3.1 × 10⁸ | 4.35 | 3.0 × 10⁸ | 3.1 × 10⁸ | 3.64 |
| kd6 | 1.0 × 10⁸ | 1.1 × 10⁸ | 7.24 | 3.0 × 10⁸ | 3.1 × 10⁸ | 3.15 | 1.9 × 10⁸ | 1.9 × 10⁸ | 1.29 |
| kd7 | 9.4 × 10⁶ | 9.6 × 10⁶ | 1.37 | 1.1 × 10⁷ | 1.1 × 10⁷ | 1.23 | 9.3 × 10⁵ | 9.5 × 10⁵ | 1.55 |
| kd8 | 1.7 × 10⁷ | 1.7 × 10⁷ | 2.14 | 6.3 × 10⁶ | 6.4 × 10⁶ | 0.87 | 2.4 × 10⁶ | 2.4 × 10⁶ | 0.56 |
| Case | 1 | 2 | 3 | 4 | 5 | 6 | 7 | 8 | 9 | 10 |
|---|---|---|---|---|---|---|---|---|---|---|
| k1 | 2.0 × 10⁷ | 2.0 × 10⁷ | 2.0× 10⁷ | 2.0 × 10⁷ | 2.0 × 10⁷ | 2.0 × 10⁷ | 2.0 × 10⁷ | 2.0 × 10⁷ | 2.0 × 10⁷ | 2.0 × 10⁷ |
| k2 | 2.0 × 10⁷ | 2.0 × 10⁷ | 2.0 × 10⁷ | 2.0 × 10⁷ | 2.0 × 10⁷ | 2.0 × 10⁷ | 2.0 × 10⁷ | 2.0 × 10⁷ | 2.0 × 10⁷ | 2.0 × 10⁷ |
| k3 | 2.0 × 10⁷ | 2.0 × 10⁷ | 2.0 × 10⁷ | 2.0 × 10⁷ | 2.0 × 10⁷ | 2.0 × 10⁷ | 2.0 × 10⁷ | 2.0 × 10⁷ | 2.0 × 10⁷ | 2.0 × 10⁷ |
| k4 | 2.5 × 10⁷ | 2.5 × 10⁷ | 2.5 × 10⁷ | 2.5 × 10⁷ | 2.5 × 10⁷ | 2.5 × 10⁷ | 2.5 × 10⁷ | 2.5 × 10⁷ | 2.5 × 10⁷ | 2.5 × 10⁷ |
| k5 | 2.5 × 10⁷ | 2.5 × 10⁷ | 2.5 × 10⁷ | 2.5 × 10⁷ | 2.5 × 10⁷ | 2.5 × 10⁷ | 2.5 × 10⁷ | 2.5 × 10⁷ | 2.5 × 10⁷ | 2.5 × 10⁷ |
| k6 | 2.5 × 10⁷ | 2.5 × 10⁷ | 2.5 × 10⁷ | 2.5 × 10⁷ | 2.5 × 10⁷ | 2.5 × 10⁷ | 2.5 × 10⁷ | 2.5 × 10⁷ | 2.5 × 10⁷ | 2.5 × 10⁷ |
| k7 | 9.3 × 10⁶ | 9.3 × 10⁶ | 9.3 × 10⁶ | 9.3 × 10⁶ | 9.3 × 10⁶ | 9.3 × 10⁶ | 9.3 × 10⁶ | 9.3 × 10⁶ | 9.3 × 10⁶ | 9.3 × 10⁶ |
| k8 | 2.4 × 10⁷ | 2.4 × 10⁷ | 2.4 × 10⁷ | 2.4 × 10⁷ | 2.4 × 10⁷ | 2.4 × 10⁷ | 2.4 × 10⁷ | 2.4 × 10⁷ | 2.4 × 10⁷ | 2.4 × 10⁷ |
| a1 | 0.43 | 0.34 | 0.31 | 0.40 | 0.64 | 1.19 | 1.58 | 1.91 | 2.47 | 3.04 |
| a2 | 0.43 | 0.34 | 0.31 | 0.40 | 0.63 | 1.18 | 1.54 | 1.89 | 2.57 | 3.20 |
| a3 | 0.32 | 0.25 | 0.23 | 0.30 | 0.51 | 0.95 | 1.14 | 1.48 | 1.79 | 2.45 |
| a4 | 0.21 | 0.26 | 0.08 | 0.11 | 0.49 | 0.31 | 0.42 | 1.47 | 0.63 | 0.94 |
| a5 | 0.21 | 0.26 | 0.08 | 0.11 | 0.49 | 0.31 | 0.44 | 1.47 | 0.67 | 0.88 |
| a6 | 0.18 | 0.22 | 0.07 | 0.10 | 0.42 | 0.27 | 0.36 | 1.25 | 0.54 | 0.73 |
| a7 | 0.62 | 0.48 | 0.45 | 0.58 | 0.96 | 1.70 | 2.19 | 2.87 | 3.46 | 4.76 |
| a8 | 0.98 | 1.21 | 0.38 | 0.52 | 2.29 | 1.51 | 2.06 | 6.80 | 2.93 | 4.40 |
| ad1 | 0.44 | 0.35 | 0.32 | 0.41 | 0.83 | 1.89 | 2.36 | 3.42 | 7.67 | 15.64 |
| ad2 | 0.45 | 0.36 | 0.33 | 0.43 | 0.71 | 1.34 | 2.00 | 2.85 | 9.15 | 13.61 |
| ad3 | 0.34 | 0.25 | 0.24 | 0.32 | 0.60 | 1.35 | 2.08 | 2.56 | 10.13 | 21.45 |
| ad4 | 0.21 | 0.27 | 0.09 | 0.12 | 0.54 | 0.34 | 0.47 | 1.97 | 6.39 | 9.33 |
| ad5 | 0.20 | 0.26 | 0.09 | 0.11 | 0.54 | 0.35 | 0.45 | 2.18 | 1.27 | 2.90 |
| ad6 | 0.18 | 0.23 | 0.07 | 0.10 | 0.47 | 0.30 | 0.40 | 1.61 | 2.34 | 13.39 |
| ad7 | 0.65 | 0.51 | 0.46 | 0.62 | 0.98 | 1.93 | 2.48 | 2.93 | 4.16 | 5.44 |
| ad8 | 0.97 | 1.18 | 0.40 | 0.51 | 2.54 | 1.54 | 2.10 | 7.69 | 4.20 | 4.96 |
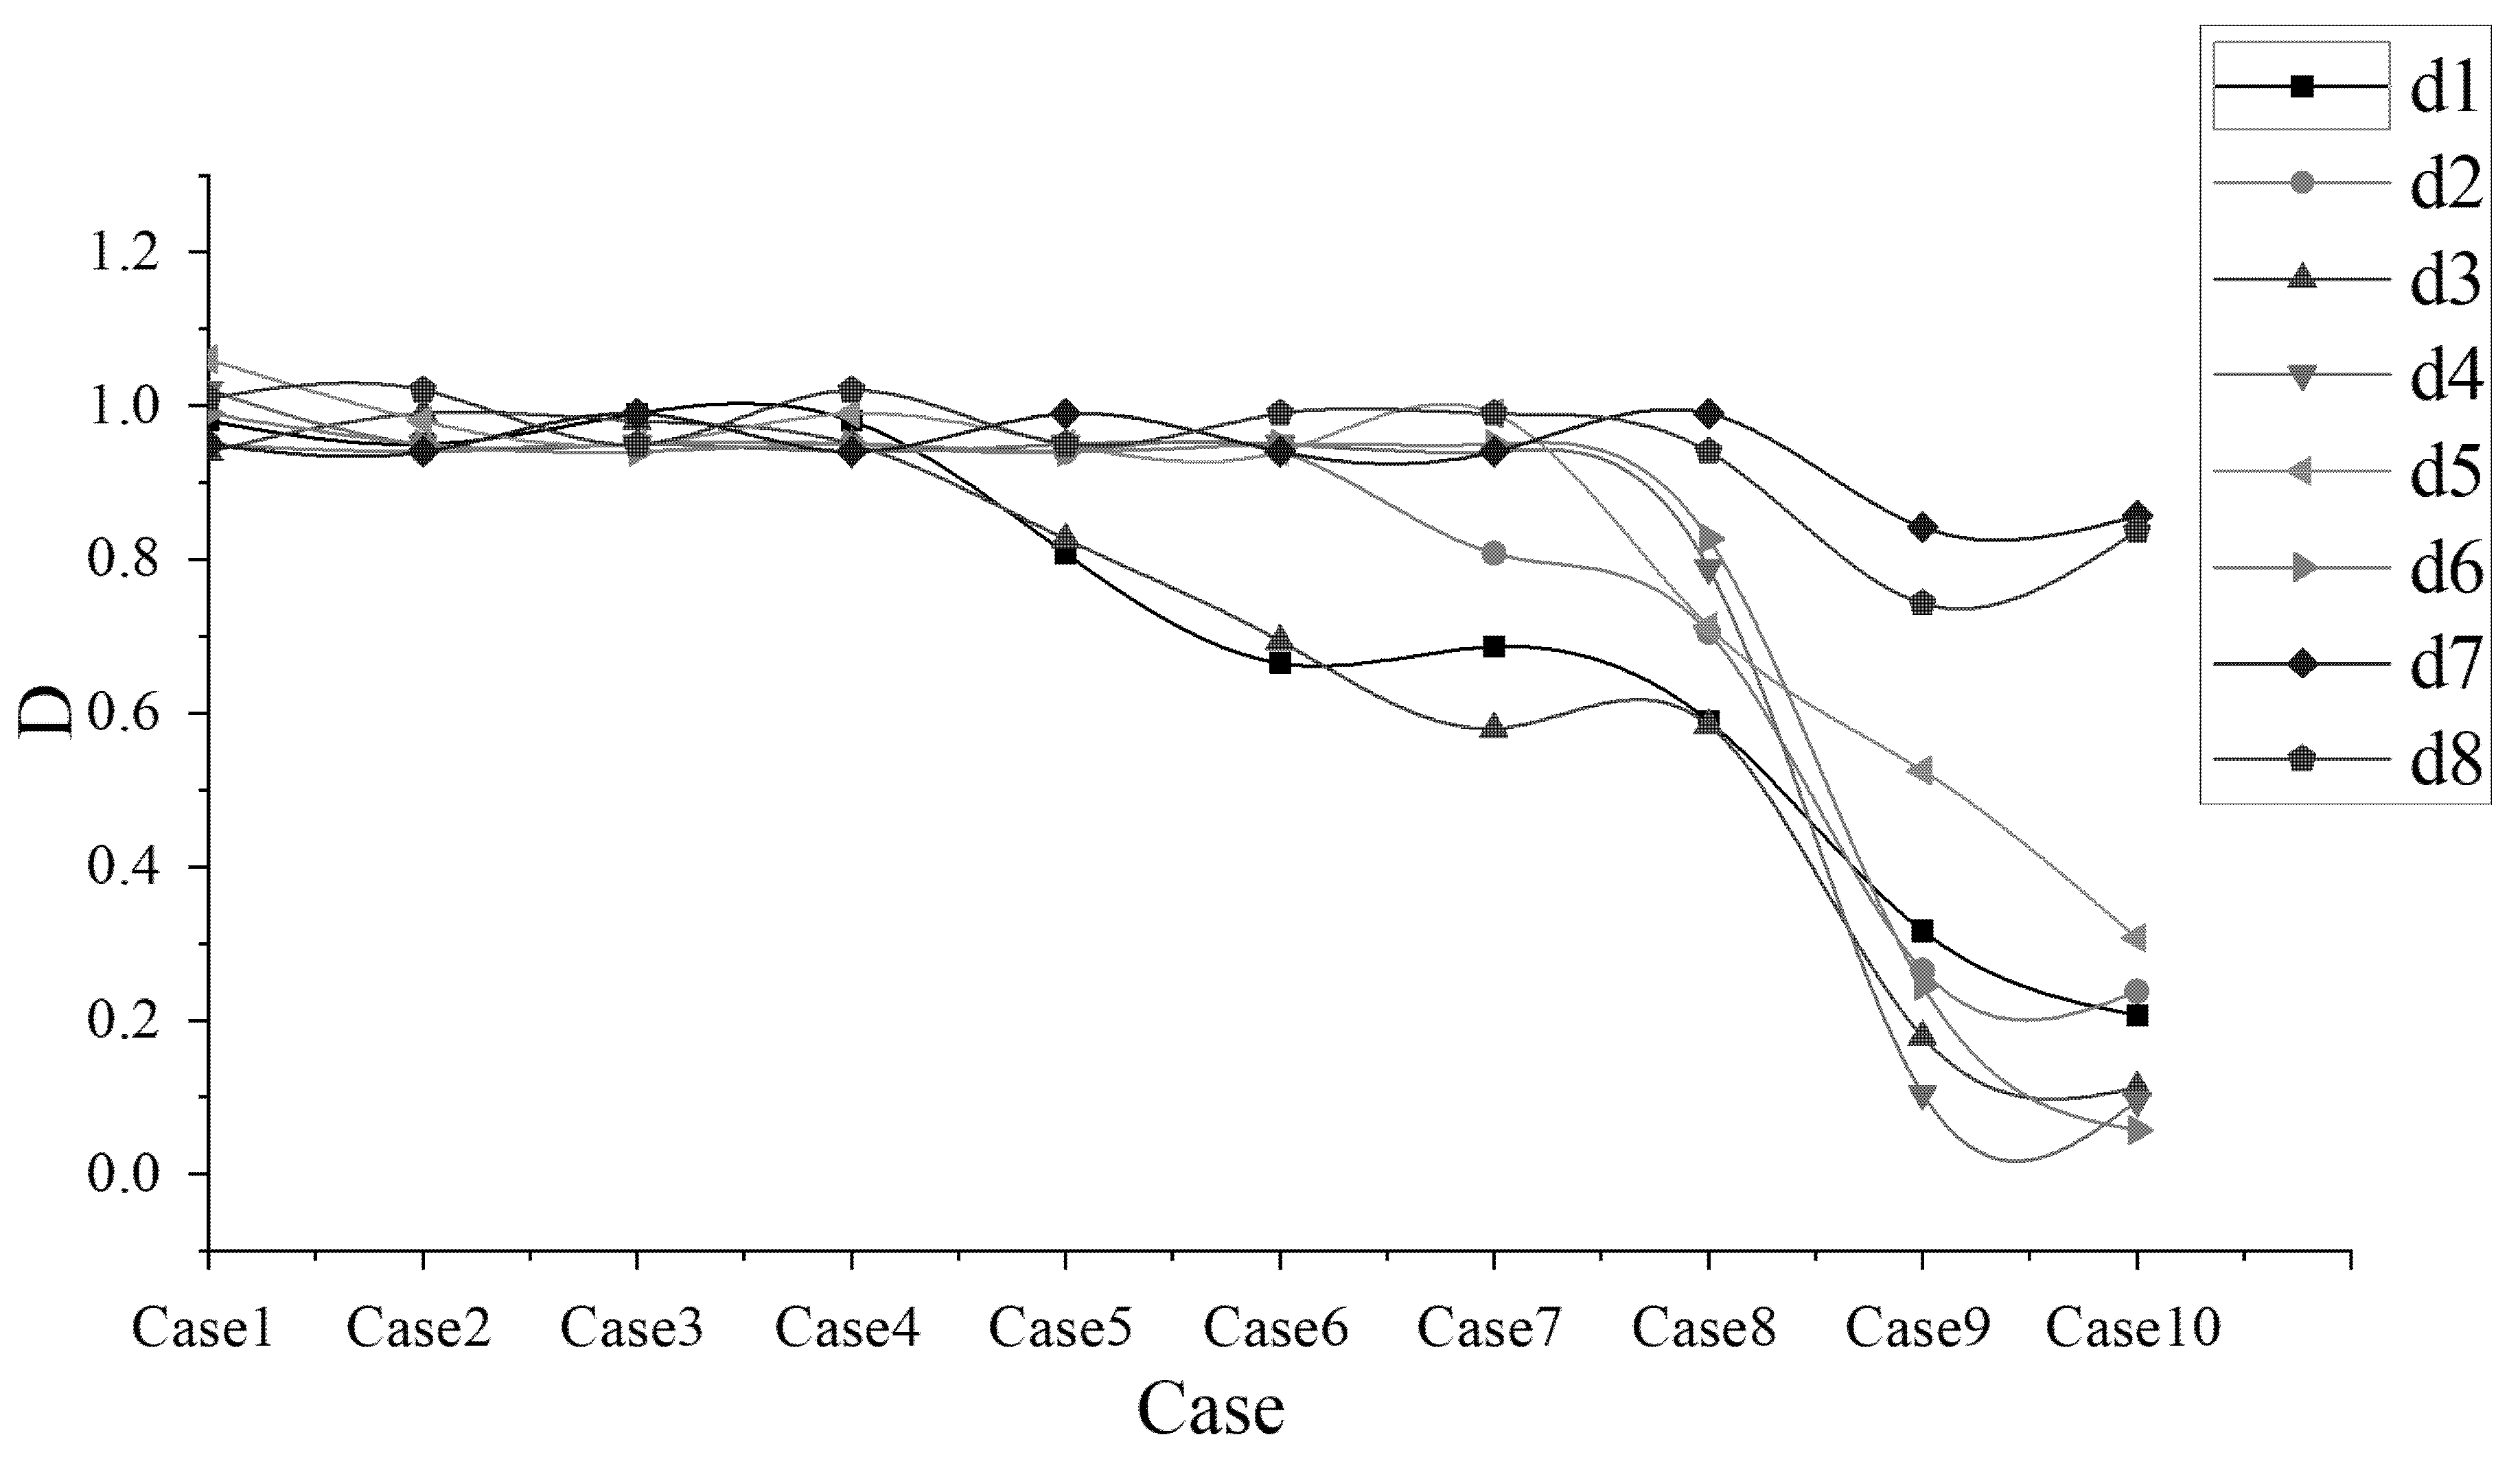
| Case | Seismic Waves | Damage Descriptions | X-Direction Support | Y-Direction Support | k7 (N/m) Y-Direction Bridge Tower | k8 (N/m) X-Direction Bridge Tower |
|---|---|---|---|---|---|---|
| (d1 + d2 + d3)/3 | (d4 + d5 + d6)/3 | d7 | d8 | |||
| 1 | Lander-amboy | No obvious cracks | 0.96 | 1.02 | 0.95 | 1.01 |
| 2 | Cerro Prieto | No obvious cracks | 0.96 | 0.96 | 0.94 | 1.02 |
| 3 | Chi-chi | No obvious cracks | 0.97 | 0.95 | 0.99 | 0.95 |
| 4 | El-Centro | No obvious cracks | 0.96 | 0.96 | 0.94 | 1.02 |
| 5 | Cerro Prieto | Minor cracks in X-direction support | 0.86 | 0.95 | 0.99 | 0.95 |
| 6 | El-Centro | Lots of cracks in X-direction support | 0.77 | 0.95 | 0.94 | 0.99 |
| 7 | Chi-chi | Lots of cracks in X-direction support | 0.69 | 0.96 | 0.94 | 0.99 |
| 8 | El-Centro | Lots of cracks in X-direction support, Minor cracks in Y-direction support and stay cable anchor block | 0.63 | 0.78 | 0.99 | 0.94 |
| 9 | Chi-chi | Lots of cracks in X-direction and Y-direction support, Minor cracks in stay cable anchor block and bridge tower | 0.25 | 0.29 | 0.84 | 0.74 |
| 10 | Chi-chi | lots of major cracks appeared | 0.19 | 0.15 | 0.86 | 0.84 |
Disclaimer/Publisher’s Note: The statements, opinions and data contained in all publications are solely those of the individual author(s) and contributor(s) and not of MDPI and/or the editor(s). MDPI and/or the editor(s) disclaim responsibility for any injury to people or property resulting from any ideas, methods, instructions or products referred to in the content. |
© 2022 by the authors. Licensee MDPI, Basel, Switzerland. This article is an open access article distributed under the terms and conditions of the Creative Commons Attribution (CC BY) license (https://creativecommons.org/licenses/by/4.0/).
Share and Cite
Shi, Z.; Zhong, R.; Jin, N. Seismic Damage Identification of Composite Cable-Stayed Bridges Using Support Vector Machines and Wavelet Networks. Sustainability 2023, 15, 108. https://doi.org/10.3390/su15010108
Shi Z, Zhong R, Jin N. Seismic Damage Identification of Composite Cable-Stayed Bridges Using Support Vector Machines and Wavelet Networks. Sustainability. 2023; 15(1):108. https://doi.org/10.3390/su15010108
Chicago/Turabian StyleShi, Zhongqi, Rumian Zhong, and Nan Jin. 2023. "Seismic Damage Identification of Composite Cable-Stayed Bridges Using Support Vector Machines and Wavelet Networks" Sustainability 15, no. 1: 108. https://doi.org/10.3390/su15010108
APA StyleShi, Z., Zhong, R., & Jin, N. (2023). Seismic Damage Identification of Composite Cable-Stayed Bridges Using Support Vector Machines and Wavelet Networks. Sustainability, 15(1), 108. https://doi.org/10.3390/su15010108