Article

Carbon Soil Storage and Technologies to Increase Soil Carbon Stocks in the South American Savanna

by
Gabriel Ribeiro Castellano
1,*,
Landerlei Almeida Santos
2 and
Amauri Antonio Menegário
1
1
Center of Environmental Studies, São Paulo State University, Rio Claro 13506900, Brazil
2
School of Mechanical Engineering and Electronic Information, China University of Geosciences, Wuhan 430074, China
*
Author to whom correspondence should be addressed.
Sustainability 2022, 14(9), 5571; https://doi.org/10.3390/su14095571
Submission received: 10 February 2022 / Revised: 20 March 2022 / Accepted: 31 March 2022 / Published: 6 May 2022

Abstract

:
The expansion of the agricultural frontiers that occurred in the last decades in the South American savanna (Cerrado), the second-largest biome in Brazil (covering an area of 204 million hectares), has accounted for a substantial portion of South America’s CO2 emissions. In this context, our research investigated the potential for soil carbon storage in the biome. The analysis of previous data (n = 197) shows a vertical distribution pattern of soil carbon stock: 26.17% for the upper 0–30 cm layer, 37.67% for the 30–100 cm layer, and 36.15% for the 100–200 cm layer. The total soil carbon storage for the biome is 13.5 ± 6.7 gigatons (n = 71) for the upper 0–30 cm layer, 30.5 ± 18.9 Gt (n = 64) for the 0–100 cm layer, and 47.8 ± 4.3 (n = 9) for the 0–200 cm layer. The results indicate that the soil carbon stock up to 1 m deep in the Cerrado ranges from 0.5% to 2.29% of the global soil organic carbon storage for this depth. Further research is necessary to investigate what happens at a depth of at least 2 m. The results also indicate that the soil under pasture lands constitutes the largest manageable pool for increasing soil carbon stocks via the restoration of degraded pastures.

1. Introduction

Carbon dioxide (CO2) is the anthropogenic greenhouse gas with the highest impact on climate change. The level of atmospheric CO2 concentration has increased significantly since the pre-industrial era (>145%) [1,2]. Between 2007 and 2016, agriculture, forestry, and land-use change were responsible for 23% of total CO2-equivalent emissions in the atmosphere worldwide [3]. Land-use and land-use change include several mechanisms (e.g., forest burning, deforestation, soil degradation, conversion of native vegetation for agricultural purposes) that lead to changes in soil carbon stock in both above and belowground biomasses.
In this context, Brazil is an exemplary case of the impact of CO2 emissions caused by land-use and land-use change. It is currently one of the world’s largest greenhouse gas emitters (~2 gigatons of CO2-eq per year). The expansion of the agricultural frontiers that has occurred in the Brazilian savanna and Amazon Forest accounts for a large portion of South America’s CO2 emissions. For instance, the South American savanna, also known as “Cerrado” used to cover an area of 204 million hectares (Mha) spanning across 12 Brazilian states. Due to having ideal conditions for high yield agricultural fields and pastures, it is now reduced to about 80 Mha (approximately 35% of its original coverage) [4,5].
The most recent Brazilian greenhouse gas emissions (GGE) inventory showed that the country emitted 1.47 Gt of CO2-eq in 2016. Deforestation, degradation, or conversion of natural vegetation for agricultural use are responsible for 60% of total emissions. Although emissions due to land-use change decreased from 2.6 Gt of CO2-eq in 2004 to 0.39 Gt of CO2-eq in 2016, greenhouse gas emissions caused by agricultural activities have increased in Brazil in the recent past—from approximately 0.32 Gt of CO2-eq in 1990 to 0.48 Gt of CO2-eq in 2016—primarily due to the growth in livestock production and agricultural management. The impact of land-use changes and agricultural activities in the last five years is unknown, as no official report has been published during this period [6].
In agricultural crops, soil emissions are partly offset by plants adding carbon to the soil. The best way to assess whether the soil is functioning as a carbon sink or source is to understand the dynamics of soil carbon stocks. The main questions regarding the capacity of soil carbon stocks [7] are: How much CO2 can be sequestered by the soil in each of the world’s ecosystems, and how long does it remain there? Does an increase in the net primary production of the system (due to higher atmospheric CO2 concentrations and anthropic activities, e.g., nitrogen fertilization) lead to increased litter production and, consequently, carbon stock in soils?
As with other types of biomes, the Cerrado soils are impacted by a complex combination of several variables, e.g., organic carbon content, mineralogy, natural vegetation, climate, latitude and longitude, land-use, and agriculture management. In this light, this study aims to (i) characterize and discuss soil carbon stocks for different land-uses and land covers in the Cerrado region; (ii) summarize key questions and provide guidelines for future research in this field, and (iii) organize currently available data assessing the impact of agricultural management and land-use changes on soil carbon stocks at different soil layers. To this end, we have collected data on soil carbon stocks in the Cerrado from articles, academic theses, and technical reports. To the collected data the following specific questions were posed:
  • How much carbon can be sequestered by the soil in the Cerrado biome? What is its largest manageable carbon pool?
  • What current agriculture technologies and land management models are capable of increasing soil carbon stocks in the Cerrado biome?
  • What type of its native vegetation can store the most carbon in the soil?

2. Material and Methods
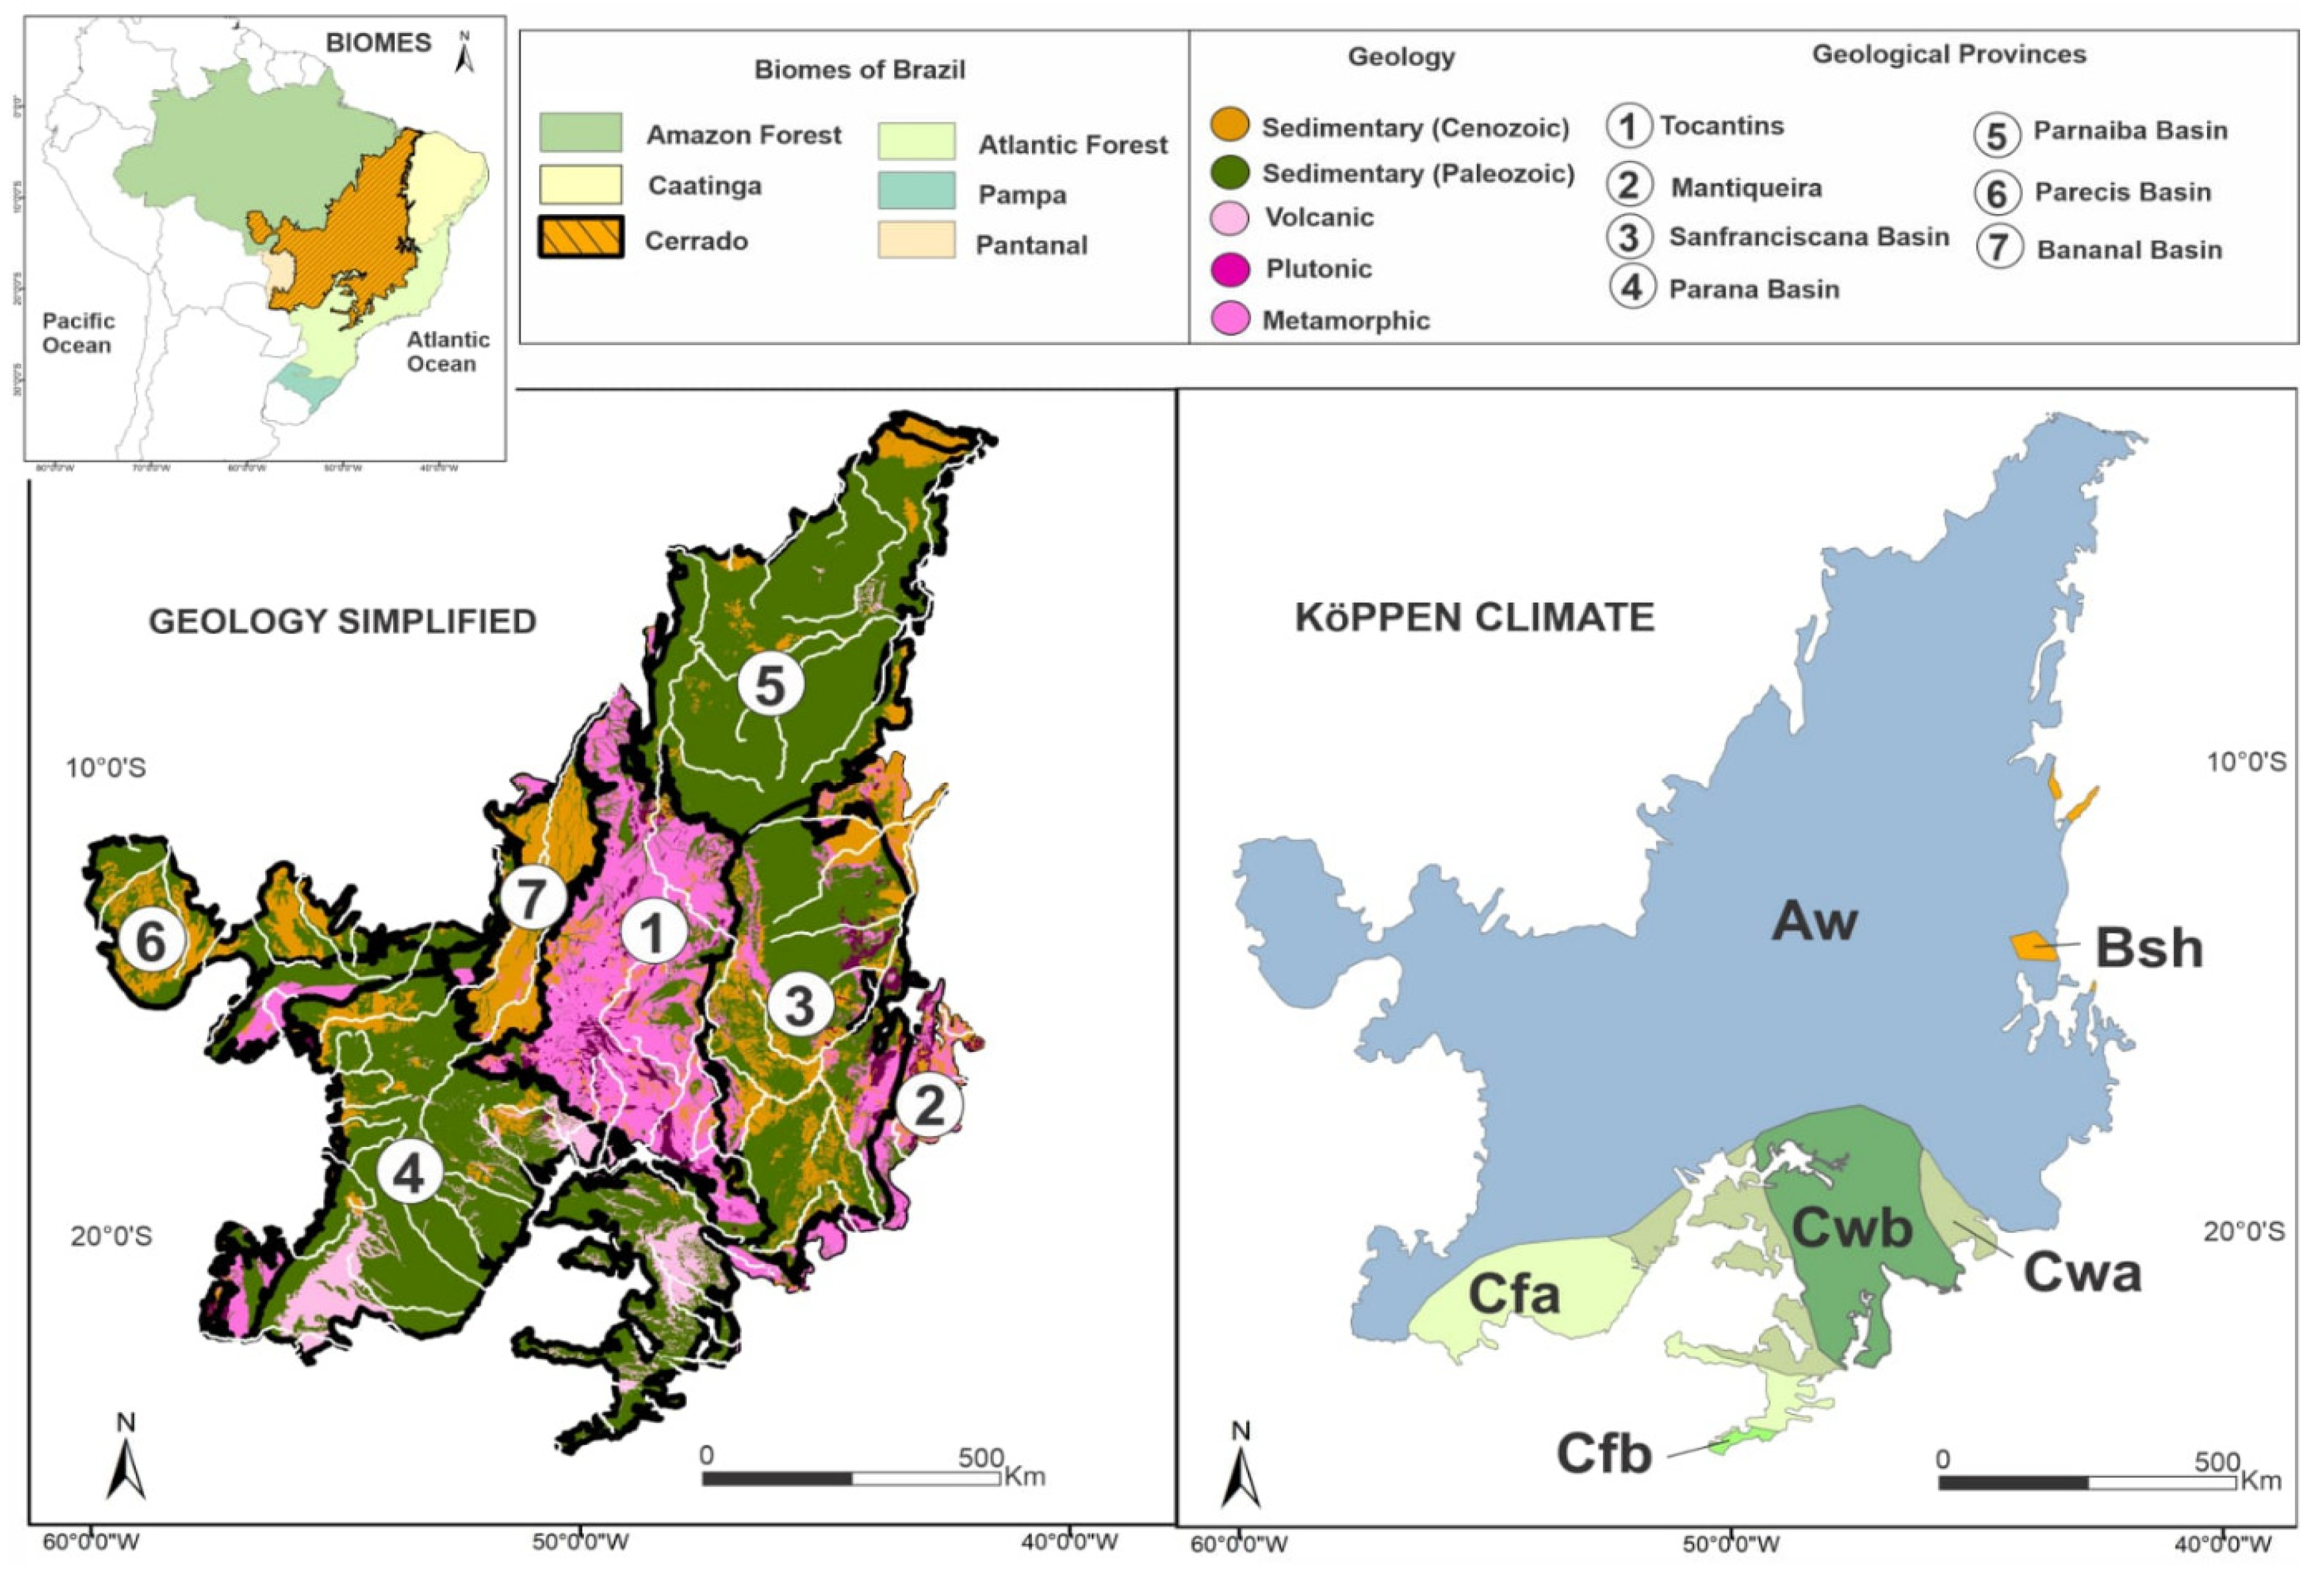
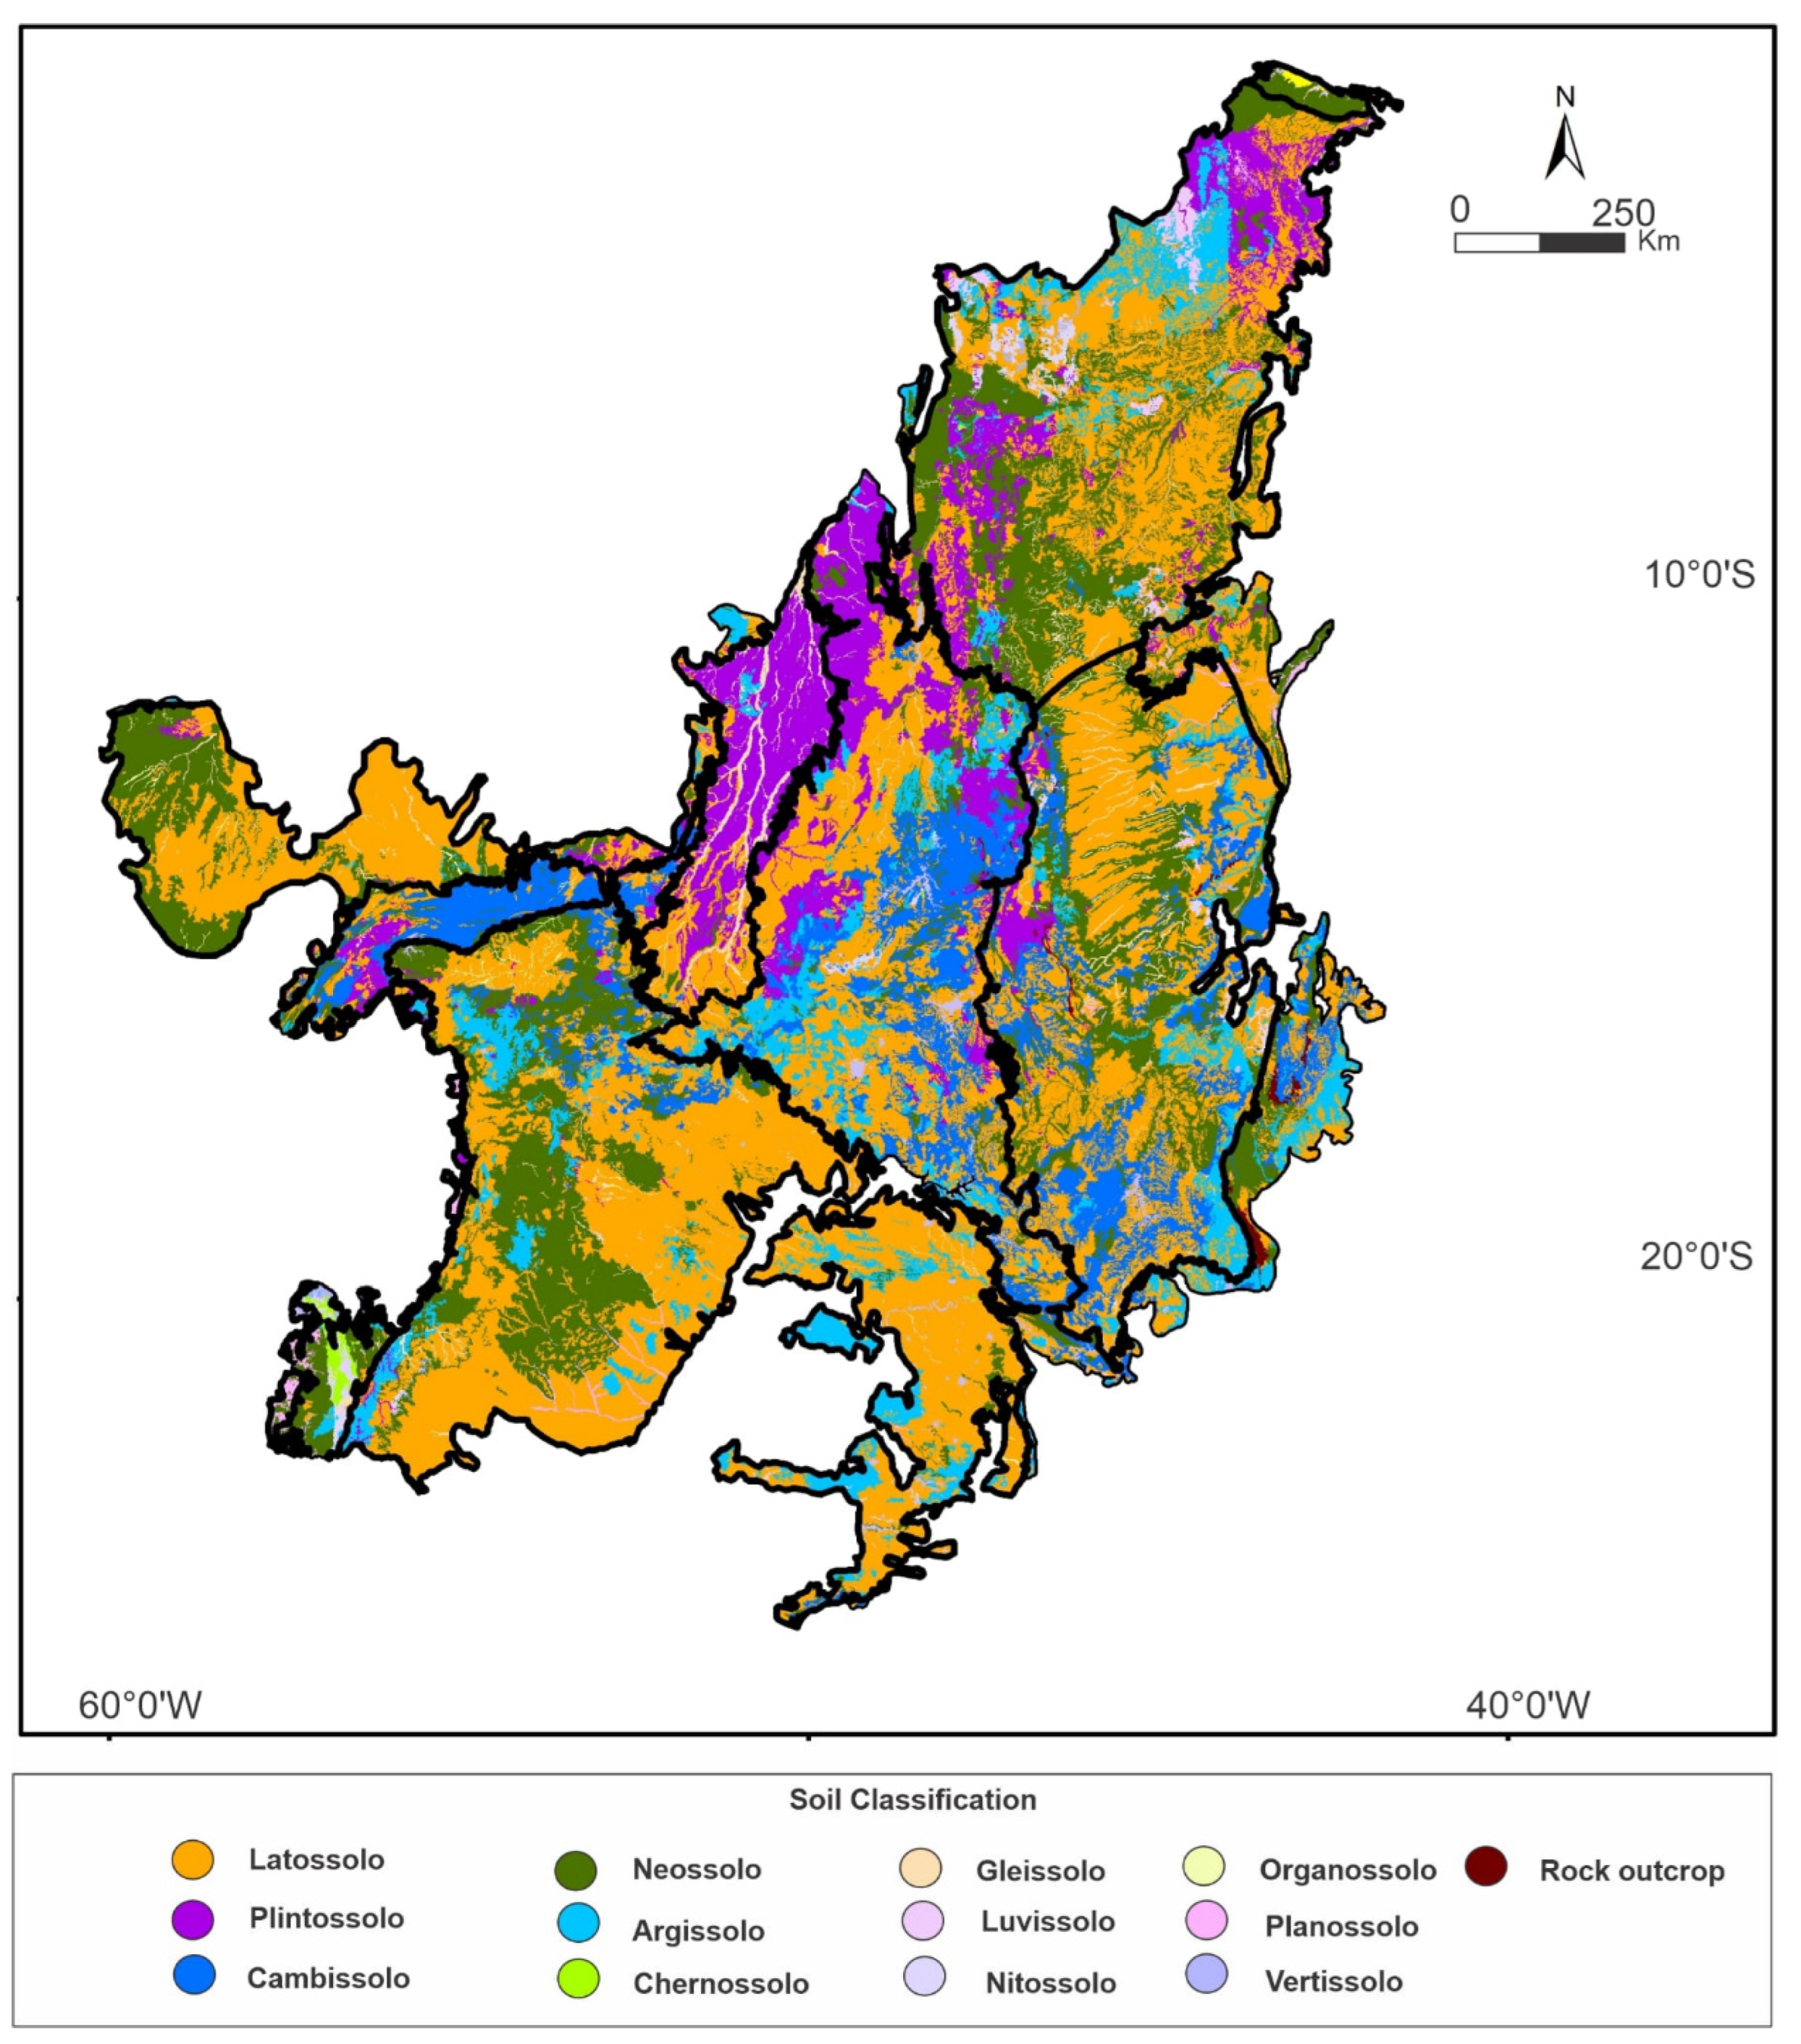
2.1. Study Area

The Cerrado is a mosaic of varied vegetation and gradients of wood coverage and height, ranging from forest to grassland [8,9]. Located at the geographic center of the South American continent, it is contiguous to different biomes, e.g., the Amazon Forest, Caatinga (sparse forest leafless in the dry season), Atlantic Forest, Pantanal (wetlands), and the Atlantic Ocean (by a thin strip of land in the north of the country). Mostly composed of woodland savanna, its vegetation is distributed among several different types (e.g., wet and dry grasslands, shrublands, and forests), which are home to the largest number and diversity of species among the world’s savannas [10].
Different patterns of biomass accumulation and distribution occur in the Cerrado region, which can be divided into three categories and eleven phytophysiognomies [11]: grasslands (campo limpo, campo sujo, and campo rupestre), shrublands (stricto-sensu cerrado, park savanna, palm land, and vereda), and forestlands (riparian, gallery and dry forests, and cerradão). Carbon storage calculation in the Cerrado biome is based on carbon present in the soil and plants, which may be divided into four pools: aboveground biomass (living trees, shrubs, and grasses); necromass (fallen leaves and wood litter); belowground biomass (roots); and soil carbon [12,13].
As to the aboveground and belowground biomass throughout the Cerrado biome [14], the mean values found for each category of vegetation types are 113.36 Megagrams/hectare (Mg/ha) for forestlands (18% percent as belowground biomass), 60.71 Mg/ha for shrublands (58% percent as belowground biomass), and 26.39 Mg/ha for grasslands (70% as belowground biomass). However, these values should be analyzed with caution, as the above variation may reflect the natural environmental heterogeneity of these vegetation categories and their physiognomies as well as the use of different sampling methods [14].
Owing to its geographic extent, geology diversity, and proximity to other tropical biomes (Figure 1), the Cerrado exhibits a complex combination of edaphoclimatic and ecological determinants [15], which impact the carbon dynamics in its soil and biomass. Another important factor is the ease with which some types of the Cerrado vegetation regularly and naturally burn during the dry period, resulting in seasonal changes in its carbon stocks.
A tropical humid climate predominates in the Cerrado (Figure 1), with average temperature above 18 °C throughout the year, a dry season lasting from 3 to 6 months between April and September, and a rainy season with an average annual rainfall ranging from 700 to 1.400 mm yr−1 (Aw according to the Köppen climate classification). The climate in the southern area of the biome, where the temperature falls below 18 °C during the coldest month, is classified as Cwa, Cwb, Cfa, and Cfb. In small areas bordering the Caatinga biome, the average annual rainfall is under 500 mm yr−1, with average temperatures above 18 °C throughout the year (Bsh according to the Köppen climate classification).
The regional geology (Figure 1) of the Cerrado biome comprises seven geological provinces and basins: Tocantins, Mantiqueira, Parnaíba, Sanfranciscana, Paraná, Parecis, and Bananal. These areas constitute a complex mosaic of different kinds of rocks of different geological ages (Figure 1). In its central area and eastern edge, crystalline rocks (metamorphic, igneous, and volcanic) from neoproterozoic shields prevail (Tocantins and Mantiqueira provinces). Four Paleozoic sedimentary basins occupy a vast area of the Cerrado, two of which are located in the E-NE (the Parnaíba and Sanfranciscana basins), and the remaining two in the W-SW (the Paraná and Parecis basins). Cenozoic sedimentary deposits are found in several provinces, with the most prominent being the Quaternary alluvial plain deposits that make up the Bananal Basin [19].
The Cerrado relief in the Paraná and Parecis Paleozoic basins is mainly composed of plateaus. The geomorphology in the Sanfranciscana and Parnaíba basins is predominantly characterized by the presence of plateaus and vast depression areas, whereas the relief in the Tocantins province (center) comprises mostly mountain ranges and plateaus (south) and depressions (north).
The main soil class in the Cerrado biome [20], according to the Brazilian Soil Classification System [21] and an approximated agreement between WRB [22] and USDA Soil Taxonomy [23,24], is Latossolos (Ferralsols [22]; Oxisols [23,24]), covering 45% of its area. It is followed by Neossolos Quartzarênicos (Arenosols [22]; Quartzipsamment [23,24]) and Argissolos (Acrisols, Lixisols, and Alisols [22]; Ultisols [23,24]) found in 15.2% and 15.1% of its area, respectively. Other minor occurrences are Plintossolos (Plinthosols [22]; Plinthic sub-group [23,24]), Lithic Neosols (Leptosols [22]; Lithic... Orthents and Lithic… Psamments [23,24]), and Cambissolos (Cambisols [22]; Inceptsols [23,24]), covering 9%, 7.3%, and 3.1% of its area, respectively. Rarer hydromorphic soils in the biome are Gleissolos (Gleysols [22]; Entisols [23,24]) and Organossolos (Histosols [22,23,24]), covering about 2.5% of the total area (Figure 2).

2.2. Methods

A systematic survey for peer-reviewed articles and datasets on soil carbon stocks in the Cerrado region was conducted in technical reports, academic theses, and the relevant literature (Supplementary Material Table S1). These data were sorted and organized according to the depth of the soil carbon stocks (0–20 cm, 0–30 cm, 0–40 cm, 0–60 cm, 0–100 cm, 0–200 cm) as well the land-use and cover where they were measured. In addition, we analyzed the impact of agricultural management for every soil layer with carbon storage reported in the sources.
Although some authors opted for depths of 0–5 cm, 0–10 cm, and 0–50 cm, the above distribution of soil depths provides the largest amount of available data on carbon stocks. For this reason, information from those studies has been discarded. Each sample site was considered individually in the statistical analyses. In total, we analyzed 197 sampling points (41 sources with 1 to 12 sampling points each). In order to standardize the procedure, all the collected data on types of land cover vegetation have been categorized under forestland, shrubland, grassland, and wet grassland. In the Cerrado, wet grasslands have groundwater near or above the surface for most of the year (8 months or more). All information on land-use and agricultural land management was classified as tillage, no-tillage, planted forest, agroforest, pasture, and perennial crops.
As most sources (articles, reports, theses, and datasets) do not provide information or provide incomplete information on all the layers, we used a different amount of data for each soil depth, land cover or land-use. When providing an analysis of the evolution of carbon stocks over time (diachronic approach), we used only the most recent available data. Most of the sources make use of chronosequences (synchronic approach). When the analyzed data provided the means of several points, we used the mean values. The data used in this research was from eight Brazilian states: Goiás (GO), Bahia (BA), Minas Gerais (MG), Mato Grosso (MT), Mato Grosso do Sul (MS); São Paulo (SP), Maranhão (MA), and Distrito Federal (DF).
The fact that different methodologies have been used to determine soil carbon stocks in the Cerrado can hinder comparisons among data from different sources. Wet combustion methods, such as Walkley–Black and its modifications, while being more accessible, have the disadvantage of employing toxic reagents (such as Cr6+) and measuring just organic carbon, thus underestimating the amount of carbon in the soil. For this reason, a correction factor of 1.32 is usually applied. Also, the estimate that only 60–85% of the organic carbon is oxidized depends on the mineralogy, aggregation, clay content, and quality of organic matter in the soil [26].
The wet combustion method employs a digestion mixture of soil, potassium dichromate (K2Cr2O7), and sulfuric acid (H2SO4). Then, phosphoric acid (H3PO4) and diphenylamine are added; excess dichromate is titrated using ammonium ferrous sulfate [Fe (NH4)2(SO4)26H2O)] (Mohr’s salt). Modified methods, e.g., Melbius, use external heat to boost oxidation [26]. Sixteen sources use Walkley–Black or modifications of this method, but some of them do not have clear procedures. The standard formula for Walkley–Black is [27]:
OC = [ ( 1 V a V b ) ( 10 ) ( 0.003 ) ( 1.2987 ) ( 100 ) ] / P s w
where: OC (g kg−1) = organic carbon; V b = volume of ferrous sulfate used in blank titration (mL); V a = volume of ferrous sulfate used in sample titration (mL); 10 = volume of dichromate added; 0.003 = C equivalent (mg); 1.2987 = method recovery factor; P s w = soil sample weight (mg).
In three sources (ten sites), the soil carbon stocks were measured using the Yeomans–Bremner method, a variation of Walkley–Black. Yeomans–Bremner assumes the reduced dichromate to be equivalent to the organic carbon in the sample. The difference between Melbius and Yeomans–Bremner is that the former uses an external heat of 100 °C and latter an external heat of 170 °C [26,27].
At all other sites, C contents were determined by dry combustion using an elemental analyzer (CNHS/O). The elemental analysis method is the standard method for determining soil carbon content as it enables fast measurement of soil carbon. However, it is costly when compared to the aforementioned methods. The soil is placed in a capsule and combusted at >900 °C, thus enabling the measurement of organic C, refractory C (e.g., charcoal), and inorganic carbon (carbonates) [27].
Accordingly, soil carbon stocks (SCS) were calculated using carbon content and bulk density as per the following formula [28]:
S C S = C B d L t
where: S C S = soil carbon stock (Mg ha−1); C = C content (g kg−1); B d = bulk density (g cm−3); L t = soil layer thickness (cm)

3. Results and Discussion

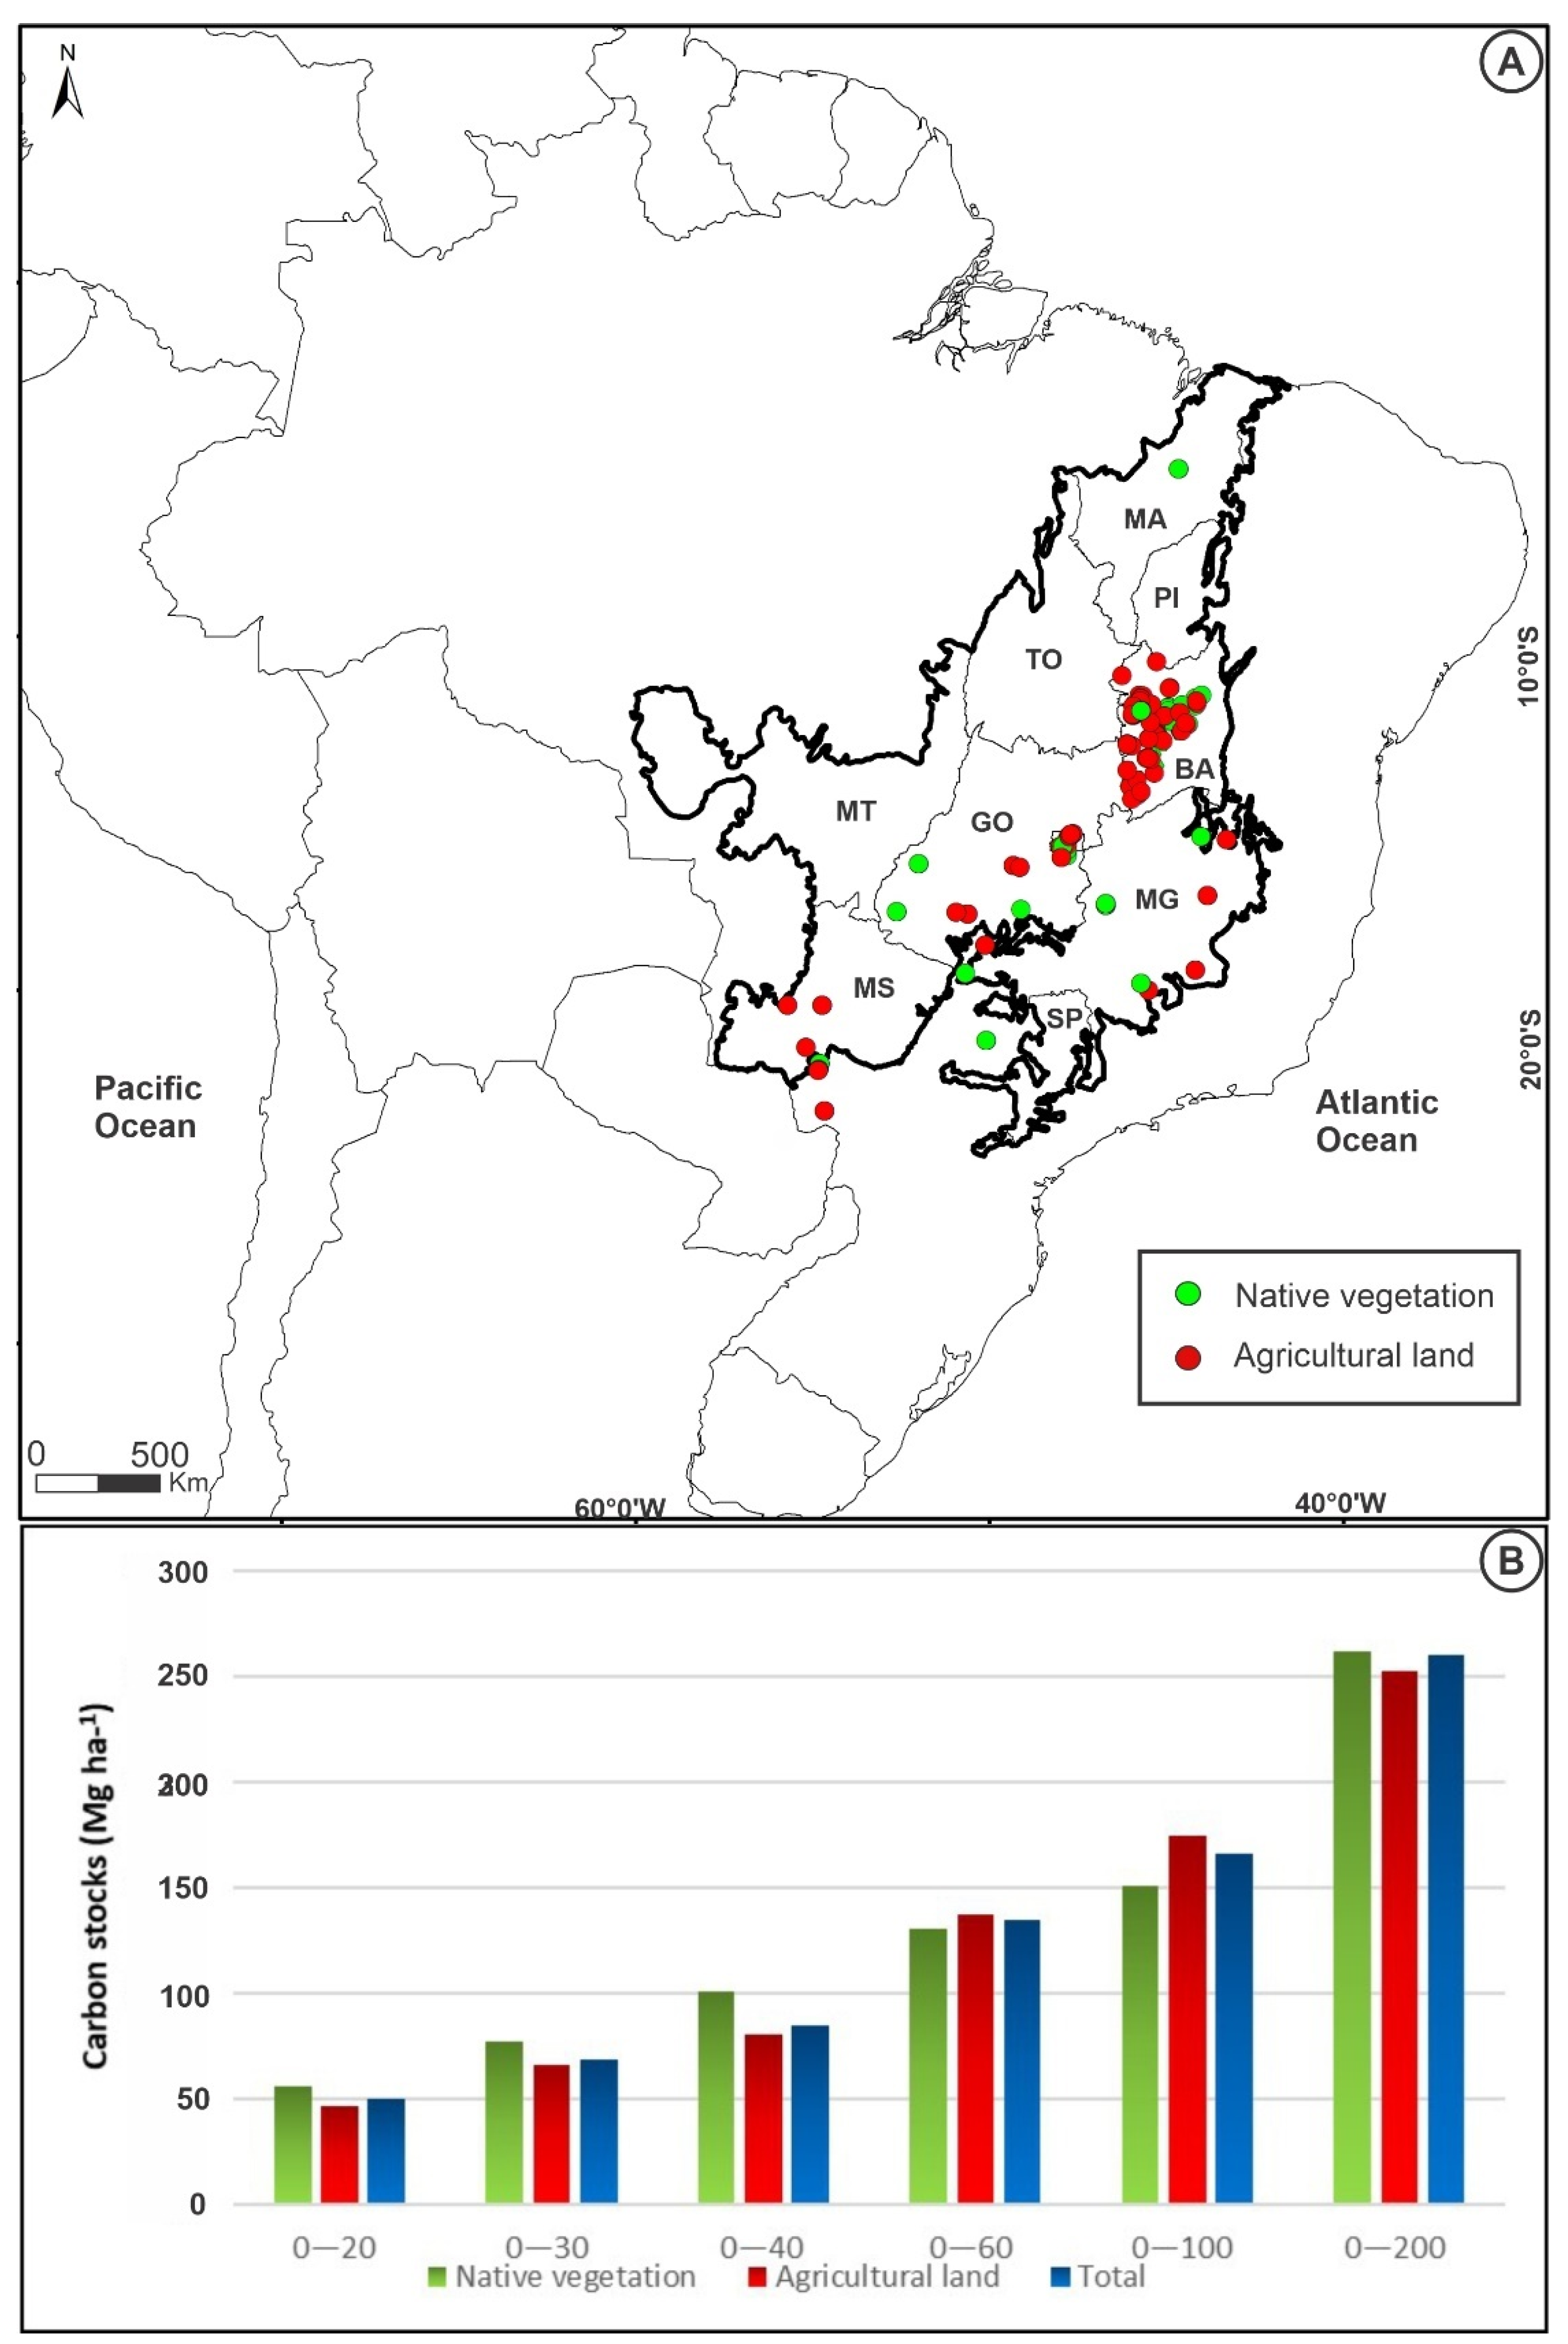
3.1. Total Soil Carbon Stocks to Cerrado Area, Agricultural Land, and Native Vegetation

Considering all available data (Supplementary Material Table S1), the mean carbon stocks for the Cerrado biome are 49.5 Mg ha−1 (coefficient of variation = 43%) for the 0–20 cm depth, 68.1 Mg ha−1 (CV = 50%) at 0–30 cm, 84.5 Mg ha−1 (CV = 56%) at 0–40 cm, 134.6 Mg ha−1 (CV = 65%) at 0–60 cm, 166.1 Mg ha−1 (CV = 62%) at 0–100 cm, and 260.1 Mg ha−1. (CV = 9%) at 0–200 cm. The lower coefficient of variation at 0–200 cm depth as compared to those at other depths can be explained by the lack of information on carbon stocks at this depth. The carbon stocks of the total sites, the agricultural land sites, and the native vegetation sites are shown in Figure 3.
Given the sum of urban areas, bare soils, mining areas, waterbodies, and non-observed sites being equal to 5.5506 Mha within a total of 203.9 Mha corresponding to the Cerrado [29], we assumed an area equal to 198.3 Mha for calculating total carbon stocks. The total soil carbon stocks (calculated by the means of the total data) for the Cerrado biome are 9.9 ± 4.2 Gt (n = 138) and 13.5 ± 6.7 Gt (n = 71) for the upper 0–20 cm and 0–30 cm depth layers, respectively. Subtracting 7.3% of the Cerrado land composed of Neossolos litólicos (no deeper than 0.3 m) results in a total area of 183.8 Mha for 31–200 cm depth; then, the total carbon storage is equal to 15.5 ± 8,7 Gt at 0–40 cm depth (n = 80), 24.7 ± 16 Gt at 0—60 cm (n = 40), 30.5 ± 18.9 Gt at 0–100 cm (n = 64), and 47.8 ± 4.3 at 0–200 cm (n = 9).
Global soil organic carbon at 0–1 m depth is estimated at 1462–1548 Gt plus 695–745 Gt of inorganic carbon [30]. In the Cerrado, the carbon stock at 1 m depth represents 0.5–2.29% of the global soil carbon storage at this depth. Refractory carbon (charcoal) may play an important role in the Cerrado because of the seasonal burns that naturally occur in the biome. Notwithstanding, the content of charcoal-derived carbon and how long it lasts in the soil are unknown because its resistant forms cannot be properly quantified with current methodologies. The carbon stocks of the total sites, the agricultural land sites, and the native vegetation sites are shown in Figure 3.
In most cases, it was possible to categorize each land-use using the adopted classification, except for one case [31] in which the land-use in two of its sites was classified as rainfed and irrigated crops. Only two sources present data from areas outside the main Cerrado region [32,33]. In these cases, the local vegetation is typical of the Cerrado biome, which can also occur in areas outside its legal boundary as isolated patches inside other biomes [14], as a result of local edaphoclimatic variability (e.g., soil, dry period, naturally occurring fires, etc.).
The largest number of sources used in this research provide data on agricultural lands and superficial layers. The few studies that focus on native vegetation usually provide data for deeper layers of soil. Since information on soil carbon stocks in agricultural lands below 100 cm depth is lacking, further research on the dynamics of carbon stocks in the deepest layers in response to soil management, land-use change, or even climatic change is necessary. Table 1 shows the number of sites for each depth and land-use.
The lowest value (Table 1) for soil carbon stocks at both 0–20 cm and 0–40 cm depths in agricultural lands (tillage system) and shrubland (native vegetation) was found in western Bahia State. The site is on Neossolos Quartzarênicos (i.e., maximum 15% clay content) and Aw (Köppen climate classification) with 1.100 mm annual precipitation [34]. The lowest value (Table 1) for native vegetation at 0–30 cm depth is in São Paulo State shrublands on sandy Latossolos (Ferralsols [22]; Oxisols [23,24]) with 16% clay content [32].
The lowest carbon stock value (Table 1) for native vegetation at 0–60 cm depth was found in Minas Gerais State shrublands on 16% clay content soil [35]. Additionally, low values for shrublands were found in western Bahia at 0–60 cm depth at several sites under sandy soils (mean value of 51.4 Mg ha−1) [31]. This source also shows the lowest value (Table 1) for agricultural lands (pastures) at 0–60 cm and 0–100 cm depths [31]. The lowest and highest values (Table 1) for native vegetation at 0–200 depth were found at sites with clayey soils in Distrito Federal shrublands and grasslands, respectively [36].
The highest value of soil carbon stocks for native vegetation at 0–20 cm, 0–30 cm, and 0–40 cm depths was found in Organossolos (Histosols [22,23,24]) in Distrito Federal wet grasslands [37], where groundwater level varies seasonally, i.e., rising during the rainy season. The local vegetation is mostly composed of herbaceous plants of the Poaceae family, with plants of the Cyperaceae, Asteraceae, and Lamiaceae families also present.

3.2. Vertical Distribution of Soil Carbon Stocks in the Cerrado Biome

The vertical distribution pattern of soil carbon stocks in the Cerrado biome is as follows: 26.17% (0–30 cm depth), 37.67% (30–100 cm depth), and 36.15% (100–200 cm depth). The distribution of the soil carbon stocks for agricultural land is 25.97% (0–30 cm depth), 43.05% (30–100 cm depth), and 30.96% (100–200 cm depth), whereas for native vegetation it is 29.49% (0–30 cm depth), 28.10% (30–100 cm depth), and 42.40% (100–200 cm depth).
Using the 0–200 cm layer as reference, some data show [36] that 60–70% of the carbon stocks are located in the first meter of soil. This proportion is significantly higher in grasslands (±70.5%) and lower in forestlands (66.5%) and shrublands (61.9–64.3%). Between 16% to 25% of the carbon stocks are located at 0–20 cm soil depth.

3.3. Soil Carbon Stocks in Native Vegetation

At two other wet grassland sites [38], the mean carbon storage at 0–60 cm depth for Plintossolos (Plinthosols [22]; Plinthic sub-group [23,24]) and Gleissolos (Gleysols [22]; Entisols [23,24]) was 211.3 Mg ha−1 and 278 Mg ha−1, respectively. The total area for these three types of soil, where wet areas are common, make up almost 12% of the Cerrado region [20]. While Gleissolos and Organossolos occur only in flooded areas, some sub-types of Plintossolos occur in dry areas as well. Considering all variations and possibilities, the area of hydromorphic soil in the Cerrado region is estimated at 2.1% [20] of its total area.
Even in the case of wet grasslands with few sample points (Table 2), no distinction between gallery forest and Cerradão, and no data for layers deeper than 60 cm, the data suggest that this type of vegetation cover can store more carbon in the soil than other types in the Cerrado biome. For example, carbon stocks for wet grasslands are 51% (0–20 cm depth), 44.4% (0–30 cm), 74.5% (0–40 cm), and 96.3% (0–60 cm) higher than those for forestlands, as shown in Table 2.
Forestlands [31,36,39,40,41,42,43,44] can occur under hydromorphic soil conditions as gallery forests and in dry areas in a formation known as Cerradão (type of savanna forest). Their canopy covers 70–90% of the area, with trees usually 8 m high, occasionally reaching 15 m. Shrublands [31,32,33,34,35,36,44,45,46,47,48,49,50,51,52,53,54,55,56,57,58,59,60,61,62,63] consist of an open formation with scattered trees and shrubs with a 20–70% canopy. Grasslands [36,62,64,65], which include some shrubs less than 3 m high, exhibit a 20% canopy maximum. Wet grasslands [37,38] extend across a narrow region of flooded plains along main rivers and lowlands. While this mosaic of different vegetation types can be found throughout the Cerrado, most of it is composed of shrublands associated with well-drained soils.
Because of strong anthropogenic pressure, grasslands in the Cerrado (campo limpo, campo sujo, and campo rupestre) are its most threatened type of vegetation. The Cerrado grasslands occur on sandy, dystrophic, or lithic soils, with a pronounced dry season. Their open formation is maintained by naturally occurring fires [66], which impact their soil carbon stocks. Contrary to the grasslands in the south (pampas) or in the country’s highlands, the Cerrado grasslands exhibit lower percentages of carbon stocks. For example, the carbon stock values for grasslands are 12.8% (0–20 cm) and 34.7% (0–40 cm) lower than those for forestlands (Table 2).
The Cerrado grasslands are now almost restricted to national/state conservation parks. Their preservation is critical because of threats posed by livestock production, which changes their makeup by replacing native species with fast-growing exotic grasses. Grassland areas are also affected by fragmentation, which changes their natural pattern of fires. The absence of naturally occurring fires turns their vegetation into shrublands.
Wet grasslands (campo limpo úmido), characterized by the absence of trees and bushes [38], occur as belts along valleys enclosing gallery forests. The occurrence of wet grasslands instead of gallery forests may be attributed to the fact that the groundwater remains close or above the ground surface in these areas during some periods of the year [37]. The landscape in these regions is marked by abrupt vegetation transitions. The Cerrado wet grasslands are usually located at shallow water tables in riverbed areas and valley bottoms, often between shrublands and gallery forests [38].
These environments exhibit significantly higher soil carbon stocks than those of shrublands and grasslands at 0–20, 0–30, and 0–60 cm depths. Hydromorphic soils, which remain under anaerobic conditions during part of the year, are important carbon storage sinks not only in wet grasslands but also under gallery forests. However, due to some physical characteristics of these soils, hydrological changes—which usually happen when the water table is drained prior to the land being used for agriculture or pasture—will result in high emissions of carbon dioxide and, consequently, the loss of soil carbon stocks. Soil saturation leads to low microbial activity and, as a result, low organic matter decomposition and limited oxygen diffusivity, which impact CO2 emissions and soil carbon stocks.
Gallery forests, which can store 400–1000 Mg ha−1 of carbon in the top one-meter layer of soil [49], also occur in the response to the same edaphic characteristics. Located near riverbanks, wet grasslands, and shrublands, these environments should be protected because they provide a haven for wildlife and act as carbon sinks

3.4. Soil Carbon Stocks for the Planted Forest, Agroforest, Pasture, and Perennial Crops

Table 3 shows data for ten different planted-forest sample sites. These sample points represent the most common economic use for planted forests in the Cerrado, covering 3.06 Mha of it [29]. Nine of these sites are used to grow Eucalyptus spp.: two sites were established in 1984 and 2004 and measured in 2008 [40]; one site characterized as a 13-year-old unmanaged forest [48]; four sites with Eucalyptus urophylla × Eucalyptus grandis plantations under seven years of establishment [46]; two sites with Eucalyptus camaldulensis plantations less than seven years old; and one site with a 20-year-old Pinus caribaea (var. hondurensis) plantation [35]. The hybrid Eucalyptus plantation [46] is used to produce pulp and paper. In its 7th year (harvest year), this site exhibited soil carbon stocks ranging from 267 to 325 Mg ha−1 [46] (Table 3).
Fast-growing forests such as Eucalyptus plantations are efficient systems for the accumulation of aboveground and belowground biomass [67]. Their leaves and other residues (e.g., litter and dead roots after a cycle of production) contribute to increasing carbon storage in the soil [68]. The forest canopy also protects the soil from erosion, due to direct impact of rainfall, and from solar irradiance, which results in lower air and topsoil temperatures. Under these environmental conditions, it is easier for clayey soils to stabilize the carbon present in or added to the soil [69].
E. camaldulensis is used to produce wood charcoal. When it is grown in coppice systems, it can contribute to stabilizing soil carbon. However, these systems are usually established in areas with poor sandy soils, as is the case of the site used in this research [35]. This site, which is in its last year of production, presented carbon storage values ranging from 41.6 to 59.8 Mg ha−1 at 0–60 cm depth [35] (Table 3). It should be noted that there are also unmanaged forests of this species, usually found in the southern boundary of the Cerrado region.
Besides Eucalyptus, Pinus is also planted in the Cerrado and is commonly used for timber (with a 20-year production cycle). Pinus plantations exhibit carbon storage values of approximately 65.75 Mg ha−1 at 0–60 cm depth [35].
Eight sample sites represent agroforests in the Cerrado (Table 3): two silvopastures established in 1994 and 2004 and measured in 2008 [40]; one intercrop of Acrocomia palm and pasture [45]; one recently established intercrop of Eucalyptus and rice; one 1-year-old intercrop of Eucalyptus and soybean; two Eucalyptus plantations in a livestock-forest system, both measured in 2001 after 2–3 years of establishment [44]; and one integrated crop-livestock-forest system established in 2011 in a region of transition between the Cerrado and the Amazon Forest, measured in 2013 [70].
Despite the lack of information about soil carbon stocks in the Cerrado agroforests, it is known that the soil carbon storage worldwide in these systems may reach 300 Mg ha−1 at 1 m depth [71]. The integrated crop-livestock-forest system is implemented to intensify land-use, but it is not widely adopted in the Cerrado because of its complex management and the lack of information on crop and livestock production and forestry performance under these conditions. Usually, these systems are designed according to the type of forest to be planted. It is usually implemented by dividing the area into rows, 15 to 30 m apart. In the first year, the trees (forest) are planted intercropped with the first crop (usually soybeans). Then, in the 2nd or 3rd year, the pasture is established intercropping the forest.
Anthropic grazing lands in the Cerrado region make up a total of 60 Mha [29]. In order to measure their impact on carbon storage, several researchers studied soil carbon stocks in pastures (Table 4). One of them assessed a mean of twenty sample points (Supplementary Material Table S2) in western Bahia [31]. Most of the sample points are in areas covered by Brachiaria decumbens or B. brizantha [32,36,40,48,51,58,60,64,65,72]. Both Brachiaria decumbens and B. brizantha take up 80% of the pastures in the Cerrado region [32].
Other species present in these pastures are Panicum maximum [58,64], Paspalum atratum [64], Andropogon gayanus [58], and Pennisetum glaucum [47]. Some points were measured in areas with mixed species, such as Brachiaria brizantha + Stylosanthes guianensis [64] and Andropogon gayanus + Neonotonia wightii + Centrosema brasilianum [64]. No information on the variety of species was found for four of the sample points [54,57,59,73].
Agricultural lands with perennial crops, e.g., coffee, citrus, sugarcane, and palm trees, take up 6.42 Mha of the Cerrado region [29]. The data available on croplands derive from six sample points: one from Acrocomia palms in Maranhão State; one from Coffea arabica in Minas Gerais State; and four from jatropha trees in Distrito Federal.

3.5. Soil Carbon Stocks for Tillage, and No-Tillage Systems

Nowadays, the total area of no-till farming in the Cerrado is estimated at 11 Mha [54] of a total annual cropping land estimated at 17.4 Mha [29]. Table 4 shows values for soil carbon stocks in tillage and no-tillage systems and sheds light on the difference between these farming techniques in regards to carbon storage, namely, carbon stocks are higher in no-tillage systems: 15.8% at 0–20 cm, 14.8% at 0–40 cm, 11.9% at 0–60 cm, and 8.2% at a 0–100 cm depth.
The 37 tillage sample points in question are divided into different management techniques: cotton in monoculture and in annual and biannual rotation with soybean and maize [72]; soybean [61,62], cotton, and maize monocultures [34] or in rotation [33]; annual soybean and maize rotation (one crop per year) [50]; sorghum in succession with maize [43]; soybean in rotation with maize succeeded by cover crop plants [74]; soybean-based crop rotation [52]; soybean as first crop and maize as second crop (same year) [54] in succession with forage grasses during the autumn–winter season [58,75]; rice and soybean-based crop rotated with cover crop plants [55]; rotation of maize and common bean varieties [63,65]; and no information found [48,60].
There are forty-two no-tillage sample points under different land managements: forage grasses or sorghum in succession with soybean [39]; cover crop plants in succession with maize [76] and soybean [74]; different rotations crops designed for using cotton, maize, and soybean [33] in succession with forage grasses [34,72]; annual soybean and maize rotation (one crop per year) [50]; sorghum in succession with maize [43]; soybean-based crop rotation [52,62], soybean as first crop and maize as second crop [54] succeeded by forage grasses [75]; rice and soybean-based crop rotation succeeded by cover crop plants [55]; rotation of maize, common bean varieties [63,65], and rice or tomatoes [60]; soybean monoculture [61,62]; and no information found [48].
The highest value for tillage and no-tillage systems at 0–20 and 0–40 cm depths was found in Minas Gerais State, in a 30% clay Latossolo Vermelho-Amarelo eutrófico (Ferralsol [22], Typic Eutrustox [23,24]) [43]. At 0–30 cm depth, the highest values for tillage and no-tillage systems were found in Minas Gerais State in a 42% clay Latossolo Vermelho distrófico (Ferralsol [22], Typic Haplustrox [23,24]) [75], and in Distrito Federal in a 50% clay Latossolo Vermelho distrófico (Ferralsol [22], Typic Haplustrox [23,24]) [52], respectively.
The highest value of carbon stock in tillage systems at 0–60 cm depth was found at Empresa Brasileira de Pesquisa Agropecuária (EMBRAPA) Cerrado research center in Distrito Federal [50]. The highest value for no-tillage systems at 0–60 cm depth was found in Goiás State, in a Latossolo Vermelho distrófico (Ferralsol [22], Typic Haplustrox [23,24]) [39].
The lowest value for agricultural land (pasture) at 0–60 cm and 0–100 cm depth was found at several sites in sandy soils in western Bahia (Supplementary Material Table S2). This source describes the agricultural land under investigation as rainfed agriculture and irrigated agriculture. For this reason, its values were not considered in Table 4, only in Table 1. The sample analysis in rainfed agriculture [31] showed mean values of 42.6 Mg ha−1 at 0–60 cm depth and 57.4 Mg ha−1 at 0–100 cm depth. Irrigated agriculture presented a mean of 78.1 Mg ha−1 at 0–100 cm depth.

3.6. Causes of the Decline of Soil Carbon Stocks in Pastures

Usually, pastures are established right after the replacement of native plant species. In the Cerrado, most pastures are classified as degraded [32]. A productive pasture is capable of storing equal or higher values of soil carbon than those of native vegetation [32,36,48,54,64], depending on the type of the latter (Table 2). It should also be noted that undisturbed fragments of native vegetation are unlikely to be found in the Cerrado nowadays. Lower pasture productivity and, consequently, declining soil carbon stocks are due to years of bad management (e.g., no fertilization, overgrazing, and weed infestation).
Moreover, in areas dominated by croplands, it should be taken into consideration that livestock is produced in areas with nutrient-poor sandy soils or lithic soils and in marginal land areas where mechanization or irrigation are unviable. For this reason, lower mean values of carbon stocks are more commonly found in pastures as compared to those found in agricultural lands and native vegetation areas [31]. The extensive livestock farming in Brazil’s central region is widely known for poor land management practices; thus, restoring degraded pastures is one of the best ways to increase soil carbon stocks in the Cerrado region.
A survey carried out at four sites in different states evaluated the impact of soil management on carbon stocks under pastures. The highest value of soil carbon stocks (164.7 Mg ha−1) at 0–100 cm depth was found in a site in Minas Gerais State (67% clay content soil). At other sites, with clay content between 11% and 42%, soil carbon stocks ranged from 53 to 95 Mg ha−1 at the same depth [32]. The difference in carbon stocks between well-managed productive pastures and degraded pastures ranged from 9.3 to 26.6 Mg ha−1 at 0–100 cm depth [32]. Considering 60 Mha pastures [29] of which 30 Mha are degraded, the restoration of these pastures can result in 0.27–0.79 Gt of carbon stored in the soil at 0–100 cm depth [32]. In addition, considering the mean value of 54.2 Mg ha−1 (Table 3) for the upper 0–30 cm layer, restoration can increase soil carbon stocks by 15% at 0–30 cm depth [73], i.e., 0.23 Gt. Therefore, these data indicate that pastures constitute the largest manageable soil carbon pool in agricultural land in the Cerrado biome.
Given the importance of Brachiaria for increasing soil carbon stocks, it is usually used in rotation with soybean- or maize-based crops during autumn–winter as well as in livestock-forest and integrated crop-livestock-forestry systems and intercropping perennial crops. This system improves the physical and biological quality of soils, protects them from erosion, and assists in the control of weeds, with the roots of the perennial crop growing deeper due to competition. In addition, it increases water and nutrient availability, thereby helping maintain the perennial crops during the dry season [77].
Integrated crop-livestock systems have been in use in the Cerrado region since the 1980s and their main objective is to ensure optimal productivity throughout the year by interspersing the system with a third grazing cover crop (usually Brachiaria/Panicum) in autumn–winter. These seeds are planted and mixed with fertilizers between the rows of maize. Once the seedlings are established, they remain suppressed under the canopy of maize. After the crop is harvested, they begin to grow and provide soil cover [78]. These systems are key to carbon storage in no-tillage systems by diversifying carbon input and protecting the soil. Nowadays, it is common to make use of forage grasses even where livestock grazing is not intended.
The roots of Brachiaria (Ulochoa) spp. reach great depths [77] and improve the physical quality of soils by increasing the complexity and connectivity of the soil pore networks [79]. Its capacity to provide aboveground biomass of resistant straw with high carbon/nitrogen ratio and lignin content [80] ranges between 7.4 and 18.8 Mg ha−1 [81]. This straw protects the soil from erosion and reduces soil water loss by evaporation. Also, by maintaining optimal topsoil temperature at high air temperatures and incidental solar radiation [82], common in the Cerrado region, the straw can reduce weed infestation [81], increase the phosphorus availability to plants [83], and improve nitrogen use efficiency [79].

3.7. Potential and Limitations of Soil Carbon Storage in No-Till

Worldwide, carbon storage in croplands is estimated at more than 140 Gt for the upper 0–30 cm layer of soil (i.e., about 10% of global storage at this depth). In South America and Brazil, it is estimated at about 9.42 Gt and 5.063 Gt for the same depth, respectively [84]. The Cerrado croplands store 0.4 ± 0.07 Gt and 0.68 ± 0.16 Gt for tillage (n = 8; 6.4 Mha) and no-tillage (n = 19; 11 Mha) soils, respectively, at 0–30 cm depth. Therefore, the Cerrado croplands are responsible for 9.02–13.9% of the total soil carbon stocks in South American croplands and 16.78–25.87% of the total soil carbon storage in Brazilian croplands for the upper 0–30 cm layer.
Differences between tillage and no-tillage systems, as indicated by the mean values in Table 4, are in accordance with the literature. In rainfed cotton crops in Goiás State using the same rotation after nine years, soil carbon stocks in no-tillage systems at 0–40 cm depth were 20% higher than those in tillage systems [72]. A study in the state of Minas Gerais shows values of soil carbon stocks for the top 0–20 cm layer around 9% higher for no-tillage systems than those for tillage systems [74].
A survey in western Bahia measured high carbon sequestration stocks per year. The initial soil carbon stock at 0–40 cm depth was 17.63 Mg ha−1. After six years, the mean value of soil carbon stocks for the tillage areas in a monoculture system was 30.26 Mg ha−1, resulting in an increase of 2.105 Mg ha−1 per year. During the same period, the soil carbon stocks in a rotation and no-tillage system increased by 3.47 Mg ha−1 per year at a 0–40 cm depth [34]. Western Bahia has one of the lowest potentials for carbon storage in the upper layers due to its sandy, acidic, and nutrient-poor soils [31,34]. Under these edaphoclimatic conditions, agricultural management techniques for correcting the soil acidity, e.g., limestone application, fertilization, and crop rotation, are key to achieving higher values of soil carbon.
This increases in western Bahia surpasses that for the 0–40 cm layer (between 0.32 and 1.46 Mg ha−1) found in 9- to 21-year-old no-tillage crops with soybean as first crop and maize, sorghum, or millet as second crop in the State of Goiás [54]. It also surpasses that of 1.2 Mg ha−1 per year found in a 9-year-old no-tillage system of cotton rotated with soybean, corn, and forage grasses after nine years on clayey soil in the same state [72]. These results indicate that crops under no-tillage systems constitute an important tool to increase soil carbon stocks. However, the amount of increase depends on the type of soil, climate conditions, clay content, rotation crops, and the initial soil carbon content [54].
Carbon sequestration in degraded soils is higher during the years immediately after crop implementation. Therefore, given the low initial carbon stocks at the experimental site and the low potential of western Bahia [34], its yearly accumulation rates are likely to decrease in the future [31]. Carbon sequestration under these conditions is limited and is likely to decrease as soon as the soil carbon sink is saturated, which could happen in about twenty years under edaphoclimatic conditions in the Cerrado [54].
Nowadays, soil compaction, acidification, and herbicide resistance pose important challenges to no-tillage systems. Dependent on soil moisture, compaction occurs as a result of many years of heavy machinery traffic. This problem can be solved in many cases by chiseling and subsoiling, as these land management techniques do not invert the layers and, as a result, do not disturb the soil as much as plowing and arrowing do [85]. Therefore, in light of preserving soil carbon stocks, minimal-disturbance management is recommended when strategic tillage is employed to solve soil compaction problems. In the case of acidification, it is usually solved by applying limestone to the soil. However, while the effectiveness of applying limestone without plowing and/or arrowing is controversial, there is no current technology to address soil acidification without strategic tillage.
Finally, increased weed resistance to herbicides in the Cerrado region has become the main concern for crop growers as the implementation of herbicide-resistant transgenic crops has increased in the last decades. It is estimated that 95% of soybeans, 89% of maize crops, and 95% of cotton crops are glyphosate-resistant [86]. Weed management in no-tillage systems is highly dependent on herbicides. Weed resistance to glyphosate increased in the region as it was previously used only in foliage desiccation but is now used as a post-emergent herbicide during the entire crop cycle of the aforementioned species. The way no-tillage management is currently carried out, i.e., by applying the same active ingredient on crops several times a year during many consecutive years, results in an environment with a high selection pressure [85,87].
Strategic tillage does not have to be recommended for controlling weeds, as many types of agricultural management can be employed to reduce or control herbicide-resistant weeds, such as selecting fast-growing crop varieties in order to decrease spacing between rows and increase plant density, rotating herbicides (different action mechanisms), rotating crops (crop diversification), and using species that can produce resistant straw and cover the soil during winter [85,87].

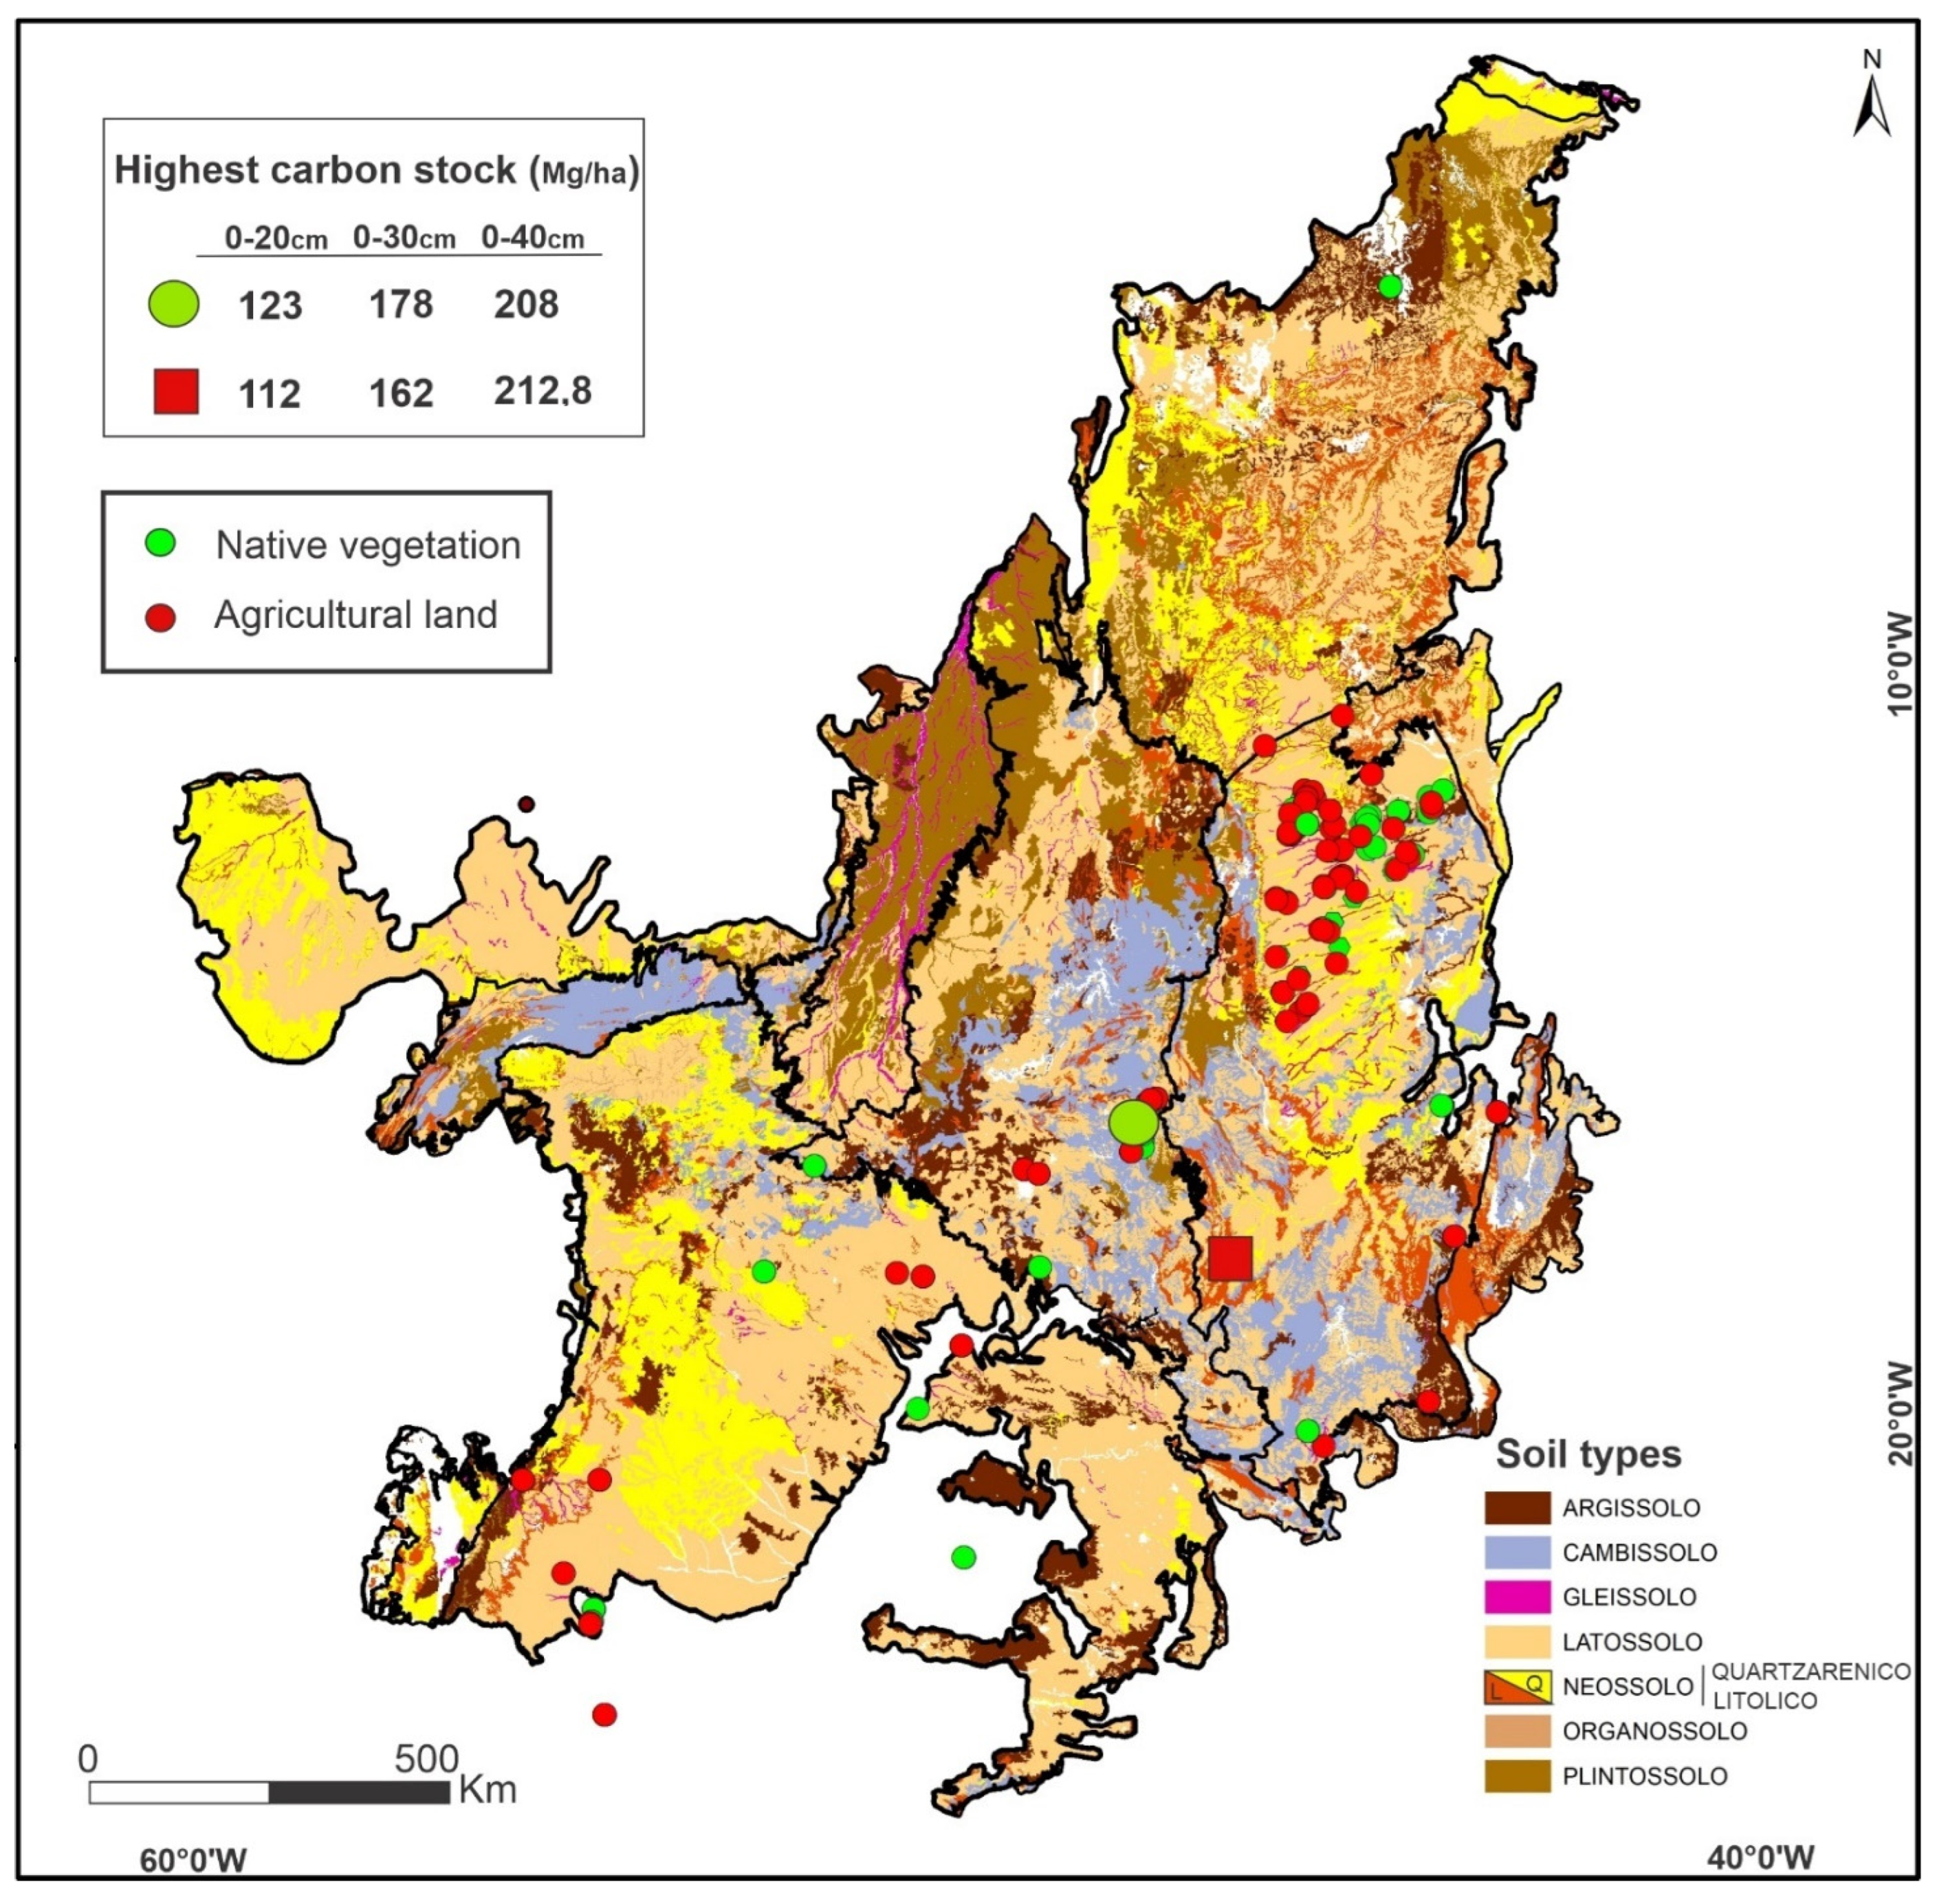
3.8. Relation of Soil Type and Roots Depth in the Soil Carbon Stocks

The Cerrado soils are usually weathered and depleted of nutrients. Most sites (170) reported by the sources used in this study are on Latossolos (Figure 4), which is the main class of soil in the Cerrado region. Latossolos exhibits greater depth (>2 m) and clay content variability (>16% to 70%), which results in biological and pedogenic activity at more than 2 m depth [21]. About 10 sites are on Neossolos Quartzarênicos, which also exhibits great depth (>2 m) but less than 16% of clay. Only a few sample points with high values of soil carbon storage were found at a 0–60 cm depth in native vegetation (wet grassland) areas on Gleissolos (i.e., with a gray horizon indicating iron reduction), Organossolos (i.e., with a histic horizon), and Plintossolos (i.e., with horizons of continuous petroplinthite). However, there is no information or evidence about its soil carbon storage below 60 cm deep in wet grasslands.
For each type of soil, the potential to store carbon depends on its depth and aggregate size fraction [88]. Available data indicate that high carbon storage in the Cerrado is usually found in high clay-content soils of metamorphic/volcanic origin and at subtropical climates. Also, this potential is contingent on the net primary productivity of each ecosystem, i.e., litter in topsoil and root biomass in deep soil.
Shrubland roots reach 9 m deep [89] or more; thus, even though about 70% of belowground biomass occurs in the upper 0–30 cm layer [9], carbon storage is likely to be found below 2 m deep in the Cerrado soil. In agricultural lands, soybean and maize monocultures cannot reach similar values of soil carbon stocks as compared to those found in the native vegetation areas because roots in these crops measure 0.7–0.9 m maximum, with most of them located in the upper 0–30 cm layer [90].
The roots of the most common pasture species established in the Cerrado can reach a depth of about 5 m [77]. The fact that the majority of the Cerrado area (>60%) is covered by Latosssolos, a type of soil that has the potential to store carbon at depths greater than 2 m—something that cannot be fully confirmed because there is no available data for depths greater than 2 m—suggests the importance of using grass in rotation or intercropping agricultural systems in the Cerrado.
On the other hand, Neossolos Litólicos (Leptosols [22]; soils of the Lithic sub-group [23,24]), which make up about 7% of the biome, are 0.3 m deep or less. In addition, some types of Cambissolos (Cambisols [22]; Inceptsols [23,24]), which together cover about 3% of the Cerrado, have lithic contact at a depth between 50 and 100 cm from the soil surface [21].

3.9. Role of Charcoal and the Variability among Soil Carbon Stocks Data

Soils in the Cerrado region often exhibit large amounts of refractory carbon (charcoal) as a result of wildfires, which play an important role in shaping its native vegetation [11,52], and due to an increasing number of anthropogenic fires, which are carried out to clear the native vegetation and open new areas for agricultural purposes. A few studies have attempted to develop conceptual models for carbon pools in soils. These models classify soil carbon pools under three types: active (soluble organic carbon and biomass; 5-year turnover); intermediate (>53 µm particulate organic matter; 20-to-40-year turnover); and passive (200-to-1500-year turnover) [91,92,93].
When native vegetation is converted into agricultural land, the existing charcoal may remain in the soil for a long period of time. Existing variability among data on soil carbon stocks [94] is due to several factors, such as different measuring methods [26], changes in soil bulk density due to land-use conversions [50], and use of either diachronic or synchronic approaches [95]. Therefore, any comparison among values found in different studies should be conducted with caution. The same goes when analyzing outlying values that lack logical explanation or are uncorroborated by data from similar studies.
Hence, comparing data on soil carbon stocks from different areas of native vegetation in agricultural lands or comparing data from no-till systems to those of tillage systems may lead to the overestimated of soil carbon storage values. For instance, the overestimation of soil carbon stocks in the upper layer may occur when comparing tillage systems to no-tillage systems, agricultural land to native vegetation, and degraded pastures to well-managed pastures due to the high soil bulk density. In order to correct differences in soil bulk density values for different land-use and land cover data, soil carbon stocks must be calculated on an equivalent soil mass basis [96,97].
Some of the sources used in this study provided no information about correcting values of soil carbon stocks on an equivalent mass basis. Given that six of them assessed differences in soil carbon stocks in tillage and no-tillage systems [34,43,55,72,74,76], one assessed carbon stocks in well-managed and degraded pastures at 1 m depth [40], and another also assessed carbon stocks in well-managed and degraded pastures but at 0–30 cm depth [73], their carbon stock values may be overestimated for tillage in comparison with no-tillage systems (Table 4) and for degraded pastures in comparison with well-managed pastures [40,73].

4. Conclusions

Our study investigated and analyzed data (n = 197) on total soil carbon stocks in the Cerrado biome. The results indicate gaps that need to be further explored. This study shows the distribution pattern of soil carbon stocks in the Cerrado biome and indicates evidence of existing carbon stocks below 2 m depth, especially in native vegetation and pastures, which needs to be further investigated. The lack of data on soil carbon stocks in agricultural lands below 100 cm depth should also be the focus of future research.
One of the limitations on our analysis derives from the uncertainty associated with the small number of sampling points and the variability among the available data due to differences in methodological procedures. It is important that future studies adhere to international research standards, as some soil researchers in the Cerrado have adopted intervals (0–20 and 0–40 cm depth) different to those prescribed in international standards (0–30 and 0–60 cm).
As regards the planning of research on soil carbon stocks, the Cerrado areas under investigation should be divided according to soil type and land-use/cover, taking into consideration their different geological/geomorphological provinces. For example, in spite of the Bananal basin province (Figure 1), where Plintossolos predominates (Figure 2), having a high potential for carbon storage, no data are available on soil carbon stocks for this type of soil in this province. Another example can be found in the Tocantins basin province (Figure 1), where Cambissolos are common; this type of soil presents low carbon stocks due to its shallowness (0.5 to 1 m depth).
Assessing the carbon storage potential for different soils under different land-uses/covers at different depths is important not only to characterize the total soil carbon storage in the Cerrado biome, but also to assess the impact of land-use change on carbon storage. Restoring degraded pastures as well as intercropping them with perennial crops or forests or rotating them with soybean and maize are also important measures to increase soil carbon stocks in the Cerrado region. Implementing no-tillage systems remains an effective way of increasing soil carbon stocks, in spite of demands for the use of the strategic tillage in the long run. By promoting lasting carbon storage in these different types of soil under different land-uses and covers, these measures can contribute to lowering CO2 emissions and, as a result, mitigating the impact of climate change.

Supplementary Materials

The following supporting information can be downloaded at: https://www.mdpi.com/article/10.3390/su14095571/s1, Table S1: Soil Carbon Stocks Data in Cerrado biome; Table S2: Georeferenced points of Soil Carbon Stocks Data from MATOPIBA.

Author Contributions

Conceptualization, G.R.C., L.A.S. and A.A.M.; methodology, G.R.C., L.A.S. and A.A.M.; writing—original draft preparation, G.R.C. and L.A.S.; writing—review and editing, G.R.C., L.A.S. and A.A.M.; supervision, A.A.M. All authors have read and agreed to the published version of the manuscript.

Funding

This work was partially supported by the São Paulo Research Foundation—FAPESP (grant no 2021/00572-0), the Coordination for the Improvement of Higher Education Personnel-CAPES (scholarship to the first author), and the National Council for Scientific and Technological Development-CNPq (grant no 308090/2019-5).

Conflicts of Interest

The authors declare no conflict of interest.

References

  1. Word Meteorological Organization. The State of Greenhouse Gases in the Atmosphere Based on Global Observations through 2018. WMO Greenh. Gas Bull. 2019, 15, 1–8. Available online: https://library.wmo.int/doc_num.php?explnum_id=10100 (accessed on 4 November 2021).
  2. Word Meteorological Organization. The State of Greenhouse Gases in the Atmosphere Based on Global Observations through 2020. WMO Greenh. Gas Bull. 2020, 17, 1–8. Available online: https://library.wmo.int/doc_num.php?explnum_id=10870 (accessed on 4 November 2021).
  3. Food and Agriculture Organization of the United Nations. 2016 The State of Food and Agriculture: Climate Change, Agriculture and Food Security; Food and Agriculture Organization: Rome, Italy, 2006. Available online: http://www.fao.org/3/a-i6030e.pdf (accessed on 4 November 2021).
  4. Beuchle, R.; Grecchi, R.C.; Shimabukuru, Y.E.; Seliger, R.; Eva, H.D.; Sano, E.; Achard, F. Land cover changes in the Brazilian Cerrado and Caatinga biomes from 1990 to 2010 based on a systematic remote sensing sampling approach. Appl. Geogr. 2015, 58, 116–127. [Google Scholar] [CrossRef]
  5. Souza, C.M., Jr.; Shimbo, J.Z.; Rosa, M.R.; Parente, L.L.; Alencar, A.A.; Rudor, B.F.T.; Hasenack, H.; Matsumoto, M.; Ferreira, L.G.; Souza-Filho, P.W.M.; et al. Reconstructing Three Decades of Land Use and Land Cover Changes in Brazilian Biomes with Landsat Archive and Earth Engine. Remote Sens. 2020, 12, 2735. [Google Scholar] [CrossRef]
  6. Ministério da Ciência Tecnologia e Inovação. Quarto Inventario Nacional Emissões de GGE por Setor 2016. Available online: https://www.gov.br/mcti/pt-br/acompanhe-o-mcti/sirene/emissoes/emissoes-de-gee-por-setor-1 (accessed on 4 November 2021).
  7. Kutsch, W.; Banh, M.; Heinemeyer, A. Soil Carbon Dynamics: An Integrated Methodology; Cambridge University Press: Cambridge, UK, 2012. [Google Scholar]
  8. Eiten, G. The Cerrado vegetation of Brazil. Bot. Rev. 1972, 38, 201–341. Available online: https://link.springer.com/content/pdf/10.1007/BF02859158.pdf (accessed on 4 November 2021). [CrossRef]
  9. Castro, E.A.; Kauffman, J.B. Ecosystem structure in the Brazilian Cerrado: A vegetation gradient of aboveground biomass. root mass and consumption by fire. J. Trop. Ecol. 1998, 14, 263–283. [Google Scholar] [CrossRef]
  10. Klink, C.A.; Machado, R.B. Conservation of the Brazilian Cerrado. Conserv. Biol. 2005, 19, 707–713. [Google Scholar] [CrossRef]
  11. Ribeiro, J.F.; Walter, B.M.T. As principais fitofisionomias do bioma Cerrado. In Cerrado: Ecologia e Flora; Sano, S.M., Almeida, S.P., Ribeiro, J.F., Eds.; EMBRAPA Cerrados: Brasília, Brazil, 2008; pp. 153–212. Available online: https://www.researchgate.net/publication/283072910_As_principais_fitofisionomias_do_bioma_Cerrado (accessed on 3 February 2022).
  12. Keller, M.; Palace, M.; Hurtt, G. Biomass in the Tapajos National Forest. Brazil: Examination of sampling and allometric uncertainties. For. Ecol. Manag. 2001, 154, 371–382. [Google Scholar] [CrossRef]
  13. Palace, M.; Keller, M.; Hurtt, G.; Frolking, S. A Review of Above Ground Necromass in Tropical Forests. In Tropical Forests; Sudarshana, P., Nageswara-Rao, M., Soneji, J.R., Eds.; InTech: Rijeka, Croatia, 2012; pp. 215–252. [Google Scholar] [CrossRef] [Green Version]
  14. Miranda, S.C.; Bustamante, M.; Palace, M.; Hagen, S.; Keller, M.; Ferreira, L.G. Regional Variations in Biomass Distribution in Brazilian Savanna Woodland. BIOTROPICA 2014, 46, 125–138. [Google Scholar] [CrossRef] [Green Version]
  15. Felfili, J.M.; Silva, M.C., Jr. Diversidade alfa e beta no cerrado sensu strictu, DF, GO, MG e BA. In Cerrado: Ecologia. Biodiversidade e Conservação; Scariot, A.A., Sousa-Silva, J.C., Felfili, J.M., Eds.; Ministério do Meio Ambiente: Brasília, Brazil, 2005; pp. 143–154. Available online: https://files.cercomp.ufg.br/weby/up/284/o/Cerrado_Parte1.pdf (accessed on 4 November 2021).
  16. IBGE. Biomas e Sistema Costeiro-Marinho do Brasil. Available online: https://www.ibge.gov.br/apps/biomas/ (accessed on 4 November 2021).
  17. Schobbenhaus, C.; Bley, B.; Neves, B. A geologia do Brasil no contexto da plataforma Sul-americana. In Geologia, Tectônica e Recursos Minerais do Brasil; Bizzi, L.A., Schobbenhaus, C., Vidotti., R.M., Gonçalves., J.H., Eds.; CPRM: Brasília, Brazil, 2003; pp. 5–25. Available online: https://rigeo.cprm.gov.br/handle/doc/5006 (accessed on 3 February 2022).
  18. Köppen, W.; Geiger, R. Klimate der Erde (Wall-Map 150 cm × 200 cm); Verlag Justus Perthes: Gotha, Germany, 1928. [Google Scholar]
  19. Valente, C.R.; Lattubese, E.M. Fluvial archive of peculiar avulsive fluvial patterns in the largest Quaternary intracratonic basin of tropical South America: The Bananal Basin. Central-Brazil. Paleogeogr. Paleoclimatol. Paleoecol. 2012, 356–357, 62–74. [Google Scholar] [CrossRef]
  20. EMBRAPA. Cerrado: Correção do Solo e Adubação; Embrapa Informação Tecnológica: Brasília, Brazil, 2004; Available online: https://www.embrapa.br/en/busca-de-publicacoes/-/publicacao/555355/cerrado-correcao-do-solo-e-adubacao (accessed on 3 February 2022).
  21. EMBRAPA. Brazilian Soil Classification System, 5th ed.; Embrapa: Brasília, Brazil, 2018; Available online: https://www.redeilpf.org.br/arquivos/SiBCS-2018-ISBN-9788570358219-english.pdf (accessed on 3 February 2022).
  22. FAO. World Reference Base for Soil Resources 2014; International Soil Classification System for Naming Soils and Creating Legends for Soil Maps (Update 2015). Word Soil Resources Reports 106. 2014. Available online: https://www.fao.org/3/i3794en/I3794en.pdf (accessed on 3 February 2022).
  23. Soil Survey Staff. Soil Taxonomy: A Basic System of Soil Classification for Making and Interpreting Soil Surveys, 2nd ed.; USDA-Natural Resources Conservation Service: Washington, DC, USA, 1999. Available online: https://www.nrcs.usda.gov/Internet/FSE_DOCUMENTS/nrcs142p2_051232.pdf (accessed on 3 February 2022).
  24. Soil Survey Staff. Keys to Soil Taxonomy, 12th ed.; USDA-Natural Resources Conservation Service: Washington, DC, USA, 2014. Available online: https://www.nrcs.usda.gov/wps/portal/nrcs/detail/soils/survey/class/?cid=nrcs142p2_053580 (accessed on 3 February 2022).
  25. Santos, H.G.; Carvalho, W., Jr.; Áglio, M.L.D.; Silva, J.S.; Dart, R.O.; Pares, J.G.; Fontana, A.; Martins, A.L.S.; Oliveira, A.P. O novo Mapa de Solos do Brasil: Legenda Atualizada; Embrapa Solos: Rio de Janeiro, Brazil, 2011; Available online: https://www.embrapa.br/en/busca-de-publicacoes/-/publicacao/920267/o-novo-mapa-de-solos-do-brasil-legenda-atualizada (accessed on 3 February 2022).
  26. Sato, J.H.; de Figueiredo, C.C.; Marchão, R.L.; Madari, B.E.; Benedito, L.E.C.; Busato, J.G.; de Souza, D.M. Methods of soil organic carbon determination in Brazilian savannah soils Soils and Plant Nutrition. Sci. Agric. 2014, 71, 302–308. [Google Scholar] [CrossRef] [Green Version]
  27. Gatto, A.; de Barros, F.N.; Novais, R.F.; Silva, I.R.; Mendonça, E.S.; Villani, E.M.A. Comparison of methods for determination of organic carbon in soils under eucalypt plantations. Rev. Bras. Ciênc. Solo 2009, 33, 735–740. [Google Scholar] [CrossRef]
  28. Bernoux, M.; Cerri, C.C.; Cerri, C.E.P.; Neto, M.S.; Metay, A.; Perrin, A.-S.; Scopel, E.; Razafimbelo, T.; Blavet, D.; Piccolo, M.D.C.; et al. Cropping systems, carbon sequestration and erosion in Brazil, a review. Agron. Sustain. Dev. 2006, 26, 1–8. [Google Scholar] [CrossRef] [Green Version]
  29. Scaramuzza, C.A.M.; Sano, E.E.; Adami, M.; Bolfe, E.L.; Coutinho, A.C.; Esquerdo, J.C.D.M.; Maurano, L.E.P.; Narvaes, I.S.; Oliveira Filho, F.J.B.; Rosa, R.; et al. Land-use and land-cover mapping of the brazilian cerrado based mainly on landsat-8 satellite images. Rev. Bras. De Cartogr. 2017, 69, 1041–1051. Available online: https://seer.ufu.br/index.php/revistabrasileiracartografia/article/view/44309 (accessed on 3 February 2022).
  30. Batjes, N.H. Total carbon and nitrogen in the soils of the world. Eur. J. Soil Sci. 1996, 47, 151–163. [Google Scholar] [CrossRef]
  31. Dionizio, E.A.; Pimenta, F.M.; Lima, L.B.; Costa, M.H. Carbon stocks and dynamics of different land uses on the Cerrado agricultural frontier. PLoS ONE 2020, 15, e0241637. [Google Scholar] [CrossRef]
  32. Braz, S.P.; Urquiagua, S.; Alves, B.J.B.; Jantalia, C.P.; Guimarães, A.P.; Santos, C.A.; Santos, S.C.; Pinheiro, É.F.M.; Boddey, R.M. Soil Carbon Stocks under Productive and Degraded Pastures in the Brazilian Cerrado. Soil Sci. Soc. Am. J. 2013, 77, 914–928. [Google Scholar] [CrossRef]
  33. Bayer, C.; Martin-Neto, L.; Mielcizuk, J.; Pavinato, A.; Dieckow, J. Carbon sequestration in two Brazilian Cerrado soils under no-till. Soil Tillage Res. 2006, 86, 237–245. [Google Scholar] [CrossRef]
  34. Bogiani, J.C.; Ferreira, A.C.B.; Borin, A.L.D.C.; Sofiatti, V. Sequestro de Carbono em Sistemas de Produção de Soja. Milho e Algodão em Solo Arenoso do Cerrado da Bahia; EMBRAPA Territorial Campinas: Campinas, Brazil, 2020; Available online: https://ainfo.cnptia.embrapa.br/digital/bitstream/item/223222/1/5317.pdf (accessed on 3 February 2022).
  35. Zinn, Y.L.; Resck, D.V.S.; Silva, J.E. Soil Organic Carbon as Affected by Afforestation with Eucalyptus and Pinus in the Cerrado Region of Brazil. For. Ecol. Manag. 2002, 166, 285–294. [Google Scholar] [CrossRef]
  36. Lardy, L.C.; Brossard, M.; Assad, M.L.L.; Laurent, J.Y. Carbon and Phosphorus Stocks of Clayey Ferralsols in Cerrado Native and Agroecosystems. Brazil. Agric. Ecosyst. Environ. 2002, 92, 147–158. [Google Scholar] [CrossRef]
  37. Meirelles, M.L.; Ferreira, E.A.B.; Franco, A.C. Dinâmica Sazonal do Carbono em Campo Úmido do Cerrado; EMBRAPA Cerrados: Planaltina, DF, USA, 2016; Available online: https://www.embrapa.br/en/busca-de-publicacoes/-/publicacao/570281/dinamica-sazonal-do-carbono-em-campo-umido-do-cerrado (accessed on 3 February 2022).
  38. França, A.M.S.; Paiva, R.J.O.; Sano, E.E.; Carvalho, A.M. Estimates for Carbon Stocks in Soil under Humid Grassland Areas in the Federal District of Brazil. Open J. Ecol. 2014, 4, 777–787. [Google Scholar] [CrossRef] [Green Version]
  39. Rossi, Q.C.; Pereira, M.G.; Giácomo, S.G.; Betta, M.; Polidoro, J.C. Frações orgânicas e índice de manejo de carbono do solo em Latossolo Vermelho sob plantio de soja no cerrado goiano. Rev. Bras. De Ciências Agrárias Recife 2021, 7, 2332–2341. [Google Scholar] [CrossRef] [Green Version]
  40. Tonussi, R.; Nair, P.K.R.; Nair, V.D.; Garcia, R.; Bernardino, F.S. Soil Carbon Storage in Silvopasture and Related Land-Use Systems in the Brazilian Cerrado. J. Environ. Qual. 2011, 40, 833–841. [Google Scholar] [CrossRef]
  41. Castro, E.A. Biomass, Nutrient Pools and Response to Fire in the Brazilian Cerrado. Master’s Dissertation, Oregon State University, Corvallis, OR, USA, 1996. [Google Scholar]
  42. Moraes, V.A.; Scolforo, J.R.S.; Silva, C.A.; de Mello, J.M.; Gomide, L.R.; Oliveira, A.D. Carbon and biomass stocks in a fragmente of cerradão in Minas Gerais. Brazil. Cerne 2013, 19, 237–245. [Google Scholar] [CrossRef] [Green Version]
  43. Brito, C.F.B.; Fonseca, V.A.; da Silva, N.P.; Braga, S.S.; Godinho, F.L.; Kondo, M.K.; Portugal, A.F.; Megda, M.X.V. Alterações físicas e biológicas de um Eutrustox (Latossolo) sob plantio direto e preparo convencional no semiárido brasileiro. Cienc. Del Suelo 2018, 36, 148–155. Available online: http://www.scielo.org.ar/scielo.php?script=sci_arttext&pid=S1850-20672018000200014 (accessed on 3 February 2022).
  44. Neves, C.M.N.; Silva, M.L.N.; Curi, N.; Macedo, E.L.G.; Tokura, A.M. Estoque de carbono em sistemas agrossilvopastoril. pastagem e eucalipto sob cultivo convencional na região noroeste do estado de Minas Gerais. Ciência e Agrotecnologia 2004, 28, 1038–1046. [Google Scholar] [CrossRef] [Green Version]
  45. Leite, L.F.C.; de Arruda, F.P.; Costa, C.N.; Ferreira, J.S.; Netto, M.R.H. Qualidade química do solo e dinâmica de carbono sob monocultivo e consórcio de macaúba e pastagem. Rev. Bras. De Eng. Agrícola E Ambient. 2013, 17, 1257–1263. [Google Scholar] [CrossRef] [Green Version]
  46. Fialho, R.C.; Teixeira, R.S.; Teixeira, A.P.M.; Reis, T.G.; Silva, I.R. Fertilization and Irrigation Affect Soil Carbon under Eucalyptus Plantation in the Cerrado. Floresta e Ambiente 2019, 26, e20170679. [Google Scholar] [CrossRef] [Green Version]
  47. Paiva, A.P.; Faria, G.E. Estoque de carbono do solo sob cerrado sensu stricto no Distrito Federal. Brasil. Rev. Trópica—Ciências Agrárias E Biológicas 2007, 1, 59–65. Available online: https://www.researchgate.net/publication/265583503_Estoque_de_carbono_do_solo_sob_cerrado_sensu_stricto_no_Distrito_Federal_Brasil (accessed on 3 February 2022).
  48. Corazza, E.J.; Silva, J.E.; Resck, D.V.S.; Gomes, A.C. Comportamento de diferentes sistemas de manejo como fonte ou depósito de carbono em relação à vegetação de Cerrado. Rev. Bras. De Ciências Do Solo 1999, 23, 425–432. [Google Scholar] [CrossRef] [Green Version]
  49. Silva, L.C.R.; Sternberg, L.; Haridasan, M.; Hoffmann, W.A.; Miralles-Wilhelm, F.; Franco, A.C. Expansion of Gallery Forests into Central Brazilian Savannas. Glob. Chang. Biol. 2008, 14, 2108–2118. [Google Scholar] [CrossRef]
  50. Ferreira, E.A.B.; Bustamante, M.M.C.; Resck, D.V.S.; Figueiredo, C.C.; Pinto, A.S.; Malaquias, J.V. Carbon Stocks in Compartments of Soil Organic Matter 31 Years after Substitution of Native Cerrado Vegetation by Agroecosystems. Rev. Bras. De Ciência Solo 2016, 40, e0150059. [Google Scholar] [CrossRef] [Green Version]
  51. Ozorio, J.M.B.O.; Rosset, J.S.; Schiavo, J.A.; Panachuki, E.; Souza, C.B.S.; Menezes, R.S.; Ximenes, T.S.; Castilho, S.C.P.; Marra, L.M. Estoque de carbono e agregação do solo sob fragmentos florestais nos biomas da Mata Atlântica e Cerrado. RBCIAM 2019, 53, 97–116. [Google Scholar] [CrossRef]
  52. Jantalia, C.P.; Resck, D.V.S.; Alves, B.J.R.; Zotarelli, L.; Urquiaga, S.; Boddey, R.M. Tillage effect on C stocks of a clayey Oxisol under a soybean-based crop rotation in the Brazilian Cerrado region. Soil Tillage Res. 2007, 95, 97–109. [Google Scholar] [CrossRef]
  53. Alves, R.P.; Junior, A.F.A.; Martins, E.S.; Nardoto, G.B. Role of soil carbon in the landscape functioning of the Alto São Bartolomeu watershed in the Cerrado region. Brazil. Pesqui. Agropecuária Bras. 2016, 51, 1241–1251. [Google Scholar] [CrossRef] [Green Version]
  54. Corbels, M.; Marchão, R.L.; Siqueira-Neto, M.; Ferreira, E.G.; Madari, B.E.; Scopel, E.; Brito, O.R. Evidence of limited carbon sequestration in soils under no-tillage systems in the cerrado of Brazil. Sci. Rep. 2016, 6, 21450. [Google Scholar] [CrossRef] [Green Version]
  55. Freixo, A.A.; Machado, P.L.O.A.; Guimarães, C.M.; Silva, C.A.; Fadigas, F.S. Estoques de Carbono e Nitrogênio e Distribuição de Frações Orgânicas de Latossolo do Cerrado sob Diferentes Sistemas de Cultivo. Rev. Bras. Ciênc. Solo 2002, 26, 425–434. [Google Scholar] [CrossRef] [Green Version]
  56. Bélizario, M.B.; Ferrão, G.E.; Cerri, C.C.; Siqueira-Neto, M. Soil carbon stocks cultivated with coffee in the Brazilian savanna: Effect of cultivation time and use of organic compost. Coffee Sci. 2018, 13, 53–62. [Google Scholar] [CrossRef] [Green Version]
  57. Freitas, R.C.A. Estoques de Carbono e Nitrogênio do solo e Fluxo de Gases do Efeito Estufa Em Solos Cultivados com Pinhão Mando (Jatropha spp.). Ph.D. Thesis, University of São Paulo, Piracicaba, Brazil, 2015. [Google Scholar]
  58. Marchão, R.L.; Becquer, T.; Brunet, D.; Balbino, L.C.; Vilela, L.; Brossard, M. Carbon and nitrogen stocks in a Brazilian clayey Oxisol: 13-year effects of integrated crop-livestock management systems. Soil Tillage Res. 2009, 103, 442–450. [Google Scholar] [CrossRef]
  59. Corbel, M.; Scopel, E.; Cardoso, A.; Bernoux, M.; Douzet, J.; Siqueira-Neto, M. Soil carbon storage potential of direct seeding mulch-based cropping systems in the Cerrados of Brazil. Glob. Chang. Biol. 2006, 12, 1773–1787. [Google Scholar] [CrossRef]
  60. d’Andréa, A.F.; Silva, M.L.; Curi, N.; Guilherme, L.G. Estoque de carbono e nitrogênio e formas de nitrogênio mineral em um solo submetido a diferentes sistemas de manejo. Pesq. Agropec. Bras. 2004, 39, 179–186. [Google Scholar] [CrossRef] [Green Version]
  61. Dieckow, J.; Bayer, C.; Conceição, P.C.; Zanatta, J.A.; Martin-Neto, L.; Milori, D.B.M.; Salton, J.C.; Macedo, M.M.; Mielniczuk, J.; Hernani, L.C. Land use. tillage. texture and organic matter stock and composition in tropical and subtropical Brazilian soils. Eur. J. Soil Sci. 2009, 60, 240–249. [Google Scholar] [CrossRef]
  62. Salton, J.C. Matéria Orgânica E Agregação No Solo Na Rotação Lavoura-Pastagem Em Ambiente Tropical. Ph.D. Thesis, University of Rio Grande do Sul, Porto Alegre, Brazil, 2005. [Google Scholar]
  63. Roscoe, R.; Buurman, P. Tillage effects on soil organic matter in density fractions of a Cerrado Oxisol. Soil Tillage Res. 2003, 104, 107–119. [Google Scholar] [CrossRef]
  64. Silva, J.E.; Resck, D.V.S.; Corazza, E.J.; Vivaldi, L. Carbon Storage in Clayey Oxisol Cultivated Pastures in the Cerrado Region, Brazil. Agric. Ecosyst. Environ. 2004, 103, 357–363. [Google Scholar] [CrossRef]
  65. Freitas, P.L.; Blancaneux, P.; Gavinelli, E.; Larré-Larrouy, M.-C.; Feller, C. Nível e natureza do estoque orgânico de latossolos sob diferentes sistemas de uso e manejo. Pesq. Agropec. Bras. 2000, 35, 157–170. [Google Scholar] [CrossRef] [Green Version]
  66. Pausas, J.G.; Bond, W.J. Alternative Biome States in Terrestrial Ecosystems. Trends Plant Sci. 2020, 25, 3. [Google Scholar] [CrossRef]
  67. Stape, J.L.; Binkley, D.; Ryanc, M.G.; Fonseca, S.; Loos, R.A.; Takahashi, E.N. The Brazil Eucalyptus Potential Productivity Project: Influence of water, nutrients and stand uniformity on wood production. For. Ecol. Manag. 2010, 259, 1684–1694. [Google Scholar] [CrossRef]
  68. Gatto, A.; Barros, N.F.; Novais, R.F.; Silva, I.R.; Leite, H.G.; Leite, F.P. Estoques de carbono no solo e na biomassa em plantações de eucalipto. Rev. Bras. Ciênc. Solo 2010, 34, 1069–1079. [Google Scholar] [CrossRef] [Green Version]
  69. Sausen, T.S.; Schaefer, G.F.P.; Tomazi, M.; Santos, L.S.; Bayer, C.; Rosa, L.M.G. Clay content drives carbon stocks in soils under a plantation of Eucalyptus saligna Labill. in southern Brazil. Acta Bot. Bras. 2004, 28, 266–273. [Google Scholar] [CrossRef]
  70. Isernhagem, E.C.C.; Rodrigues, R.A.R.; Diel, D.; Matos, E.S.; Conceição, M.C.G. Estoques de carbono lábil e total em solo sob integração lavoura-pecuária-floresta na região de Transição Cerrado/Amazônia. Nativa 2017, 5, 515–521. [Google Scholar] [CrossRef] [Green Version]
  71. Lorenz, K.; Lal, R. Soil organic carbon sequestration in agroforestry systems. A review. Agron. Sustain. Dev. 2014, 34, 443–454. [Google Scholar] [CrossRef] [Green Version]
  72. Ferreira, A.C.B.; Borin, A.L.D.C.; Lamas, F.M.; Bogiani, J.C.; Silva, M.A.S.; Filho, J.L.S.; Staut, L.A. Soil carbon accumulation in cotton production systems in the Brazilian Cerrado. Acta Scientiarum. Agron. 2020, 42, e43039. [Google Scholar] [CrossRef]
  73. Rosa, R.; Sano, E.S.; Rosendo, J.S. Estoque de carbono em solos sob pastagens cultivadas na bacia hidrográfica do Rio Paranaíba. Soc. Nat. 2014, 26, 333–351. [Google Scholar] [CrossRef]
  74. Bayer, C.; Martin-Neto, L.; Mielniczuk, J.; Pavinato, A. Armazenamento de carbono em frações lábeis da matéria orgânica de um Latossolo Vermelho sob plantio direto. Pesqui. Agropecuária Bras. 2004, 39, 677–683. [Google Scholar] [CrossRef] [Green Version]
  75. Bilibio, W.D.; Corrêa, G.F.; Borges, E.N. Atributos Físicos e Químicos de um Latossolo. sob diferentes sistemas de cultivo. Ciênc. Agrotec. 2010, 34, 817–822. [Google Scholar] [CrossRef]
  76. Carvalho, A.M.; Marchão, R.L.; Souza, K.W.; Bustamante, M.M.C. Soil fertility status. carbon and nitrogen stocks under cover crops and tillage regimes. Revista Ciência Agronômica 2014, 45, 914–921. [Google Scholar] [CrossRef] [Green Version]
  77. Silva, B.M.; Oliveira, G.C.; Serafim, M.E.; Carducci, C.E.; da Silva, E.A.; Barbosa, S.M.; de Melo, L.B.B.; dos Santos, W.J.R.; Pereira Reis, T.H.P.; de Oliveira, C.H.C.; et al. Soil Management and Water-Use Efficiency in Brazilian Coffee Crops. In Coffee-Production and Research; Castanheira, D.T., Ed.; IntechOpen: London, UK, 2019; pp. 1–20. [Google Scholar] [CrossRef] [Green Version]
  78. Kluthcouski, J.; Cobucci, T.; Aidar, H.; Yokoyama, L.P.; de Oliveira, I.P.; Costa, J.L.S.; da Silva, J.G.; Vilela, L.; Barcellos, A.O.; Magnabosco, C.U. Integração Lavoura-Pecuária Pelo Consórcio de Culturas Anuais Com Forrageiras, em Áreas de Lavoura, nos Sistemas plantio Direto e Convencional; EMBRAPA Arroz e Feijão: Santo Antônio de Goiás, Brazil, 2000; Available online: https://www.embrapa.br/en/busca-de-publicacoes/-/publicacao/208449/sistema-santa-fe---tecnologia-embrapa-integracao-lavoura-pecuaria-pelo-consorcio-de-culturas-anuais-com-forrageiras-em-areas-de-lavoura-nos-sistemas-direto-e-convencional (accessed on 3 February 2022).
  79. Galdos, M.V.; Brown, E.; Rosolem, C.A.; Pires, L.F.; Hallett, P.D.; Mooney, S.J. Brachiaria species influence nitrate transport in soil by modifying soil structure with their root system. Sci. Rep. 2020, 10, 5072. [Google Scholar] [CrossRef] [Green Version]
  80. Timossi, P.C.; Durigan, J.C.; Leite, G.J. Formação de palhada por braquiárias para adoção do sistema plantio direto. Bragantia 2007, 66, 617–622. [Google Scholar] [CrossRef] [Green Version]
  81. Balbinot, A.A., Jr.; Moraes, A.; Backes, R.L. Efeito de coberturas de inverno e sua época de manejo sobre a infestação de plantas daninhas na cultura de milho. Planta Daninha 2007, 25, 473–480. [Google Scholar] [CrossRef]
  82. Dalmago, G.A.; Bergamaschi, H.; Krüger, C.A.M.B.; Bergonci, J.I.; Comiran, F.; Heckler, B.M.M. Evaporação da água na superfície do solo em sistemas de plantio direto e preparo convencional. Pesq. Agropec. Bras. 2010, 45, 780–790. [Google Scholar] [CrossRef]
  83. Merlin, A.; He, Z.L.; Rosolem, C.A. Ruzigrass affecting soil-phosphorus availability. Pesq. Agropec. Bras. 2013, 48, 1583–1588. [Google Scholar] [CrossRef]
  84. Zomer, R.J.; Bossio, D.A.; Sommer, R.; Verchot, L.V. Global Sequestration Potential of Increased Organic Carbon in Cropland Soils. Sci Rep. 2017, 7, 15554. [Google Scholar] [CrossRef] [PubMed] [Green Version]
  85. Peixoto, D.S.; da Silva, L.C.M.; de Melo, L.B.B.; Azevedo, R.P.; Araújo, B.C.L.; de Carvalho, T.S.; Moreira, S.M.; Curi, N.; Silva, B.M. Occasional tillage in no-tillage systems: A global meta-analysis. Sci. Total Environ. 2020, 745, 140887. [Google Scholar] [CrossRef] [PubMed]
  86. Cruz, R.A.; de Oliveira, G.M.; de Carvalho, L.B.; da Silva, M.F.G.F. Herbicide Resistance in Brazil: Status, Impacts, and Future Challenges. In Pests, Weeds and Diseases in Agricultural Crop and Animal Husbandry Production; Kontogiannatos, D., Kourti, A., Mendes, K.F., Eds.; IntechOpen: London, UK, 2019. [Google Scholar] [CrossRef] [Green Version]
  87. Moreira, S.G. Desafios para a sustentabilidade dos sistemas de produção com culturas anuais. Inf. Agron. 2019, 4, 1–12. Available online: https://www.npct.com.br/publication/IASite.nsf/pub/available/IA-2019-4?OpenDocument&toc=2019 (accessed on 3 February 2022).
  88. Six, J.; Bossuyt, H.; Degryze, S.; Denef, K. A history of research on the link between (micro)aggregate, soil biota, and soil organic matter dynamics. Soil Tillage Res. 2004, 79, 7–31. [Google Scholar] [CrossRef]
  89. Pinheiro, R.C.; Bouillet, J.-P.; Pivello, V.R.; Aló, L.L.; Costa, V.E.; Meersche, K.V.; Guerrini, I.A.; Laclau, J.-P. Roots take up labeled nitrogen from a depth of 9 m in a wooded savanna in Brazil. Soil Biol. Biochem. 2021, 160, 108282. [Google Scholar] [CrossRef]
  90. Gao, Y.; Duan, A.; Qui, X.; Liu, Z.; Sun, J.; Zhang, J.; Wang, H. Distribution of roots and root length density in a maize/soybean strip intercropping system. Agric. Water Manag. 2010, 98, 199–212. [Google Scholar] [CrossRef]
  91. Kaiser, K.; Guggenberger, G. The role of DOM sorption to mineral surfaces in the preservation of organic matter in soils. Org. Geochem. 2000, 31, 711–725. [Google Scholar] [CrossRef]
  92. Duxburry, J.M.; Smith, M.S.; Doran, J.W. Soil organic matter as a source and a sink of plant nutrients. In Dynamics of Soil Organic Matter in Tropical Ecosystems; Coleman, D.C., Oades, J.M., Uehara, G., Eds.; University of Hawaii Press: Honolulu, HI, USA, 1989; p. 3367. [Google Scholar]
  93. Cambardella, C.A.; Elliot, E.T. Particulate soil organic-matter changes across a grassland cultivation sequence. Soil Sci. Soc. Am. J. 1992, 56, 777–783. [Google Scholar] [CrossRef]
  94. Batlle-Bayer, L.; Batjes, N.H.; Bindraban, P.S. Changes in organic carbon stocks upon land use conversion in the Brazilian Cerrado: A review. Agric. Ecosyst. Environ. 2010, 137, 47–58. [Google Scholar] [CrossRef]
  95. Costa Junior, C.; Corbeels, M.; Bernoux, M.; Píccolo, M.C.; Siqueira-Neto, M.; Feigl, B.J.; Cerri, C.E.P.; Cerri, C.C.; Scopel, E.; Lal, R. Assessing soil carbon storage rates under no-tillage: Comparing the synchronic and diachronic approaches. Soil Tillage Res. 2013, 134, 207–212. [Google Scholar] [CrossRef]
  96. Sisti, C.P.J.; Santos, H.P.; Kohhan, R.; Albes, B.J.R.; Urquiaga, S.; Bodey, R.M. Change in carbon and nitrogen stocks in soil under 13 years of conventional or zero tillage in Southern Brazil. Soil Tillage Res. 2004, 76, 39–58. [Google Scholar] [CrossRef]
  97. Carvalho, J.L.N.; Cerri, C.E.P.; Feigel, B.J.; Piccolo, M.C.; Godinho, V.P.; Cerri, C.C. Carbon sequestration in agricultural soils in the Cerrado region of the Brazil Amazon. Soil Tillage Res. 2009, 103, 342–349. [Google Scholar] [CrossRef]
Figure 1. Map of the six Brazilian biomes [16], Cerrado’s geology and geological provinces [17], and Köppen [18] climate zones.
Sustainability 14 05571 g001
Figure 2. Soil map of the Cerrado region [25].
Sustainability 14 05571 g002
Figure 3. (A) Locations of the sampling sites; (B) mean values of soil carbon stocks for total sample points, agricultural land, and native vegetation.
Sustainability 14 05571 g003
Figure 4. The position of the sample plots in the Cerrado, and the location of the highest carbon stocks data throughout the biome.
Sustainability 14 05571 g004
Table 1. Soil carbon stocks in Cerrado biome.
Land-UseSoil LayerNumber of SitesMinMeanMaxCV (%)
Native vegetation Mg ha−1
0–204416.255.7123.849.4
0–301721.777.0 a178.260.3
0–401828.9100.7 a208.954.4
0–601650.4130.3 a278.160.6
0–1002254.6150.4 a414.4124
0–2008230.0261.2 a297.09.3
Agricultural land
0–209416.146.7112.243.7
0–305423.565.5 a162.545.5
0–406229.679.9 a212.8115.7
0–602436.8137.3 a303.782.4
0–1004251.7174.0 a466.1118.7
0–2001252.0252.0 a252.0
CV: coefficient of variation. Means for the same soil depths followed by the letter a are not significantly different at p < 0.01 (Mann–Whitney test).
Table 2. Soil carbon stocks in native vegetation in the Cerrado biome.
Land CoverSoil LayerNumber of SitesMinMeanMaxCV (%)
Forestland Mg ha−1
0–20733.165.2 bc112.851.0
0–30251.0100.4 bc149.769.5
0–40645.6104.6 a189.754.0
0–60561.5124.0 bc266.667.6
0–100582.5182.4 a414.474.1
0–2002248.0251.2 a254.32
Shrubland
0–202716.248.9 b *79.029.1
0–301121.754.3 b96.640.4
0–40728.971.4 a119.938.2
0–60750.486.3 b154.445.6
0–1001254.6130.5 a203.142.0
0–2003230.0169.0 a271.213.9
Grassland
0–20731.154.2 b72.028.3
0–40254.768.3 a81.928.2
0–100399.7170.2 a209.028.9
0–2004277.0285.0 a297.03.7
Wet grassland
0–20376.098.5 c *123.824.4
0–303113.3145.0 c178.222.4
0–403148.8182.6 a208.916.8
0–603211.4243.5 c278.113.7
CV: coefficient of variation. Means for the same soil depths followed by a (not significantly different at p < 0.05; Kruskal–Wallis test), b,c (not significantly different at p < 0.05; Pairwise Main–Whitney exact test), and * (significantly different at p < 0.001; Pairwise MW exact test).
Table 3. Soil Carbon Stocks in planted forests, agroforests, and pastures in the Cerrado biome.
Land CoverSoil LayerNumber of SitesMinMeanMaxCV (%)
Planted Forest Mg ha−1
0–20744.986.2 b * 102.523
0–302135.4138.8 bc142.13
0–40778.4150.8 b *183.324
0–60941.6169.7 a262.452
0–1007148.2303.7 b *414.029
Agroforest
0–20725.048.9 bc98.269.4
0–30371.2118.7 b 144.134.7
0–40741.189.0 bc208.082.6
0–60365.3209.8 a301.060.3
0–1002407.8430.4 b453.07.4
Pasture
0–202424.442.8 c *112.240
0–301423.554.2 c162.565
0–401439.074.3 c *212.855
0–60336.8129.8 a303.7116
0–1001851.7122.3 *466.1199
0–2001252.0252.0252.0
CV: coefficient of variation. Means for the same soil depths followed by a (not significantly different at p < 0.05; Kruskal–Wallis test), b,c (not significantly different at p < 0.05; Pairwise Main–Whitney exact test), and * (significantly different at p < 0.001; Pairwise MW exact test).
Table 4. Soil carbon stock for tillage and no-tillage systems.
Land CoverSoil LayerNumber of SitesMinMeanMaxCV (%)
Tillage Mg ha−1
0–202216.139.784.937
0–301945.463.3 a81.518
0–401429.661.2 a116.339
0–60285.791.5 a97.29
0–1008125.3147.8176.414
No-tillage
0–202820.746.087.130
0–301040.263.5 a85.924
0–401937.570.3 a124.328
0–60492.9102.4 a116.110
0–1003135.8160.0 a186.313
CV: coefficient of variation. Means at the same soil depth; those followed by the letter a are not significantly different at p < 0.05 (Mann-Whitney test).
Publisher’s Note: MDPI stays neutral with regard to jurisdictional claims in published maps and institutional affiliations.

