Article

The Relationship between Urban Green Space and Urban Expansion Based on Gravity Methods

1
Department of Landscape Architecture, Central South University of Forestry and Technology, Changsha 410018, China
2
Hunan Big Data Engineering Technology Research Center of Natural Protected Areas Landscape Resources, Changsha 410004, China
3
School of Biological Sciences, Southern Illinois University Carbondale, Carbondale, IL 62901, USA
*
Author to whom correspondence should be addressed.
Sustainability 2022, 14(9), 5396; https://doi.org/10.3390/su14095396
Submission received: 8 March 2022 / Revised: 23 April 2022 / Accepted: 27 April 2022 / Published: 29 April 2022

Abstract

:
Urban green space, comprising parks, fields, woodlands, and other semi-natural areas, is a fundamental component of urban ecosystems. The determination of the relationship between urban green space and urban sprawl is necessary to understand urbanization and the provision of urban ecosystem services. It has been hypothesized that the center of urban (i.e., population and economic) areas in fast-growing cities would migrate toward urban green space over time. To test this hypothesis, urban expansion and urban green space expansion were examined in five cities in China and five cities in the U.S. that were experiencing high rates of growth. Landsat images of those cities from 2000 to 2017 were combined with annual population and economic data and used to quantify the extent and migration of the urban green space. These data were analyzed using the center of gravity method by Grether and Mathys and circular statistics were used to determine the relationship between urban green space and urban expansion. Eight out of the ten cities showed a divergent pattern, i.e., the population and economic centers moved in a different direction to that of the urban green space. The movement of the mean centers of the urban green spaces in the U.S. cities was more consistent than that of the Chinese cities. Over 18 years, the movement of urban green space and urban expansion in the 10 cities showed a synchronous growth trend; however, the proportion of urban green space in the cities decreased. The urban expansion rate exceeded the population growth rate, which led to problems with an unreasonable urban sprawl that is likely to deplete the provision of ecosystem services in the future. In conclusion, the centrifugal forces of urban green space that lead to the movement of population and economic centers away from green spaces play a larger role in urban change than the centripetal forces that pull these centers toward urban green space.

1. Introduction

Urban green space includes parks, nature preserves, wild areas, and amenity lands that are located in a city [1]. These areas are important features of urban ecosystems and have important effects on the control of urban growth and the improvement of the urban ecological environment and quality of life in urban areas [2,3,4]. Urban green space also has the function of regulating and improving the urban ecosystem and is the main place for the daily leisure activities of local residents [5]. After the process of “development first, governance later”, London, Tokyo, Singapore, and other cities in developed industrial countries and regions have devoted great importance to the role of urban green space within urban development and have formulated urban green space planning, which has achieved remarkable results [6,7]. It was not until the late 1970s that China put forward the urban green space policy of “connecting pieces into clusters and combining dots, lines and surfaces”, after which, urban green space construction entered a period of rapid development [7,8]. Despite this, the relationship between urban green space and urban development is still controversial [9,10,11]. This controversy is manifested among planners, private landowners, and different agencies in terms of setting urban green space standards and development patterns in urban areas [12]. Many critics have argued that the quality of urban green space is more important than quantity [2,10,13]. It is particularly important to balance the relationship between economic growth, quality of life for the residents, environmental protection, and the distribution of land for various functions in order to help to guide healthy and sustainable urban development within overall urban planning [4].
Cities are spatial locations in which humans are the main body, space utilization is the physical characteristic, and the integration of economic benefits and social progress is the purpose [14]. In developed countries, urban sprawl is mainly manifested in the decentralization and spread of low-density populations from cities into rural areas [15]. However, in China, urban sprawl is mainly manifested in the expansion of urban boundaries, which is brought on by the rapid growth of the urban economy and population [16]. Early research has suggested that socioeconomic activities, such as tax policies, bank loans, and population growth, were the major causes of urban development [5,13,17,18,19]. As people pay more and more attention to the urban environment, it has been found that urban green space not only affects urban spatial structures but also isolates and connects urban spaces [12]. Urban landscapes can only play a positive role in the control of urban expansion with the active participation of people [20,21,22]. The expansion of urban green space, industry, residential areas, and other components of urban space promotes the outward extension of the peripheries of urban areas [17,23,24]. Nevertheless, there is still a lack of in-depth research on the internal mechanisms of urban green space and urban expansion.
Urban green space (UGS) is a crucial component of built-up urban areas that directly affects urban structures and expansion [25,26]. The new economic geography, which emerged in the 1990s, has used mainstream economic methods to analyze the spatial locations of economic activities and has led to in-depth discussions on the formation and expansion of cities [27,28]. Although there has been abundant research on urban expansion from the perspective of the new economic geography [6,9,24,27,29,30], the impact of urban green space on the spatial distribution of economic subjects have rarely been considered comprehensively [31].

2. Theoretical Analysis of Urban Green Space and Urban Expansion

2.1. Urban Expansion from the Perspective of the New Economic Geography

The history of urban development in the U.S. can be divided into two stages: centralized urbanization and diffusion urbanization [32]. Between 1850 and the two world wars, the development of cities was compact, and the centers of cities made up the concentrated area of finance and manufacturing [32,33]. At that time, Chinese cities and urban green space were going through war and were developing very little [32]. During the later period, the urban development pattern in the U.S. changed little, but the urban boundaries expanded to the suburbs [34]. From the two world wars to the present, the development of cities has been polycentric and decentralized [35]. Urban populations have gradually shifted to the suburbs, and the nature of the suburbs that are located around the cities has changed [33,36]. Cities have developed into polycentric metropolitan areas, and the most usual urban spatial form has become urban agglomerations or urban belts, while cities in China have shown a trend of centralized development, which has supported the expansion of the population and the deterioration of urban green space and the ecological environment [36].
Urban expansion is the result of the interaction between centripetal and centrifugal forces, which determine the spatial distribution structure of the industry, capital, and market size [8,37,38]. The centripetal force mainly comes from the market proximity effect and the cost-of-living effect: the market proximity effect means enterprises prefer to concentrate in cities with a large market size because a large demand market is conducive to product sales so that enterprises can achieve economies of scale [8,38,39]. By contrast, the centrifugal force mainly comes from market congestion effects, land rent increases, environmental degradation, and other factors [8] and leads to the movement of different types of urban centers away from each other.
With the continuous development of cities, enterprises and populations continue to increase, leading to the intensification of competition among enterprises, traffic congestion, and rent increases [8]. The intensification of enterprise development and an increase in population results in environmental pollution and climate deterioration. The impacts of changes in populations, economy, and the deterioration of the environment may lead to an increase in production costs of enterprises, a decline in profit margins, an increase in the living costs of people, and a decrease in overall utilities, increasing centrifugal forces [8,25,40,41]. When the centripetal force is greater than the centrifugal force, that is, the benefits brought by the urban agglomeration economy are greater than the costs paid by enterprises or people in urban production and living, the urban population density and number of enterprises will further increase, and the demand for urban land will also increase [31,40]. Consequently, the urban population will migrate, forming new cities or suburbs between cities and the countryside.
Based on the above discussion, the new economic geography constructs a dynamic mechanism from micro individual economic decision making to macro locations [42]. This mechanism provides a theoretical basis for this paper to explore the relationship between urban green space and urban space expansion from the perspective of individual benefit maximization. Understanding this relationship is of practical significance for urban planning and regional development, improving urban ecology and people’s livelihood. Existing in the research of new economic geography, the term “city-scale” mainly refers to the scale of economic activity, embodied in the size of the population, industry, and market [35,42]. The expansion of economic activity is necessary for cities to continue to expand in space, matching the new economic geography. This paper introduces the influence of urban green space on urban expansion.

2.2. The Internal Mechanism of Urban Green Space Influencing Urban Expansion

As an important public good in built-up areas, urban green space has an externality on residents and production activities that surround the green space, and this externality is regional [25,33]. In other words, residents in a certain geographical area are affected more than residents outside this area. It is assumed that the migration of suburbanites to the “core area” will lead to changes in prices and costs, wage levels, along with the externality of urban green space as a public good [33,40]. Urban green space has agreeableness and a public infrastructure condition that is superior to the suburbs, thus forming a centripetal force [36,43]. The centripetal force increases with the increase in the urban green space area [25]; however, as urban green space is not exclusive and competitive as a public good, the centripetal force of green space decreases with the population growth of the “core area”, such as an area with high population densities [14,15]. The availability of urban green space in cities can affect the price of living spaces and residential areas. The distance between housing areas and green spaces such as urban parks have a negative relation; as you move farther from park areas, housing prices decrease [44]. High-income people and groups with a high willingness to pay can stay in the built area around the green space, and those unwilling to pay for green space, however, move to the suburbs [15,44]. In addition, an increase in urban green space reduces the available residential area in built-up areas, and the growing urban population requires the continuous expansion of urban space to meet the living needs of its citizens. There is thus a complex set of socioeconomic forces acting on the spatial dynamics between urban population centers and green spaces [44].

2.3. Linking Theory to Existing Research

Rapid urbanization has transformed the fundamental relationship between cities and their green space [45]. The geography of urbanization is moving in multiple dimensions which are changing the economic, social, cultural, and environmental aspects of society [29,45]. These dimensions of urbanization, such as demographic, economic, social, and environmental dimensions, are complex, and how they interact with each other remains a question [45]. Thus, based on the theory of new economic geography, the inner pattern of urban green space and urban spatial structure was studied. Landsat satellite and urban land data from ten rapidly growing cities in China and the U.S. from 2000 to 2017 were used. The objective of this study was to explore shifts through time in urban green space and the population and economic centers. This analysis allowed an assessment of the relationship between urban spatial evolution and land development. An understanding of this relationship allowed recommendations to be made for improving urban ecosystem development and the optimization of urban space layout along with proposed policy recommendations.

3. Data Sources and Research Methods

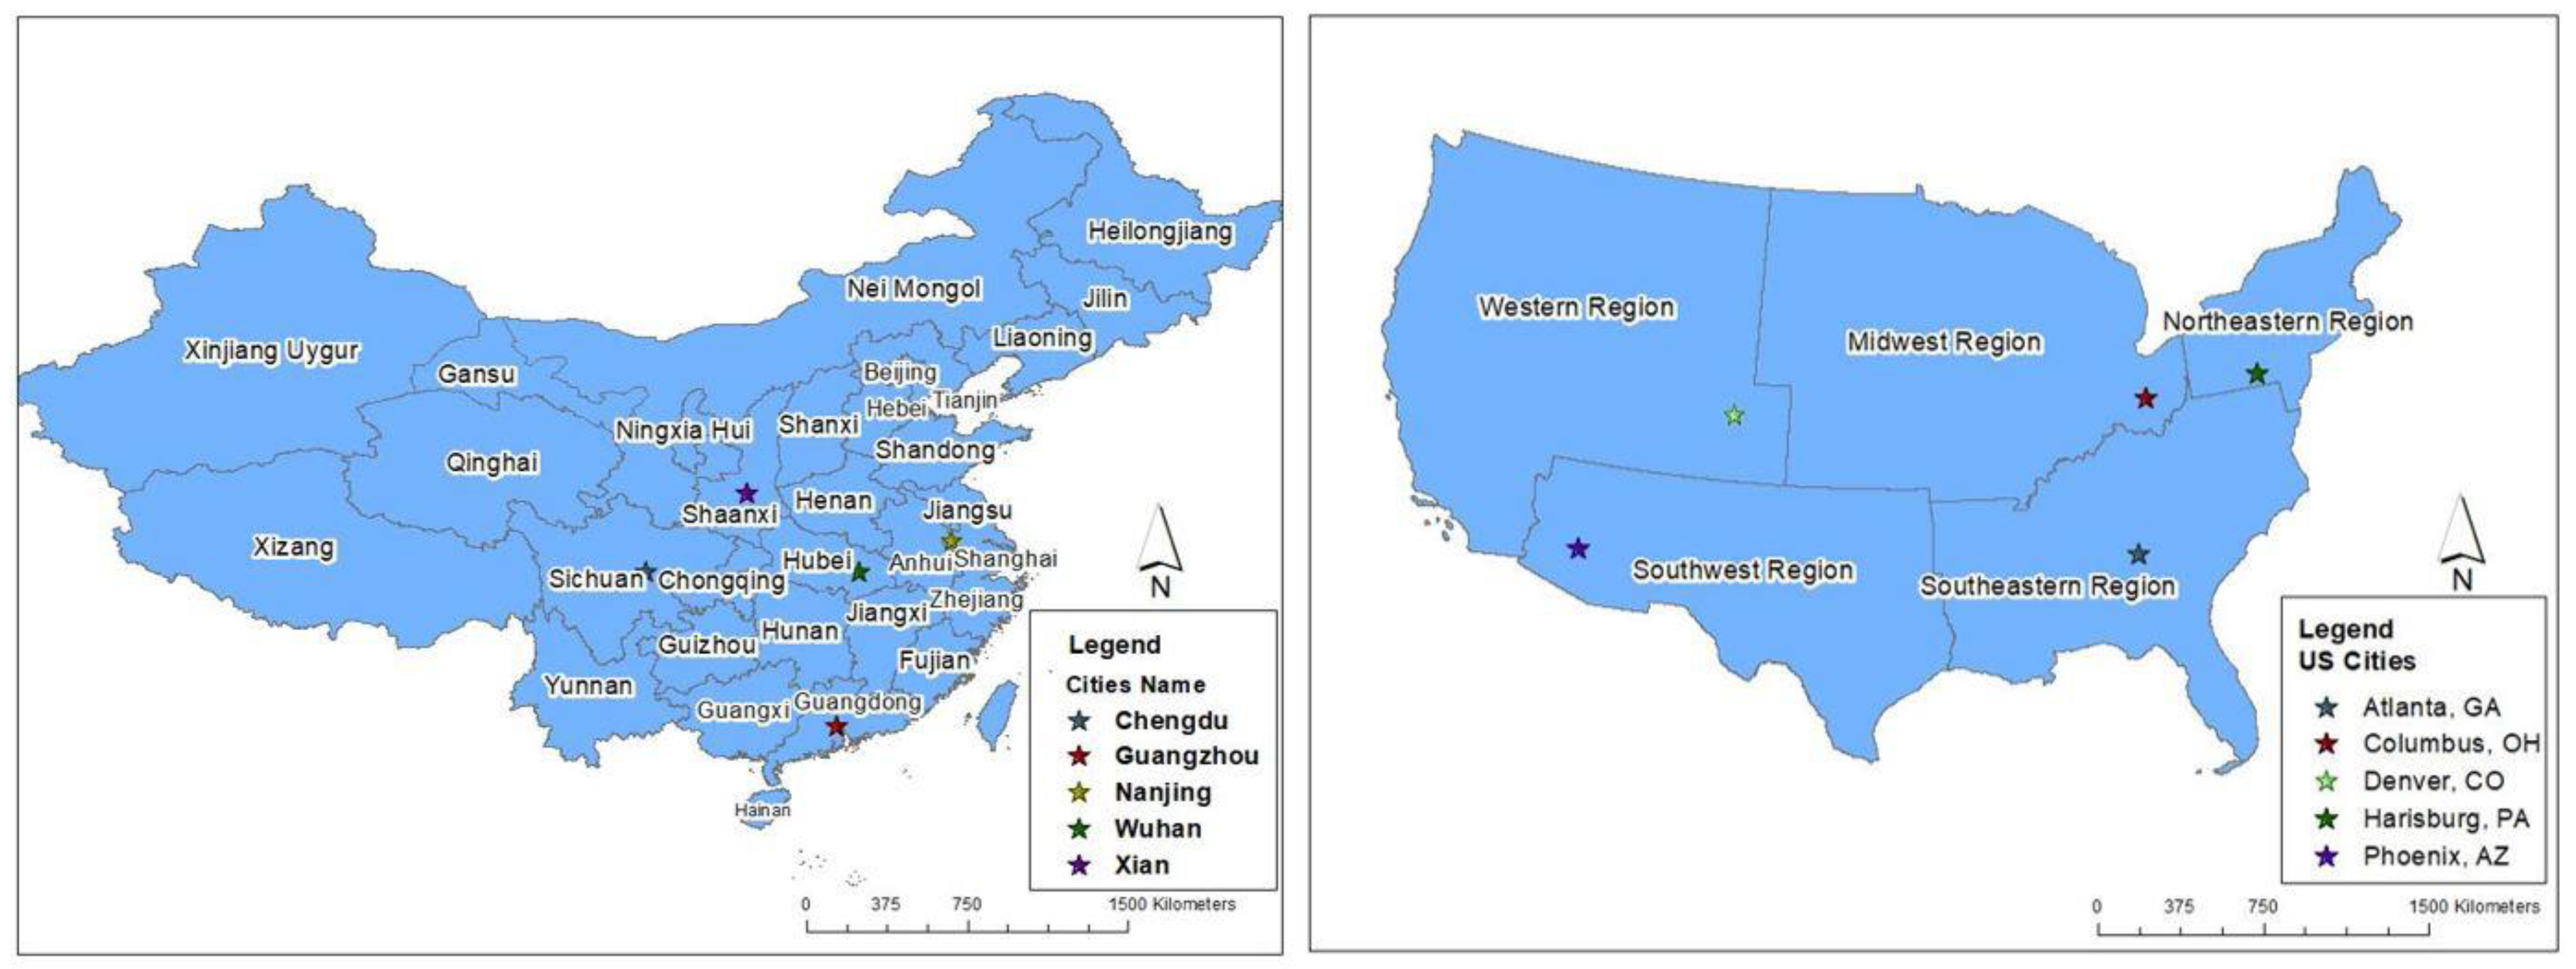
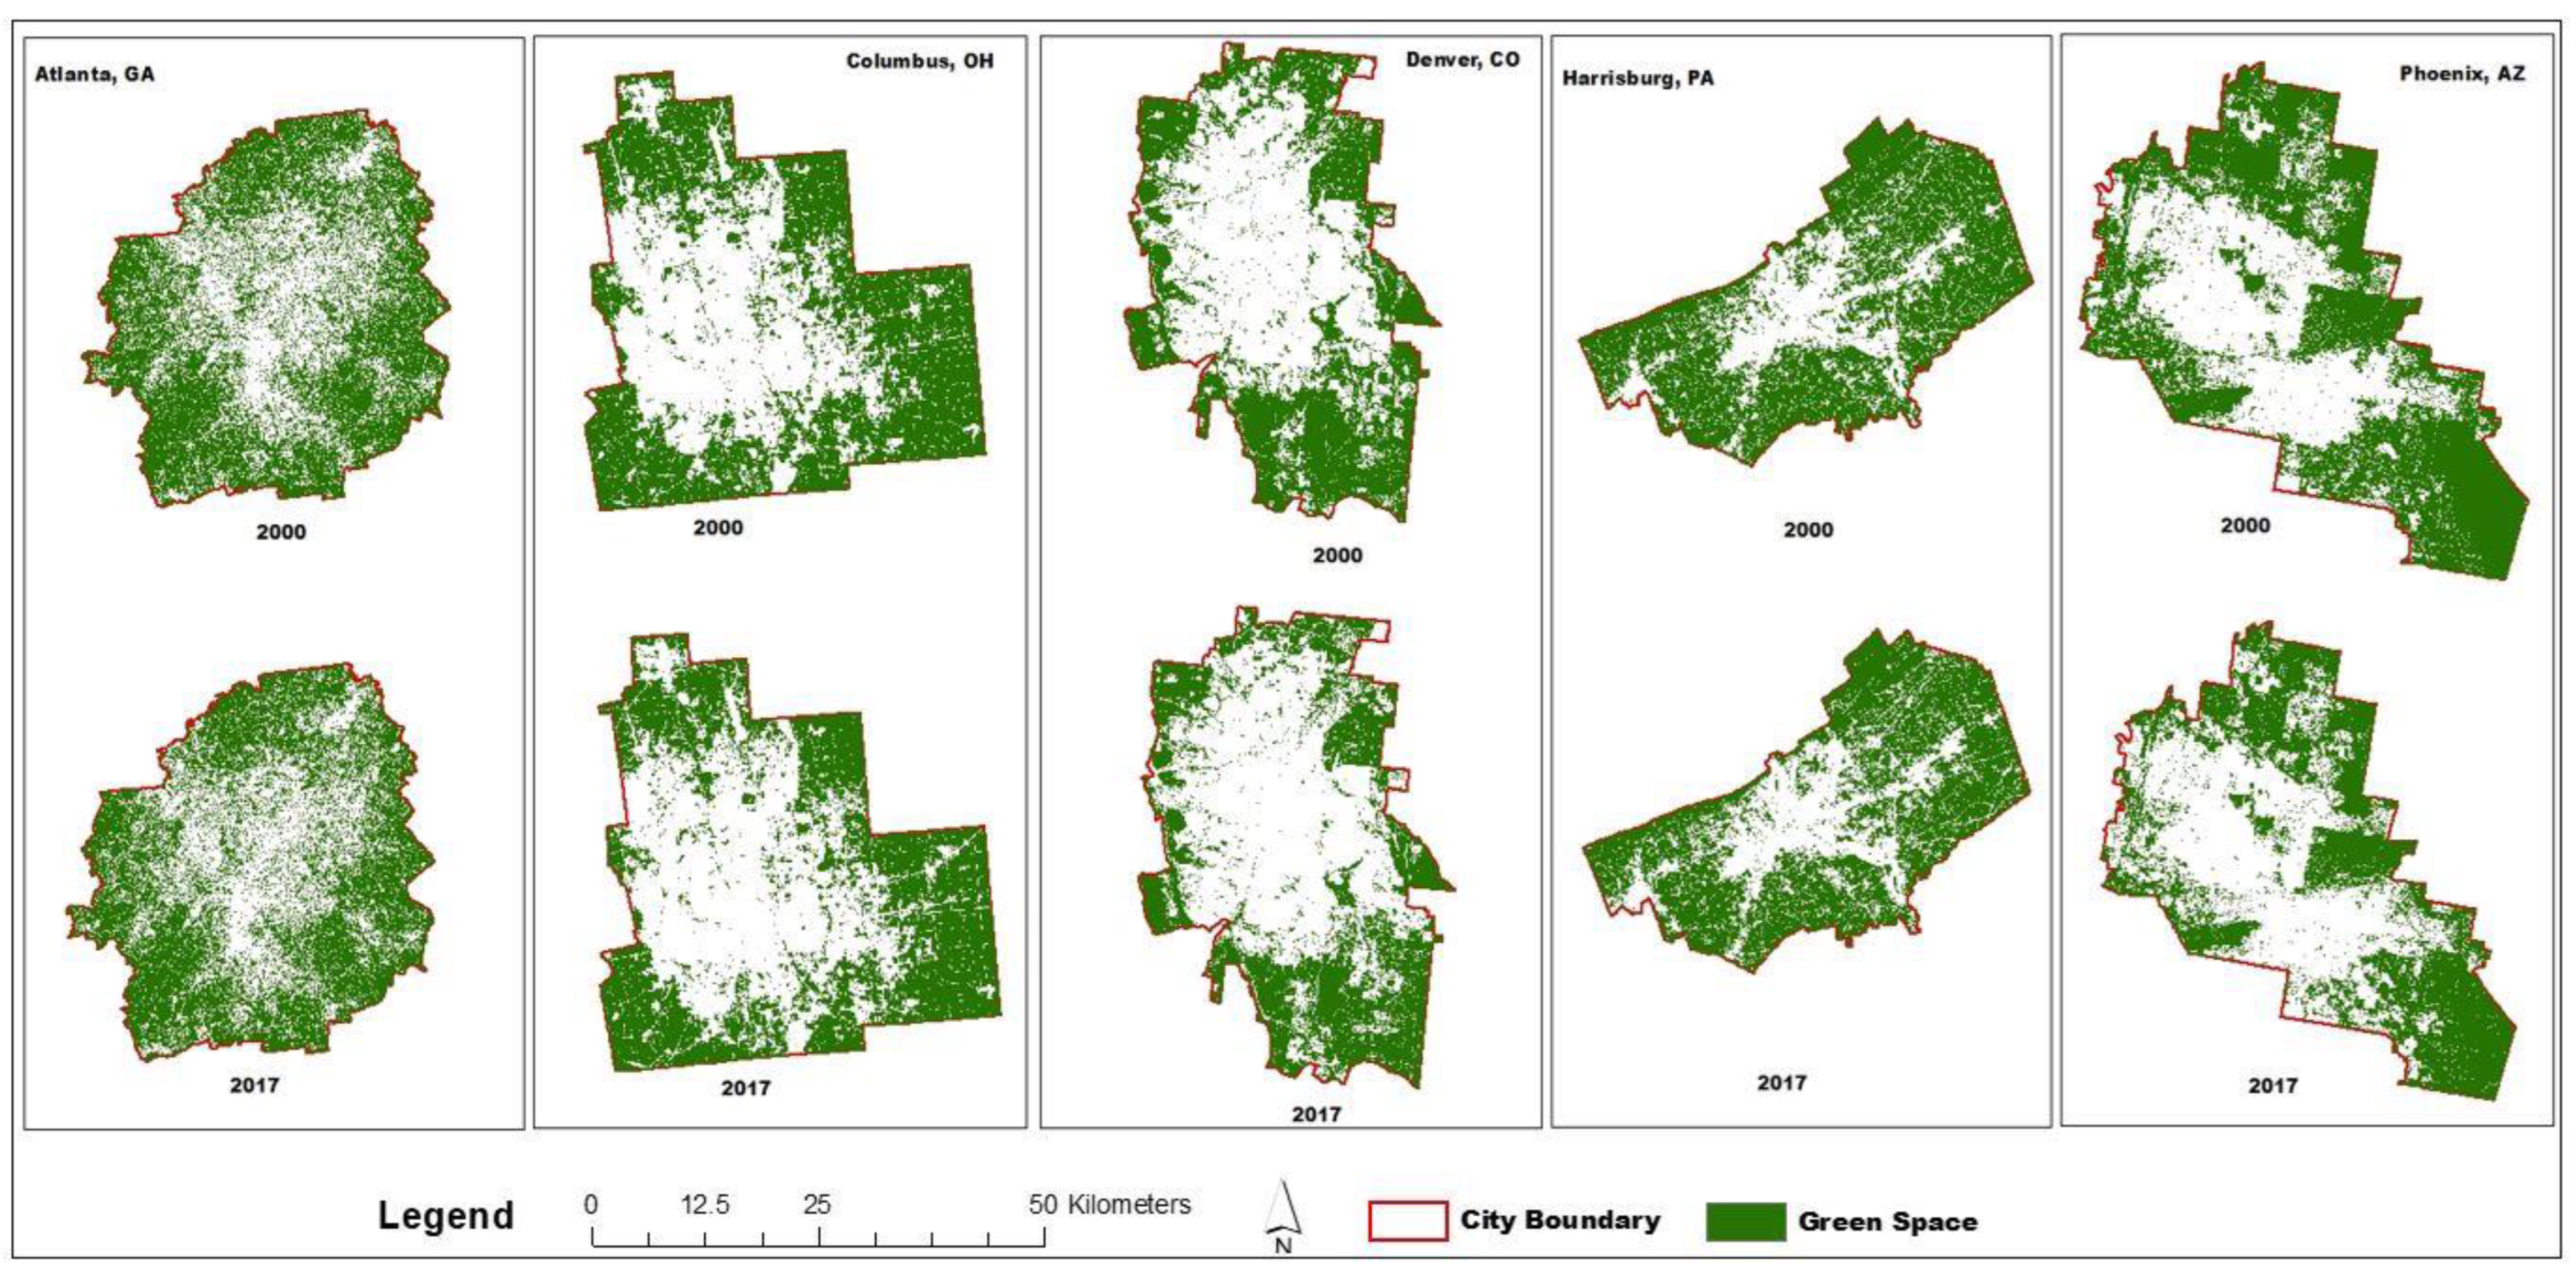
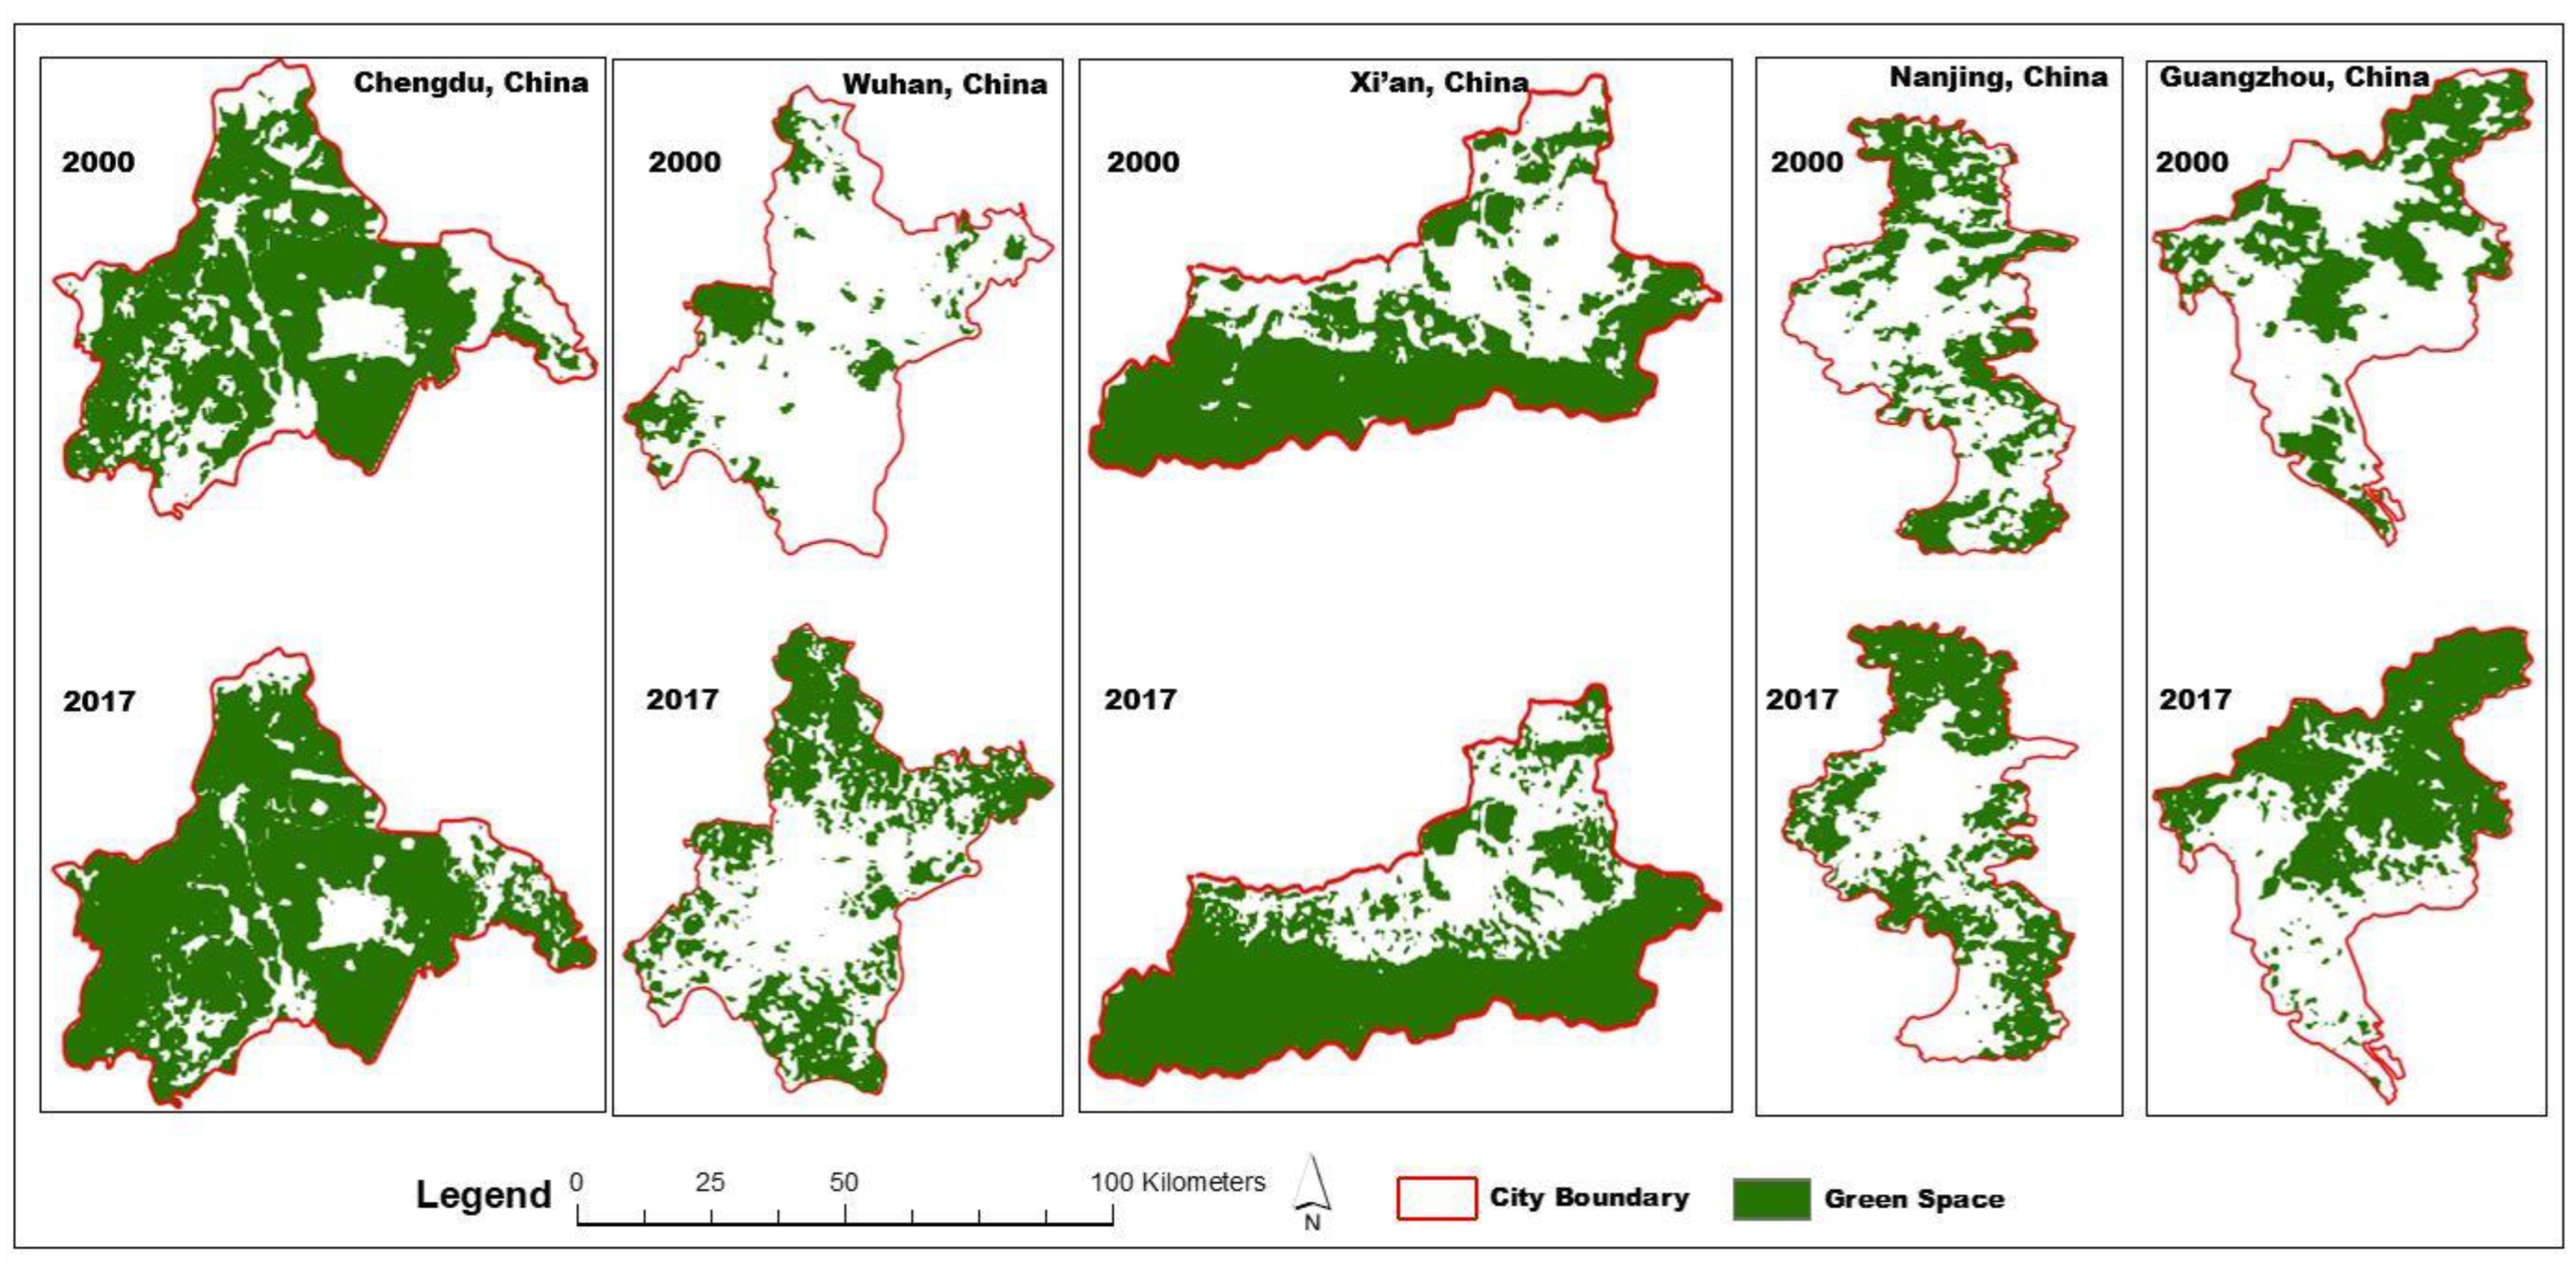
3.1. Data Sources and Study Areas

Population and income data for the U.S. cities were acquired from the U.S. Census Bureau (https://www.census.gov/, 15 February 2020). The Census Bureau hosts suites of socio-economic data including population and economic data. Spatial data related to population and economy were also downloaded from the Census Bureau. Population, and income data for the Chinese cities were acquired from the annual statistical yearbook of Chinese cities, which includes the year-end population and local GDP of each district in each city (http://www.stats.gov.cn/, 15 February 2020). Population data and economic (GDP) data were obtained from national geographic information and statistics databases from 2000 to 2017 for 10 cities in China and the U.S., namely Chengdu, Guangzhou, Nanjing, Wuhan, Xian, Atlanta (Georgia), Denver (Colorado), Columbus (Ohio), Harrisburg (Pennsylvania), and Phoenix (Arizona) (Figure 1). These cities in China and the U.S. were chosen because they are representative of areas experiencing population growth and significant changes in land use and land cover. In addition, the U.S. cities were chosen to represent five regions of the U.S.: the northeast, southeast, midwest, southwest, and west. In China, the cities cover the following regions: central, south, east, southwest, and northwest, and they are representative of China’s capital cities. China and the U.S. are both economically large but have very contrasting policies with regard to the management urban growth, economy, and environment. The governance systems of both the countries are different: China governance is top-down, whereas the U.S. has a decentralized governance system [46]. Thus, it is worth comparing the relationships among the population, economy, and green space mean centers of countries with such fundamentally different polices.
The population, economics, and green space data were available at the district level for the Chinese cities, whereas the U.S. cities had very high-resolution data at the census block level based on aerial coverage. To make these data spatially comparable, the U.S. city’s block-level data were merged into a 5 by 5 grid, as explained in the following section.
Landsat scenes for each city were downloaded from the USGS website (https://www.glovis.usgs.gov, 15 April 2020). Gap filled [47] Landsat 7 ETM+ was used for 2000, 2005, and 2010. For 2015 and 2017, Landsat 8 OLI scenes were used. These data were acquired for each year of the analysis for the summer season to capitalize on the spectral reflectance that occurred due to the greenness of the vegetation. Images with less than 20 percent cloud cover were selected for analysis. The Landsat images had a 30 m resolution and spectral resolution, as shown in the Supplementary Table (Table S2).

3.2. Data Preparation

Population and economic data for the U.S. cities were first spatially joined at the census block group level using ArcGIS 10.4. To make these data comparable to the district-level data of the Chinese cities, a five-by-five row–column grid was overlaid over each city examined in the U.S. using the fishnet tool of ArcGIS 10.4. All the census block groups within a grid were merged to form a single unit of analysis. The census block groups with a coverage of 75 percent within the grid were also taken as a single unit; if they were less than 75 percent, they were merged into the adjacent grid. All the cities examined in the U.S. were divided into 5 to 13 such grid units depending upon the size of the city.
Similarly, Landsat data for all of the years were initially preprocessed for atmospheric and radiometric correction. All cloud, shadow, and other water vapor pixels were identified using the Fmask algorithm, and a neighborhood similar pixel interpolator algorithm was applied to fill the clouds, shadows, and water vapor pixels [48].

3.3. Green Space Classification

The green space in this study included all vegetation: grasses, shrubs, trees, and agriculture. The vegetation may have been roadside trees, trees surrounding residential buildings, and parks. Although it is possible to isolate agriculture from parks and other green spaces, it was included in the analysis because urban agriculture also offers green space and has value in ecosystem services. These agricultural areas usually exist on the outskirts of peri-urbans area and contribute to environmental, social, and economic functions [49]. To classify the green space, the normalized difference vegetation index (NDVI) in ENVI 5.3 was calculated. With the help of the NDVI and other ancillary data such as high-resolution aerial photographs and Google Earth, training samples for each city for green space and non-green space (e.g., built-up areas, water, wetland, and barren land) were created. Using training samples, green and non-green space was classified in each city using a support vector machine (SVM) algorithm. An SVM is a binary classifier that classifies data based on hyperplanes [50]. The extracted green space was processed in ArcGIS 10.4, including raster rotation vector, calculation of the center of gravity, and mapping of the center of gravity to obtain the line graph of the center of gravity migration of green space.

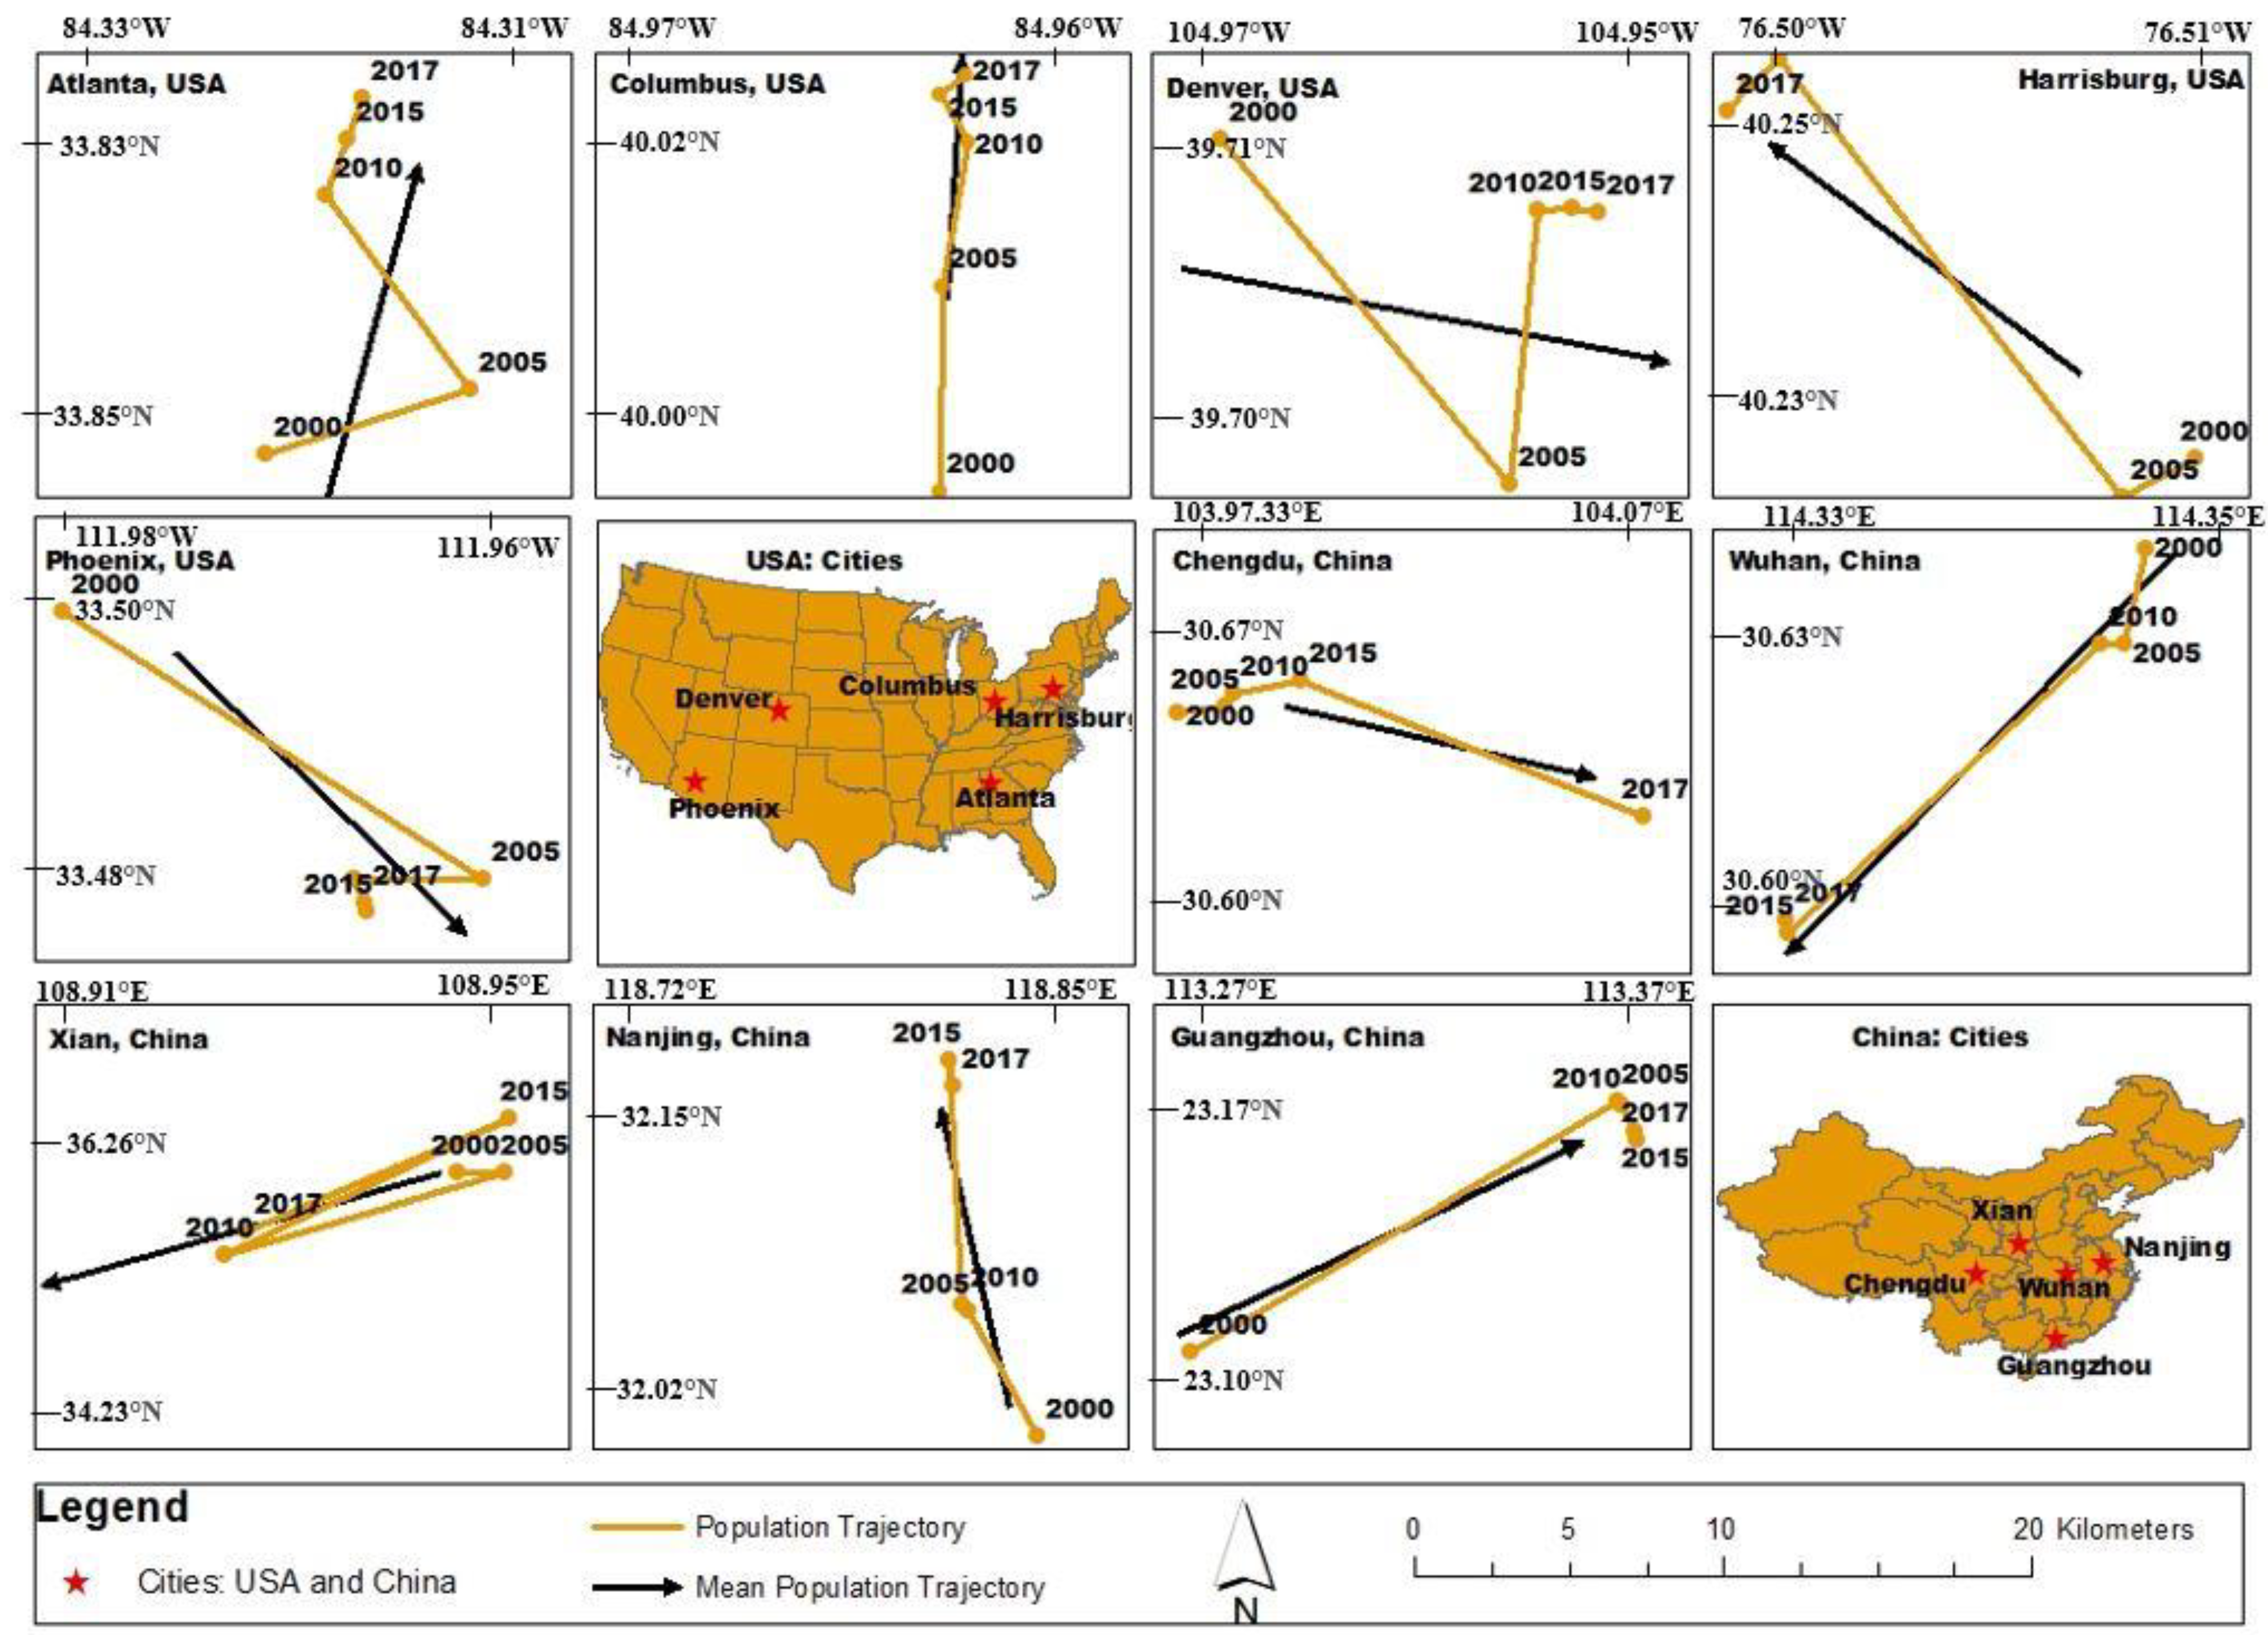
3.3.1. The Center of Gravity Model

The center of mass is the point through which all the combined forces of gravity that make up the fulcrum of an object in a gravitational field pass in any direction [51,52,53]. The center of mass of a uniformly dense object is its geometric center, but the center of mass does not have to be on the object [52]. The physical center of gravity can be generalized to find the abstract “center of gravity” by establishing a GIS database with the center of the gravity model [53]. The migration path and distance of the center of gravity over time can then be determined. Based on the concept of gravity center and gravity model in mechanics, in this paper, we explored the spatio-temporal evolution path of economic, population, and green space gravity centers in China and the U.S. from 2000 to 2017 using a gravity center weighting method [51,53,54,55,56], where:
X = i = 1 n M i X i i = 1 n M i
Y = i = 1 n M i Y i i = 1 n M i
X and Y, respectively, represent the longitude value and latitude value of a certain attribute of the research area.
X i and Y i represent the longitude and latitude of an attribute in the ith subregion, respectively, and M i represents the same attribute value in the ith subregion.
The urban center of gravity is the base point and core area of urban development and expansion [52]. The migration direction of the urban center of gravity is the same as that of urban expansion [51,52]. Under the research framework of new economic geography, the migration direction of the population center of gravity and the economic center of gravity represents the migration of the urban center of gravity [51]. Based on the above Equations (1) and (2), the coordinates of centers of gravity of population, economic, and green space were calculated for all 10 cities in the U.S. and China between 2000 and 2017.

3.3.2. Correlation and Watson–Williams Test

The gravity center formula in Equations (1) and (2) produces mean latitude and longitude in decimal degrees. These decimal degrees were then converted into radian (Cartesian coordinates) to treat these latitude and longitude values as circular data. The annual mean of these latitude and longitude values were plotted as a line chart, and then the 17-year mean was also plotted in a line chart to determine the mean direction of movement between 2000 and 2017. Circular correlation and Watson–Williams tests were conducted to determine if the mean centers of gravity were associated and moving towards the same direction using the circular package of R [57,58]. The correlation was performed between population center, green space center, and economic center after converting latitude and longitude into Cartesian coordinates. The circular correlation is equivalent to Pearson’s linear correlation, which can be calculated using Equations (3) and (4), shown below, where n is sample pairs of angles with s (a11, a21), (a12, a22), (a1n, a2n), and T11 and T22 are the mean directions of the first and second variables, respectively [59]. The correlation was calculated using the circular package (function:cor.circular) in R software.
r c = k = 1 n sin ( a 1 k T 1 , 1 ) sin ( a 2 k T 2 , 1 ) k = 1 n sin 2 ( a 1 k T 1 , 1 ) k = 1 n sin 2 ( a 1 k T 1 , 1 )  
The Watson–Williams test allows to test whether the mean directions between two or more variables are equal [60]. In other words, it tests for the homogeneity of mean directions and is equivalent to ANOVA for linear data [57,60]. This test assumes that the variables of interest are based on von Mises distribution with equal concentrations but are fairly robust against deviation from the assumption [60]. The test statistics can be calculated as follows (Equation (4)), where R is a mean resultant vector length of all samples together and R j is the resultant vector length of the jth group. The use of the mean resultant vector of all variables and individual variables resembles the calculation carried out in ANOVA considering total variance and within-group variance. The correction factor, K, is computed from maximum likelihood estimates of the von Mises distribution with resultant vector length.
F = K   ( N S ) ( J = 1 S R j R ) ( S 1 ) ( N J = 1 S R j )  
The test statistic was calculated in R using a circular package with the function Watson–Williams test.

4. Results

4.1. Population and GDP Trend of the U.S. and Chinese Cities

Overall, the population and GDP of all 10 cities increased from 2000 to 2017 (Table 1). The increase in both population and GDP was slower in the U.S. cities than that in the Chinese cities. The city which grew the most between 2000 and 2017 both in terms of population and GDP in the U.S. was Atlanta, GA. The Chinese city which grew the most in terms of population was Chengdu, whereas Wuhan grew most in terms of GDP (Table 1).
The trend of green space was opposite between the cities of the U.S. and China. It was observed that the proportion of green space in the U.S. cities decreased, whereas in the Chinese cities, it increased (Table 2), based on the year 2000 as a baseline. The green spaces derived using Landsat images of 2000 and 2017 are presented in Figure 2 and Figure 3.

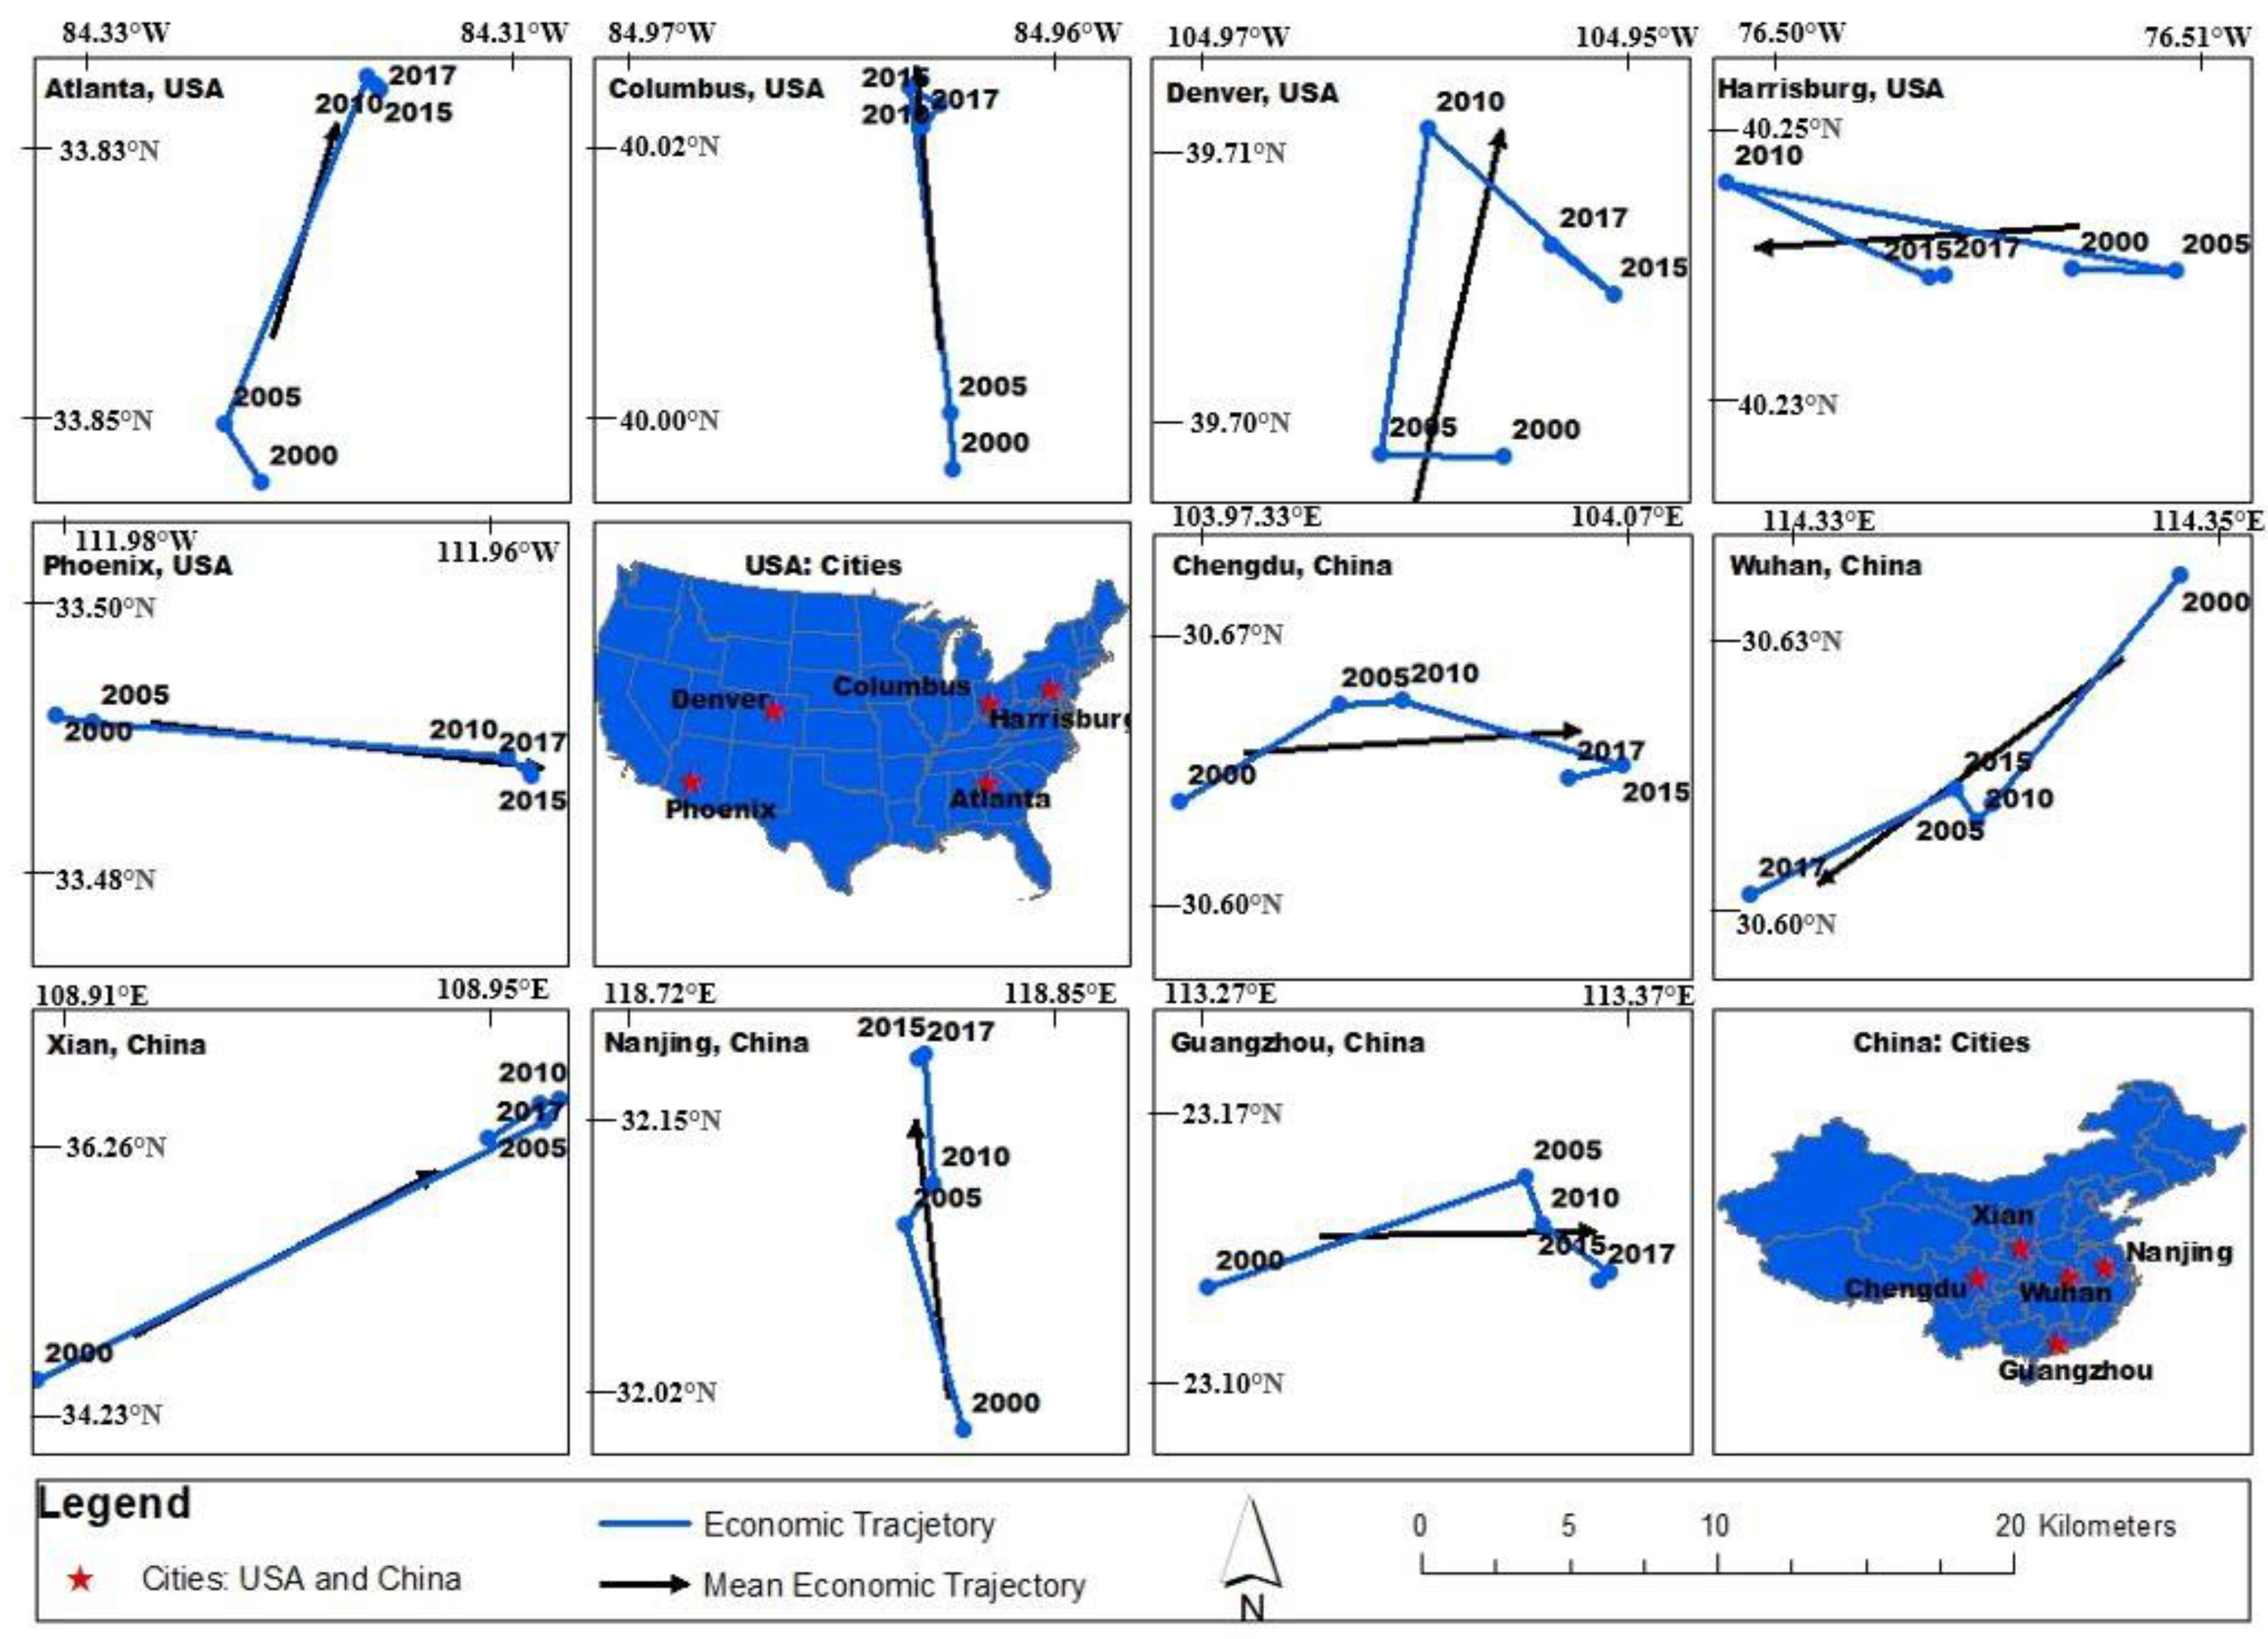
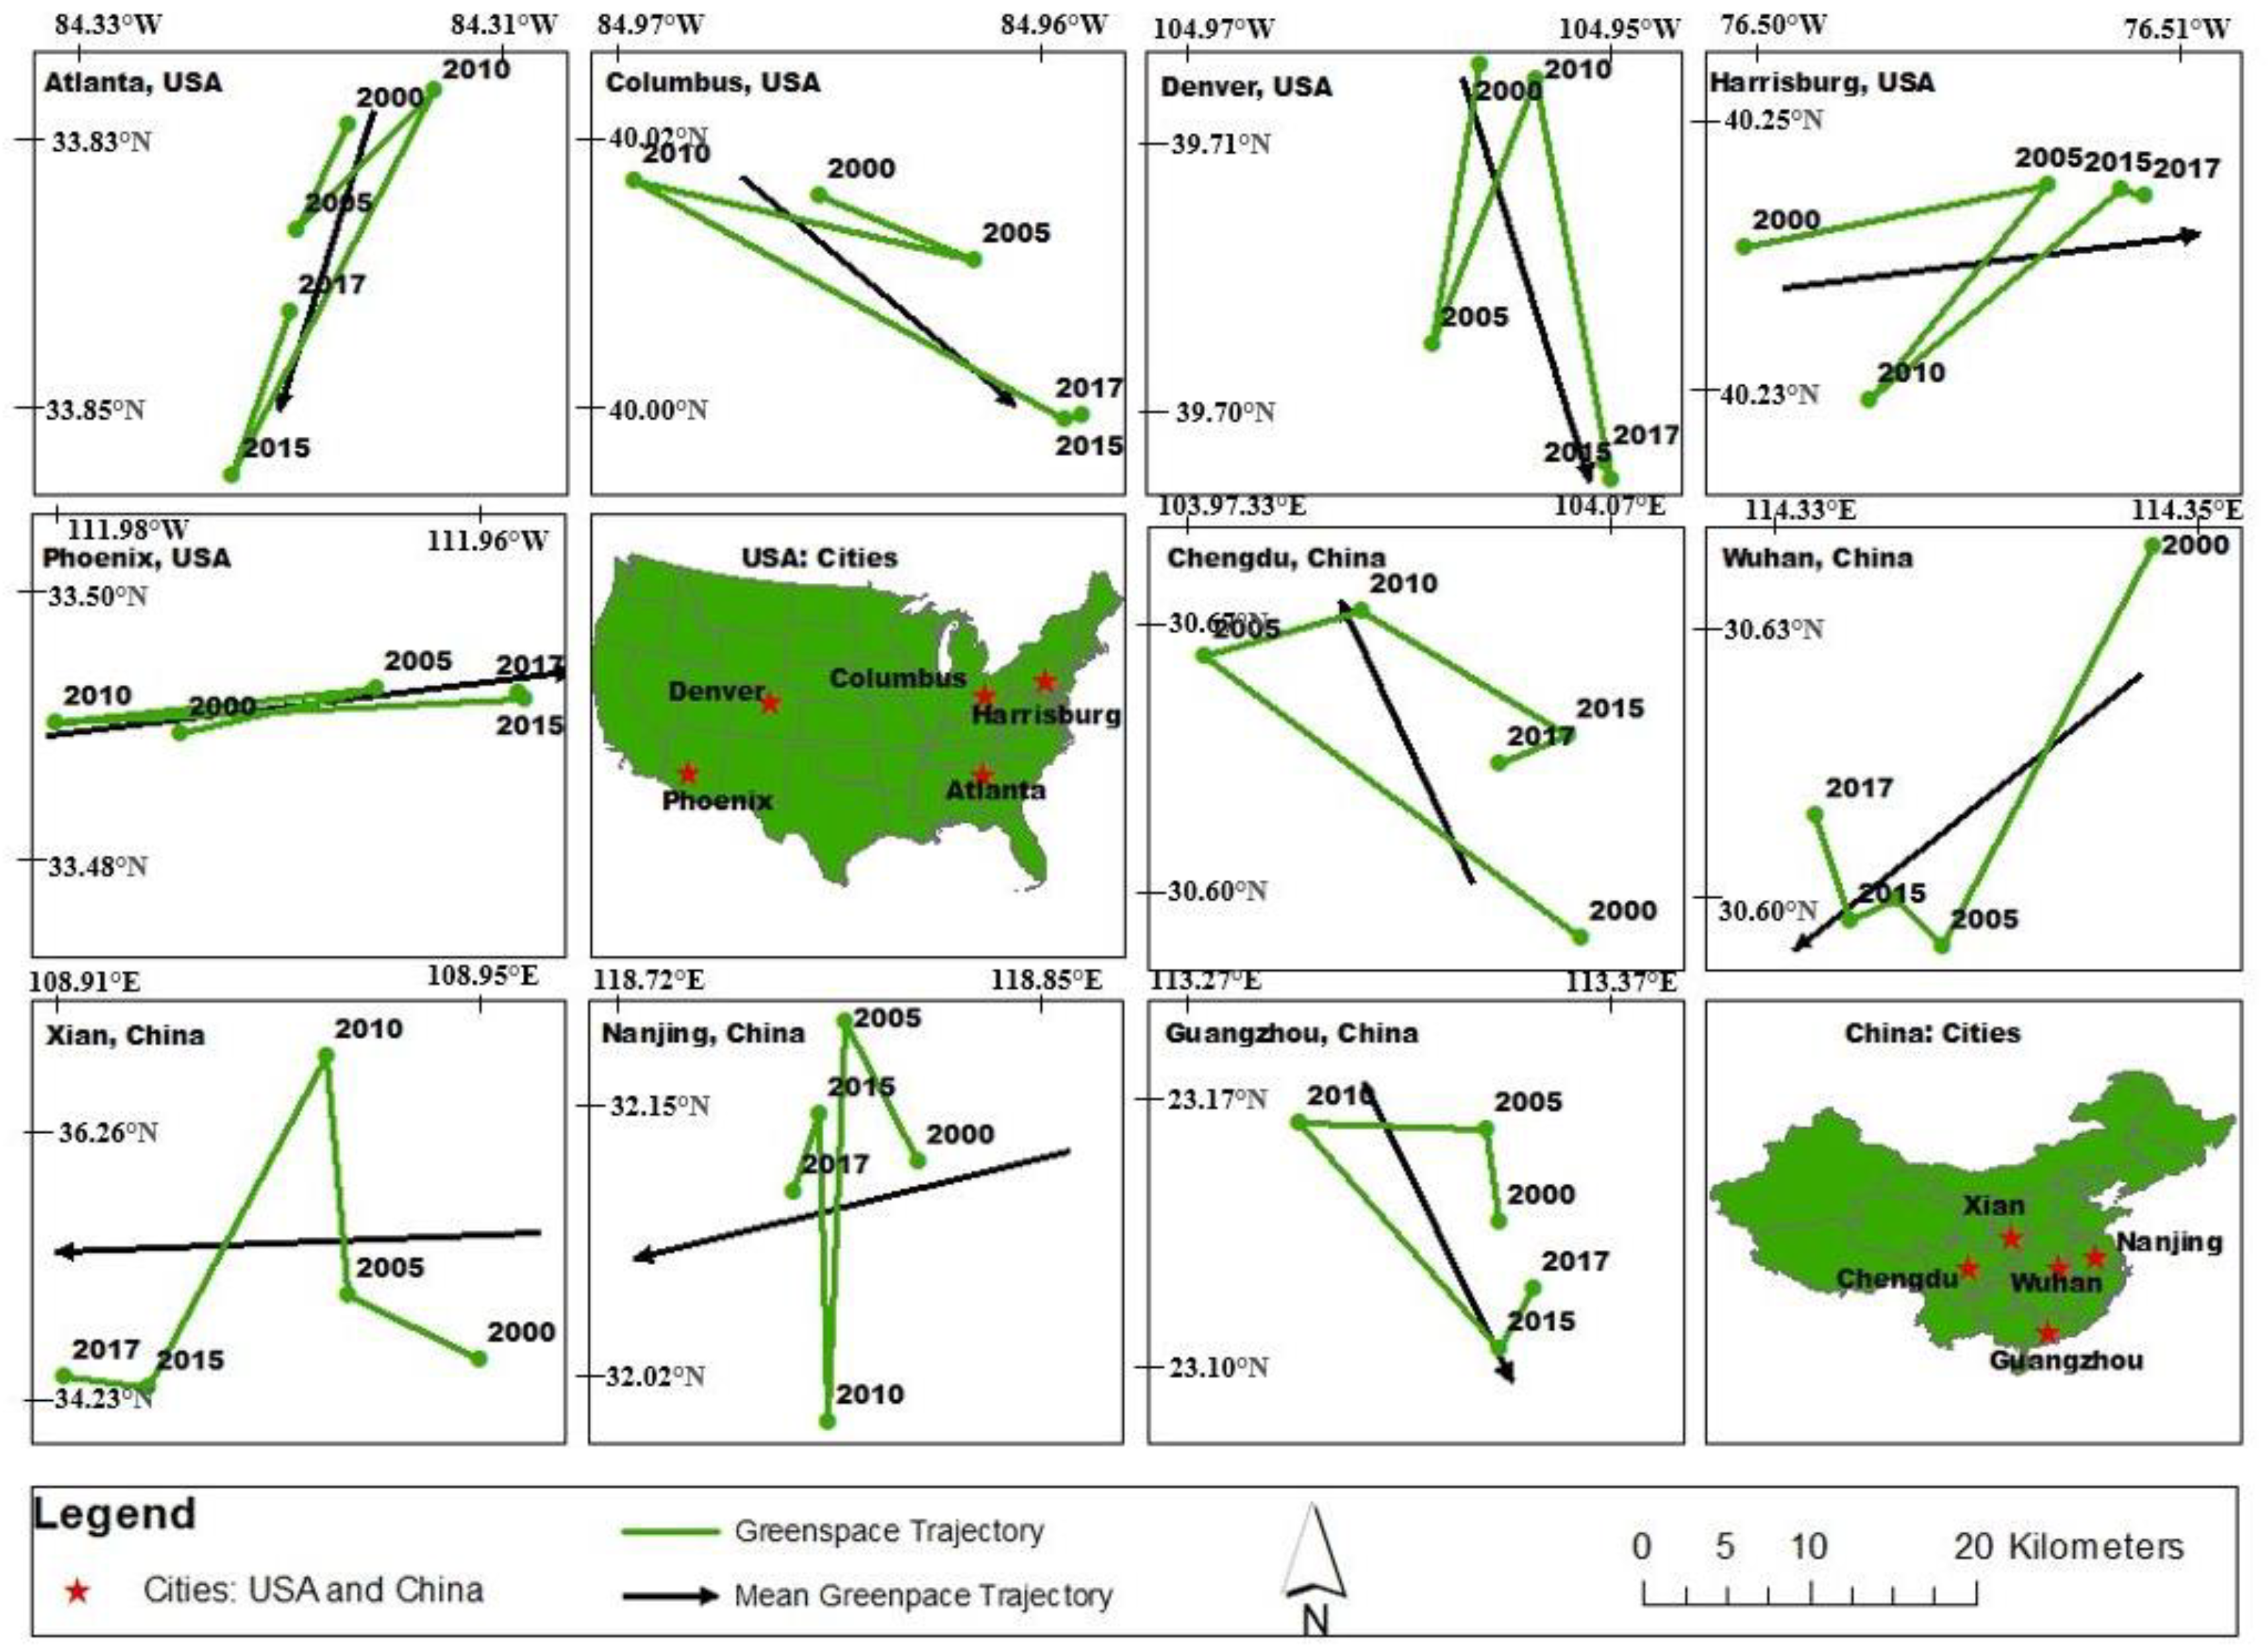
4.2. Center of Gravity Analysis of the U.S. and Chinese Cities

In 8 of the 10 U.S. and Chinese cities studied, the population and economic centers of gravity moved in similar directions (Figure 4 and Figure 5). The exceptions were Denver in the U.S., where the population center was moving southeast, whereas the economic center was moving towards the northeast, and Xian in China, where the population center was moving towards the southwest, whereas the economic center was moving towards the northeast.
The center of gravity of the green space did not show similar patterns to the population and economic centers. Only in Wuhan was the center gravity of green space moving in the same direction as that of the population and economic centers; approximately northwest. (Figure 4, Figure 5 and Figure 6). In seven of the cities, the centers of gravity of green space were moving in the opposite direction of the population centers (Figure 4, Figure 5 and Figure 6). In the two Chinese cities of Chengdu and Nanjing, the center of gravity of the green space was moving in a direction approximately 45° off from that of the population and economic centers.
The direction of centers of gravity of population and economy showed similar directional movement among most cities; however, the total distance moved by these centers from 2000 to 2017 varied from city to city (Table 3). In the U.S., the largest distance moved by the population center of gravity was in Denver with a distance of 3.09 km (0.62 ± 0.35 km, mean per year ± SE), the largest movement of the economic center of gravity was 5.53 km (1.11 ± 0.87 km) in Atlanta, and largest movement of the green space center of gravity was 4.74 km in Phoenix (0.95 ± 0.43 km). By contrast, the distances were larger in China. The largest distance covered by the population center of gravity was in Nanjing with a distance of 13.46 km (2.69 ± 1.53 km), the largest movement of the economic center of gravity was 17.16 km (3.43 ± 1.39 km) in Chengdu, and the largest distance moved by the green space center of gravity was 58.41 km (11.68 ± 5.08 km) in Chengdu. The total distance covered by the gravitational centers of the cities of the U.S. was always lower than the distance covered by the centers of the Chinese cities (Table 3).
The spatial movement of distance by population, economic, and green space centers from one period to other are presented in the supplemental information (Supplemental Figures S1 and S2). The temporal trend in the spatial distance of all the cities in the U.S. and China increased except for in Denver, Phoenix, and Guangzhou. The temporal trend in the spatial distance of the economic centers increased in all the cities in the U.S. and China except for in the city of Xian. Similarly, all the cities showed an increasing trend in the spatial distance moved by the green space in the U.S. and China.

4.3. Relationship among Gravitational Center Directions

The mean directions of movement among the population, economic, and green space centers between 2000 and 2017 were not correlated, except for a marginally positive correlation between the population and economic centers of the cities (Supplemental Information Table S1). However, Watson–Williams tests showed that there was a significant difference among all mean directions among all cities and all three types of centers of gravity (F(9,20) = 6.04, p-value = 0.0004).

5. Discussion

The movement of the population gravity centers in China was further and faster than in the U.S. (Table 1). This difference between the two countries may be because the U.S., as a developed country, has already reached a high level of development, and thus the centers are now moving at a slow pace. By contrast, China, with a developing economy, had faster-moving population centers than the U.S. A similar view is suggested by Wang et al. [46], that showed a 60% population increase in metropolitan areas of China, but at the same time, U.S. metropolitan areas experienced a 10.9% increase between 2000 and 2010.
The slower movement of all three gravity centers of the U.S. can also be explained as due to the difference in development between China and the U.S. Chinese cities grew outward from the center (a centrifugal pattern), whereas the development pattern of the U.S. cities was within the inner cities (filling gaps within the urban boundary). This process of development may have a significant impact on centers of gravity. A similar development pattern was observed by Kuang et al. [6], that compared megacity expansion patterns in cities in the U.S.: New York, Los Angeles, and Chicago, and in China: Beijing, Shanghai, and Guangzhou.
The population and economic centers of all cities in the study except Denver were moving in the same directions. A similar pattern was expected between population and economic centers based upon previous studies [17,24]. In some metro areas, following the 2008 recession, the population kept increasing despite decreasing employment, which can be considered a paradigm shift of urban growth [24]. The opposite trend between population and economic centers can occur when employment declines and the population keeps increasing, although the job market in Denver increased by about 10 percent between 2007 and 2017 [61]. The opposite trend between population and economic centers of gravity was caused by the change in the core area of the Denver metro area. After 2003, Broomfield County was added in the Denver metro area, and many census tracts were merged as a part of census tract revision conducted by the Participant Statistical Areas Program (PSAP).
A pattern of the gravity center of green space moving with or towards population and economic centers was not found. However, all three centers of gravity were moving in similar if not the same direction in two cities, Phoenix (USA) and Wuhan (China). This similarity between these two cities might be because both the cities have a physical/natural barrier that limits their expansion. Phoenix, AZ is in the Sonoran Desert and has a rugged terrain on one side of the metro boundary, including the Estrella Mountains to the southwest, that limits expansion [62]. Similarly, Wuhan (China) is built along the Yangtze River, the longest and largest river in China, which forms a natural barrier to the expansion of the city [26]. Apart from building along the river, Wuhan is merged into a single city connecting three different smaller cities: Wuchang, Hankou, and Hanyang, which might have played a role in driving all three centers in a similar direction. Both cities are established along a transport line, with Phoenix along a railroad and Wuhan along the Yangtze River, forcing development along these transport lines. Apart from these physical barriers, a similar trend of movement might be due to post World War policy relics, i.e., the encouragement of the rapid growth of small cities followed by medium-sized cities and the control of the growth of big cities that resulted in merging two or more cities to form a metropolitan city [26,63,64].
The consistent rise and fall in the temporal trend of spatial distance from one mean center to others may be because urban agglomerations and cities are both constantly compacting and expanding due to development [54]. The decreasing trend of the spatial distance of population in Denver, CO and Phoenix, AZ in the U.S. and Guangzhou in China may indicate an imbalance between the population, development, and allocation of green space in these cities.
In general, the functional layouts of the economic center (offices, hospitals, and other revenue-generating organizations) are concentrated in the core urban area, but urban housing and green spaces are further away from the core, which creates a spatial mismatch between the movement of all three centers in the same directions [53]. As a result, in most cases, the center of gravity of green space is not synchronized in the same direction as the population and economic centers. The spatial mismatch of the population, economic, and green space centers may be due to differences in urban planning processes between cities. There is a clear difference between how urban planning is carried out in the U.S. and China. In China, urban land use decision making is primarily carried out by government agencies and land bureaus. While there are city planning regulations, public voiceshave a much greater influence in the planning process in the U.S. than in China [44]. Another factor that influences the spatial mismatch of these centers is income inequality and education. Generally, the highly educated, and high-income population resides away from the urban centers where there is ample opportunity to reach out to nature [13]. This land is usually costly, which is not affordable to everyone. A study carried out in 10 metro areas in the U.S. found that the distributional equality of urban green space significantly depended on higher education, higher income, and race except for two metro areas—Jacksonville, FL, and St. Louis, MO-IL, less-educated and Latino populations had more access to green spaces [65]. Arguably, income and education highly influence housing area and park establishment (one form of green space) in urban areas. Highly educated and high-income populations have more willingness to pay to live in areas with more green space, less traffic congestion, and quieter neighborhoods [66].
In recent years, it was estimated that 64.7% of the people in China live in urban areas, and China has experienced one of the fastest urbanization rates in the world [67,68]. The rate of urbanization has increased from 10.64% to 59.58% between 1949 and 2018 [68,69]. The UN projected that 68% of the world population will live in urban areas by 2050. The urbanization process has also triggered an increase in green infrastructures such as public parks. While examining a temporal trend of green space and urbanization, Zhao et al. [69] found that the green space increased from 17 to 37 depending upon the urban areas between 1989 and 2009. The same study also found that the urban green space in Chinese cities increased between 2000 and 2017. In the case of Chinese cities, most of the urban areas are expanded from core cities to the countryside (urban sprawl), which might also have increased urban green space. In addition, the local and national government also encourages, supports, and helps in planning green spaces in cities [7,69].
Urban planning plays a critical role in maintaining and designing green space through policies or by educating dwellers on the importance of green space in urban areas [10]. Both the U.S. and China have three layers of government [63,67]. The government sets the ground rules in both countries to balance the planning of cities that are environmentally friendly, but the Chinese government intervenes more directly than the U.S. government [67]. The planning process is a more interactive and bottom-up approach in the U.S. and is quite often political [63], for example, if a city government wants to establish a park that requires large funding, if the city government differs from the state or federal government politically, the grant may not be sanctioned, halting the establishment of the park. In contrast, China has a top-down and centralized policy, with all levels of governments having policies to enhance green spaces in the planning process; there is a clear lack of understanding between agencies about who is responsible for urban greening [26,67]. Since China has a top-down and centralized policy, there is a lack of opportunity to create a better relationship between policymakers and a diverse range of urban dwellers [26,67]. The development pattern of Chinese cities somewhat mimics the development pattern of the post World War II era in the U.S. cities [67]. Population centers moved away from the core urban areas to living in suburbia as the economy improved and people become more car-dependent and relied less on public transport.
Planning and design processes must include urban agriculture in their planning process, not only green spaces such as parks and river belts. Green space should be planned in terms of ecosystem functions, services, and benefits, not merely recreation. Thus, good planning must possess multifunctionality, local identity, history, traditions, culture, social networks, and economic networks. The emergence of the COVID-19 pandemic in early 2020 showed the importance of green spaces in urban areas for people to be healthy, physically, mentally, and economically [70,71,72]. Thus, future planning of urban areas should be people- and environment-centric rather than economic-centric.
A limitation of this study is that agricultural areas were included as green spaces because these areas provide some aesthetic value. This inclusion might have skewed some directional properties of the core green spaces, which are generally considered as parks and wooded areas in and around housing areas. A finer-scale resolution of movement of different types of green space would allow for the investigation of green space inequalities among socio-economic groups [66]. Another limitation is that the population data of the U.S. cities for the years 2005, 2015, and 2017 were estimates based on the census data of 2000 and 2010. These data are as good as the estimating algorithm used by the census bureau of the U.S.

6. Conclusions

Using the gravity method and circular statistics, the movement of the gravitational centers of population, economic, and green space centers of 10 different cities of the U.S. and China were analyzed. In most cases, the population and economic centers moved similarly, whereas the green spaces displayed no particular trend and pattern. In addition, all three centers can move alongside each other, except for special cases such as natural barriers or some restrictive planning process.
Access to green space in urban areas is important for various reasons, including the maintenance of urban ecology and a place for the safe socialization of human occupants. Thus, it is important to make people- and environment-centric urban plans and policies to create well-designed green spaces to support urban public health.
In future studies, it would be useful to isolate core urban green spaces and agricultural areas separately to understand whether agricultural green space impacts the directional movement of the centers. It would also be important to classify the population centers based on race, age groups, and income to determine their relationship to the movement of green space and economic centers. It is known that there is a clear difference in urban management plans and policies between the U.S. and China. Consequently, a comparative study of management procedures and their challenges can assist planners in either country to come up with more integrated policy-making procedures. It would also be informative to conduct similar analyses of urban green spaces in other areas of the world such as Europe, where urban centers have a long history of human settlement and urban development.

Supplementary Materials

The following supporting information can be downloaded at: https://www.mdpi.com/article/10.3390/su14095396/s1.

Author Contributions

Q.L., S.T. and D.J.G. designed, analyzed, and wrote the paper. Q.L., S.T., X.H. and Z.L. collected data. D.J.G. supervised the study. All authors have read and agreed to the published version of the manuscript.

Funding

This work was supported by the Key Disciplines of State Forestry Administration of China [No. 21 of Forest Ren Fa, 2016]; Hunan Province “Double First-class” Cultivation discipline of China [No. 469 of Xiang Jiao Tong, 2018], the SIUC Environmental Resource and Policy program to Saroj Thapa, and funding from the National Science Foundation (DUE 1758497 and 1949969) to David Gibson.

Institutional Review Board Statement

Not applicable.

Informed Consent Statement

Not applicable.

Data Availability Statement

Landsat data used in the study are freely available through USGS (https://www.glovis.usgs.gov), population and economy data of the U.S. (https://www.census.gov/), and China (http://www.stats.gov.cn/). However, the data used to support the findings of this study are available upon reasonable request from the authors.

Acknowledgments

We would like to thank Guangxing Wang for his efforts in conceptualizing the research, SIUC plant biology for providing resources, and members of Gibson lab for their help and support. We would also like to thank the Chief Editor of the journal and anonymous reviewers.

Conflicts of Interest

We declare that we do not have any conflict of interest in connection with the work submitted.

References

  1. Taylor, L.; Hochuli, D.F. Defining greenspace: Multiple uses across multiple disciplines. Landsc. Urban Plan. 2017, 158, 25–38. [Google Scholar] [CrossRef] [Green Version]
  2. Burgess, J.; Harrison, C.M.; Limb, M. People, Parks and the Urban Green: A Study of Popular Meanings and Values for Open Spaces in the City. Urban Stud. 1988, 25, 455–473. [Google Scholar] [CrossRef]
  3. Evans, A. Economics and Landuse Planning; John Wiley & Sons: New York, NY, USA, 2008; pp. 1–207. [Google Scholar]
  4. Raymond, C.M.; Frantzeskaki, N.; Kabisch, N.; Berry, P.; Breil, M.; Nita, M.R.; Geneletti, D.; Calfapietra, C. A framework for assessing and implementing the co-benefits of nature-based solutions in urban areas. Environ. Sci. Policy 2017, 77, 15–24. [Google Scholar] [CrossRef]
  5. Wolch, J.R.; Byrne, J.; Newell, J.P. Urban green space, public health, and environmental justice: The challenge of making cities ‘just green enough’. Landsc. Urban Plan. 2014, 125, 234–244. [Google Scholar] [CrossRef] [Green Version]
  6. Kuang, W.; Chi, W.; Lu, D.; Dou, Y. A comparative analysis of megacity expansions in China and the U.S.: Patterns, rates and driving forces. Landsc. Urban Plan. 2014, 132, 121–135. [Google Scholar] [CrossRef]
  7. Kuang, W.H.; Liu, J.Y.; Zhang, Z.X.; Lu, D.S.; Xiang, B. Spatiotemporal dynamics of impervious surface areas across China during the early 21st century. Chin. Sci. Bull. 2013, 58, 1691–1701. [Google Scholar] [CrossRef] [Green Version]
  8. Yu, J.; Zhao, C.; Ming, L. Industry Agglomeration in China: Economic Geography, New Economic Geography and Policy. Econ. Res. J. 2006, 4, 79–89. [Google Scholar]
  9. Grunewald, K.; Richter, B.; Meinel, G.; Herold, H.; Syrbe, R.-U.; Fürst, C. Proposal of indicators regarding the provision and accessibility of green spaces for assessing the ecosystem service “recreation in the city” in Germany. Int. J. Biodivers. Sci. Ecosyst. Serv. Manag. 2017, 13, 26–39. [Google Scholar] [CrossRef] [Green Version]
  10. Haaland, C.; van den Bosch, C.K. Challenges and strategies for urban green-space planning in cities undergoing densification: A review. In Urban Forestry and Urban Greening; Elsevier GmbH: Munich, Germany, 2015; Volume 14, pp. 760–771. [Google Scholar]
  11. Van de Voorde, T.; Vlaeminck, J.; Canters, F. Comparing different approaches for mapping urban vegetation cover from Landsat ETM+ data: A case study on Brussels. Sensors 2008, 8, 3880–3902. [Google Scholar] [CrossRef] [Green Version]
  12. Beatley, T. Preserving biodiversity: Challenges for planners. J. Am. Plan. Assoc. 2000, 66, 5–20. [Google Scholar] [CrossRef]
  13. Byrne, J.; Wolch, J. Nature, race, and parks: Past research and future directions for geographic research. Prog. Hum. Geogr. 2009, 33, 743–765. [Google Scholar] [CrossRef] [Green Version]
  14. Bibri, S.E.; Krogstie, J.; Kärrholm, M. Compact city planning and development: Emerging practices and strategies for achieving the goals of sustainability. Dev. Built Environ. 2020, 4, 100021. [Google Scholar] [CrossRef]
  15. He, Q.; Zeng, C.; Xie, P.; Tan, S.; Wu, J. Comparison of urban growth patterns and changes between three urban agglomerations in China and three metropolises in the USA from 1995 to 2015. Sustain. Cities Soc. 2019, 50, 101649. [Google Scholar] [CrossRef]
  16. Mahtta, R.; Fragkias, M.; Güneralp, B.; Mahendra, A.; Reba, M.; Wentz, E.A.; Seto, K.C. Urban land expansion: The role of population and economic growth for 300+ cities. Npj Urban Sustain. 2022, 2, 5. [Google Scholar] [CrossRef]
  17. Glaeser, E.L.; Kahn, M.E. Sprawl and urban growth. In Handbook of Regional and Urban Economics; Elsevier: Amsterdam, The Netherlands, 2004; Volume 4, pp. 2481–2527. [Google Scholar]
  18. Squires, G. Urban Sprawl: Causes, Consequences & Policy Responses; The Urban Institute: Washington, DC, USA, 2002. [Google Scholar]
  19. Sudhira, H.S.; Ramchandra, T.V.; Jagadish, K.S. Urban sprawl: Metrics, dynamics and modelling using GIS. Int. J. Appl. Earth Obs. Geoinf. 2004, 5, 29–39. [Google Scholar] [CrossRef]
  20. Kühn, M. Greenbelt and Green Heart: Separating and integrating landscapes in European city regions. Landsc. Urban Plan. 2003, 64, 19–27. [Google Scholar] [CrossRef]
  21. Yue, W.; Liu, Y.; Fan, P. Measuring urban sprawl and its drivers in large Chinese cities: The case of Hangzhou. Land Use Policy 2013, 31, 358–370. [Google Scholar] [CrossRef]
  22. Zhou, X.; Wang, Y.C. Spatial-temporal dynamics of urban green space in response to rapid urbanization and greening policies. Landsc. Urban Plan. 2011, 100, 268–277. [Google Scholar] [CrossRef]
  23. United Nation. World Urbanization Prospects—Population Division: The 2018 Revision; United Nations, Department of Economic and Social Affairs: New York, NY, USA, 2018. [Google Scholar]
  24. Graves, W.; Kozar, J.; Burke, S. Do Jobs Still Attract People? Spatial and Temporal Changes in Job-Population Relationship in US Metropolitan Areas 1970–2017. Pap. Appl. Geogr. 2020, 6, 323–335. [Google Scholar] [CrossRef]
  25. Gunawardena, K.R.; Wells, M.J.; Kershaw, T. Utilising green and bluespace to mitigate urban heat island intensity. Sci. Total Environ. 2017, 584–585, 1040–1055. [Google Scholar] [CrossRef]
  26. Liu, J. On the Planning of Green Garden and Ecological Space of Wuhan City in the Last 70 Years. Urban Urban Plan. 2019, 5, 94–102. [Google Scholar]
  27. Fujita, M.; Thisse, J.F. New Economic Geography: An appraisal on the occasion of Paul Krugman’s 2008 Nobel Prize in Economic Sciences. Reg. Sci. Urban Econ. 2009, 39, 109–119. [Google Scholar] [CrossRef]
  28. Krugman, P. What’s new about the new economic geography? Oxf. Rev. Econ. Policy 1998, 14, 7–17. [Google Scholar] [CrossRef]
  29. Acs, Z.J.; Varga, A. Geography, endogenous growth, and innovation. Int. Reg. Sci. Rev. 2002, 25, 132–148. [Google Scholar] [CrossRef]
  30. Fujita, M. The evolution of spatial economics: From Thunen to the new economic geography. Jpn. Econ. Rev. 2010, 61, 1–32. [Google Scholar] [CrossRef]
  31. Guldmann, J.-M.; Wang, F. Population and employment density functions revisited: A spatial interaction approach. Pap. Reg. Sci. 2005, 77, 189–211. [Google Scholar] [CrossRef]
  32. Chen, M.; Guie, P. 150 Years of Urban Development in America and Its Enlightenment to China’s Urban Development. Explor. Econ. Probl. 2004, 8, 44–49. [Google Scholar]
  33. Kahn, M.E. Green Cities Urban Growth and the Environment; Brookings Institution Press: Washington, DC, USA, 2006. [Google Scholar]
  34. Sun, B. The Enlightenment of American Urban Development Process to Wuhan’s Urbanization Development. Yangzi River Daily 2005, 7, 10–11. [Google Scholar] [CrossRef]
  35. Liu, Z.; Liu, S. Polycentric development and the role of urban polycentric planning in China’s mega cities: An examination of Beijing’s metropolitan area. Sustainability 2018, 10, 1588. [Google Scholar] [CrossRef] [Green Version]
  36. Loibl, W.; Etminan, G.; Gebetsroither-Geringer, E.; Neumann, H.-M.; Sanchez-Guzman, S. Characteristics of urban agglomerations in different continents: History, patterns, dynamics, drivers and trends. Urban Agglom. 2018, 29–63. [Google Scholar] [CrossRef] [Green Version]
  37. Muñoz-Erickson, T.A.; Campbell, L.K.; Childers, D.L.; Morgan Grove, J.; Iwaniec, D.M.; Campbell, L.; Childers, D.L.; Grove, M.; Iwaniec, D.M.; Svenden, E.; et al. Demystifying governance and its role for transitions in urban Demystifying governance and its role for transitions in urban social-ecological systems social-ecological systems. Ecosphere 2016, 7, e01564. [Google Scholar] [CrossRef]
  38. Santosa, H.; Ikaruga, S.; Kobayashi, T. 3D Interactive Simulation System (3DISS) Using Multimedia Application Authoring Platform for Landscape Planning Support System. Procedia-Soc. Behav. Sci. 2016, 227, 247–254. [Google Scholar] [CrossRef] [Green Version]
  39. Han, H.; Yang, C.; Wang, E.; Song, J.; Zhang, M. Evolution of jobs-housing spatial relationship in Beijing Metropolitan Area: A job accessibility perspective. Chin. Geogr. Sci. 2015, 25, 375–388. [Google Scholar] [CrossRef] [Green Version]
  40. Heynen, N. Green urban political ecologies: Toward a better understanding of inner-city environmental change. Environ. Plan. A 2006, 38, 499–516. [Google Scholar] [CrossRef]
  41. Tzoulas, K.; Korpela, K.; Venn, S.; Yli-Pelkonen, V.; Kaźmierczak, A.; Niemela, J.; James, P. Promoting ecosystem and human health in urban areas using Green Infrastructure: A literature review. In Landscape and Urban Planning; Elsevier: Amsterdam, The Netherlands, 2007; Volume 81, pp. 167–178. [Google Scholar]
  42. Iammarino, S.; McCann, P. Multinationals and Economic Geography: Location, Technology and Innovation; Edward Elgar Publishing: Cheltenham, UK, 2013. [Google Scholar]
  43. Audirac, I. Information technology and urban form: Challenges to smart growth. Int. Reg. Sci. Rev. 2005, 28, 119–145. [Google Scholar] [CrossRef]
  44. Crompton, J.; Nicholls, S. The impact on property prices of the proportion of park-like space in the proximate area. World Leis. J. 2021, 63, 201–215. [Google Scholar] [CrossRef]
  45. Seto, K.C.; Sánchez-Rodríguez, R.; Fragkias, M. The New Geography of Contemporary Urbanization and the Environment. Annu. Rev. Environ. Resour. 2010, 35, 167–194. [Google Scholar] [CrossRef] [Green Version]
  46. Wang, Z.; Tan, P.Y.; Zhang, T.; Nassauer, J.I. Perspectives on narrowing the action gap between landscape science and metropolitan governance: Practice in the US and China. Landsc. Urban Plan. 2014, 125, 329–334. [Google Scholar] [CrossRef]
  47. Chen, J.; Zhu, X.; Vogelmann, J.E.; Gao, F.; Jin, S. A simple and effective method for filling gaps in Landsat ETM+ SLC-off images. Remote Sens. Environ. 2011, 115, 1053–1064. [Google Scholar] [CrossRef]
  48. Zhu, Z.; Woodcock, C.E. Object-based cloud and cloud shadow detection in Landsat imagery. Remote Sens. Environ. 2012, 118, 83–94. [Google Scholar] [CrossRef]
  49. Lin, B.B.; Philpott, S.M.; Jha, S.; Liere, H. Urban agriculture as a productive green infrastructure for environmental and social well-being. In Greening Cities; Springer: Berlin/Heidelberg, Germany, 2017; pp. 155–179. [Google Scholar]
  50. Dinda, S.; Chatterjee, N.D.; Ghosh, S. An integrated simulation approach to the assessment of urban growth pattern and loss in urban green space in Kolkata, India: A GIS-based analysis. Ecol. Indic. 2021, 121, 107178. [Google Scholar] [CrossRef]
  51. Nemes, N.J. Spatial gravity centers of the dynamics and the crisis in Hungary. Hung. Stat. Rev. 2002, 75–80. Available online: https://www.ksh.hu/statszemle_archive/2002/2002_K7/2002_K7_001.pdf#page=75 (accessed on 23 April 2022).
  52. Tóth, G.; Sebestyén Szép, T. Spatial Evolution of the Energy and Economic Centers of Gravity. Resources 2019, 8, 100. [Google Scholar] [CrossRef] [Green Version]
  53. Wang, F.; Guldmann, J.M. Simulating urban population density with a gravity-based model. Socio-Econ. Plan. Sci. 1996, 30, 245–256. [Google Scholar] [CrossRef]
  54. Fu, J. Moving Route of Economic and Population Gravity Center in Xinjiang from 1949 to 2009. In Xinjiang Finance and Economics; 2011; pp. 22–23. Available online: http://en.cnki.com.cn/Article_en/CJFDTOTAL-XJCJ201102006.htm (accessed on 23 April 2022).
  55. Li, X.; Yang, Y.; Liu, Y.; Wang, Y. The spatio-temporal trajectory and coupling trend of China’s economic gravity center and population gravity Center since 1990. Inq. Econ. Issues 2017, 11, 1–9. [Google Scholar]
  56. Ye, M. Characteristics and Influence Factors Analysis of Gravity Movement for China’s Economy from 1978 to 2008. In Economic Geography; 2012; pp. 13–19. Available online: http://en.cnki.com.cn/Article_en/CJFDTotal-JJDL201204003.htm (accessed on 23 April 2022).
  57. Pewsey, A.; Markus, N.; Graeme, D.R. Circular Statistics in R; Oxford University Press: Oxford, UK, 2013. [Google Scholar]
  58. R Core Team. R: A Language and Environment for Statistical Com-Putting; R Foundation for Statistical Computing: Vienna, Austria, 2017. [Google Scholar]
  59. Jammalamadaka, S.R.; Seagupta, A. Topics in Circular Statistics; World Scientific: Singapore, 2001; pp. 175–199. [Google Scholar]
  60. Watson, A.G.S.; Williams, E.J. On the Construction of Significance Tests on the Circle and the Sphere. Biometrika 1956, 43, 344–352. [Google Scholar] [CrossRef]
  61. Smith, E.; Saladino, C.; Brown, W.E. Economic Growth in Mountain West Metropolitan Areas. Economuc Development and Workforce 2019. pp. 1–5. Available online: https://digitalscholarship.unlv.edu/cgi/viewcontent.cgi?article=1005&context=bmw_lincy_econdev (accessed on 23 April 2022).
  62. Iwaniec, D.; Wiek, A. Advancing Sustainability Visioning Practice in Planning—The General Plan Update in Phoenix, Arizona. Plan. Pract. Res. 2014, 29, 543–568. [Google Scholar] [CrossRef]
  63. Teitz, M.B. Urban Policy: North America. In International Encyclopedia of the Social & Behavioral Sciences; Elsevier: Amsterdam, The Netherlands, 2001; pp. 16070–16076. [Google Scholar]
  64. Xie, J.; Woolley, H.; Liu, B.; Elsadek, M. IOP Conference Series: Earth and Environmental Science Overview of urban planning policy and urban green space system at a national level in China Overview of urban planning policy and urban green space system at a national level in China. IOP Conf. Ser. Earth Environ. Sci 2019, 349, 12021. [Google Scholar] [CrossRef]
  65. Nesbitt, L.; Meitner, M.J.; Girling, C.; Sheppard, S.R.J.; Lu, Y. Who has access to urban vegetation? A spatial analysis of distributional green equity in 10 US cities. Landsc. Urban Plan. 2019, 181, 51–79. [Google Scholar] [CrossRef]
  66. Park, Y.; Guldmann, J.M. Understanding disparities in community green accessibility under alternative green measures: A metropolitan-wide analysis of Columbus, Ohio, and Atlanta, Georgia. Landsc. Urban Plan. 2020, 200, 103806. [Google Scholar] [CrossRef]
  67. Kundu, D.; Debnath, T.; Lahiri, B. Overview of Urban Policies in China. In Developing National Urban Policies; Springer: Singapore, 2020; pp. 205–230. [Google Scholar]
  68. UN. The World’s Cities in 2018-Data Booklet (ST/ESA/SER.A/417); UN Population Division: New York, NY, USA, 2018; pp. 1–34. [Google Scholar]
  69. Zhao, J.; Chen, S.; Jiang, B.; Ren, Y.; Wang, H.; Vause, J.; Yu, H. Temporal trend of green space coverage in China and its relationship with urbanization over the last two decades. Sci. Total Environ. 2013, 442, 455–465. [Google Scholar] [CrossRef]
  70. Kleinschroth, F.; Kowarik, I. COVID-19 crisis demonstrates the urgent need for urban greenspaces. Front. Ecol. Environ. 2020, 18, 318. [Google Scholar] [CrossRef]
  71. Venter, Z.S.; Barton, D.N.; Gundersen, V.; Figari, H.; Nowell, M. Urban nature in a time of crisis: Recreational use of green space increases during the COVID-19 outbreak in Oslo, Norway. Environ. Res. Lett. 2020, 15, 104075. [Google Scholar] [CrossRef]
  72. Venter, Z.S.; Barton, D.N.; Gundersen, V.; Figari, H.; Nowell, M.S. Back to nature: Norwegians sustain increased recreational use of urban green space months after the COVID-19 outbreak. Landsc. Urban Plan. 2021, 214, 104175. [Google Scholar] [CrossRef]
Figure 1. Map showing the locations of the cities in China and the U.S.
Sustainability 14 05396 g001
Figure 2. Greenspace between 2000 and 2017 in the U.S. cities.
Sustainability 14 05396 g002
Figure 3. Greenspace between 2000 and 2017 in Chinese cities.
Sustainability 14 05396 g003
Figure 4. Line charts showing the movement of the population centers of gravity between 2000 and 2017. The black arrow shows the mean directional vector. N and W or E represents latitude and longitude of the city.
Sustainability 14 05396 g004
Figure 5. Line charts showing the movement of the economic centers of gravity between 2000 and 2017. The black arrow shows the mean directional vector. N and W or E represents latitude and longitude of the city.
Sustainability 14 05396 g005
Figure 6. Line charts showing the movement of the green space centers of gravity between 2000 and 2017. The black arrow shows the mean directional vector. N and W or E represents latitude and longitude of the city.
Sustainability 14 05396 g006
Table 1. Population, GDP, and available green space of 10 cities in the U.S. and China between 2000 and 2017.
ItemsYearAtlantaColumbusDenverHarrisburgPhoenixGuangzhouChengduWuhanXianNanjing
Population (Million)20003.521.161.990.372.927.0110.137.466.885.45
20054.001.252.180.403.277.5110.828.017.476.90
20104.541.372.390.453.6512.7011.498.378.478.00
20155.161.512.610.494.0713.5014.6610.618.708.23
20175.431.572.700.524.2614.5016.0410.899.058.34
GDP (Billion USD)2000209.7469.19108.4527.33123.7828.7815.8214.587.8012.32
2005255.9782.60123.1130.25166.6161.8128.6527.0415.8829.15
2010268.7490.07140.2731.25174.79155.4981.4080.8847.5373.47
2015340.33115.96183.5334.58216.25290.61173.42175.0993.28156.07
2017380.22124.07201.9535.02238.93318.48205.71215.31110.63173.51
Green space area (Km2)20005395.931197.931155.461096.412575.012829.177854.951258.226023.672643.68
20054867.741143.271010.731068.622309.752945.8210397.323413.117094.794462.70
20105434.591230.991234.331110.142820.033444.986285.243471.567221.204074.70
20154689.641085.651018.641037.122165.383750.988256.773072.447568.822128.72
20174598.871082.821018.221036.662164.483819.499790.533547.236935.783045.05
Total Area (Km2) 901322852509162745557434.4014321.008594.0010,096.816587.02
Note: CNY average exchange rate against USD for the study year.
Table 2. The ratio between green space and the total area of the urban areas.
YearAtlantaColumbusDenverHarrisburgPhoenixGuangzhouChengduWuhanXianNanjing
20000.600.520.460.670.570.380.550.150.600.40
20050.540.500.400.660.510.400.730.400.700.68
20100.600.540.490.680.620.460.440.400.720.62
20150.520.480.410.640.480.500.580.360.750.32
20170.510.470.410.640.480.510.680.410.690.46
Table 3. Distance and trajectory (direction) of movement of population, economic, and green space centers of five Chinese and five U.S. cities over 18 years.
Population Center
CityMean ± SE Distance (km)Total Euclidean Distance (km)Crow Flight Distance (km)Mean Direction (Degrees)
Atlanta0.51 ± 0.222.541.8174.71
Columbus0.21 ± 0.091.041.0186.43
Denver0.62 ± 0.353.091.26349.21
Harrisburg0.18 ± 0.140.910.70143.461
Phoenix0.47 ± 0.332.360.26315.95
Guangzhou2.48 ± 2.2312.4111.2625.388
Chengdu1.94 ± 1.339.709.16347.41
Wuhan0.68 ± 0.483.423.14225.724
Xian1.47 ± 0.537.341.68195.58
Nanjing2.69 ± 1.5313.4611.62103.38
Economic Center
Atlanta1.11 ± 0.875.535.0373.26
Columbus0.35 ± 0.241.731.3794.79
Denver0.26 ± 0.111.320.4076.96
Harrisburg0.72 ± 0.383.580.55183.77
Phoenix0.68 ± 0.553.423.30353.51
Guangzhou1.67 ± 1.058.346.631.08
Chengdu3.43 ± 1.3917.1612.223.64
Wuhan1.80 ± 0.939.028.09216.64
Xian2.82 ± 2.2514.1210.6228.25
Nanjing2.67 ± 1.3613.3512.6496.89
Green Space Center
Atlanta0.75 ± 0.293.760.82252.33
Columbus0.26 ± 0.121.300.47320.12
Denver0.59 ± 0.242.941.23287.49
Harrisburg0.13 ± 0.050.670.267.50
Phoenix0.95 ± 0.434.741.606.86
Guangzhou7.37 ± 2.9536.864.32296.32
Chengdu11.68 ± 5.0858.4112.88115.13
Wuhan6.20 ± 3.7431.0118.66218.50
Xian3.45 ± 1.3817.237.41182.42
Nanjing11.44 ± 4.4557.206.66193.83
Publisher’s Note: MDPI stays neutral with regard to jurisdictional claims in published maps and institutional affiliations.

