Article

Evaluation of the Current State of Preservation of Vaccinio uliginosi-Pinetum Kleist 1929 in Eastern Poland

by
Katarzyna Masternak
1,*,
Danuta Urban
2 and
Krzysztof Kowalczyk
1
1
Institute of Genetics, Plant Breeding and Biotechnology, Faculty of Agrobioengineering, University of Life Sciences in Lublin, Akademicka 15, 20-950 Lublin, Poland
2
Department of Soil Sciences and Environmental Engineering, Faculty of Agrobioengineering, University of Life Sciences in Lublin, ul. Leszczyńskiego 7, 20-069 Lublin, Poland
*
Author to whom correspondence should be addressed.
Sustainability 2022, 14(9), 5387; https://doi.org/10.3390/su14095387
Submission received: 21 March 2022 / Revised: 22 April 2022 / Accepted: 27 April 2022 / Published: 29 April 2022

Abstract

:
The study assessed the genetic variability and the possibility of Scots pine regeneration in marshy forest. The genetic parameters were determined using the ISSR technique. The relationships between herbaceous plants, pine regeneration density, and their genetic variability were determined. On average, per 1 m2, three regenerated pine seedlings with a mean height of 27.56 cm were inventoried. Based on genetic analysis, it was found that the proportion of polymorphic loci was 60.46%. The average number of alleles at the locus was 1.345, and the effective number of alleles at the locus was 1.345. The values of the expected heterozygosity and Shannon index were 0.200 and 0.301, respectively. No species competing with pine regeneration were found. A significantly negative correlation of the number of pine regenerations with the area covered with an herbaceous plant layer and tree canopy closure was found. There was a relation to the insufficient amount of light under the stand canopy. In conclusion, the condition of marshy forests was satisfactory and the genetic variability of pine seedlings was moderate. The vegetation was typical for this habitat, but the significant presence of dry habitat species could indicate the beginning of habitat drainage. It seemed that the amount of light under the stand canopy was insufficient. Nevertheless, more light probably reached the inside of the stand in the terminal stage, as a result of upper layer tree separation, which in turn may facilitate the effective regeneration of Scots pine in this habitat.

1. Introduction

Natura 2000 is a network of nature protection areas in the European Union that includes valuable and endangered species. They cover more than 18% of the area of the EU countries. Natura 2000 is based on two EU directives: the Birds Directive, defining the criteria for designating Important Bird Areas for endangered bird species [1], and the Habitats Directive, specifying the criteria for the protection of other species of animals, plants, and the most valuable natural habitats [2].
In Poland, there are 76 habitat types covered by the Natura 2000 network, including forests and marshy forests (91D0). They have been included there due to their rarity, as well as their natural and landscape values [3]. This habitat type includes pine marshy forest (91D0-2; Vaccinio uliginosi-Pinetum sylvestris) and others.
In central Europe, marshy habitats are among the most threatened by global climate change [4]. This is due to their dehydration or drying, which is caused by the functioning of old but still active drainage ditches, resulting in the expansion of herbaceous plants; it is also a major threat to the existence of marshy forests. An additional risk is the inappropriate vertical structure of the stand, i.e., a shortage of old trees and a low level of natural regeneration. Moreover, global warming has been increasingly noticeable since the mid-1980s due to increased carbon dioxide levels in the atmosphere [5]. Climate warming reduces the vitality of Scots pine stands and makes its more susceptible to damage by bark beetles or mistletoe [6,7]. The stability of pine stands in the next century will be significantly reduced due to further increases in carbon dioxide emissions. This will result in a higher air temperature, the lack of continuous and uniform precipitation, and the occurrence of heavy rainfall, mainly in spring and summer, but also during the cold season [8,9]. Pine marshy forests, found mainly in lowlands, where precipitation has a major impact on the stability of habitats and stands, will therefore be increasingly exposed to degradation due to progressive drainage.
This requires research on the restitution and protection of pine marshy forest habitats through the use of hydrotechnical methods in order to restore their water conditions and interfere with the ongoing succession processes [10]. It is also worthwhile to analyze the natural regeneration capacity of Scots pine and the values of genetic variability parameters. Effective pine regeneration is essential for maintaining the stability of the swamp forest habitat. Natural regeneration of Scots pine play a great role in the restoration of many ecosystems, including pine marshy forest, and increases their adaptability to climate change [11,12]. Understanding the genetic variability of pine in this habitat is also extremely important as it determines the adaptive potential of trees [13].
Thus far, however, no studies have been carried out focusing on the regenerative potential and genetic variability of pine trees in the discussed habitat. Studies in this area concern only the dynamics of herbaceous plant transformations [14,15,16]. To date, Scots pine regeneration has been studied in the stands of fresh coniferous forest [17,18], fresh mixed coniferous forest, mixed broadleaved forest [19], and wet habitats [20]. Pine marshy forest has not been evaluated in terms of the regenerative potential and genetic variability of natural pine regeneration.
The aim of the study was to determine the current state of pine marshy forest preservation in eastern Poland and factors with the greatest impact on pine regeneration in this habitat. For this purpose, the regeneration potential of Scots pine was determined and its genetic variability using the ISSR technique (polymorphism of inter-simple sequence repeat). Species composition and forest floor cover of herbaceous vegetation were also evaluated, as they most rapidly indicate changes in the habitat. The detailed objectives were to determine:
-
Whether herbaceous plants and the values of ecological indicators were typical of this habitat and indicative of spontaneous regeneration processes.
-
Whether pine regeneration had a sufficient density, height, and variability to ensure the sustainability of this habitat.
-
Whether the presence of herbaceous plants and undergrowth layers affected the density of pine regeneration and which of the analyzed factors determined the possibility of pine regeneration in pine marshy forest?

2. Materials and Methods

2.1. Study Area

The study was carried out in Vaccinio uliginosi-Pinetum marshy forests in eastern Poland. The study covered 6 stands. Osowa 1, Osowa 2, Wołczyny, and Dubeczno stands were located on the Łęczna-Włodawa Plain, and Józefów 1, 2 stands in the Sandomierz Basin (Figure 1). The studied areas were located in a marshy forest habitat and all were formed by natural regeneration. The stands were formed only of pine trees aged 100–120 years (Osowa 2, Józefów 1, 2) and 40–60 years (Dubeczno, Wołczyny, Osowa 1). Other tree species (e.g., spruce, oak) grew individually.

2.2. Determination of the Abundance and Quality of Scots Pine Tree Natural Regeneration

Two 250 m long transects, 50 m apart from each other, were established in each stand. On each transect, 5 circular sample plots were established, at a distance of 50 m from each other. Therefore, ten circular sample plots were established at each site. All circular sample plots had an area of 38.46 m2 and a radius of 3.50 m. The number of pine seedlings was estimated on each study site, and their height was measured with an accuracy of 0.5 cm. On the basis of Jaworski’s [21] method, the regeneration was classified into: (a) younger seedlings up to 20 cm in height, (b) older seedlings between 21 and 50 cm, and (c) undergrowth up to a height of 50 to 200 cm.
Differences in the number, height, and quality of pine regeneration in 6 analyzed stands were determined using analysis of variance (ANOVA). The Tukey test was used as the post hoc analysis. Calculations were performed using Statistica ver. 13.1 [22].

2.3. Determination of Species Composition in Marshy Forests and Conditions of Pine Seedling Formation

One phytosociological record was made in each circular sample plot. A phytosociological record (60 phytosociological records in total on 6 objects) was made to the vegetation characterize using the Braun–Blanguet method [23]. Species coverage was determined on a 6-point scale according to Matuszkiewicz [24]. The names of vascular plants were according to Mirek et al. [25], and of bryophytes according to Ochyry et al. [26].
Ecological indices, developed for central Europe by Ellenberg (1978), were used to determine the ecological spectrum of vascular plant species and habitat conditions. The following indices of the habitat were analyzed: light (L), humidity (F), and trophism (fertility) (N). The values of ecological indices were calculated for each site. They took into account the species occurrence and percentage area coverage by these species, according to the following formula described by Gmyz and Skrzyszewski [17]:
ELW ( L , F , N ) = ( ELW ( L , F , N ) × SP SP
where SP—coverage expressed on the Braun–Blanquet scale
To determine the microhabitat conditions conducive to the natural regeneration of pine trees, Spearman’s correlation coefficients were estimated. They were calculated between the seedling density and the area coverage with a layer of trees (a), shrubs (b), herbaceous plants (c), and mosses (d), as well as by individual species present in the herbaceous vegetation layer. Calculations were performed using the statistical package Statistica ver. 13.1 [21].

2.4. Genetic Analysis

Needles from 30 randomly selected regenerating pines were obtained in each circular sample plot. Genomic DNA extraction was performed according to the Rogers and Bendich methodology [27]. Inter-microsatellite sequence analysis (ISSR) was performed using 15 primers with the following sequences: (GT)8C, (AC)8G, (GA)7YG, (GA)8C, (GA)8C, (GA)8C, (CA)8GC, (TC)8G, (AG)8YT, (TC)8CC, (AC)8T, (CA)8A, (TC)9A, (AC)9G, (ATG)6T, (AC)8T, and (AC)8YG, where Y is T or C. Amplification reactions were performed in a 10 µL mixture containing water, 1× concentrated reaction buffer, 31 mM magnesium chloride, 40 mM dNTP, 50 mM primer, 0.46 U Taq polymerase, and 40 ng of genomic DNA. Sequences of the applied primers are given in Table 1. PCR reactions were performed in a Biometra “T-Personal” thermocycler programmed for 38 amplification cycles consisting of denaturation (95 °C—30 s), primer annealing (45 s in the first three cycles at 54 °C, three consecutive ones at 53 °C, and the others at 52 °C), and DNA amplification (72 °C—2 min). These cycles were preceded by an initial denaturation (7 min at 95 °C) and ended with 7 min of final elongation at 72 °C. The products were separated and visualized on a 2% agarose gel.
The percentage of polymorphic loci (P%), frequency of individual alleles, average number of alleles at the locus (Na), and observed heterozygosity (Ho) were determined based on genetic tests. The effective allele number at the locus (Ne) [28] and expected heterozygosity (He) [29] were estimated. The Shannon index (I) was used to determine the level of intrapopulation differentiation; molecular analysis of variance (AMOVA) was also performed. The correlation between the genetic and geographical distance was estimated with the Mantel test [30]. These genetic variability parameters were calculated using PopGene ver. 1.3 [31] and GeneAlex ver. 6.5 programs [32].
Structure ver. 2.3.4. [33] was used to delineate genetic clusters on the basis of Bayesian reasoning. The following parameters were used: 100,000 “burn-in,” 100,000 MCMC (Markov chain Monte Carlo) repeats with an admixture model and correlated allele frequencies. The number of possible clusters (K) was analyzed in the range of 2–10, and 20 repetitions were performed for each K value. Due to the difficulty of estimating the most probable number of clusters, a procedure developed by [34] was applied based on the second-order rate of change of the likelihood function (ΔK) using Structure Harvester [35]. In order to obtain a uniform probability matrix, the results were analyzed in the CLUMPP program [36], and subsequently graphically developed using the DISTRUCT program [37].

3. Results

3.1. Characteristics of Pine Regeneration

The Scots pine regeneration process in marshy forests was weak. Regenerating pines growing in marshy forests in eastern Poland were characterized by a differentiated abundance ranging from 34 in the population of Józefów 2 to 277 in Wołczyny. The average number of saplings in the studied habitat was 3 saplings/m2 (2 saplings/m2 of younger seedlings, 0.5 saplings/m2 of older plants, and 0.3 saplings/m2 of undergrowth). The analysis of variance showed significant differences in terms of these features depending on the location of the test site. The populations of Józefów 1 and Wołczyny were similar in terms of the number of regenerating pines that belonged mainly to young seedlings. It is worth noting that apart from the Osowa 1 site, the number of regenerations in subsequent developmental stages in all other sites was lower (Table 1).
The average height ranged from 3.8 cm (Wołczyny) to 56.83 cm (Osowa 1). The height of pines regenerating in marshy forests in the Osowa 1 and Dubeczno stands was greatest. Younger seedlings dominated in most of the study locations. Only pines growing in Osowo 1 were mostly classified as undergrowth and older seedlings. The lowest height was recorded for pines growing in the Wołczyny forest, where all the inventoried regeneration was classified as younger seedlings, and thus their height did not exceed 20 cm.
The analysis of variance showed significant differences in terms of height depending on site location. Only pines from Józefów 1 and 2 were of similar height. Pine regenerations in other patches formed different homogeneous groups (Table 1).

3.2. Genetic Variability of Regenerating Pines

The analysis of 15 primers yielded 153 loci. The highest value of all genetic variability parameters was recorded for the pine population in the Józefów 1 stand, while the lowest was in the pine population located in the marshy forest stand of Józefów 2. The percentage of polymorphic loci ranged from 52.29 to 66.67%. The expected heterozygosity was, on average, 0.2. The population of Wołczyny was the lowest difference between the mean and effective number of alleles at the locus. The average Shannon index was 0.301 (Table 2).
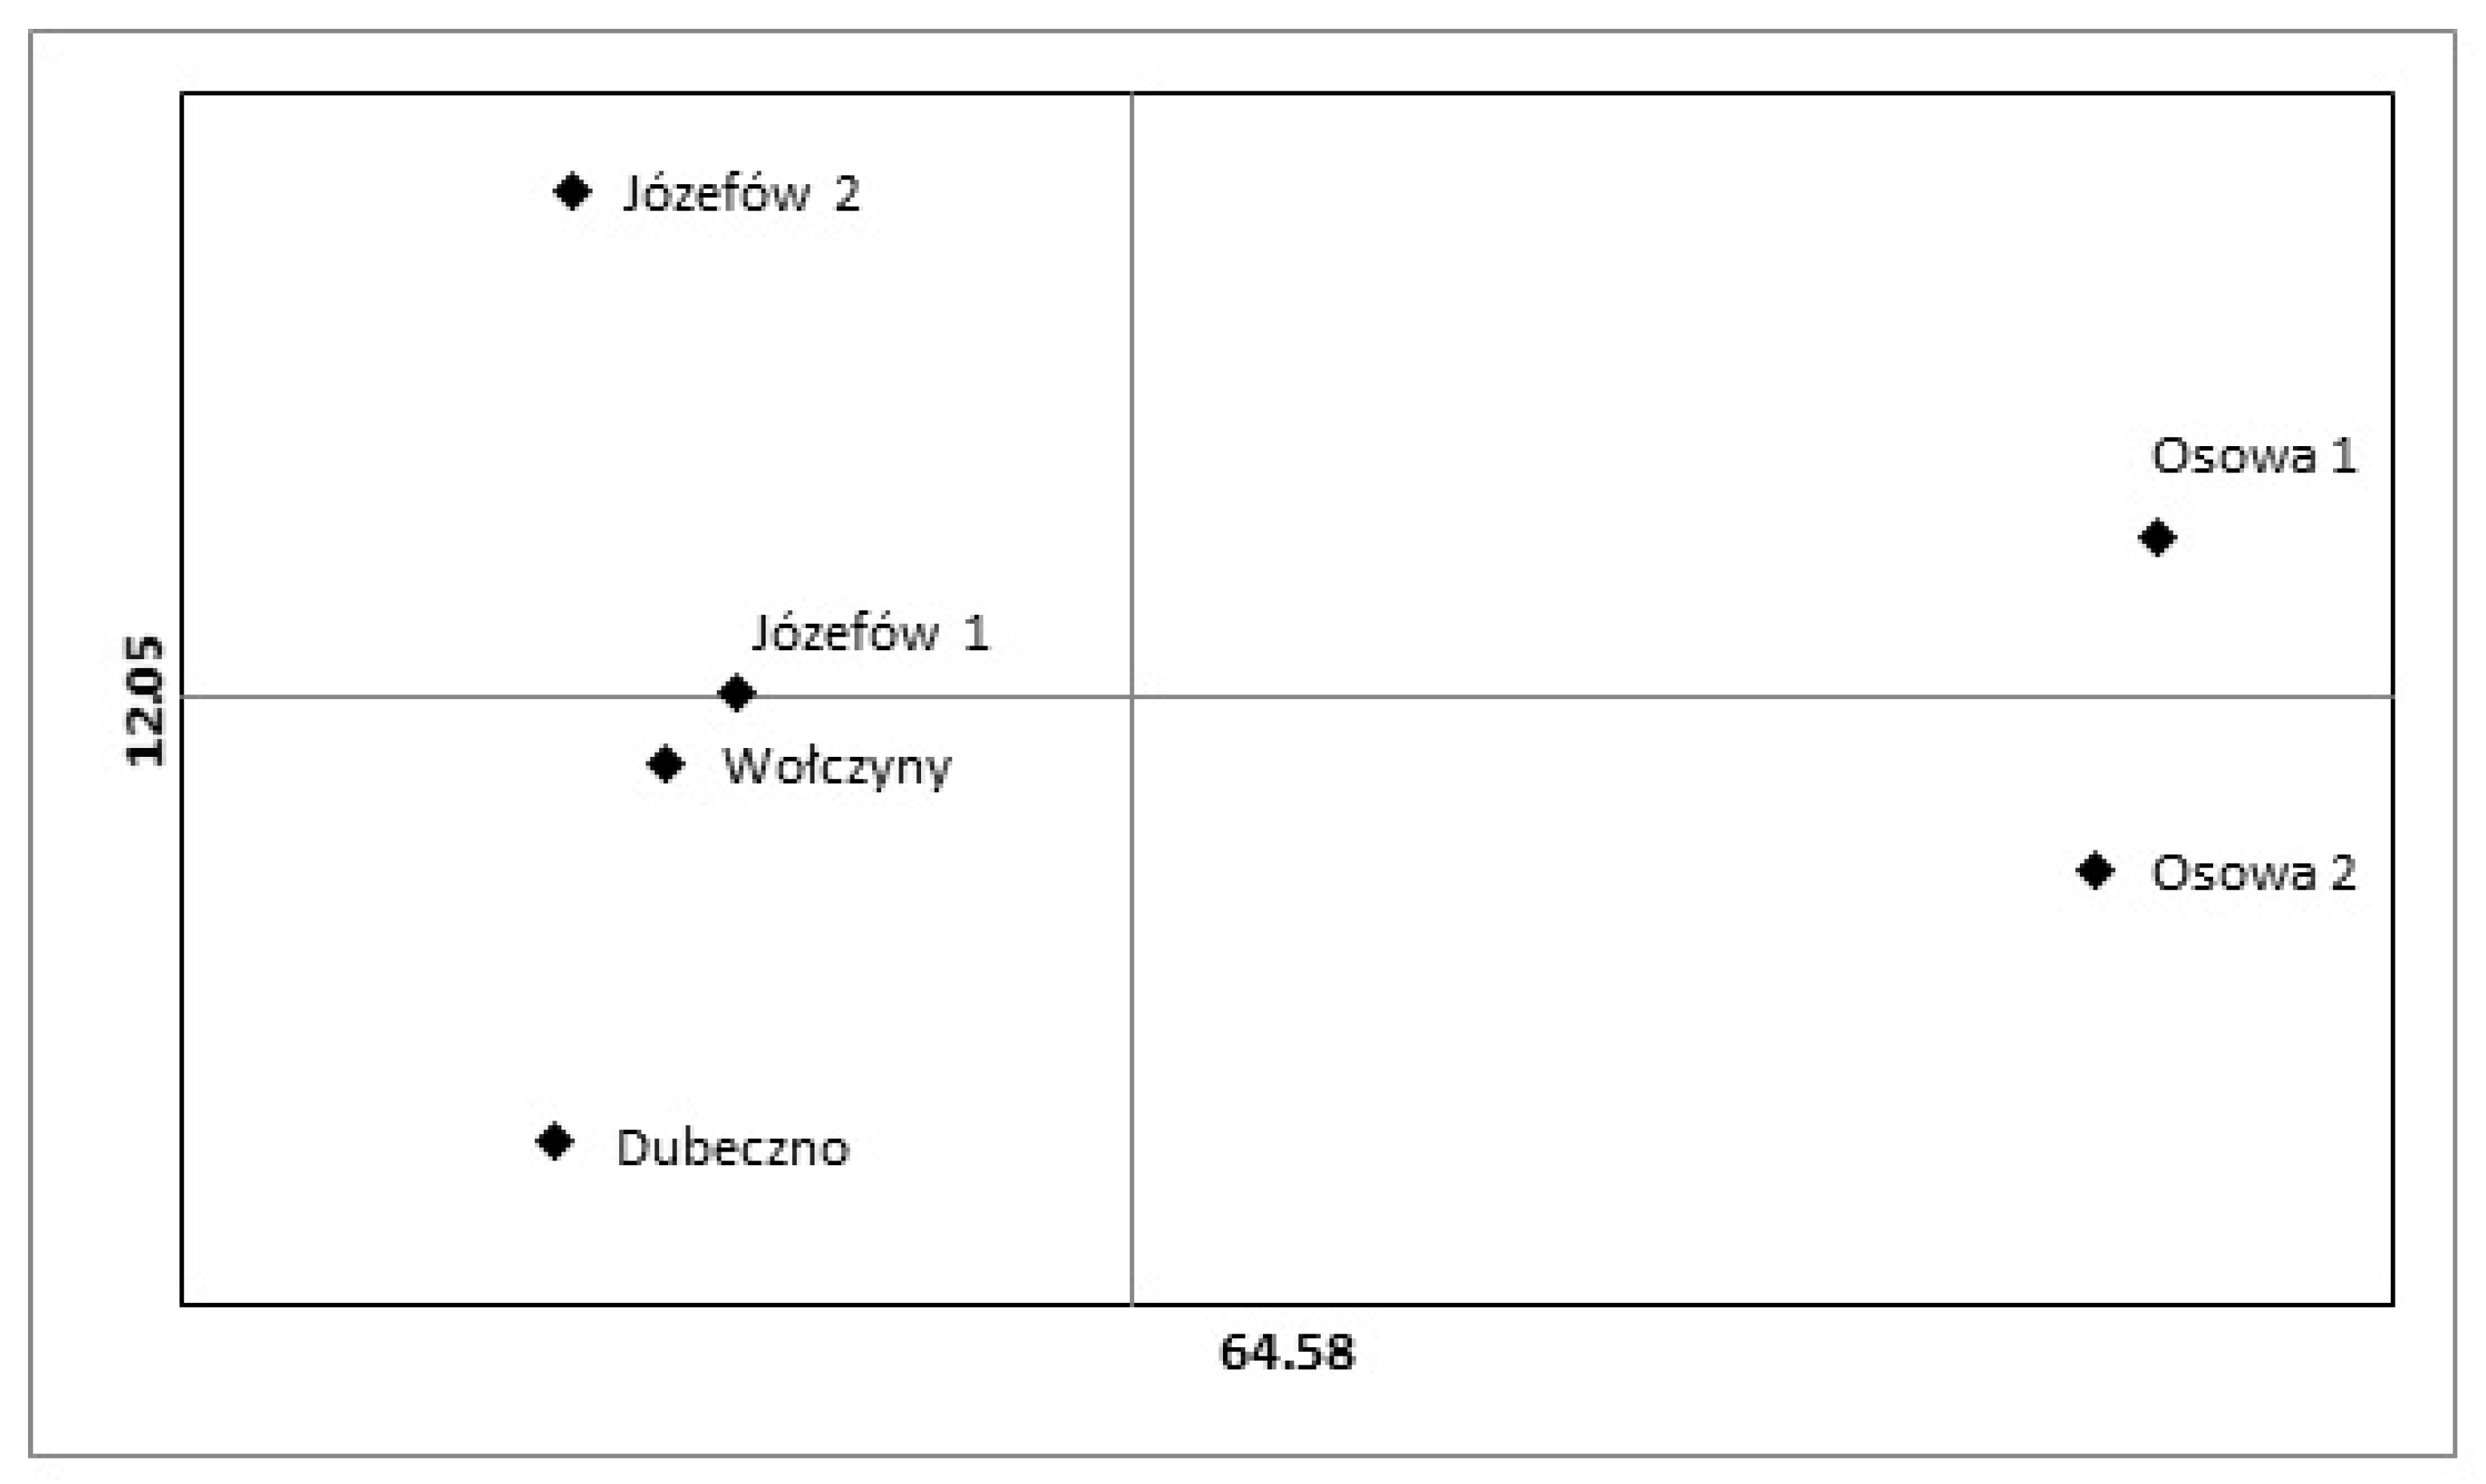
The genetic similarity between the regeneration process in the Józefów 1 and Wołczyny stands is clearly visible on the graph showing the main coordinates. Pines regenerating in Dubeczno and Józefów 2 were also located quite close to the aforementioned populations on the graph. In turn, the remaining populations (Osowa 1 and Osowa 2) formed distinctly separate clusters (Figure 2).
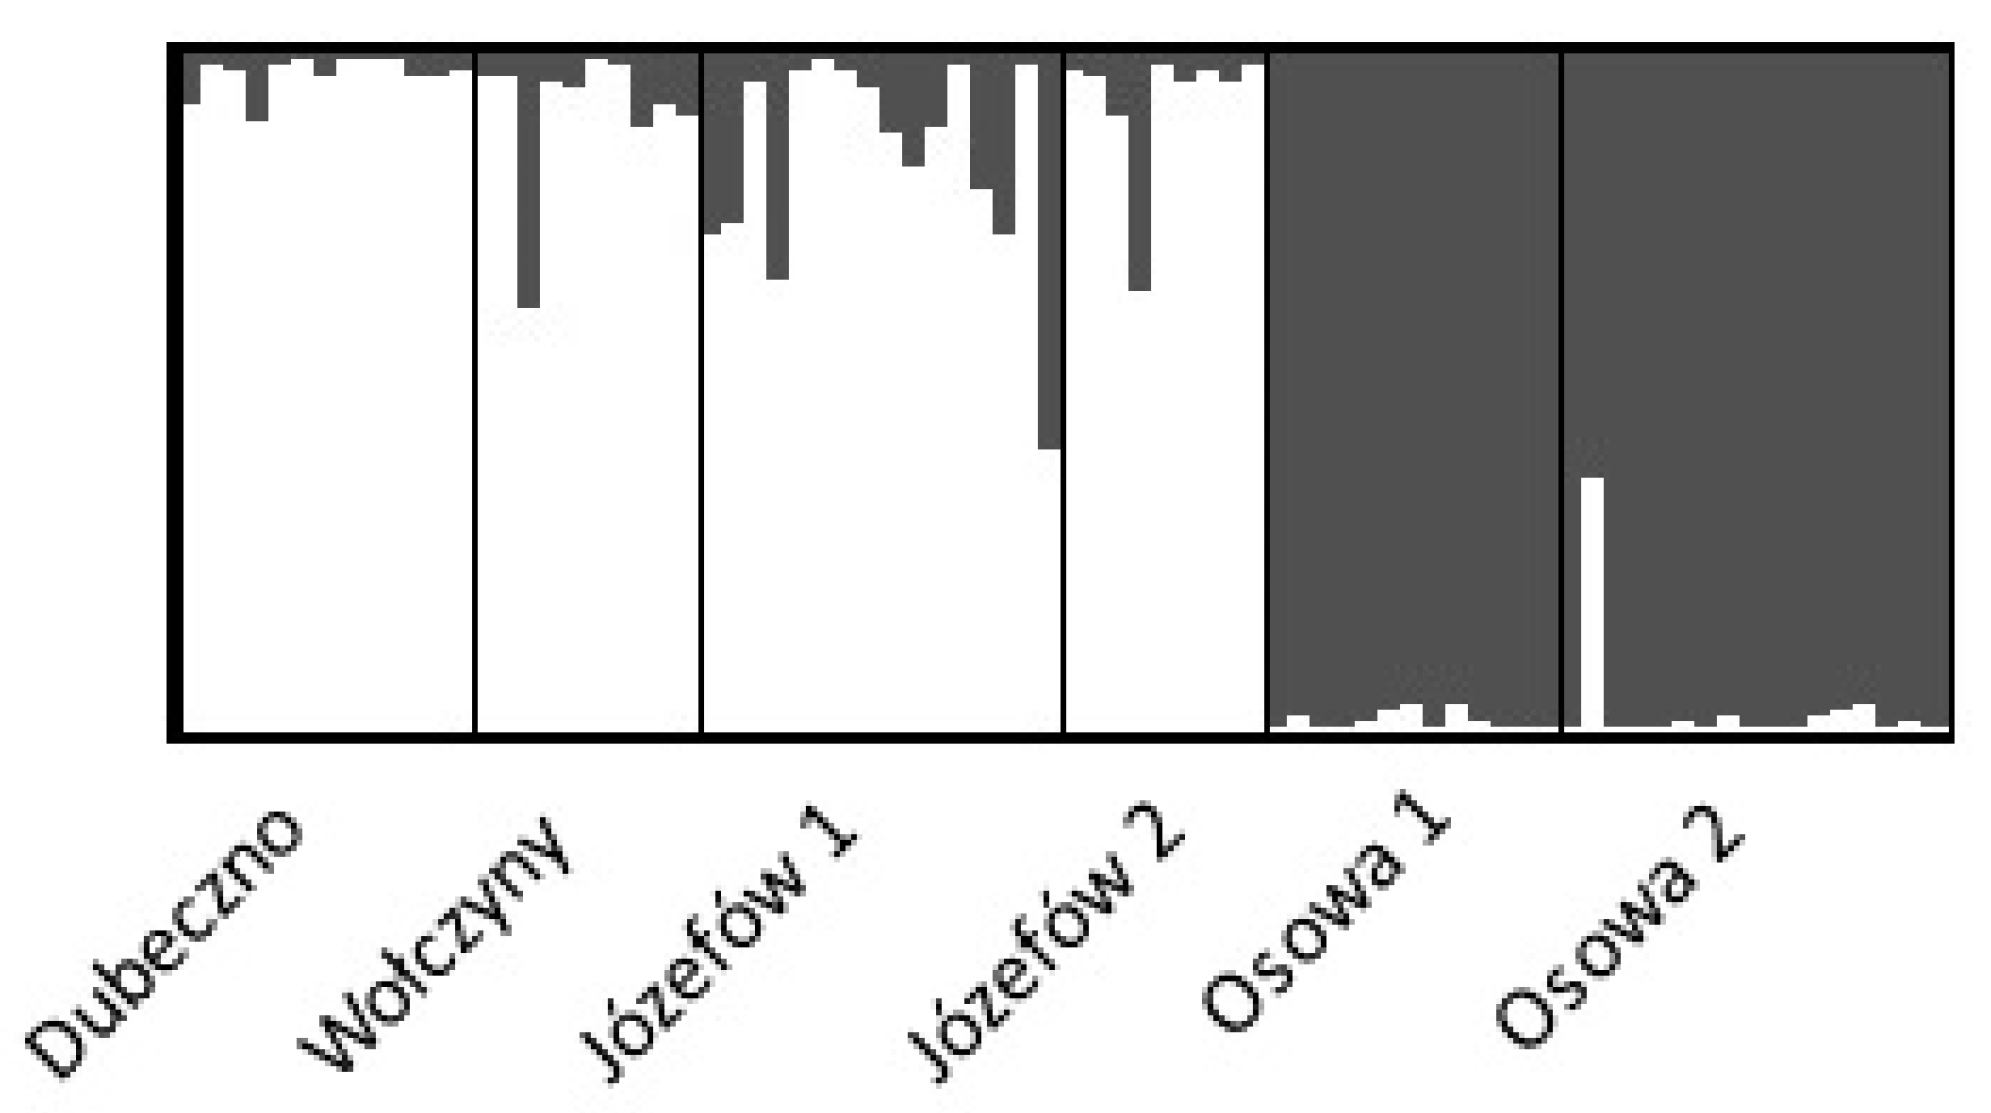
This thesis was confirmed by the results obtained in the Structure program, which showed the presence of two genetic clusters. The most homogeneous were the populations of Osowa 1 and Osowa 2, which formed the first cluster. Pine trees from other stands (Dubeczno, Wołczyny, Józefów 1, 2) also showed genetic similarity, forming one genetic cluster (Figure 3).
The Mantel test obtained the relationship between genetic and geographical distances. The correlation coefficient was 0.207 and was statistically significant (p = 0.010).
AMOVA demonstrated that 75% of the total variability accounted for the intrapopulation differences. The remaining 25% resulted from the differences between the populations (Table 3).

3.3. Forest Floor Vegetation and Conditions of Pine Seedling Emergence

The tree layer in all examined patches of Vaccinio uliginosi-Pinetum marshy forest was almost exclusively formed by Pinus sylvestris (coverage: 52.47–75.0). A small admixture (Osowa 1, 2, Wołczyny, Józefów 1) was represented by Betula pubescens, reaching a coverage of 5.51%. Pinus sylvestris, Betula pubescens, sparse Frangula alnus (Osowa 1,2, Józefów 1,2), and Quercus robur (Osowa 2, Dubeczno, Wołczyny, Józefów 1), as well as Sorbus aucuparia (Józefów 1), Picea abies (Dubeczno, Józefów 1), and Salix cinerea (Józefów 1), were observed in the poorly developed shrub layer. The presence of Quercus rubra and Padus serotina, both of foreign origin, was recorded in the forest patches at the Osowa 2 site. Plants belonging to the herbaceous vegetation layer were generally abundant. It consisted mainly of Ledum palustre and Vaccinium uliginosum shrubs. Forest species characteristic of Vaccinio-Piceetea-Vaccinium myrtillus and Vaccinium vitis-idaea, as well as Melampyrum pratense (only on one object—Osowa 2), also had a relatively high coverage in all examined sites. There were also species characteristic of raised peat bogs of the class Oxycocco-Sphagnetea, such as Oxycoccus palustris, Eriophorum vaginatum, and Andromeda polypholia. Molinia caerulea (0.52–4.03% coverage) and Calluna vulgaris (0.55–6.77% coverage) were also found in low abundance. The presence of the species Carex rostrata (Józefów 1, 2), Eriophorum angustifolium, and Juncus effususus (Józefów 1) was also recorded. The bryophyte layer was well developed and the dominant species were Vaccinio-Piceetea, especially Pleurozium schreberi and Dicranum polysetum. Hylocomium splendens formed a large admixture in some patches. Sphagnum magellanicum and Sphagnum fallax mosses were found in all sites. Sphagnum fuscum was observed in the following sites: Osowa 1 and 2, Wołczyny, while Sphagnum rubellum was in Osowa 1 and Osowa 2. The presence of lichens was noted in some patches (Wołczyny and Józefów 1, 2). The examined patches of marshy forest were floristically poor, as from 16 (Dubeczno) to 25 species (Józefów 1) were identified in the discussed sites (Table 4).
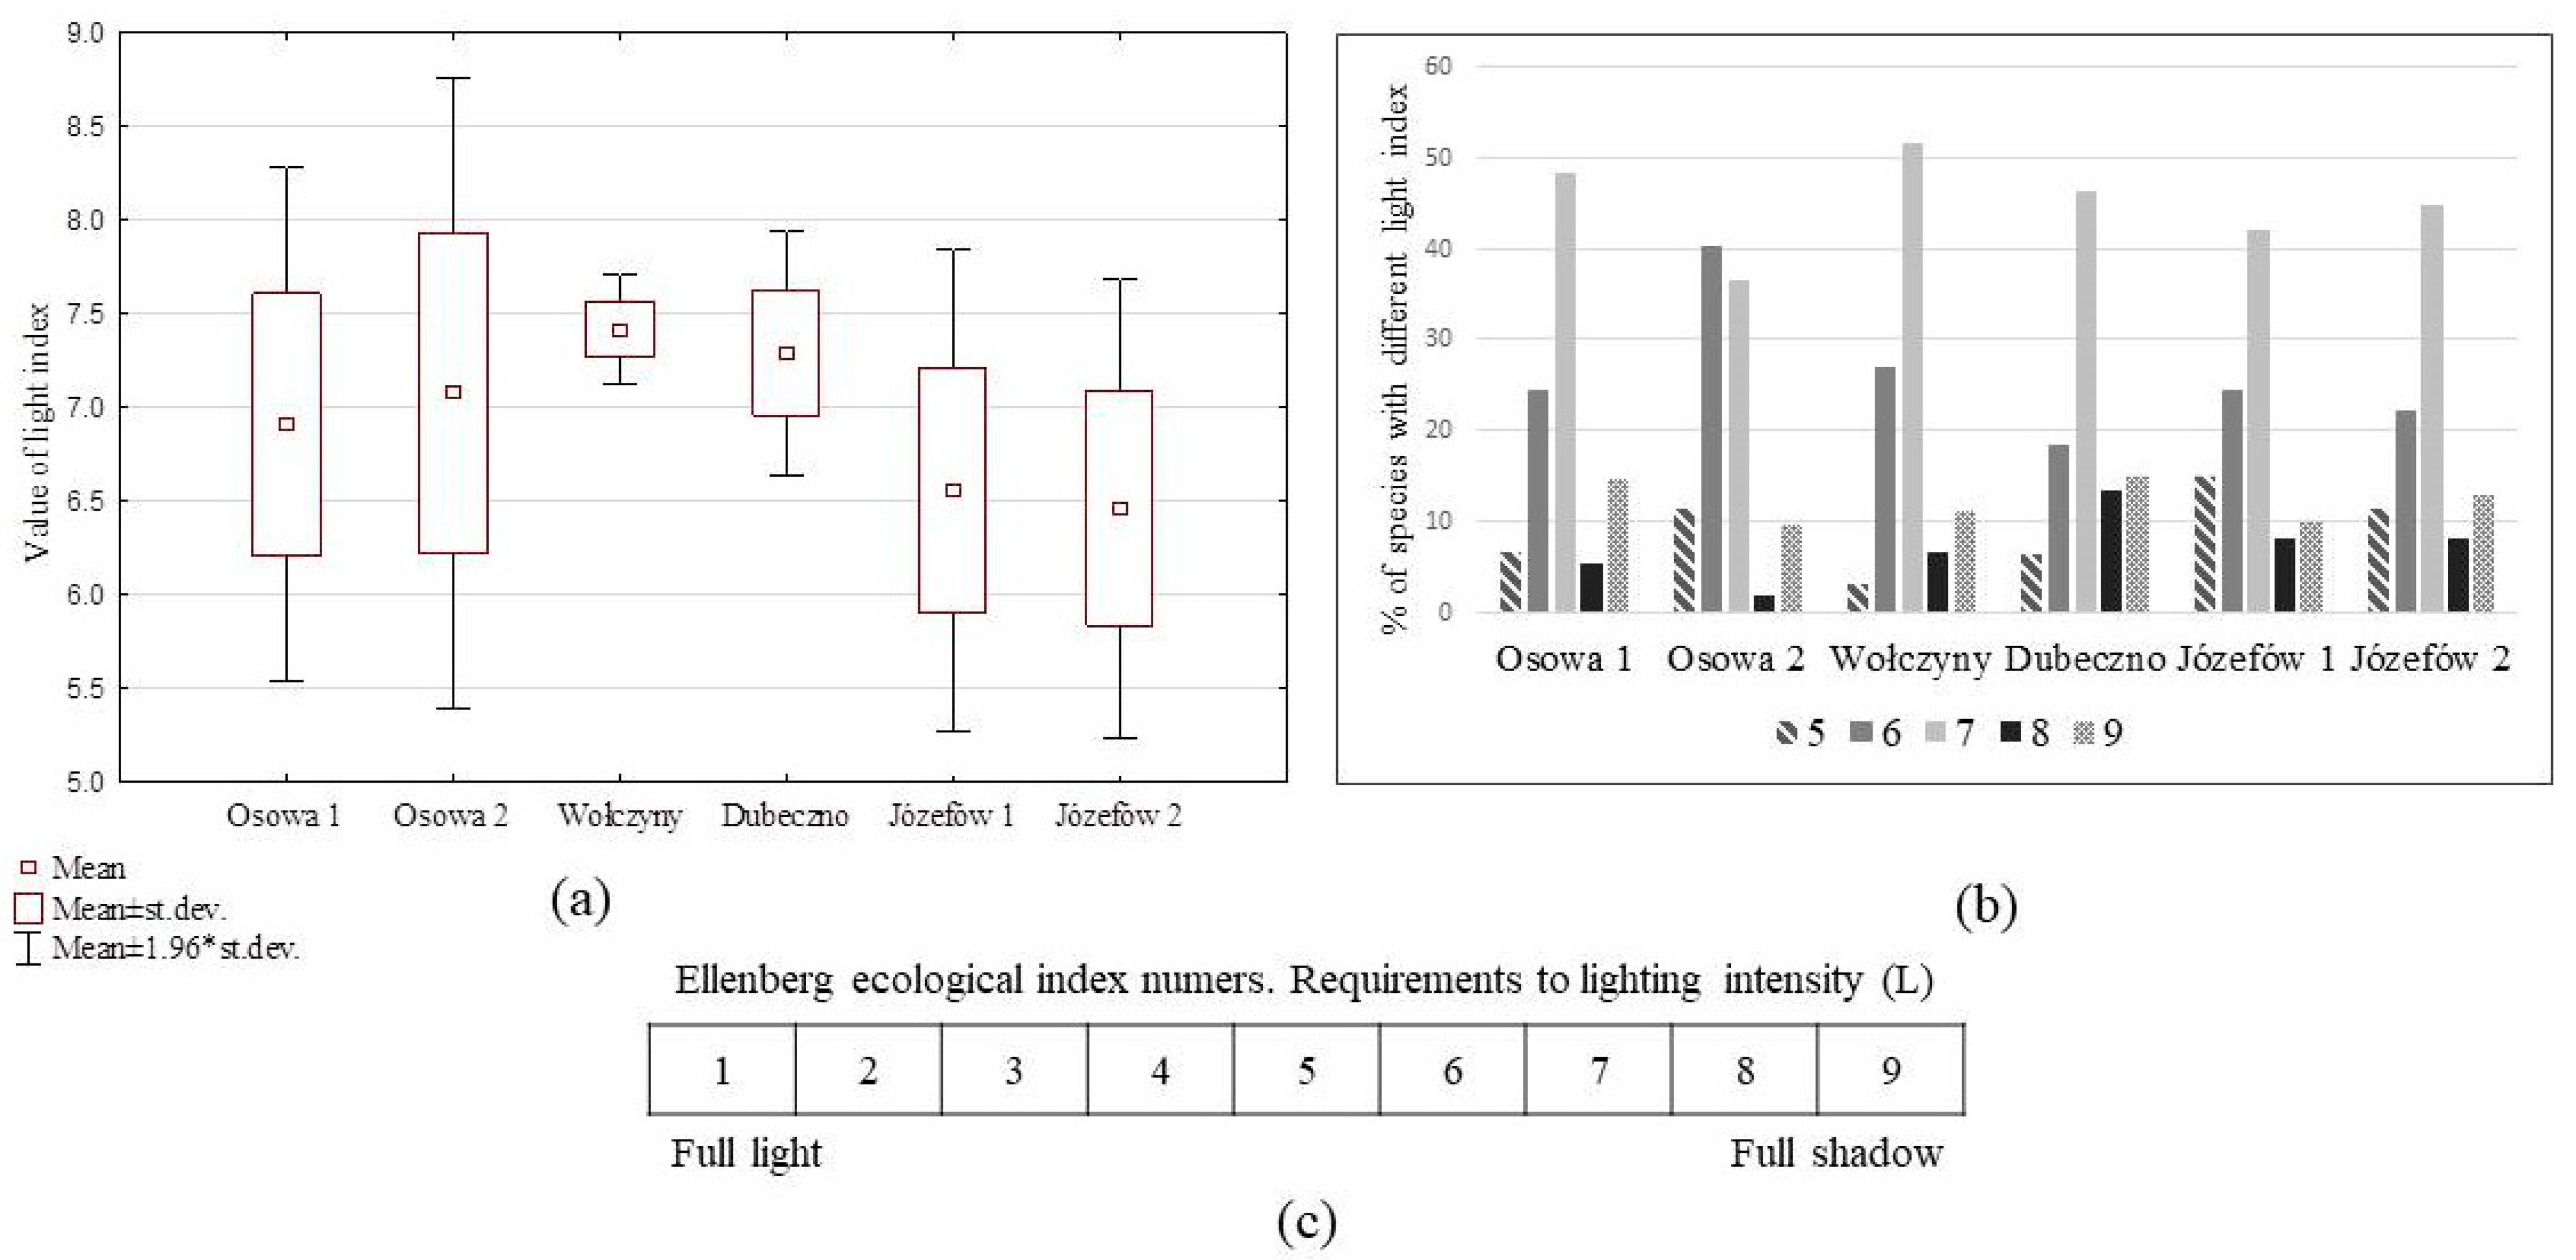
The ecological indices, light, humidity, and nitrogen content, were calculated. The mean values of the light index calculated for each site ranged from 6.5 (Józefów 2) to 7.4 (Wołczyny). Species numbers 7 and 6 dominated, which indicated moderate lighting conditions. There were significantly fewer species requiring full light (index numbers: 9 and 8). Full shade species with index numbers 1 and 2 were not observed (Figure 4a–c).
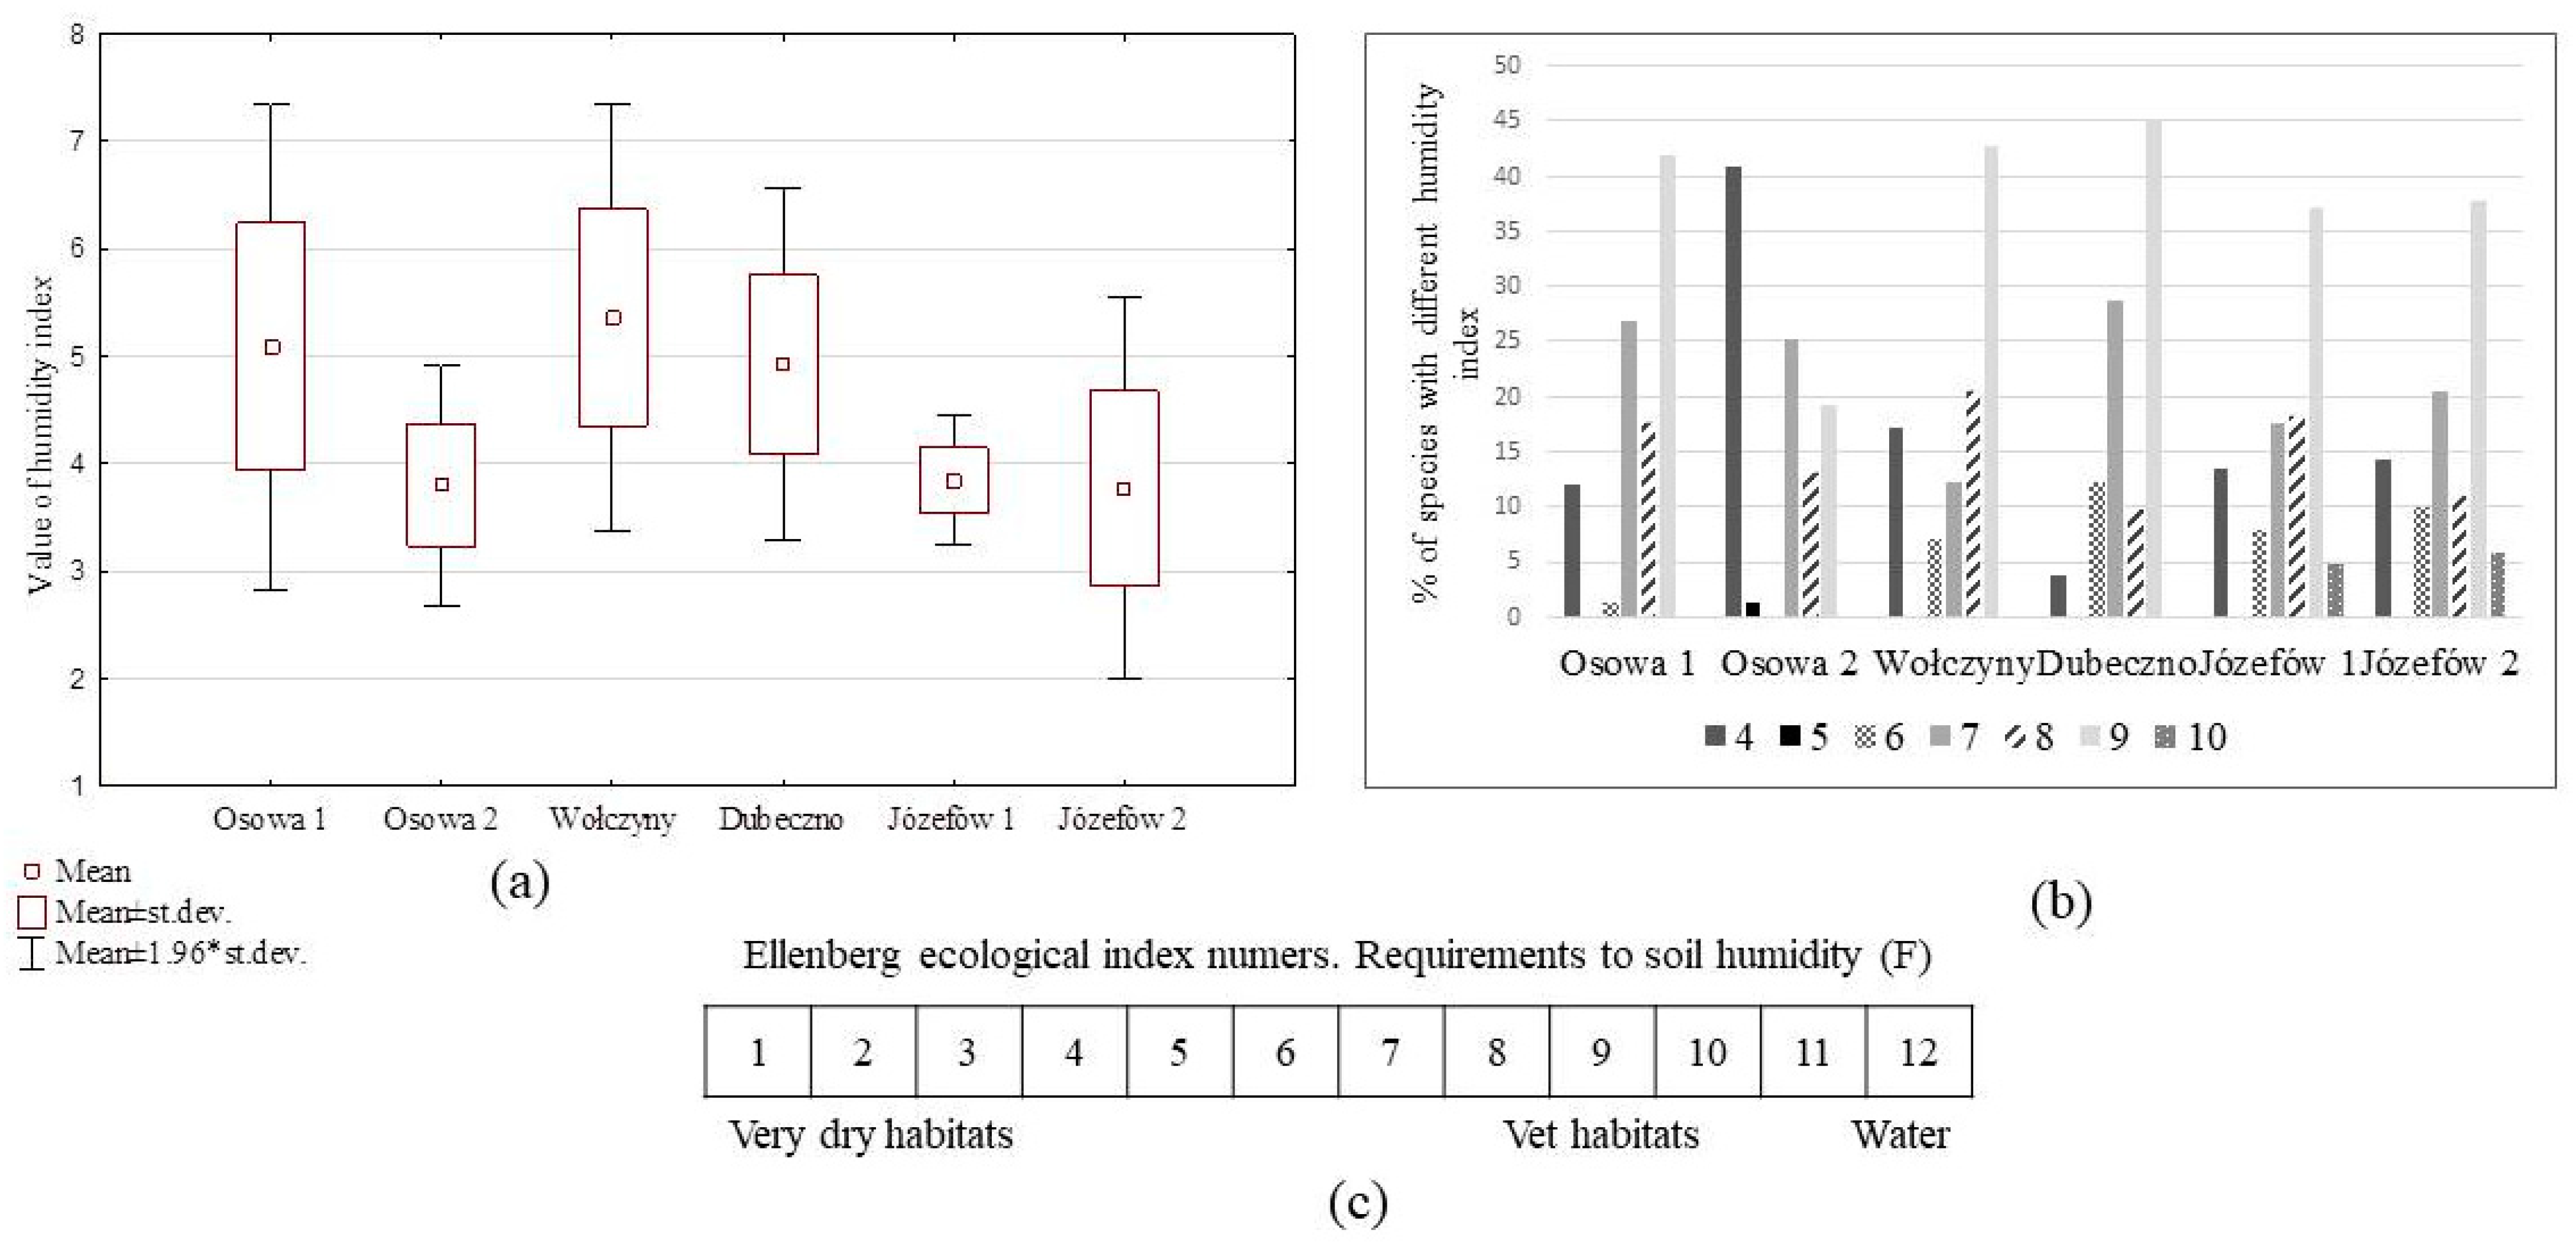
The average values of the humidity index calculated for each site ranged from 3.8 (Osowa 2, Józefów 1, 2) to 5.4 (Wołczyny), indicating typical moist conditions for wet soils (index numbers: 7, 8, and 9) with a high percentage of species typical for arid habitats (index number: 4) (Figure 5a–c).
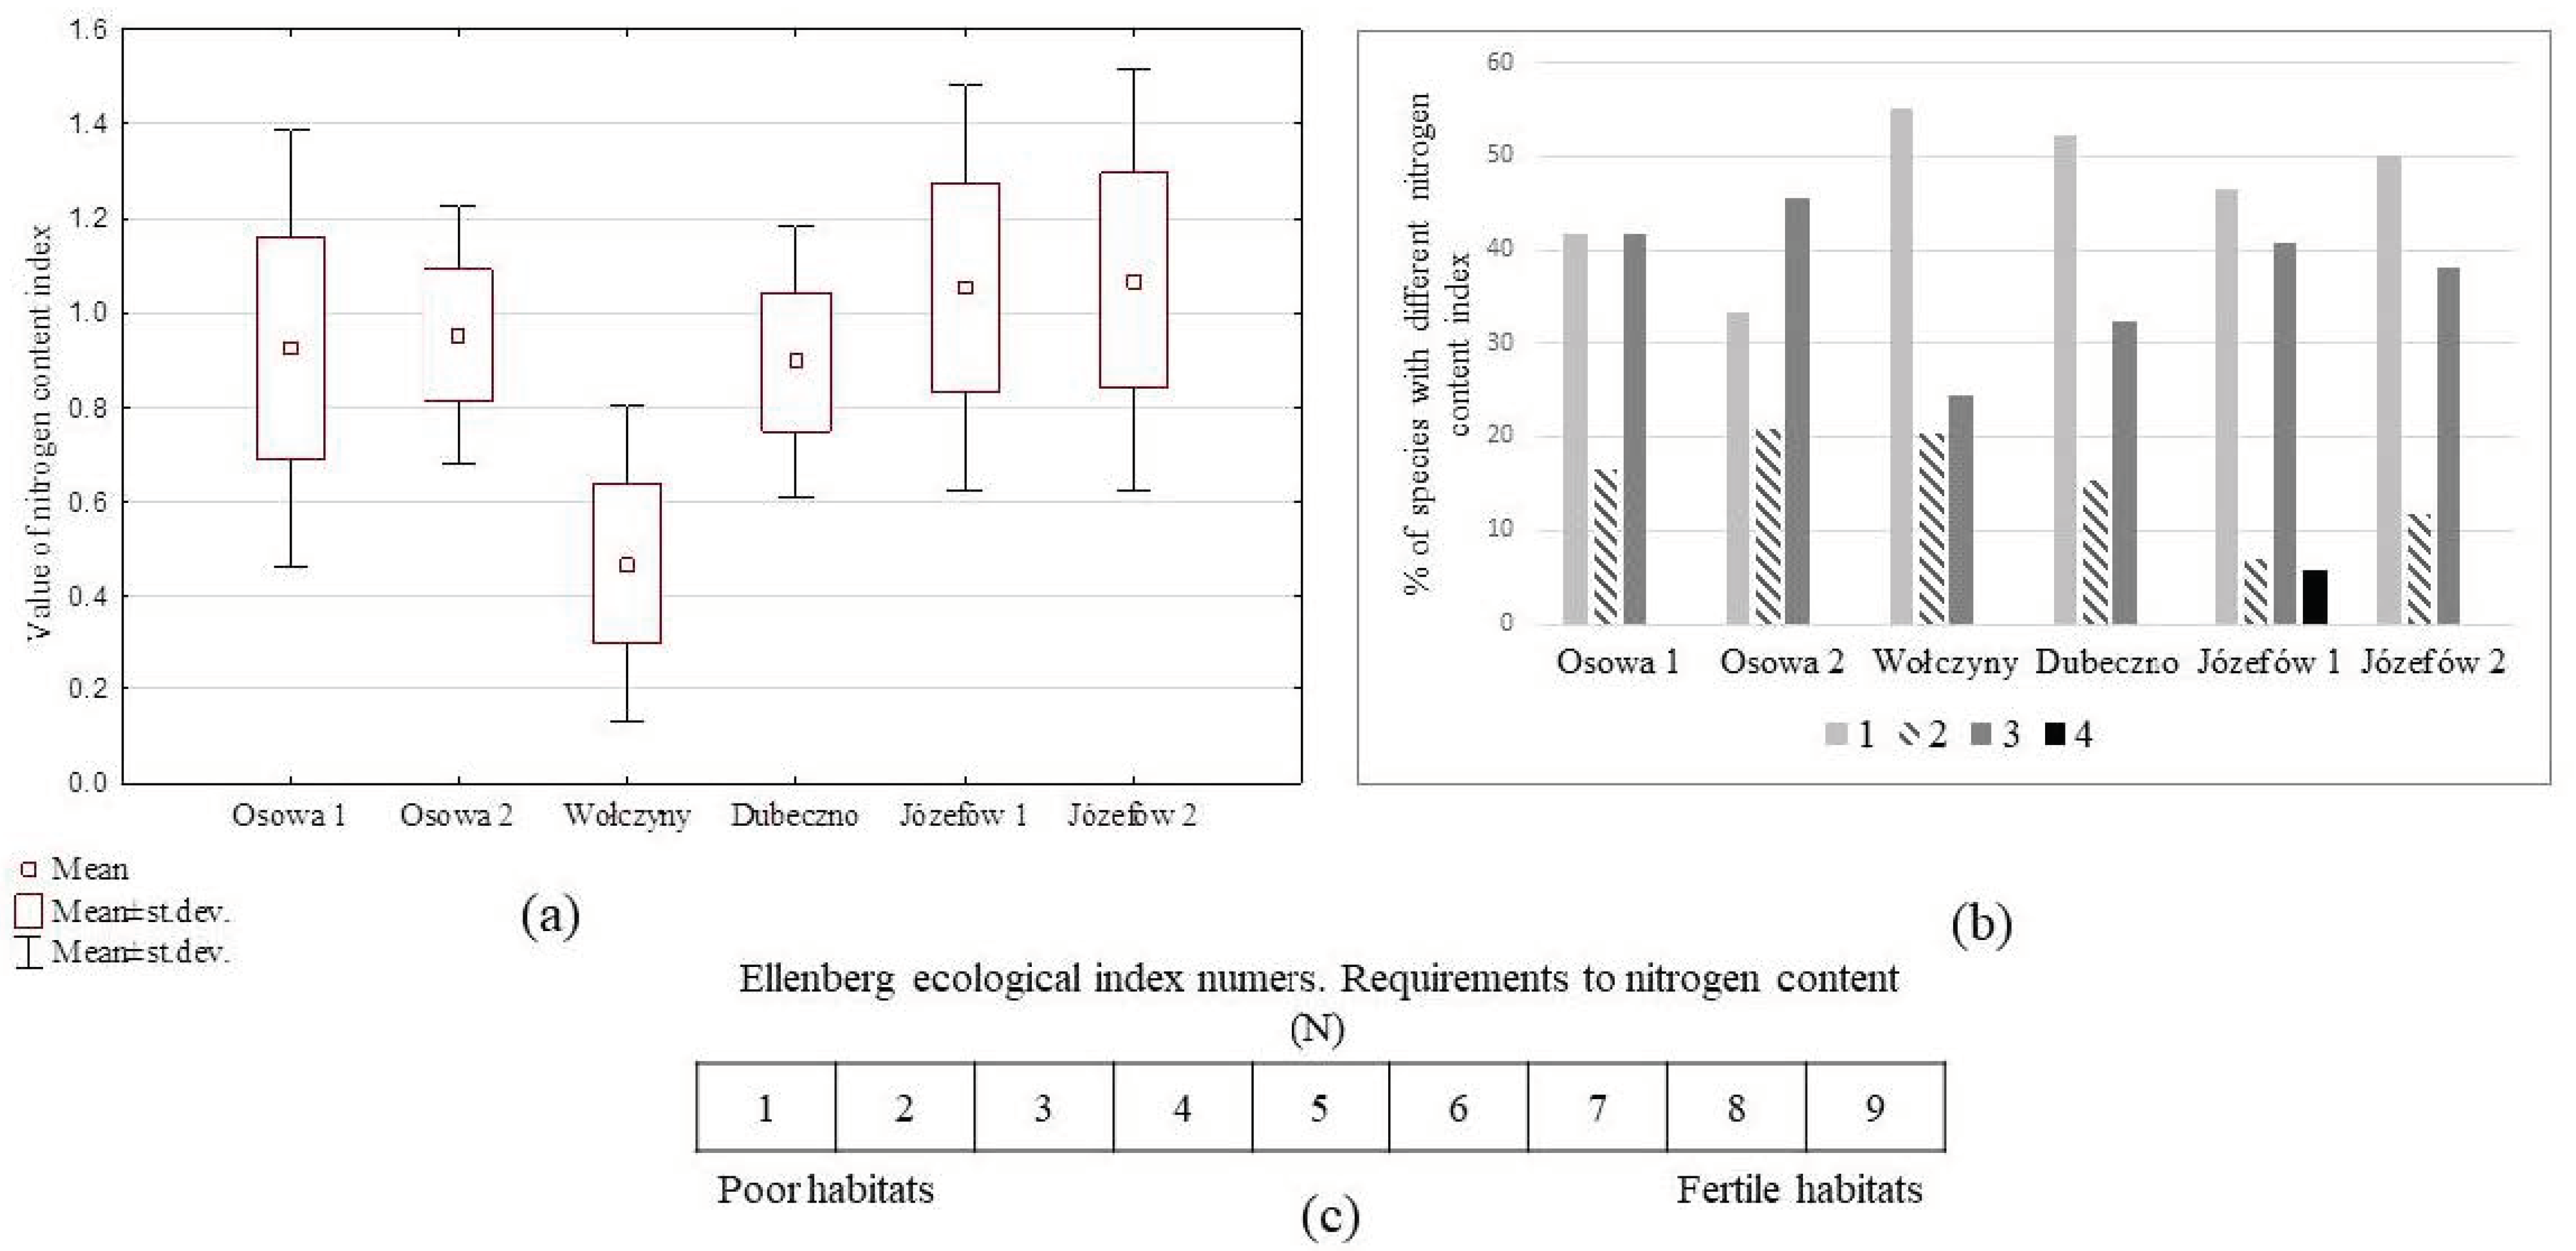
The fertility of the habitats was evaluated on the basis of the nitrogen content index (N) in soil. This index demonstrated an advantage of species with index numbers from 1 to 3 in the studied vascular flora, indicating poor habitats (Figure 6a–c).
The appearance of pine seedlings was hampered by both high stand density (layer a) and a large number of undergrowth plants (layer c). However, species belonging to undergrowth plants and bryophytes, which would have a significant effect on the occurrence of pine seedlings, were not recorded in any of the analyzed marshy forests. The number of regenerating pines in the Osowa 1 marshy forest was positively correlated with Eriophorum vaginatum L. and Andromeda polifolia L., and with Polytrichum strictum Brid. in Dubeczno. Only Pleurozium schreberi (Willd. ex Brid.) Mitt. showed a negative correlation with pine abundance (Osowa 2). A combined analysis of all locations demonstrated that the number of pine regenerations has a negative correlation with Melampyrum pratense L. and a positive relationship with Eriophorum vaginatum L., Rhododendron tomentosum, small cranberry, and spruce (Table 5).

4. Discussion

4.1. Abundance and Genetic Variability of Natural Pine Regenerations

The density of young pine generation in marshy forests was low and amounted on average to 3 saplings/m2, which gives 3000 saplings/ha. This value was below the accepted norm in Poland for natural regeneration, which should be no less than 20 growing seedlings/m2. The density value was also lower than recommended for artificial regeneration [38,39], which indicated weak regeneration processes of marshy forests. The number of pine seedlings in the habitat of fresh mixed coniferous forest varies from 9 to 45 thousand saplings/ha, and from 8 to 59 saplings/ha in the fresh mixed broadleaf forest habitat [19]. It should be noted that, apart from Osowa 1, the number of regenerations in subsequent developmental stages was lower in every other location. Younger seedlings accounted for 73% of the total number of regenerations, older seedlings for 18%, and undergrowth for 9%. A similar observation was made by Gmyz and Skrzyszewski [17] in a fresh coniferous forest habitat. That confirmed the thesis of Jaworski [21] on the high tree mortality in the initial growth stages, caused by strong competition with forest plants, the negative effect of frost, and excessive solar exposure.
The natural regeneration of pine trees was characterized by average genetic variability. A proportion of 60.46% of the studied loci were polymorphic. Both lower (P% = 42) [40] and higher (P% = 95) [41] proportions of pine polymorphic loci, determined using the ISSR technique, can be found in the literature. The genetic variability parameters (Ne = 1.345; He = 0.200) were similar to those obtained by Vidyakin et al. [40] (Ne = 1.505; He = 0.136) or Hui-yu et al. [40] (Ne = 1.2652), but higher than the results obtained by Androsiuk and Urbanik [42] (Ne = 1.124; He = 0.078) for a different population of Pinus sylvestris. The Shannon index was I = 0.301, which was an intermediate value to those obtained for pine: 0.6907 [43], 0.158 [44], and 0.6907 [41]. The obtained genetic variability parameter values were consistent with those acquired for other pine species using the ISSR method [44,45,46,47].
AMOVA showed that 25% of the total variability was to interpopulation differences. A similar level (GST) of genetic diversity in stands was reported by Nowakowska [48] for 30 different Polish populations of Scots pine, and by Wachowiak [49] for 8 Scots pine populations.
The genetic diversity of Osowa 1 and Osowa 2 populations should be noted, which was demonstrated using PCoA and structure analysis. Both populations could have a common origin, genetically different from the other studied objects. The results of the Mantel test indicated the existence of genetic variation depending on geographic location. The Osowa 1 and Osowa 2 populations are therefore more similar to each other, and gene flow is probably more effective between them. The populations formed one genetic cluster in the principal component analysis. They are very different from the rest of the populations probably because of isolation by distance. They are located far away from them and gene flow is not so effective.

4.2. Forest Floor Vegetation

Vegetation plants are the element of the ecosystem that best responds to changes in some of its components [8]. Plant cover for a specific habitat, its spatial differentiation, and the quantitative and qualitative percentage of species allows the determination of its variability and processes occurring in the environment [50]. Vascular plants are most often used to determine the status and changes occurring in the environment [51,52]. Thanks to this method, we established that marshy forests were located in eastern Poland. They were characterized by the occurrence of species characteristic of this complex, i.e., Ledum palustre and Vaccinium uliginosum. There were also peatland species, which serve as indicators of good conservation status of marshy forests: Sphagnum ssp., Oxycoccus palustris, Andromeda polifolia, and Eriophorum vaginatum. However, the proportion of species of dry habitats, such as Cladonia sp., was also high. According to Paluch [8], the appearance of coniferous species could indicate the beginning of the process of gradual drainage of this habitat. This was also confirmed by the average soil moisture index of 4.5.
Ecological indices were comparable to those characteristic of the Vaccinio uliginosi-Pinetum habitat. Roo-Zielińska [50] reported that the average light index for marshy forests in Poland is 5.7, with more than 80% of forests having an index between 6 and 7. The humidity and trophism indices for marshy forests were determined at 5.8 and 2.2. In our study, the average light, trophism, and humidity indices were 6.9, 0.9, and 4.5, respectively. Except for the moisture index, the remaining Ellenberg indices were typical for pine marshy forests. Plants nonspecific for this habitat were not found in the species composition. This allowed the conclusion to be made that the condition of the marshy forest habitat in eastern Poland was sufficient and spontaneous vegetation regeneration processes might be successful.
However, the humidity index of 4.5 indicated a high presence of plants characteristic of dry habitats. The studied habitats should also be monitored for possible drainage. The non-peat surroundings of the marshy forest habitat should be considered. Potential drainage of the habitat may be caused by the functioning of old but still active drainage ditches, resulting in the expansion of herbaceous plants. Moreover, a complete or partial logging at a distance of about two stand heights should not be performed in its vicinity.
Based on our results, a total of 30 species were identified in marshy forests located in eastern Poland. According to Matuszkiewicz [53], an average of 20 species could be observed there, and the number of species recorded within the whole complex amounted to 80. Czerepko [16] analyzed marshy forest patches in the Augustów Primeval Forest in the Kurjańskie Bagno Reserve and showed the presence of 45 species, while 45 years earlier, Sokołowski [54] identified 41 species based on phytosociological records.

4.3. Conditions of Pine Seedling Formation in Marshy Forests

Light is the most important ecological factor that determines the emergence and development of seedlings, as well as undergrowth formation. The amount of light inside the stand is determined by its species composition, structure, and canopy. Another important factor is the shrub layer, which can effectively inhibit the inflow of light to the inside of the stand, and thus limit the growth and development of seedlings [55]. Similar results were obtained in our study, where a negative effect of the layer a (stand) coverage on the number of pine seedlings was observed. This indicated that there was not enough light under the stand canopy to sustain proper growth of pine trees. One-year-old seedlings of this species need at least 10% light to survive [56]. Older seedlings and undergrowth require as much as 35% of full light in order to develop properly [57].
For comparison, appropriate lighting for silver fir, i.e., a shade species, in the seedlings phase amounts to 10–33%, while the optimal lighting ranges from 15% to 25%. The minimum light for fir seedlings ranges from 1.7% to 2.7% [58]. Messier et al. [59] explained the growing demand for light with age by the increasing ratio of nonassimilating to assimilating tissues with tree size. The larger the trees, the more light they need for positive net photosynthesis. Therefore, if growing shoots do not receive increasing amounts of light, as is observed with the removal of the upper stand layer, it will result in their dieback. Their photosynthesis is then not sufficient to produce enough carbohydrates to maintain their vital functions and nonassimilation organs that are constantly increasing in size. This was confirmed by the Gil et al. [60], who indicated that pine could survive several years in a dense stand. However, the transition to subsequent developmental stages is only possible as a result of improved light conditions. This occurred after exposing cutting. In marshy forests, where no maintenance treatments are possible, the improvement of light conditions is only possible in the terminal phase of the stand. Then, the natural secretion of trees from the upper layer will begin.
Increasing the amount of light in a stand not only promotes seedling development but can also contribute to the growth of herbaceous vegetation. Natural regeneration of pine trees is facilitated by the cover of bryophytes or cowberry and bryophytes, which is characteristic of poor pine habitats [17]. Among herbaceous plants, Dicranum scoparium (L.) Hedw., Leucobryum glaucum [61], Vaccinium vitis-idaea L. [62], and Deschampsia flexuosa L. [63] were demonstrated to exert a positive effect on pine regeneration. Many studies indicated that the presence of herbaceous vegetation creates competition for the natural regeneration of pine trees. Depending on the habitat, these plant layers include such species as Vaccinium myrtillus [17], and tall grasses such as Calamagrostis sp. or Deschampsia caespitosa [64]. In our study, the presence of Ledum palustre and Melampyrum pratense had a negative effect on pine regeneration, while the occurrence of Rhododendron tomentosum, Vaccinium oxycoccos L., and spruce exerted a positive effect on this process. The total density of forest floor plants seemed to be more important than the impact of individual species, as it showed a negative effect on the natural pine regeneration.
The negative correlation of the number of seedlings with the cover of the a (stand) and c (herbaceous vegetation) layer indicated that a high stand density and development of living forest vegetation inhibit the growth of pine trees. Therefore, when the natural separation of trees from the upper layer begins, providing more light to the forest floor, pine regeneration may be inhibited to a greater extent by the plants. Pine, however, is a fast-growing species in its youth, reaching a height of 1 m at the age of 5 years, and 3 m at the age of 11 years [21]. Therefore, it seems highly probable that pine will be able to quickly recover from the negative effects of living forest plants.

5. Conclusions

The current study found that the condition of marshy forests in eastern Poland is satisfactory. The vegetation of the living forest was typical for this habitat and the values of ecological indices allowed the conclusion to be made that the spontaneous regeneration processes of herbaceous plants were occurring. However, the significant presence of dry habitat species could indicate the beginning of habitat drainage. This theory was confirmed by a relatively low value of the humidity index. The genetic variability of pine trees was moderate, similar to other provenances of the species. This demonstrated the potentially good adaptability of pine in this habitat. Nevertheless, the number of pine regenerations was very low, which may raise concerns about the further sustainability of marshy forests. Too little light inside the stand and high density of undergrowth plants were the factors influencing pine regeneration. The stands that covered the marshy forest habitat were characterized by high density, which resulted in insufficient light penetration to the forest floor necessary for the growth and development of the young generation of pine trees. However, shading did not suppress the growth of living forest vegetation. It seemed that more light could reach the bottom of the forest after the transition to the terminal phase, when the trees are released from the upper layer. This in turn would create better conditions for the growth and development of pine seedlings, which, as a fast-growing species, would emerge in a short time from the layer of herbaceous plants. Moreover, the presence of pine in the shrub layer at a coverage from 0.01 to 7.27 led to the conclusion that the survival of seedlings in the marshy forests is possible and may lead to their transition to subsequent developmental phases. In summary, it can be concluded that maintaining the passive protection in the marshy forest habitat in eastern Poland seems to be fully justified. Only the low value of the humidity index indicated the necessity of further monitoring of the habitat in terms of its drainage. However, due to the occurrence of species from dry habitats, it is necessary to conduct continuous observations for possible changes and, if necessary, to appropriately counteract them.

Author Contributions

Conceptualization, K.M. and D.U.; methodology, K.M. and D.U.; software, K.M.; validation, K.M., D.U. and K.K.; formal analysis, K.M. and D.U.; investigation, K.M. and D.U.; resources, K.M. and D.U.; data curation, K.M.; writing—original draft preparation, K.M.; writing—review and editing, K.K.; visualization, K.M. and D.U.; supervision, K.K. project administration, K.M.; funding acquisition, K.K. All authors have read and agreed to the published version of the manuscript.

Funding

This research was funded by Ministry of Science and Higher Education (RGH/S57).

Institutional Review Board Statement

Not applicable.

Informed Consent Statement

Not applicable.

Data Availability Statement

Not applicable.

Conflicts of Interest

No potential conflict are declared by the authors.

References

  1. European Commission. Bern Convention—The Convention of the Conservation of European Wildlife and Natural Habitats; Council of Europe: Strasbourg, France, 1979. [Google Scholar]
  2. European Commission. Council Directive 92/43/EEC of 21 May 1992 on the Conservation of Natural Habitats of Wild Fauna and Flora; As amended by the Accession Act of Austria, Finland and Sweden 1992; EEC Official Journal L 1, 1.1; European Commission: Brussels, Belgium, 1995; p. 135. [Google Scholar]
  3. Interpretation Manual of European Union Habitats; Version EUR 28; European Commission: Brussels, Belgium, 2013.
  4. 10 Messages for 2010 Climate Change and Biodiversity; European Environment Agency: Copenhagen, Denmark, 2010.
  5. Goddess, C.M.; Palutikof, J.P.; Davies, T.D. A First Approach to Assessing Future Climate States in the UK over Very Long Timescales: Input to Studies of the Integrity of Radioactive Waste Repositories. Clim. Chang. 1990, 16, 115–139. [Google Scholar] [CrossRef]
  6. Jaime, L.; Batllori, E.; Margalef-Marrase, J.; Pérez Navarro, M.Á.; Lloret, F. Scots Pine (Pinus sylvestris L.) Mortality Is Explained by the Climatic Suitability of Both Host Tree and Bark Beetle Populations. For. Ecol. Manag. 2019, 448, 119–129. [Google Scholar] [CrossRef]
  7. Van Halder, I.; Castagneyrol, B.; Ordóñez, C.; Bravo, F.; del Río, M.; Perrot, L.; Jactel, H. Tree Diversity Reduces Pine Infestation by Mistletoe. For. Ecol. Manag. 2019, 449, 117470. [Google Scholar] [CrossRef]
  8. Paluch, R. Gospodarka lesna na siedliskach silnie wilgotnych i bagiennych. Leśne Pr. Badaw. 2006, 2, 115–121. [Google Scholar]
  9. Savva, Y.; Oleksyn, J.; Reich, P.B.; Tjoelker, M.G.; Vaganov, E.A.; Modrzynski, J. Interannual Growth Response of Norway Spruce to Climate along an Altitudinal Gradient in the Tatra Mountains, Poland. Trees 2006, 20, 735–746. [Google Scholar] [CrossRef]
  10. Pfadenhauer, J.; Grootjans, A. Wetland Restoration in Central Europe: Aims and Methods. Appl. Veg. Sci. 1999, 2, 95–106. [Google Scholar] [CrossRef] [Green Version]
  11. Diaci, J.; Györek, N.; Gliha, J.; Nagel, T.A. Response of Quercus robur L. Seedlings to North-South Asymmetry of Light within Gaps in Floodplain Forests of Slovenia. Ann. For. Sci. 2008, 65, 105. [Google Scholar] [CrossRef]
  12. Vizoso-Arribe, O.; Díaz-Maroto, I.; Vila-Lameiro, P.; Díaz-Maroto, M. Influence of the Canopy in the Natural Regeneration of Quercus robur in NW Spain. Biologia 2014, 69, 1678–1684. [Google Scholar] [CrossRef]
  13. Fussi, B.; Westergren, M.; Aravanopoulos, F.; Baier, R.; Kavaliauskas, D.; Finzgar, D.; Alizoti, P.; Bozic, G.; Avramidou, E.; Konnert, M.; et al. Forest Genetic Monitoring: An Overview of Concepts and Definitions. Environ. Monit. Assess. 2016, 188, 493. [Google Scholar] [CrossRef] [Green Version]
  14. Bragazza, L.; Gerdol, R. Are Nutrient Availability and Acidity-Alkalinity Gradients Related in Sphagnum-Dominated Peatlands? J. Veg. Sci. 2002, 13, 473–482. [Google Scholar] [CrossRef]
  15. Nygaard, P.; Ødegaard, T. Sixty Years of Vegetation Dynamics in South Boreal Coniferous Forest in Southern Norway. J. Veg. Sci. 2009, 10, 5–16. [Google Scholar] [CrossRef]
  16. Czerepko, J. Długookresowe zmiany roślinności w zespole sosnowego boru bagiennego Vaccinio uliginosi-Pinetum Kleist 1929. Leśne Pr. Badaw. 2011, 72, 21–29. [Google Scholar]
  17. Gmyz, R.; Skrzyszewski, J. Wpływ zróżnicowania mikrosiedliskowego boru świeżego na liczebność odnowienia naturalnego sosny zwyczajnej (Pinus sylvestris L.). Sylwan 2010, 154, 173–181. [Google Scholar]
  18. Sewerniak, P.; Gonet, S.S.; Quaium, M. Wpływ przygotowania gleby frezem leśnym na wzrost sadzonek sosny zwyczajnej w warunkach ubogich siedlisk Puszczy Bydgoskiej. Sylwan 2012, 156, 871–880. [Google Scholar]
  19. Dobrowolska, D. Warunki powstawania odnowien naturalnych sosny zwyczajnej (Pinus sylvestris L.) na terenie Nadlesnictwa Tuszyma. Leśne Pr. Badaw. 2010, 71, 217–224. [Google Scholar]
  20. Pigan, I. Odnowienie naturalne sosny (Pinus sylvestris L.) na siedliskach wilgotnych przy zastosowaniu różnych metod przygotowania gleby. Sylwan 2010, 154, 524–534. [Google Scholar]
  21. Jaworski, A. Hodowla Lasu. Tom 1. Sposoby Zagospodarowania, Odnawianie Lasu, Przebudowa i Przemiana Drzewostanów; PWRiL: Warsaw, Poland, 2011. [Google Scholar]
  22. Stat Soft, Inc. Statistica (Data Analysis Software System). Version 13.1. 2011. Available online: http://www.statsoft.com (accessed on 25 January 2022).
  23. Braun-Blanquet, J. Pflanzensoziologie; Springer: Wien, Vienna; New York, NY, USA, 1964. [Google Scholar]
  24. Matuszkiewicz, W. Przewodnik do Oznaczania Zbiorowisk Roślinnych Polski; PWN: Warsaw, Poland, 2008. [Google Scholar]
  25. Mirek, Z.; Piękoś-Mirkowa, H.; Zając, A.; Zając, M. Flowering Plants and Pteridophytes of Poland: A Checklist; W. Szafer Institute of Botany; Polish Academy of Sciences: Cracow, Poland, 2002. [Google Scholar]
  26. Ochyra, R.; Żarnowiec, J.; Bednarek-Ochyra, H. Census Catalogue of Polish Mosses. Biodiversity of Poland; IB PAN: Cracow, Poland, 2003. [Google Scholar]
  27. Rogers, S.O.; Bendich, A.J. Extraction of DNA from plant tissue. In Plant Molecular Biology Mannual; Glevin, S.B., Schilperoort, R.A., Eds.; Kluwer Academic Publishers: Boston, MA, USA, 1988; pp. 1–10. [Google Scholar]
  28. Bergmann, F.; Gregorius, H.R. Comparison of the genetic diversities of various populations of Norway spruce (Picea abies). In Proceedings of the Conference: Biochemical Genetics of Forest Trees, Umea, Sweden, 1978; Rudin, F., Ed.; Swedish University of Agricultural Sciences: Uppsala, Sweden, 1979; pp. 99–107. [Google Scholar]
  29. Nei, M.; Roychoudhury, A.K. Sampling Variances of Heterozygosity and Genetic Distance. Genetics 1974, 76, 379–390. [Google Scholar] [CrossRef]
  30. Mantel, N. The detection of disease clustering and a generalized regression approach. Cancer Res. 1967, 27, 209–220. [Google Scholar]
  31. Yeh, F.C.; Yang, R.; Boyle, T. Popgene Version 1.31. Microsoft Windows–Based for Population Genetic Analysis; University of Alberta, Departament of Renewable Resources: Edmonton, AB, Canada, 1999. [Google Scholar]
  32. Peakall, R.; Smouse, P.E. Genalex 6: Genetic Analysis in Excel. Population Genetic Software for Teaching and Research. Mol. Ecol. Notes 2006, 6, 288–295. [Google Scholar] [CrossRef]
  33. Pritchard, J.K.; Stephens, M.; Donnelly, P. Inference of Population Structure Using Multilocus Genotype Data. Genetics 2000, 155, 945–959. [Google Scholar] [CrossRef]
  34. Evanno, G.; Regnaut, S.; Goudet, J. Detecting the Number of Clusters of Individuals Using the Software STRUCTURE: A Simulation Study. Mol. Ecol. 2005, 14, 2611–2620. [Google Scholar] [CrossRef] [PubMed] [Green Version]
  35. Earl, D.A.; von Holdt, B.M. STRUCTURE HARVESTER: A Website and Program for Visualizing STRUCTURE Output and Implementing the Evanno Method. Conserv. Genet. Resour. 2012, 4, 359–361. [Google Scholar] [CrossRef]
  36. Jakobsson, M.; Rosenberg, N.A. CLUMPP: A Cluster Matching and Permutation Program for Dealing with Label Switching and Multimodality in Analysis of Population Structure. Bioinformatics 2007, 23, 1801–1806. [Google Scholar] [CrossRef] [PubMed] [Green Version]
  37. Rosenberg, N.A. Distruct: A Program for the Graphical Display of Population Structure. Mol. Ecol. Notes 2004, 4, 137–138. [Google Scholar] [CrossRef]
  38. CILP. Zasady Hodowli Lasu; CILP: Warszaw, Poland, 2012. [Google Scholar]
  39. Modrý, M.; Hubený, D.; Rejšek, K. Differential Response of Naturally Regenerated European Shade Tolerant Tree Species to Soil Type and Light Availability. For. Ecol. Manag. 2004, 188, 185–195. [Google Scholar] [CrossRef]
  40. Li, H.-Y.; Jing, J.; Liu, G.-F.; Ma, X.-J.; Dong, J.-X.; Jie, S.-J. Genetic Variation and Division of Pinus sylvestris Provenances by ISSR Markers. J. For. Res. 2008, 16, 216–218. [Google Scholar] [CrossRef]
  41. Vidyakin, A.I.; Boronnikiva, S.V.; Nechayeva, Y.S.; Nechayeva, Y.S.; Prysimivskaya, Y.V.; Boboshina, I.V. Genetic Variation, Population Structure and Differentiation in Scots Pine (Pinus sylvestris L.) from the Northeast of the Russian Plain as Inferred from the Molecular Genetic Analysis Data. Genetika 2015, 51, 1401–1409. [Google Scholar] [CrossRef]
  42. Androsiuk, P.; Urbaniak, L. Genetic variability of Pinus sylvestris populations from IUFRO 1982 provenance trial. Dendrobiology 2014, 71, 23–33. [Google Scholar] [CrossRef] [Green Version]
  43. Cipriano, J.; Carvalho, A.; Fernandes, C.; Gaspar, M.J.; Pires, J.; Bento, J.; Roxo, L.; Louzada, J.; Lima-Brito, J. Evaluation of genetic diversity of Portugese Pinus sylvestris L. populations based on molecular data and inferences about the future use of this germplasm. J. Genet. 2013, 92 (Suppl. S2), 41–48. [Google Scholar] [CrossRef]
  44. Li, C.; Chai, B.; Wang, M. Population Genetic Structure of Pinus tabulaeformis in Shanxi Plateau, China. Russ. J. Ecol. 2008, 39, 34–40. [Google Scholar] [CrossRef]
  45. Rubio-Moraga, A.; Candel-Perez, D.; Lucas-Borja, M.E.; Tiscar, P.A.; Viñegla, B.; Linares, J.C.; Gómez-Gómez, L.; Ahrazem, O. Genetic Diversity of Pinus nigra Arn. Populations in Southern Spain and Northern Morocco Revealed by Inter-Simple Sequence Repeat Profiles. Int. J. Mol. Sci. 2012, 13, 5645–5658. [Google Scholar] [CrossRef] [PubMed] [Green Version]
  46. Phong, D.T.; Lieu, T.T.; Hien, V.T.T.; Hiep, N.T. Genetic Diversity of the Endemic Flat-Needle Pine Pinus krempfii (Pinaceae) from Vietnam Revealed by SSR Markers. Genet. Mol. Res. 2015, 14, 7727–7739. [Google Scholar] [CrossRef]
  47. Masternak, K.; Banach, J.; Głębocka, K.; Wajdzik, M. Genetic Variability in Pitch Pine (Pinus rigida Mill.) Growing in the Niepołomice Forest as Determined by ISSR Markers. Acta Soc. Bot. Pol. 2018, 87, 3953. [Google Scholar] [CrossRef]
  48. Nowakowska, J. Genetic diversity of Scots pine (Pinus sylvestris L.) Polish provenances based on RAPD analysis. Sylwan 2003, 11, 26–37. [Google Scholar]
  49. Wachowiak, W. Genetic relationships between Polish and reference populations of Scots pine (Pinus sylvestris L.) in Europe based on nucleotide polymorphism study at nuclear loci. Sylwan 2015, 159, 26–37. [Google Scholar]
  50. Roo-Zielińska, E. Fitoindykacja Jako Narzędzie Oceny Środowiska Fizycznogeograficznego. Podstawy Teoretyczne i Analiza Porównawcza Stosowanych Metod; Prace Geograficzne: Warsaw, Poland, 2004. [Google Scholar]
  51. Van der Maarei, E. Relations between Sociological-Ecological Species Groups and Ellenberg Indicator Values. Phytocoenologia 1993, 23, 343–362. [Google Scholar] [CrossRef]
  52. Zarzycki, K.; Trzcińska-Tacik, H.; Różański, W.; Szeląg, Z.; Wołek, J.; Korzeniak, U. Ecological Indicator Values of Vascular Plants of Poland; W. Szafer Institute of Botany; Polish Academy of Sciences: Cracow, Poland, 2001. [Google Scholar]
  53. Matuszkiewicz, J.M. Zespoły Leśne Polski; PWN: Warsaw, Poland, 2001. [Google Scholar]
  54. Sokołowski, A.W. Zespoły Leśne Nadleśnictwa Balinka w Puszczy Augustowskiej. Monogr. Bot. 1969, 27, 3–79. [Google Scholar]
  55. Dobrowolska, D. Struktura drzewostanu glownego jako czynnik ksztaltujacy warunki swietlne w odnowieniu naturalnym jodly pospolitej [Abies alba Mill.]. Pr. Inst. Badaw. Leśnictwa Ser. A 1998, 843–851, 173–188. [Google Scholar]
  56. Obmiński, Z. Zarys ekologii. In Sosna Zwyczajna. Nasze Drzewa Leśne; Białobok, S., Ed.; PWN: Warsaw, Poland, 1970; pp. 152–231. [Google Scholar]
  57. Hale, S.E.; Edwards, C.; Mason, W.L.; Price, M.; Peace, A. Relationships between Canopy Transmittance and Stand Parameters in Sitka Spruce and Scots Pine Stands in Britain. For. Int. J. For. Res. 2009, 82, 503–513. [Google Scholar] [CrossRef] [Green Version]
  58. Jaworski, A.; Zarzycki, K. Ekologia. In Jodła Pospolita Abies alba Mill. Nasze Drzewa Leśne; Białobok, S., Ed.; PWN: Warsaw, Poland; Poznan, Poland, 1983; pp. 317–430. [Google Scholar]
  59. Messier, C.; Doucet, R.; Ruel, J.-C.; Claveau, Y.; Kelly, C.; Lechowicz, M.J. Functional ecology of advance regeneration in relations to light in boreal forest. Can. J. For. Res. 1999, 29, 812–823. [Google Scholar] [CrossRef]
  60. Gil, W.; Kopryk, W.; Zachara, T. Growth dynamice of Scots pine natural regeneration under the shelter of the stand in Polish lowland—A case study Ostrów Mazowiecka. Folia For. Pol. Ser. A For. 2004, 26, 21–28. [Google Scholar]
  61. Zerbe, S.; Schmidt, I.; Betzin, J. Indicators for plant species richness in pine (Pinus sylvestris L.) forests of Germany. Biodivers. Conserv. 2007, 16, 3301–3316. [Google Scholar] [CrossRef]
  62. Tomczyk, S. Inicjowanie oraz wprowadzanie samosiewów sosnowych. Las Pol. 1989, 3, 16–17. [Google Scholar]
  63. Lust, N.; Geuden, G.; Olsthoorn, A.F.M. Scots pine in Belgium and the Netherlands. For. Syst. 2000, 9 (Suppl. S1), 213–231. [Google Scholar]
  64. Karlsson, M.; Nilsson, U. The Effects of Scarification and Shelterwood Treatments on Naturally Regenerated Seedlings in Southern Sweden. For. Ecol. Manag. 2005, 205, 183–197. [Google Scholar] [CrossRef]
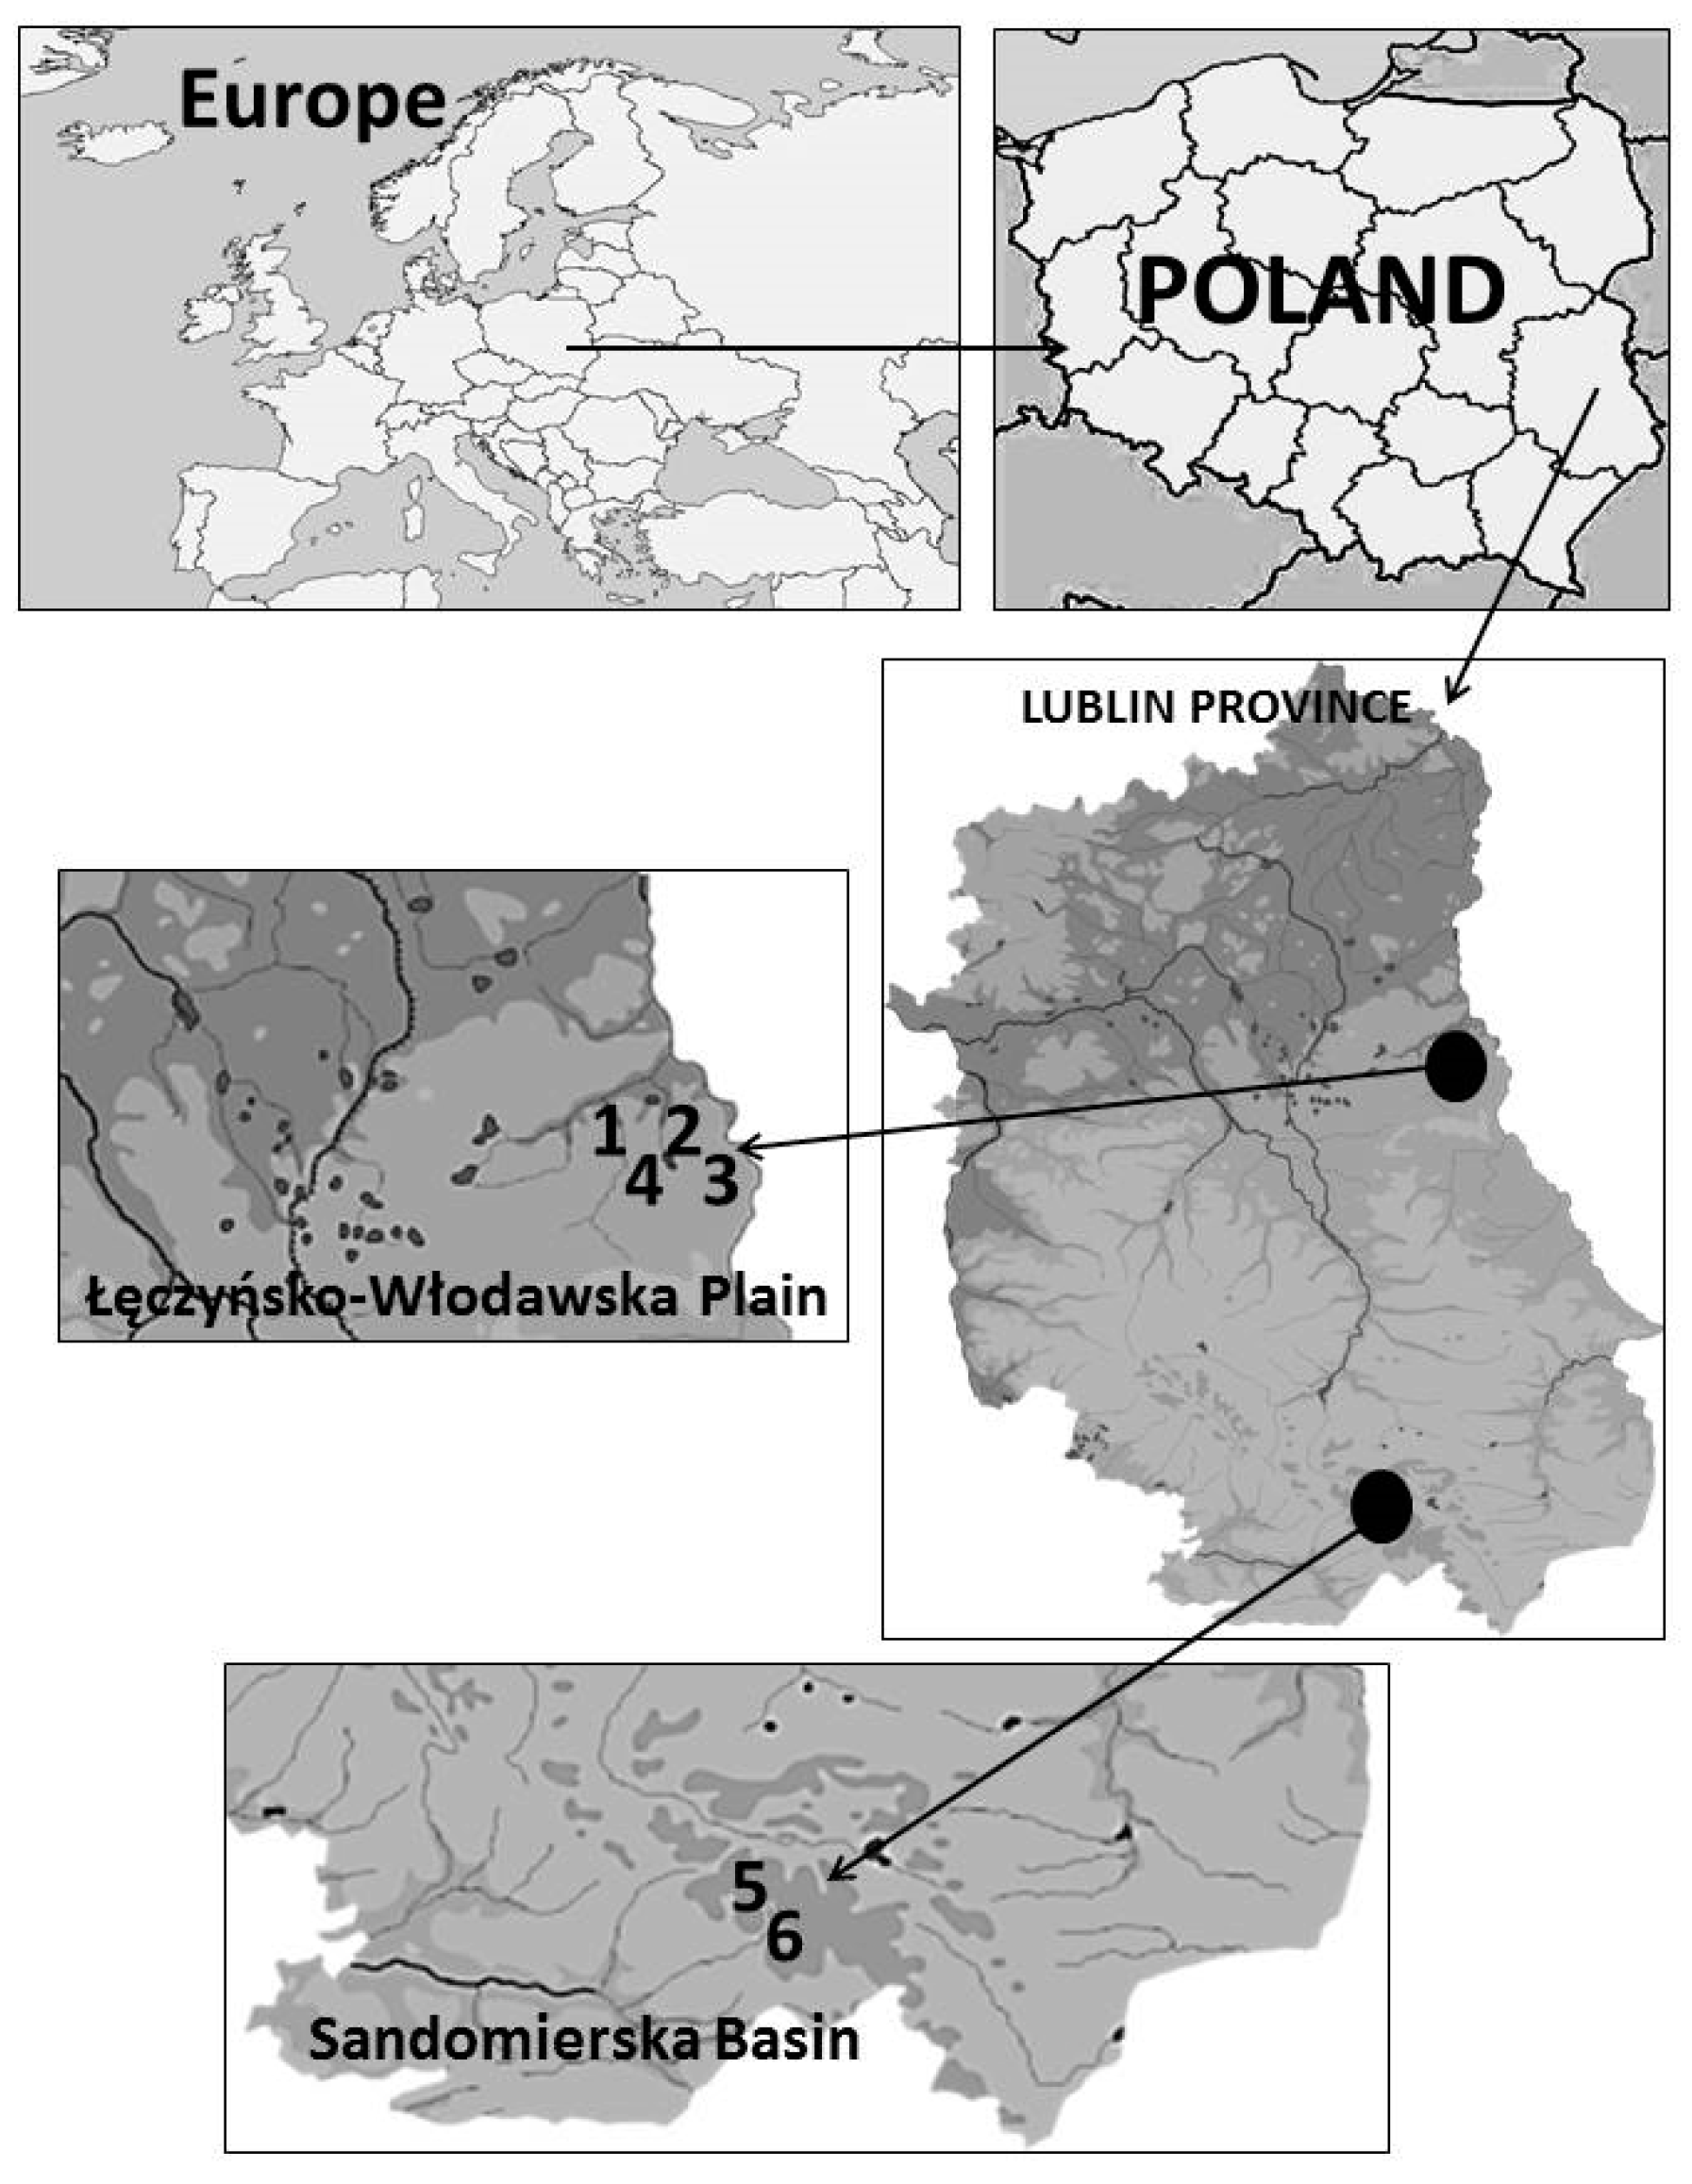
Figure 1. Location of the examined stands (population names: 1—Osowa 1; 2—Osowa 2; 3—Wołczyny; 4—Dubeczno; 5—Józefów 1; 6—Józefów 2).
Sustainability 14 05387 g001
Figure 2. Results of PCoA analysis based on genetic distance.
Sustainability 14 05387 g002
Figure 3. Graphical image of STRUCTURE analysis.
Sustainability 14 05387 g003
Figure 4. Average values of the light index (a), percentage of species (vascular plants and bryophytes) with different light requirements (b), and the legends to the Ellenberg ecological index number (c).
Sustainability 14 05387 g004
Figure 5. Average values of the humidity index (a), percentage of species (vascular plants and bryophytes) with different humidity requirements (b), and the legends to the Ellenberg ecological index number (c).
Sustainability 14 05387 g005
Figure 6. Average values of the nitrogen content index (a), percentage of species (vascular plants and bryophytes) with different nitrogen content requirements (b), and the legends to the Ellenberg ecological index number (c).
Sustainability 14 05387 g006
Table 1. Average parameter of traits of pine trees natural regeneration; homogeneous groups were determined by the Tukey test for p = 0.05.
StandMean Height (cm)Total NumberNumber of Regeneration
Young SeedlingsOlder SeedlingsUnderwood
Osowa 156.83± e46 b41923
Osowa 228.97 c37 b18118
Dubeczno45.16 d49 b281110
Wołczyny3.80 a277 a277--
Józefów 116.43 b163 a114454
Józefów 214.17 b34 b2671
Test F (significance level)72.1796 (p < 0.001)20.8499 (p < 0.001)---
a–e—homogeneous groups.
Table 2. Values of genetic variability parameters of pine regeneration in marshy forests in eastern Poland.
StandP%NaNeHeI
Osowa 164.711.4901.3380.2000.304
Osowa 263.401.4441.3510.2050.310
Dubeczno56.861.3011.3510.2020.301
Wołczyny58.821.3791.3430.1990.299
Józefów 166.671.5161.3590.2070.312
Józefów 252.291.2751.3290.1880.279
Mean60.461.4011.3450.2000.301
Table 3. Molecular analysis of variance.
SourcedfSSMSEst. Var.%
Among populations5607.77121.5547.68625%
Within populations721629.10222.62622.62675%
Total772236.872 30.312100%
Table 4. Percentage of area coverage by individual species.
StandOsowa 1Osowa 2DubecznoWołczynyJózefów 1Józefów 2
a and b layer:
Pinus sylvestris a52.4761.557.5175.060.062.5
Pinus sylvestris b7.276.550.140.010.030.52
Pinus sylvestris c0.10.070.10.10.10.09
Betula pubescens a1.535.51-0.021.76-
Betula pubescens b1.032.031.980.081.550.46
Betula pubescens c0.040.040.040.070.03-
Frangula alnus b0.020.02--1.060.03
Frangula alnus c0.020.010.010.030.040.02
Quercus robur b-0.010.010.030.01-
Quercus robur c-0.010.070.020.010.01
Quercus rubra b-0.04----
Quercus rubra c-0.01----
Padus serotina b-0.01----
Sorbus aucuparia b----0.01-
Sorbus aucuparia c--0.01---
Salix cinerea b----0.54-
Picea excelsa b--0.01-1.57-
Picea excelsa c----1.420.02
Abies alba c-----0.02
ChAss. Vaccinio uliginosi-Pinetum:
Ledum palustre65.567.539.7534.265.026.25
Vaccinium uliginosum28.7622.0135.25-48.040.5
Vaccinio-Piceetea:
Vaccinium myrtillus7.5324.256.512.7630.7539.0
Pleurozium schreberi7.548.01.7513.7612.7521.25
Vaccinium vitis-idaea5.514.52.25-0.053.27
Dicranum polysetum7.5116.0-1.53--
Leucobryum glaucum0.52.26--0.01-
Hylocomium splendes1.7510.0----
Melampyrum pratense-0.02----
Oxycocco-Sphagnetea:
Eriophorum vaginatum24.762.7716.2522.7524.2525.5
Andromeda polifolia2.260.014.548.510.161.54
Oxycoccus palustris15.0-24.7524.0127.7521.0
Sphagnum fuscum19.757.26-14.75--
Sphagnum magellanicum27.05.555.553.58.010.25
Polytrichum strictum0.5-12.06.7517.017.25
Sphagnum fallax32.249.7525.318.558.057.5
Sphagnum rubellum1.755.75----
Aulacomium palustre-0.020.525.03--
Other:
Calluna vulgaris0.550.022.023.51.06.77
Molinia caerulea0.520.52--4.032.77
Carex rostrata----0.540.55
Eriophorum angustifolium----0.01-
Juncusef fusus--- 0.51-
Layer of: (a) trees, (b) shrubs, (c) herbaceous plants.
Table 5. Spearman’s correlation coefficients between density, undergrowth species, and the number of pine seedlings.
Species and LayerOsowa 1Osowa 2DubecznoWołczynyJózefów 1Józefów 2Średnio Dla Borów Bagiennych
A layer−0.53720.1928−0.1424−0.2444−0.046−0.2659−0.3318 **
Pinus sylvestris−0.8777 ***−0.5303−0.1542−0.2444−0.1762-−0.4169
B layer0.4712−0.1397−0.1335−0.1841−0.1441−0.3491−0.2162
Pinus sylvestris0.54220.2296−0.1092−0.46560.7306 *−0.2747−0.2748
C layer-0.18040.3172−0.4202−0.1762−0.4610−0.3732 **
Eriophorum vaginatum0.7893 **0.2082−0.25470.24810.36620.28950.3729 **
Andromeda polifolia0.7193 *−0.41240.2251−0.2773−0.50550.48070.2164
Picea abies--−0.0591-−0.1904-0.3016 *
Ledum palustre−0.38730.3310−0.19360.17950.4595−0.1262−0.3016 *
Melampyrum pratense-−0.6187----−0.3014 *
Oxycoccus palustris0.1645-−0.12210.3025−0.0912−0.14600.3082 *
D layer0.7193 *0.1317−0.1215−0.1993-−0.2289−0.1804
Pleurozium schreberi−0.1767−0.8879 ***0.5319−0.31370.5763−0.4744−0.1832
Polytrichum strictum−0.1767-0.6605 *−0.028−0.35330.16020.2392
Significance at the level * 0.05, ** 0.01, *** 0.001.
Publisher’s Note: MDPI stays neutral with regard to jurisdictional claims in published maps and institutional affiliations.