Article

Public Expenses and Investment in Environmental Protection and Its Impact on Waste Management

by
Eva Mihaliková
1,
Marcela Taušová
2,* and
Katarína Čulková
2
1
Department of Economics and Management of Public Administration, Faculty of Public Administration, Pavol Jozef Šafárik University in Košice, 040 01 Košice, Slovakia
2
Department of Earth Resources, Faculty BERG, Technical University Košice, 042 00 Košice, Slovakia
*
Author to whom correspondence should be addressed.
Sustainability 2022, 14(9), 5270; https://doi.org/10.3390/su14095270
Submission received: 8 March 2022 / Revised: 7 April 2022 / Accepted: 13 April 2022 / Published: 27 April 2022
(This article belongs to the Section Environmental Sustainability and Applications)

Abstract

:
The growing environmental problems with a global impact on the quality of the environment require increasing attention from all countries and the urgent adoption and implementation of established measures to protect the environment. The presented contribution points to the necessity of financial resources in the process of improving the environment. It aims to analyze public expenditures and investments spent on the environment in the European Union and the Slovak Republic, and to identify the main environmental areas to which funds flow. The aim is to assess the effectiveness of the funds spent in relation to selected indicators focused on waste management. After the analysis of the state and development of public expenditures and investments and the analysis of the methods of municipal waste management, the contribution results in the search for dependence between public expenditures and the materially and energetically recovered amount of municipal waste.

1. Introduction

The environment and its protection are a globally discussed and solution-seeking topic. The environment is considered to be everything that creates the natural conditions necessary for the existence of organisms; therefore, a clean environment is also a prerequisite for human health and well-being, as well as for the safe and healthy existence of all organisms [1].
Ensuring the sustainable development of our planet and its existence for future generations is the basis of the visions formulated in strategic documents and action plans at the national and supranational levels. The EU’s goal is to live in accordance with the planet’s ecological limits in 2050. The 2030 Agenda for Sustainable Development is a current document that seeks to build on the Millennium Development Goals and complete what the goals have not achieved. Its basic idea is to protect the planet from degradation, including sustainable consumption and production, and to ensure that all human beings can enjoy prosperous and fulfilling lives and that economic, social, and technological progress is in harmony with nature [2].
The pillar of the implementation of Agenda 2030 in the EU is the 8th Environmental Action Program, which is a plan for people, the planet, and prosperity. The pillar stresses the need to improve the implementation of European environmental legislation, increase awareness and communication with the public, ensure the systemic nature of Europe’s climate and environmental challenges, as well as the need to accelerate the transition to a resource-efficient, safe and sustainable economy; production and consumption. Sustainable product policy can make a significant contribution to reducing waste. Where waste generation cannot be avoided, its economic value should be exploited and its impact on the environment should be eliminated or at least minimized [3].
These facts need to be addressed at a global level, as the amount of waste is constantly increasing and waste is thus becoming one of the most pressing problems of human existence. This is also indicated in the World Bank’s forecast, which estimates that global waste production will increase to 2.58 billion tons by 2030, and 3.40 billion tons by 2050, which presents more than double the growth of the population over the same period (www.datatopics.worldbank.org/what-a-waste/trends_in_solid_waste_management.html, accessed on 8 March 2022). A rapid increase in waste is expected in low-income countries, where the waste will increase more than triple by 2050, mainly in East and South Asia and Sub-Saharan Africa. It should be noted that in these countries, more than half of the waste is currently landfilled and the growth of waste will have huge consequences for the environment, health, and prosperity. Mainly solid waste arising from construction activities is a grave concern in many economies, with heavy regulations by authorities. Vivian and Tam (2013) tried to evaluate new policies based on the latest waste management philosophies available (e.g., the reduce, reuse, and recycle principle, and the polluter pays principle) having an effective impact on the sustainable development of the living environment [4]. Environmental policies are on the agenda of almost all countries of the world, connected with modern innovative technologies, used in the area of waste treatment; however, not all countries and communities give the same priority to environmental policy [5].
In order for the human environment to become sustainable in the long run, it is necessary to change not only our behavior but also our environment. This means a change in almost every area—our cities, our countries, connecting infrastructures, especially in the reciprocal relationship between cities and the hinterland, culture, and nature [6]. According to Cimen, the 2021 construction industry has problems adopting the principles of the circular economy [7]. The transition from a linear economy to a circular economy is not possible until the principles of the circular economy are applied in the life cycle stages of buildings, which is a proactive approach to the design of building management from cradle to cradle. Resources are being depleted without any effective material recovery program [8].
The European Union is also paying close attention to the issue of waste since from 2012 to 2018, there was a 6.34% increase in waste in the EU. Although municipal waste does not account for a large proportion of waste in many countries, it is the most difficult to manage due to its diversity. It is supported also by a number of results in the literature when various authors deal with the municipal waste importance from the view of their investments and impacts on society. Such research has been done, for example, by Ladaru et al. (2019) determining the influence that investments in waste recovery have on the quantity of waste [9]. The authors found the situation in Romania when investment in waste reduction influenced the waste volume. Huang et al. (2014) considered an investment in food waste recycling in China, finding a willingness to make a financial investment [10]. Agaton et al. (2020) propose an investment model to analyze the economic feasibility of waste-to-energy projects in developing countries using the Philippines, comparing the energy production from the waste with investment costs [11]. According to the comparison, the authors found the possibility to support sustainability and energy security through such projects. Abdallah et al. (2018) explored the financial feasibility of alternative waste management strategies in the United Arab Emirates, based on revenue and cost flow and financial parameters, finding such strategies are profitable [12]. The investment in waste-to-energy technologies results from the application of Directive 2008/98/CE on Municipal Solid Waste. Fernandez-Gonzalez et al. (2017) studied the economic costs of such investment in comparison with environmental costs [13], while Banacu et al. (2019) developed a relationship between various economic indicators, such as business expenditure, gross domestic product, resource productivity, and environmental taxes on municipal waste recycling, finding the indicators have a direct and significant impact on the municipal waste recycling [14]. Busu (2019) presented the economic factors (human capital, productivity of resources, green energy use), and found the circular economy is determined by resource productivity, demanding new investments [15]. The cost of the municipal solid waste is studied by Callan and Thomas (2001) finding the relationship between recycling and disposal activity [16]. According to Da Cruz et al. (2012), there is still a lack of evidence regarding the actual costs of recycling [17]. The authors compared the financial transfers of the waste company with the costs incurred by the local authorities. Grant (2019) suggests investment in E-waste activities as a strategic green economic opportunity [18]. Peng-Fei et al. (2016) pointed to the investments in the municipal domestic organic waste treatment for conditions in China as a comprehensive treatment technology, having rapid development when the analysis is made not only from the investment but also operation cost [19]. A similar techno-economic study is from Athanasiu et al. (2015) for single municipal solid waste mass, providing highly efficient technology [20]. The analysis presented in the research of Jakubiak (2014) shows the municipal waste collection system and main installations for waste management and processing [21]. The governments are responsible for protecting the public from hazards created by the waste [22]; moreover, representatives of the municipalities must undertake an evaluation of the cost-benefit of waste management [23]. The regulations, however, are likely to hike the costs of legal disposal by increasing the demand for disposal sites, while at the same time reducing the supply. Hazardous waste, in particular, has been subject to detailed and costly regulations since the early 1980s, when a legislative response has a list of problems, needed to adjust a regulatory framework, expanding to the ecological risks legislation and environmental regulations [24].

2. Present State of Problem Solving

In accordance with the Agency 2030 for sustainable development, Slovakia uses the strategic documents. Slovakia, as well as other member EU states, is trying to maintain and observe long-term competitiveness and to provide sustainable development in accord with all environmental aspects.
Sustainability is a central pillar of strategic documents Vision and strategy of the Slovakian development to 2030—long-term strategy of sustainable development (Slovakia 2030). The document is a basic implementation document for filling the national priorities Agency 2030 and the European green agreement in Slovakia. At the same time, it reflects the actual program EU documents, which arise in connection with the beginning of the new program period EU 2021–2027. In the document the emphasis is given to the protection of the living environment, strategic planning, and sustainable development, the balance of the priorities with the development potential of the regions and industries development, based on green transformation and high value-added, automatization, market services, digital economy, innovation, and research and development [25].
Protection of the living environment is in detail elaborated in the strategic document of the Ministry of Living Environment—Strategy of environmental policy of Slovakia to 2030 [26]. The document is developed on the basic vision of Slovakia, based on the achievement of a better quality of the living environment and providing of sustainable circular economy, using fewer not renewable natural resources and dangerous elements that could lead to the improvement of the inhabitants’ health. Enviro-strategy 2030 identifies the most important environmental problems of Slovakia, determines goals for 2030, suggests frame measurements for improving the present situation, and forms basic resulting indicators. According to the international comparable indicators, Slovakia backslides behind developed countries from the view of waste treatment and air quality. Therefore, the problem belongs to the waste economy in the frame of Slovakia to prioritized areas; moreover, data, presenting significant growth of the total waste production in Slovakia during the analyzed period show increase yet by 46.15%, and communal waste increased by 35.29%. Figure 1 illustrates the development of communal waste production in the EU in the long-term horizon.
It shows that in the production of municipal waste, there is a certain slowdown in production growth, increasing by 403.8 thousand tons every year. In the analysis of the last 10 years, there is even a decrease in the production of municipal waste in the EU28 by 382.2 thousand tons. The EU strives to minimize the production of municipal waste, reduce its landfill as much as possible, and, conversely, increase recycling in all member states. Figure 2 shows the development of indicators expressing the different ways of municipal waste management in the EU.
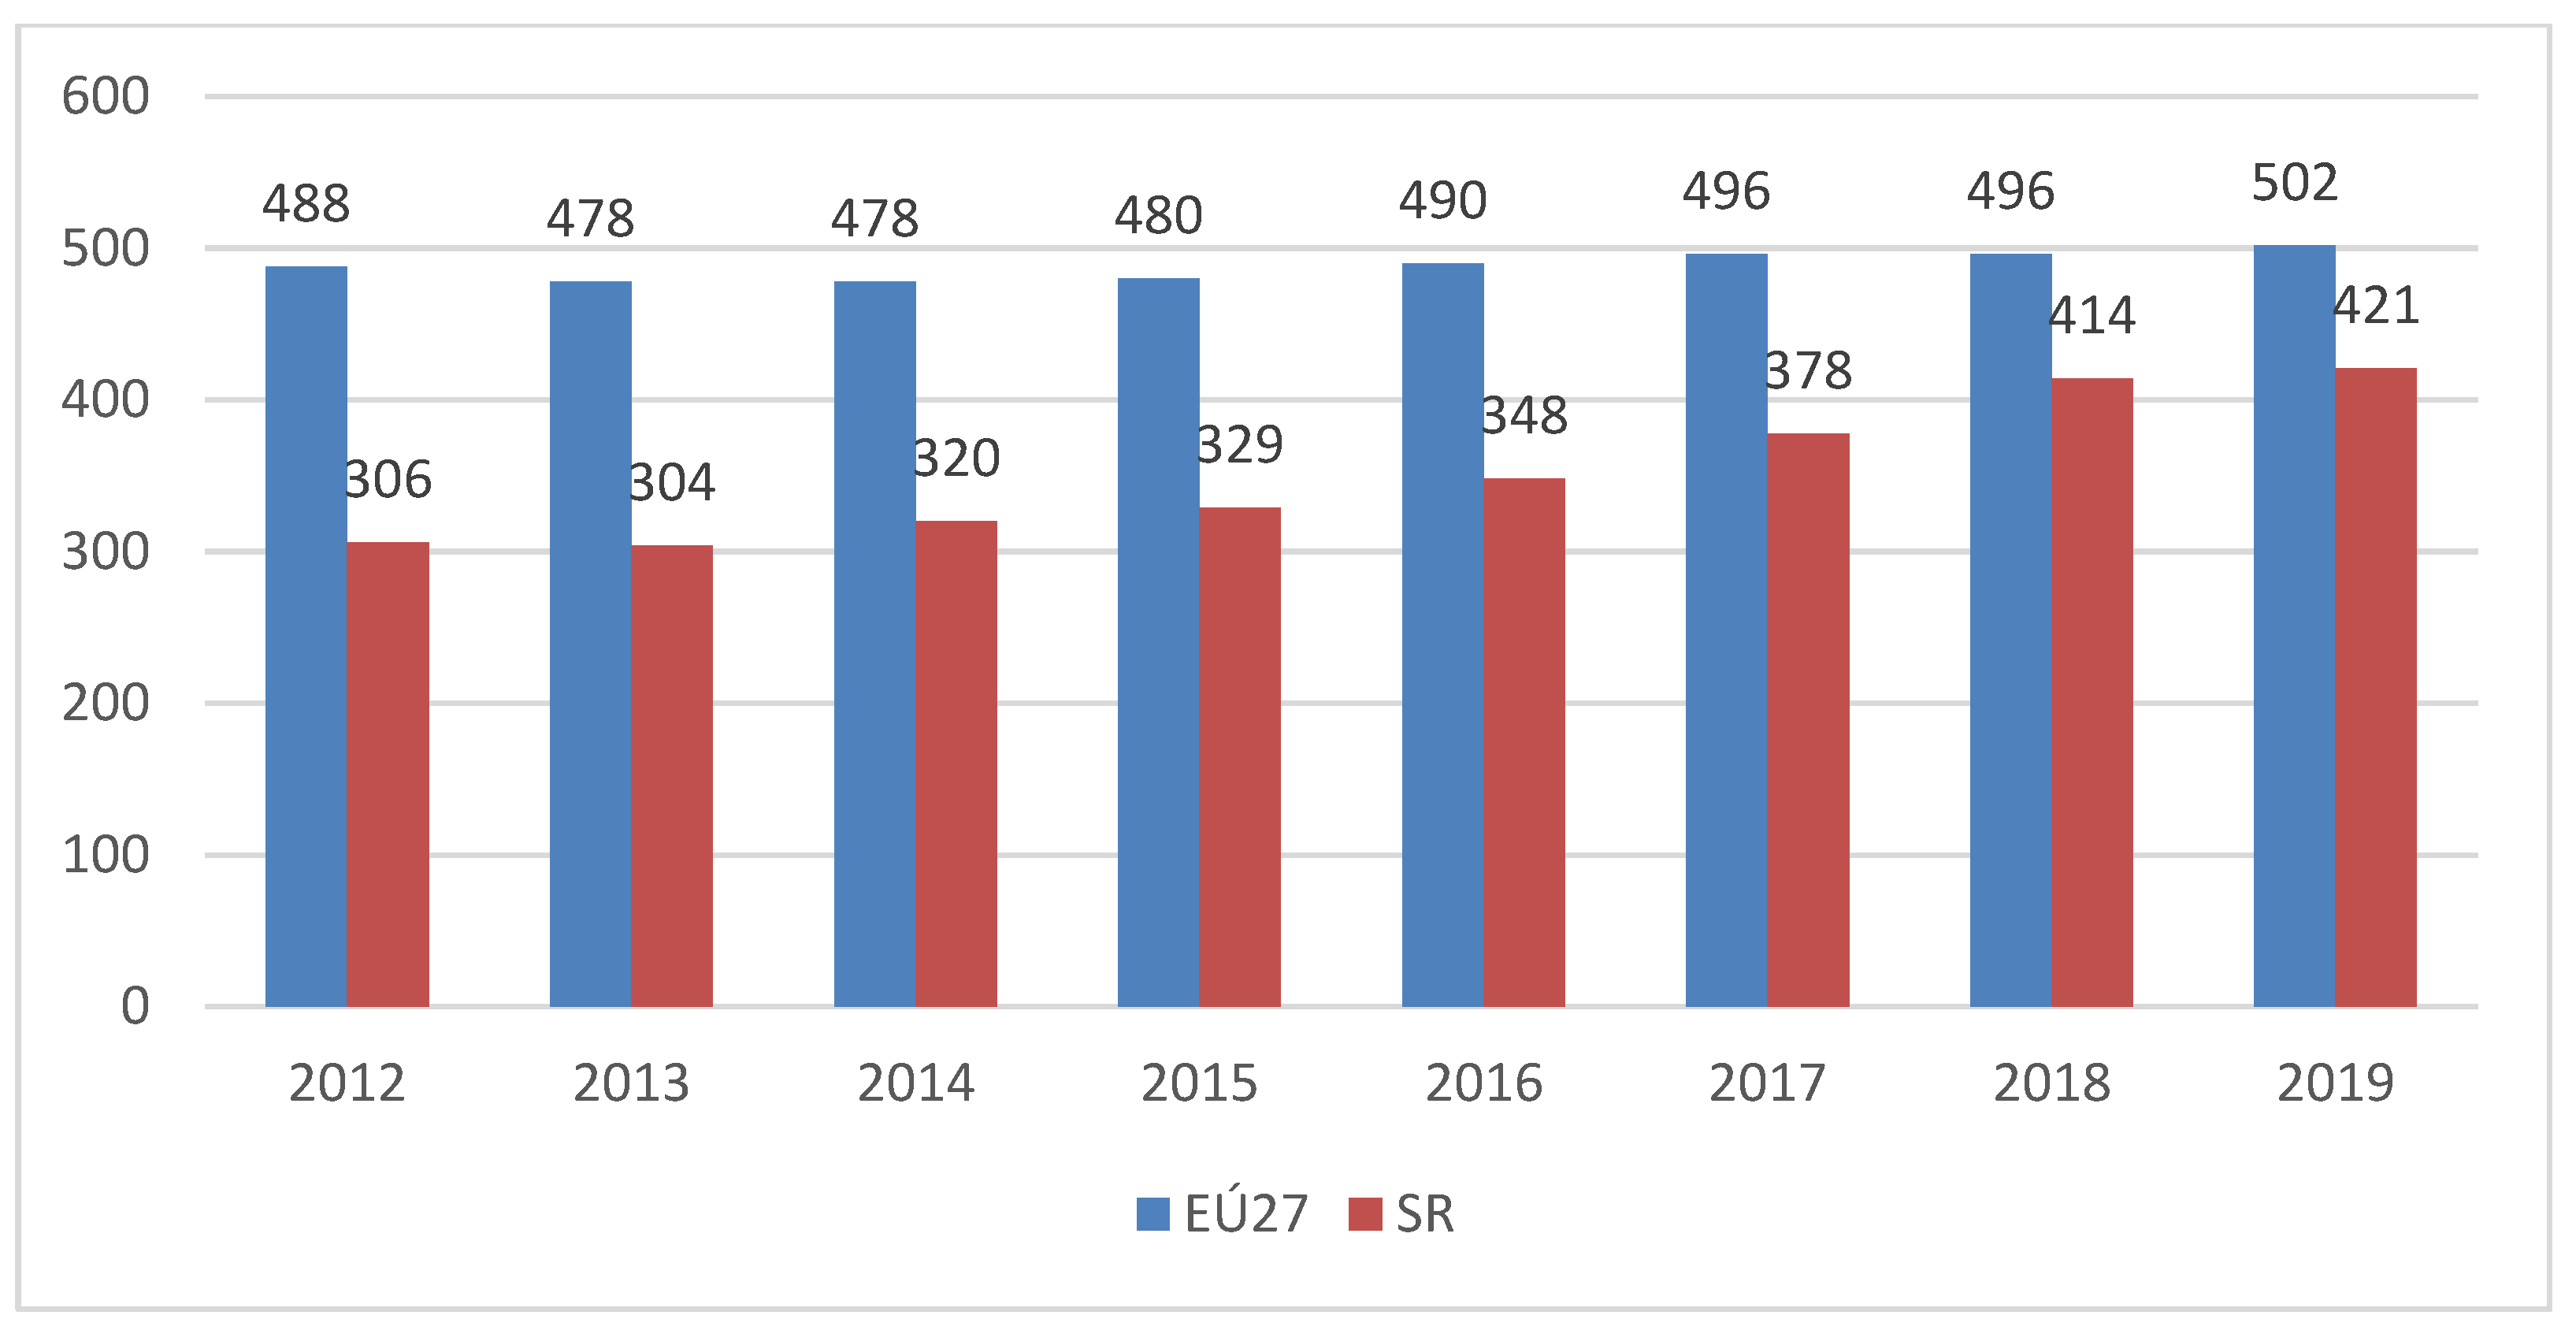
It can be positively assessed that the volume of landfilled municipal waste decreases most significantly in the EU-28 by 4348 thousand tons, while the volume of municipal waste that is recovered is increasing. Recycling of municipal waste increased by 1205 thousand tons in composting and by 2122 thousand tons in material recovery. There is also an increase in energy recovery and incineration of municipal waste by 1846 thousand tons. The following section focuses on the state of municipal waste in the Slovak Republic compared to the EU average (Figure 3). Data are converted per capita.
Except for the communal waste volume per inhabitant, Slovakia backslides behind the EU, from the view of other important indicators additionally. Table 1 mentions the measure of stocking and the measure of communal waste recycling.
Data in Table 1 illustrate a high measure of stocking, but still insufficient, although a growing measure of communal waste recycling in Slovakia. As any member state, also Slovakia must observe the frame of environmental policy EU documents and recommendations. The basic documents of waste economy, in which EU measurements are implemented, belong to the “Program of waste economy in Slovakia for 2021–2025” and “Program for waste arise avoiding in Slovakia for 2019–2025”. The goal is to increase the measure of waste recovery with orientation to the preparation of repeated use and recycling and support of waste arise avoiding. Mentioned programs result from the waste economy hierarchy, defined in the Decree of European Parliament and European Council 2008/98/ES about waste and Action Plan of EU for the circular economy. Part of the action plan for a circular economy is an elaborated frame decree of the waste No 2018/851.
It sets out measures to address the adverse effects of waste production and management on the environment and human health and measures to improve resource efficiency, which is important in the transition to a circular economy (Understanding the Framework Directive). The EU’s common goal is to reduce the landfill rate to less than 10% by 2035 and to increase the volume of recycled municipal waste to 65% by 2035. EU policy also sets specific targets for waste collection. Article 20 of the Waste Framework Directive states the need to ensure by the end of 2023 that bio-waste is sorted or recycled at the source (e.g., by composting) and to set up a separate collection for textiles and household hazardous waste by 1 January 2025. The legislative measures also include a 30 percent reduction in food waste by 2025 and a 50 percent reduction by 2030.
Financial support for environmental activities and stimulating the development of a green economy are also essential in meeting the formulated objectives of the EU’s waste policy. The importance of the economic tools in the area of living environment protection is emphasized by Helm (2005) showing financial help should have a temporary character with a goal to orientate the living environment in “the proper way” [27]. Tax incentives or subsidies must be generated for those firms in which their production has been achieved through CE and generate public-private alliances to open local and international markets to commercialize these products. In the same way, incentives must be generated in consumers to direct their choice of consumption to the goods that come from a production process through CE [28].
The European Union, as well as its Member States, devotes a number of resources to achieve environmental goals. According to Mlynárová and Ščerb (2017), expenditures arising from the implementation of environmental activities by the public sector are referred to as environmental public expenditures [29]. Environmental expenditure can also be understood, i.e., more generally as an economic resource for all activities and measures aimed at preventing, reducing, and eliminating environmental pollution [30]. In allocating public expenditure to the environment, Eurostat uses the following classification of general government expenditure:
  • waste economy;
  • treatment with wastewater;
  • decreasing pollution;
  • protection of the nature and the country;
  • research and development in the area of living environment protection;
  • protection of the living environment not classified.
According to Bishop (2013), public environmental expenditure can be understood in a narrower sense as public expenditure to be incurred by the competent authorities responsible for environmental protection [31]. Alternatively, in a broader sense, they can be understood as environmental public expenditures to be incurred at all levels of government commonly.
Environmental expenditures present an important factor in developing an effective environmental policy, and it is essential to know their volume and the activities for which they have been used, as well as to monitor and evaluate their development. Mandalová (2012) also states that it is important to evaluate expenditures on environmental protection [32]. Čech (2005) points out that some developed countries spend a large amount of money on environmental protection [33]; however, according to the mentioned reference, it is not the number of funds that matters, but the efficiency of their use, i.e., achieving the maximum possible improvement in the quality of the environment. Public expenses are a tool to influence the economic behavior of various entities.

3. Materials and Methods

The environment can be considered a public good that needs to be decisively financed from public budgets. In the Slovak Republic, on average, more than two-thirds of all expenditures of the Ministry of the Environment and the Environmental Fund come from EU sources, including co-financing. By environmental protection expenditure, we mean funds for all activities related to the prevention, reduction, and elimination of any pollution. The aim of expenditure is to maintain or improve the quality of the environment, or to reduce adverse effects. With the use of these funds (mainly from EU funds) there is increasing investment in environmental infrastructure and this is causing an improvement in the monitored environmental indicators in various areas [34]. Mihaliková and Džuňová point out that effective investment in waste management will reduce the production of mixed waste and increase the amount of separated waste [35]. These can be recycled more efficiently, which will help support the country’s circular economic system.
Due to the mentioned, the paper is based on the need to evaluate environmental protection expenditures, as well as other basic economic indicators. We consider environmental costs spent on reducing and eliminating environmental pollution, as well as on prevention itself. These are expenditures arising from air and climate protection, wastewater management, waste management, soil protection and remediation, groundwater and surface water, noise and vibration reduction, biodiversity and landscape protection, radiation protection, and research and development [36]. According to Romančíková (2011), their monitoring and analysis are helpful due to the evaluation and monitoring of environmental policy itself and from the point of view of ensuring coordination between the policies of individual member states [37]. In addition to the environmental expenditures of the Ministry of the Environment, the Statistical Office of the Slovak Republic [38] also systematically monitors financial indicators of environmental protection for enterprises (with 20 or more employees) and municipalities. The total environmental protection costs (investment and current) and revenues related to the sale of products, devices, components, and technologies intended for environmental protection, the sale of by-products or waste products, and revenues from the provision of environmental protection services to other entities are evaluated.
The base of the paper is to evaluate public expenditures and investment into the living environment in the EU and Slovak Republic, as well as to identify the main environmental areas, to which the financial sources flow. The main goal is to evaluate the effectiveness of the investment in relation to communal waste.
The source of the necessary data for the analysis were data from Eurostat databases, Public Administration Budgets, published by the Ministry of Finance of the Slovak Republic, and statistical databases published by the Statistical Office of the Slovak Republic. In the frame of a single EU analysis, we resulted from the continuously published values of chosen indexes from the portal https://ec.europa.eu/eurostat/data/database (accessed on 8 March 2022) in available years and member states [39]. Collected data had been registered, sorted, and adjusted in the database in MS Excel according to the demand of statistical software JMP, to which adjusted data had been transported and consequently analyzed.
Collected data presents the results of five chosen indexes from 1995 to 2020. The created database consists of 120,780 data and any index is defined for a concrete EU member state in a concrete year. As we can see in Table 2 the range of the published data for individual indexes are significantly different, while the volume of data connects with data incompleteness in the country. The range and structure of the obtained data are adjusted to the analysis and results formulation.
Process of the analysis:
  • Analysis of the Communal Waste:
    -
    Communal Waste production in EU28–trend of the development;
    -
    Treatment with Communal Waste in EU28–trend of development;
    -
    Production of Communal Waste in EU and Slovakia per inhabitant.
  • Analysis of the expenses to the living environment protection:
    -
    Trend of the development in EU28;
    -
    Graphical analysis-cartographer and countries comparison;
    -
    Expenses of the Ministry of Living Environment in Slovakia emphasizing the waste economy.
  • Analysis of the investment in the living environment protection in the EU:
    -
    Comparison of the investment use according to the environmental activities;
    -
    Comparison of the countries according to the investment in the environmental activities-cartographer;
    -
    Investment in the living environment protection in Slovakia emphasizes the waste economy.

4. Results

4.1. Expenses to the Living Environment Protection in the EU

The living environment is the base of life’s existence, the stock of natural sources, as well as the provider of eco-systematic services; still, higher and higher attention is given to its quality and protection. Any country, as well as the whole society, is aware of the importance of the worsening situation in the living environment and the consequences in the future when the situation will not be solved. This is reflected also in the expenses that individual countries invest in the living environment protection and removing the consequences of the climatic change (Figure 4). From the graphical illustration, there is an obvious total EU expense to the living environment protection record increasing trend with annual increase—EUR 5503 mil.
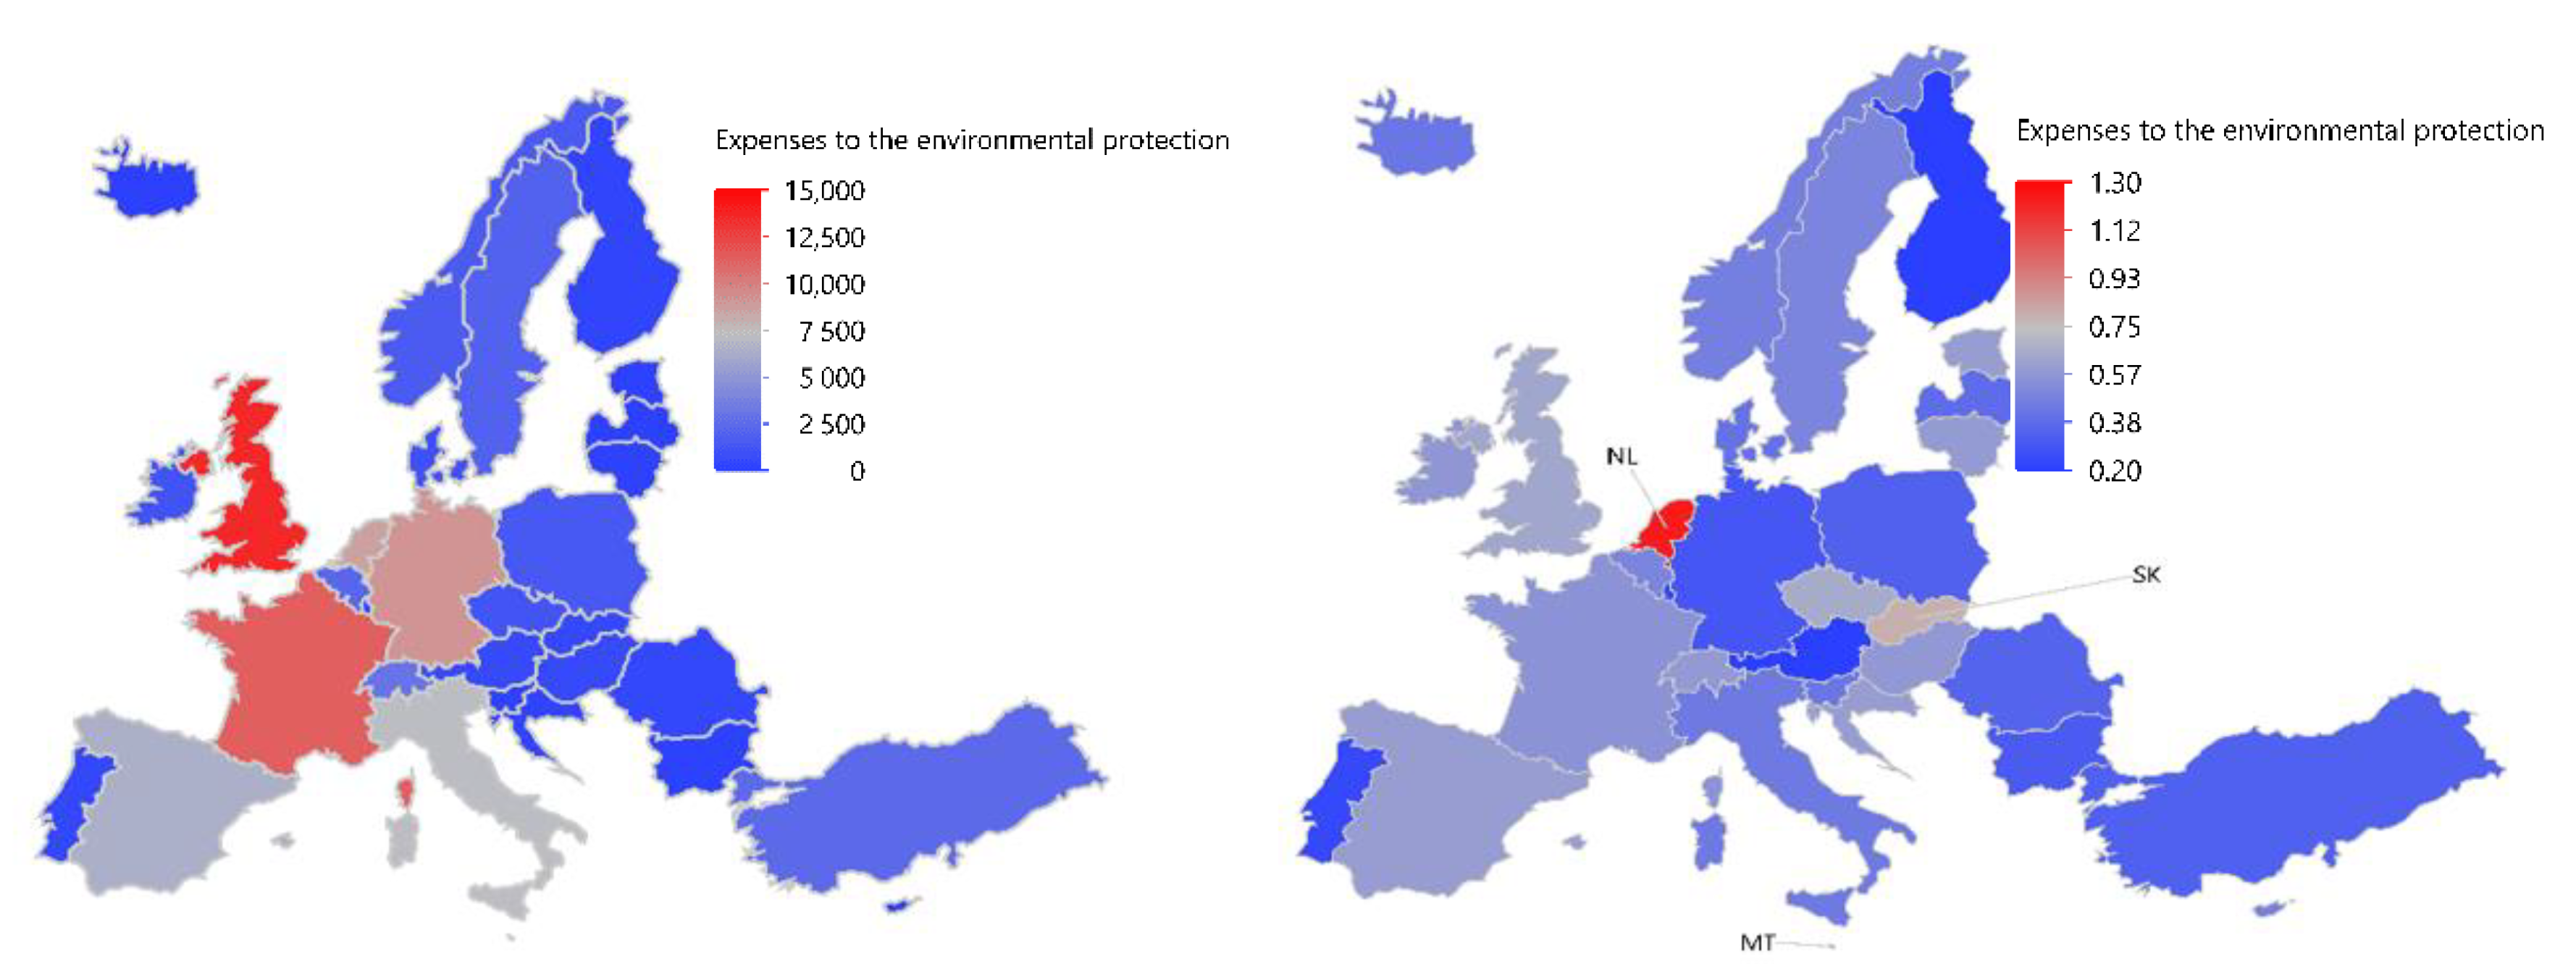
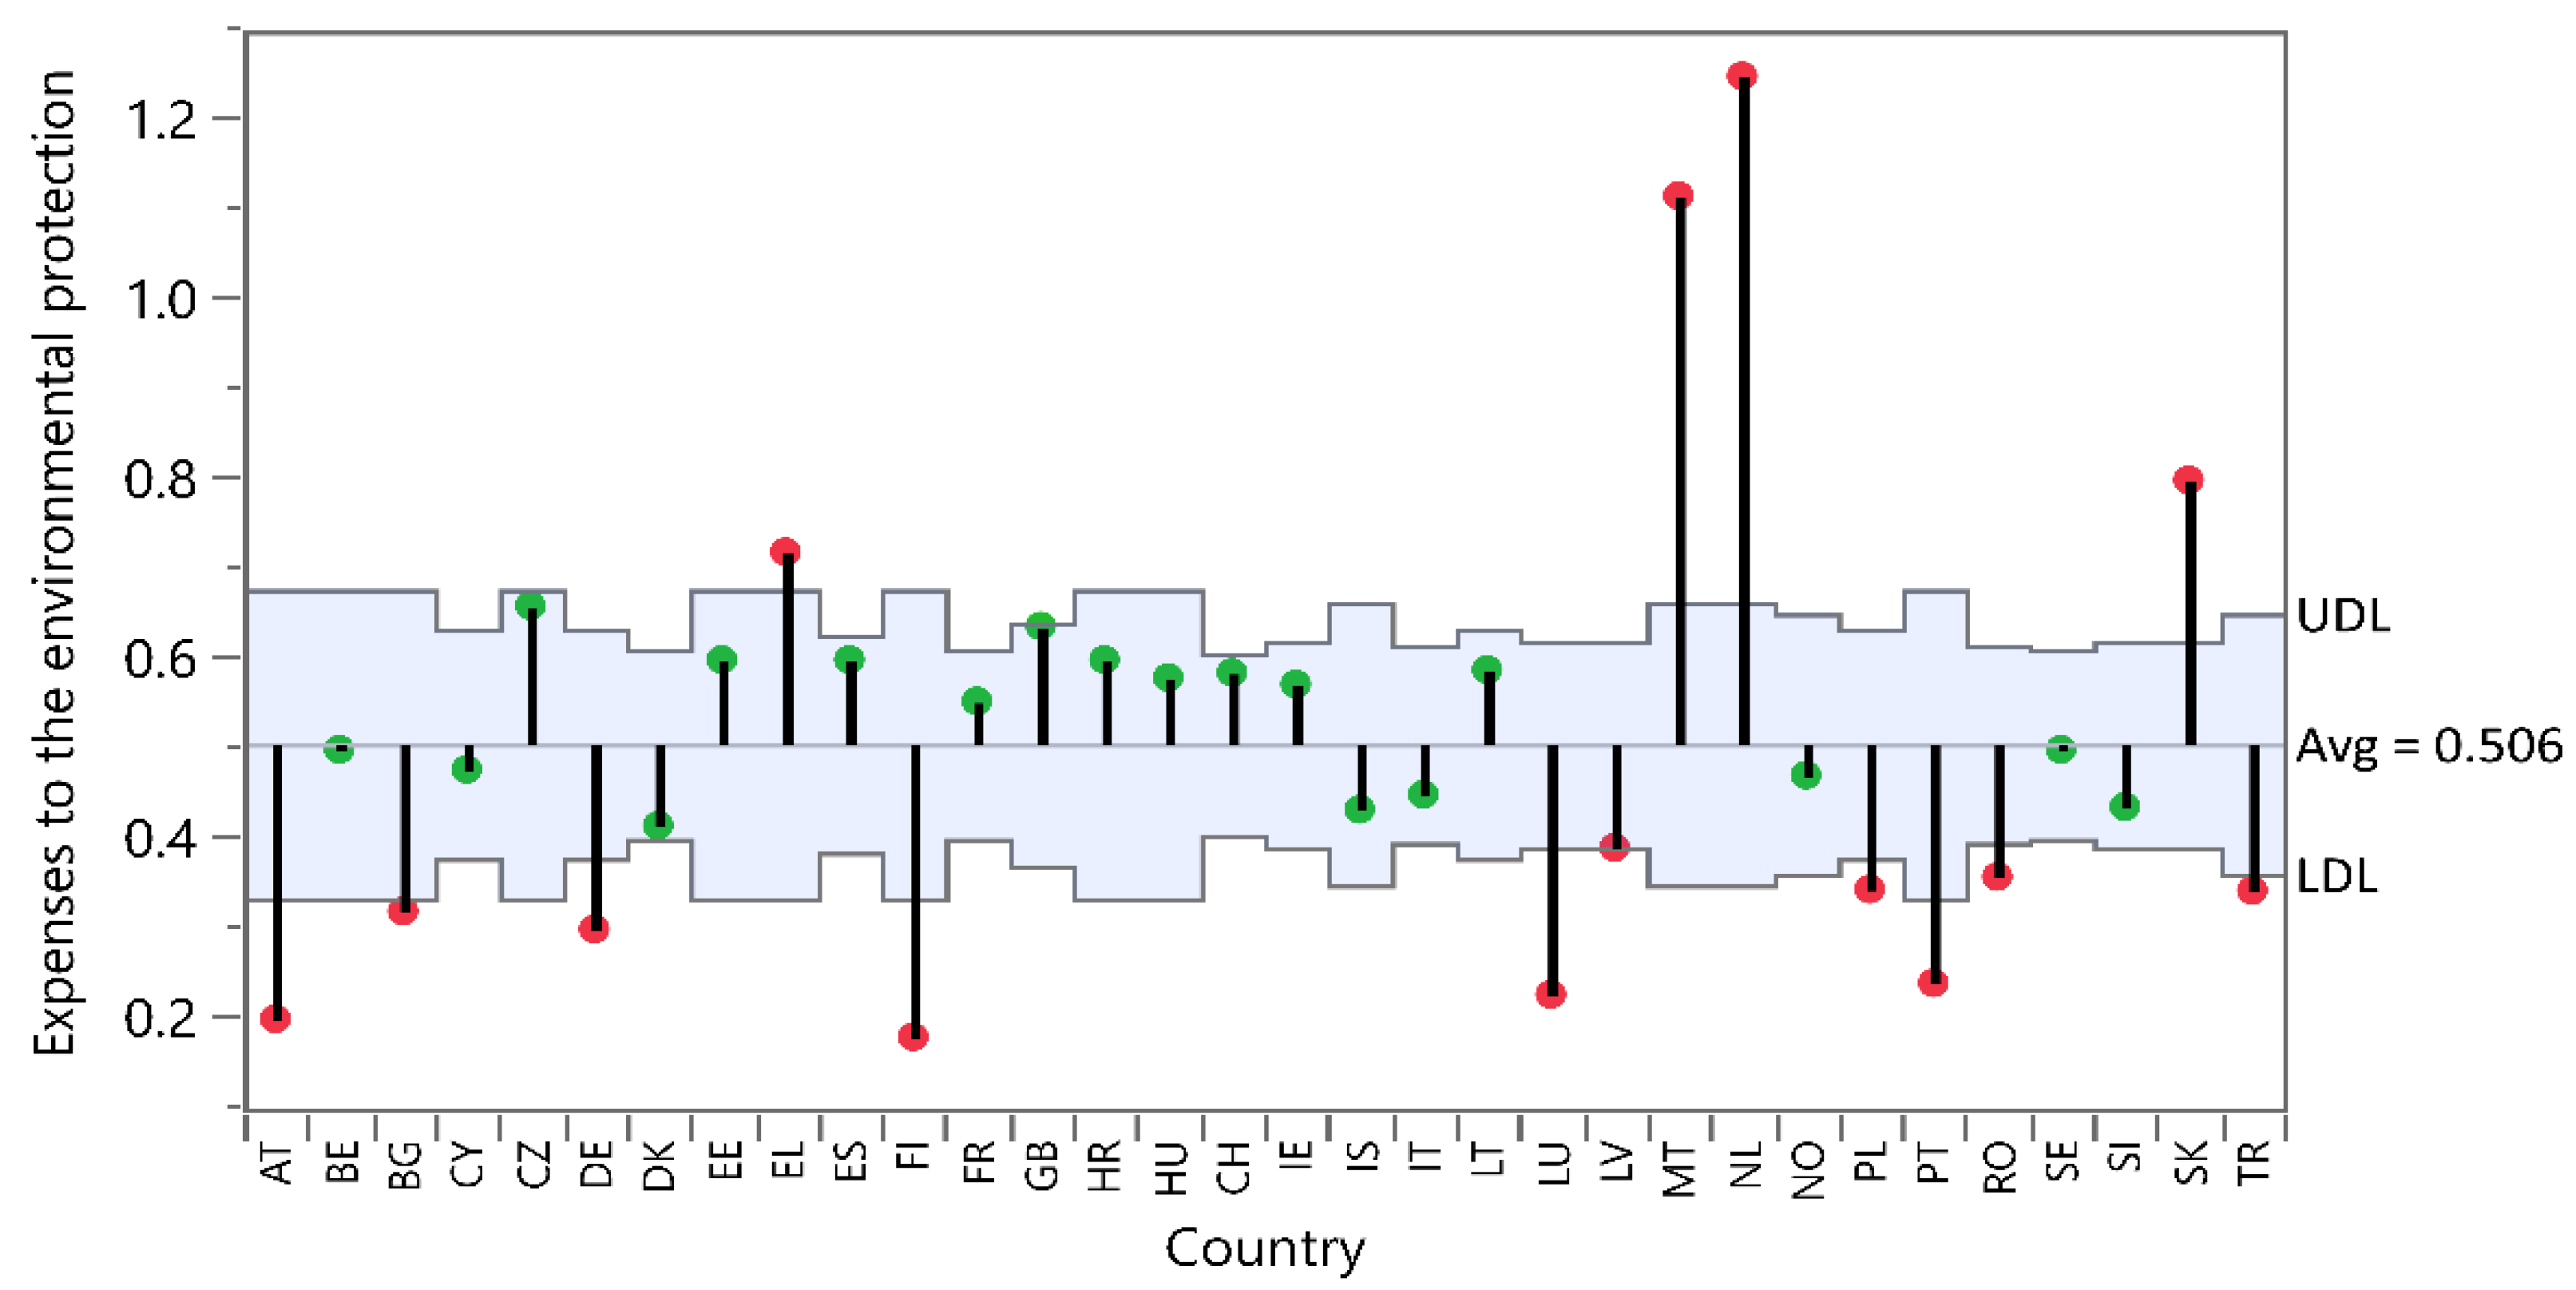
Figure 5 on the left shows a comparison of general government expenditure by country and shows that the United Kingdom, France, Germany, The Netherlands, and Italy have the highest expenditure. By expressing these expenditures in the form of a percentage share of GDP, the leadership of the countries’ changes; the countries with the highest share include, in addition to the Netherlands, Slovakia, and Malta (Figure 5–right, Figure 6).
In the frame of Slovakia, the analyzed data results from the functional classification of the Ministry of Living Environment, which illustrates the situation of the expenses to the individual areas of the living environment (Table 3).
The Ministry of the Environment of the Slovak Republic had budget expenditures on average at the level of approximately 2% in comparison with the state budget expenditures [40]. The lowest expenditures were in 2014 due to the transfer of district environmental offices to the competence of the Ministry of the Interior of the Slovak Republic. This was influenced by the implementation of the measures of the Efficient, Reliable, and Open Public Administration program, which aimed to optimize the costs of functioning of the public administration and simplify the handling of public requirements. The Ministry of the Environment had the highest expenditures in 2015 due to the higher drawing of EU funds, as well as due to the use of unused EU funds from previous years.
Table 3 and Figure 7 show that the expenditures of the Ministry of Environment SR for the analyzed period have a fluctuating character. Most expenditure was directed to water management during the analyzed period. The aim was to minimize the negative results related to the content of pollutants in wastewater and to increase the connectivity of the population to public water supply and sewerage. The funds were used for the construction of wastewater treatment plants (66 treatment plants were built in six years) for the construction of 64 public water mains and for the extension of the sewerage network by 2412 km. This has led to an improvement in the required indicators, although it should be noted that Slovakia still has a below-average level of the population connected to public water supply and sewerage systems within the EU.
The second area with the highest rate of expenditures was waste management, especially in the first four years of the analyzed period. Waste management had the best position in the structure of expenditures in 2012 when the expenditures of the Ministry of the Environment in this area were at the level of 23.4%. Subsequently, the structure of expenditures changed and the percentage of expenditures of this type was mostly at the level of 12–15%. The exceptions are 2016 and 2017, when expenditures fell significantly and ranged only at 3.6 and 2.27%. In terms of value, the highest expenditures were in waste management in 2015 and 2019, as illustrated in Figure 8.
The year 2015 was dominant, not only in total expenses of the Ministry of Environment to the living environment, but also in waste management, where most funds were reinvested in the analyzed period. The funds were drawn mainly from European Union funds (mainly from the EU Structural Funds and the Cohesion Fund), but this year there was the highest transfer of unused EU funds from previous years. The funds went mainly to the completion of the waste management infrastructure, i.e., for waste recycling, closure, and reclamation of landfills and for the overall elimination of negative impacts of environmental burdens (Public Administration Budget of the Slovak Republic).

4.2. Investment in the Living Environment Protection in the EU

Except for public expenses to the living environment, the part of the analysis is also an investment, orientated to the living environment protection in the EU and Slovakia. In the frame of the EU, the investment is structured into the individual categories, illustrated in Figure 9.
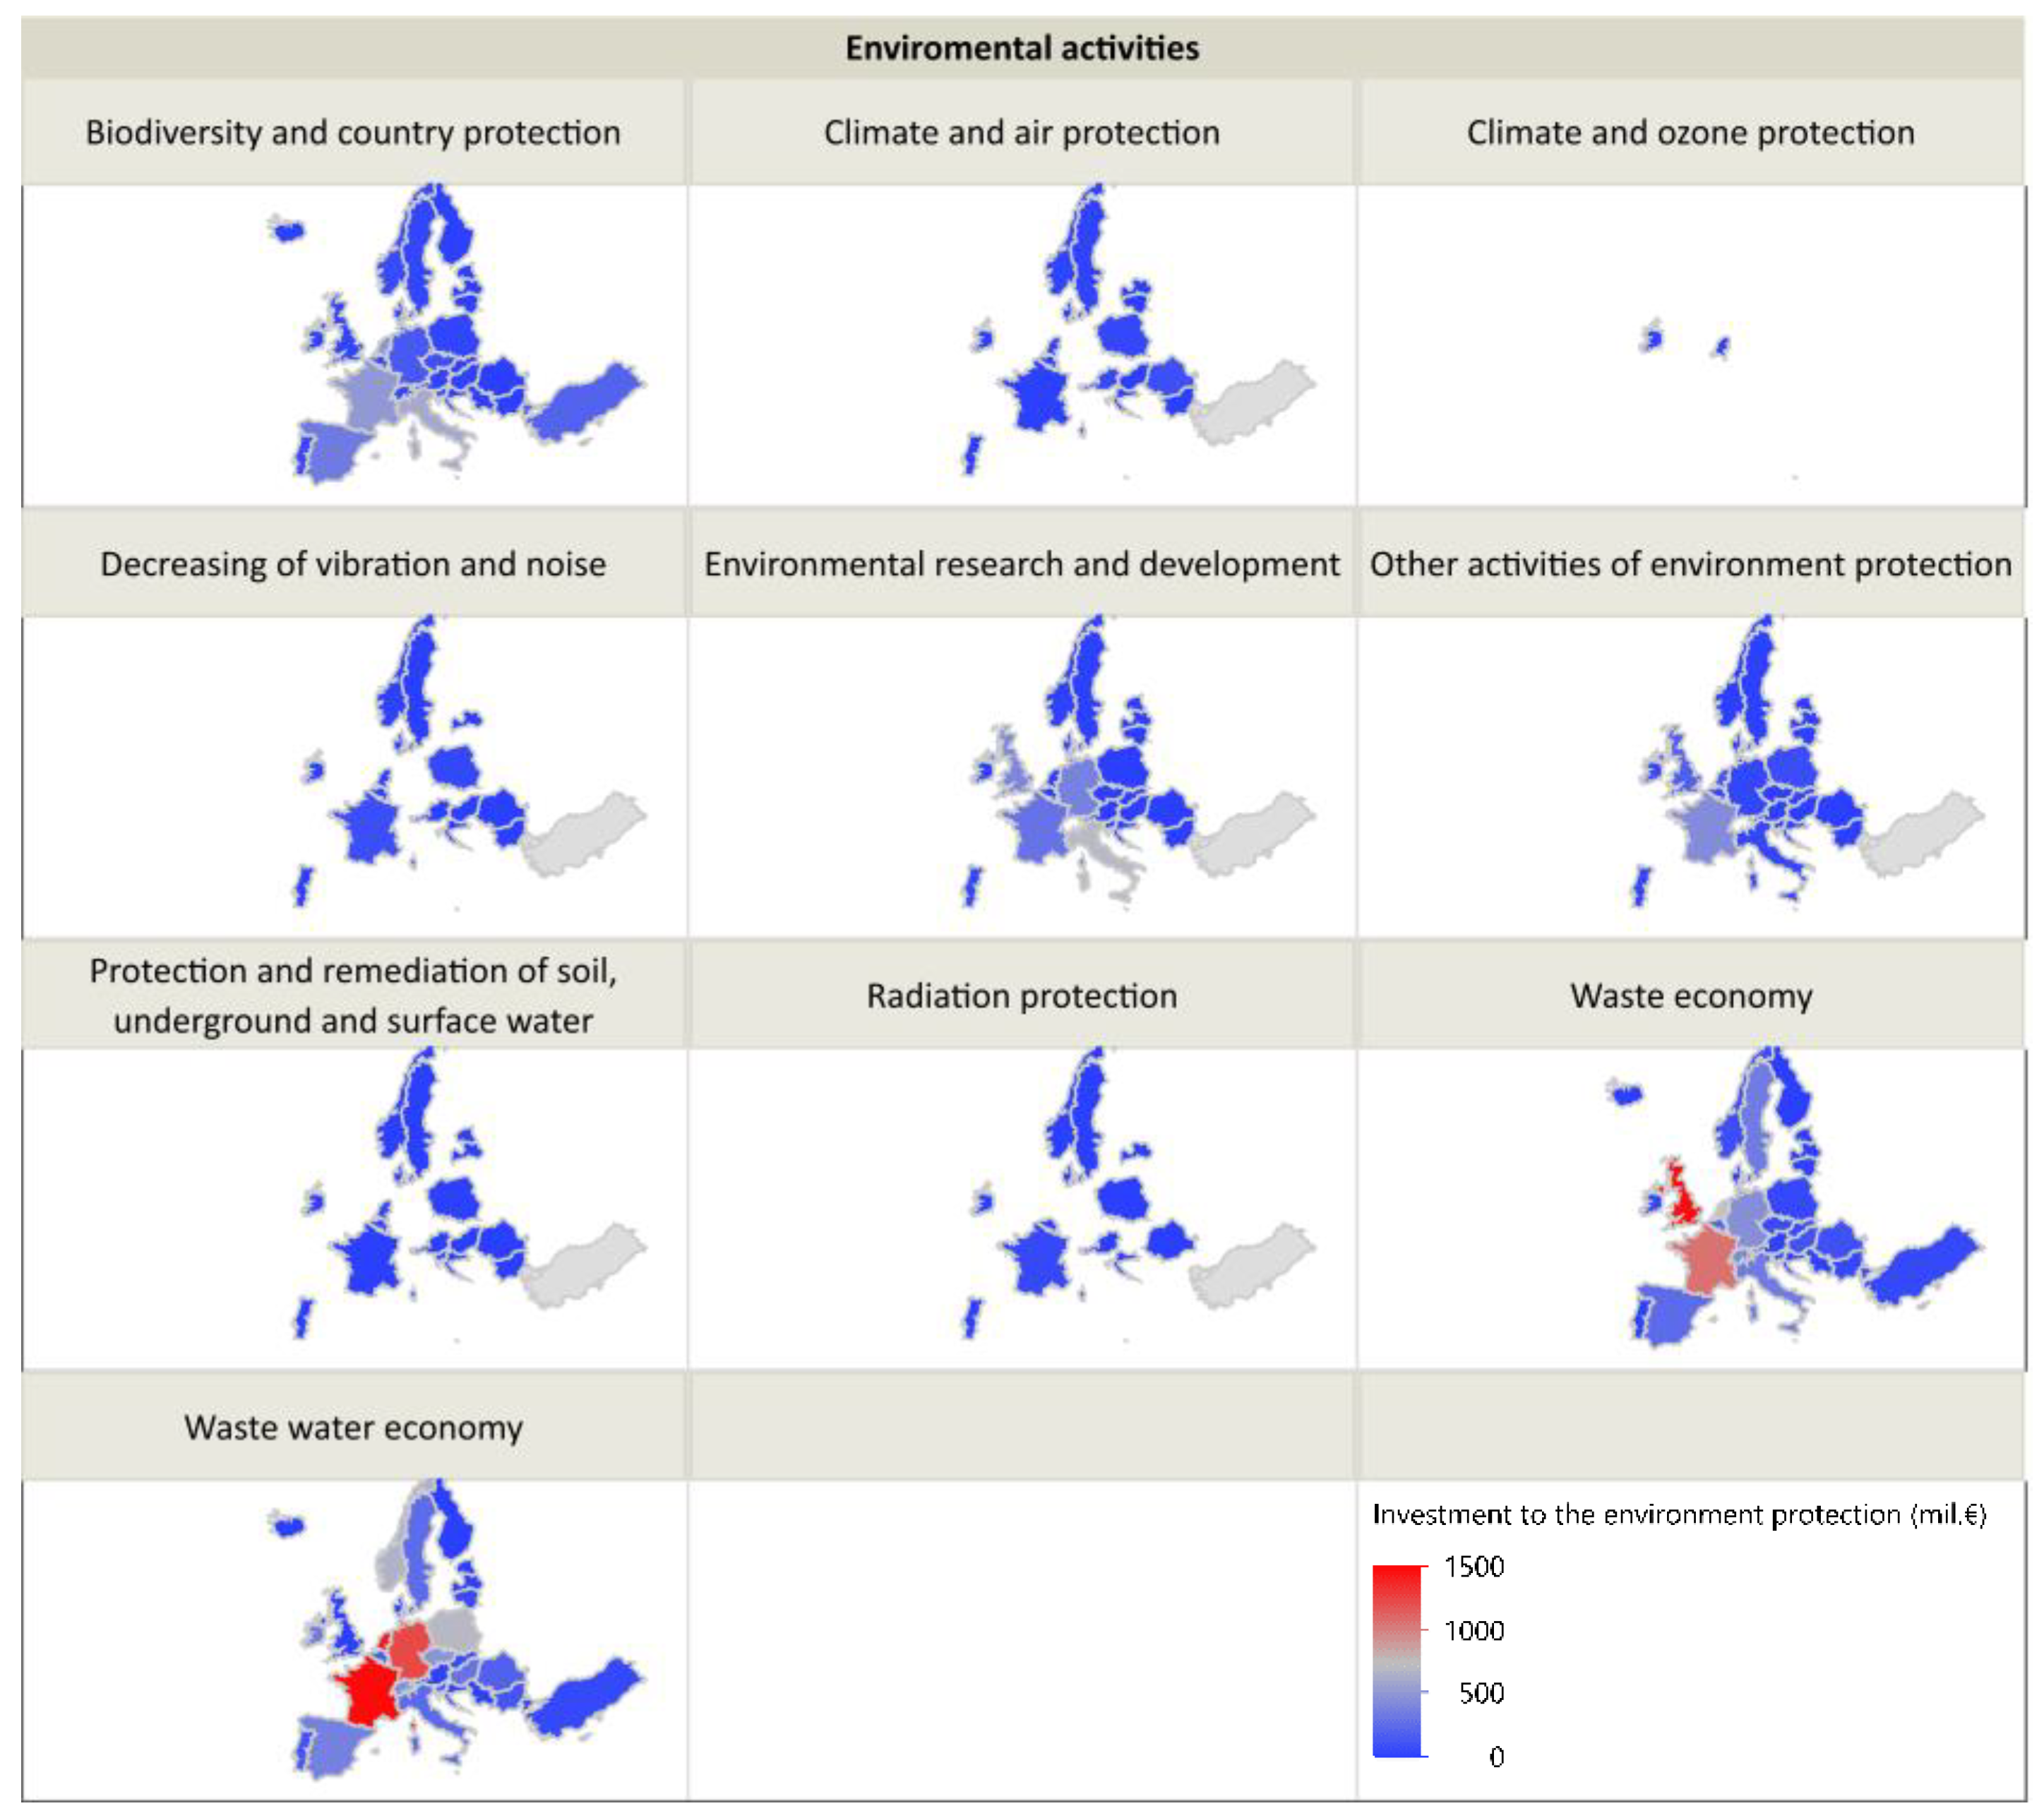
Based on the processed data for the years 2006–2019, it is clear that the largest share of investments goes to wastewater management and waste management, perceived by the public as the most pleasing problem of the company. This is also reflected in the following cartographers (see Figure 10), where most countries, even with the highest share of investment in environmental protection, go into these two categories.

4.3. Investment in the Waste Economy in the EU and Slovakia

There are significant differences between EU countries in terms of investment in waste management. The countries with the highest share of investment include the United Kingdom, France, The Netherlands, and Denmark (Figure 11).
In this case, Slovakia ranks among the countries with a relatively low share of investment. The Statistical Office of the Slovak Republic for enterprises monitors investments in environmental protection in the Slovak Republic with more than 20 employees and for municipalities. The performed analysis presents the total investments, spent mainly on the innovation of the system and equipment used to improve the quality of the environment (Table 4).
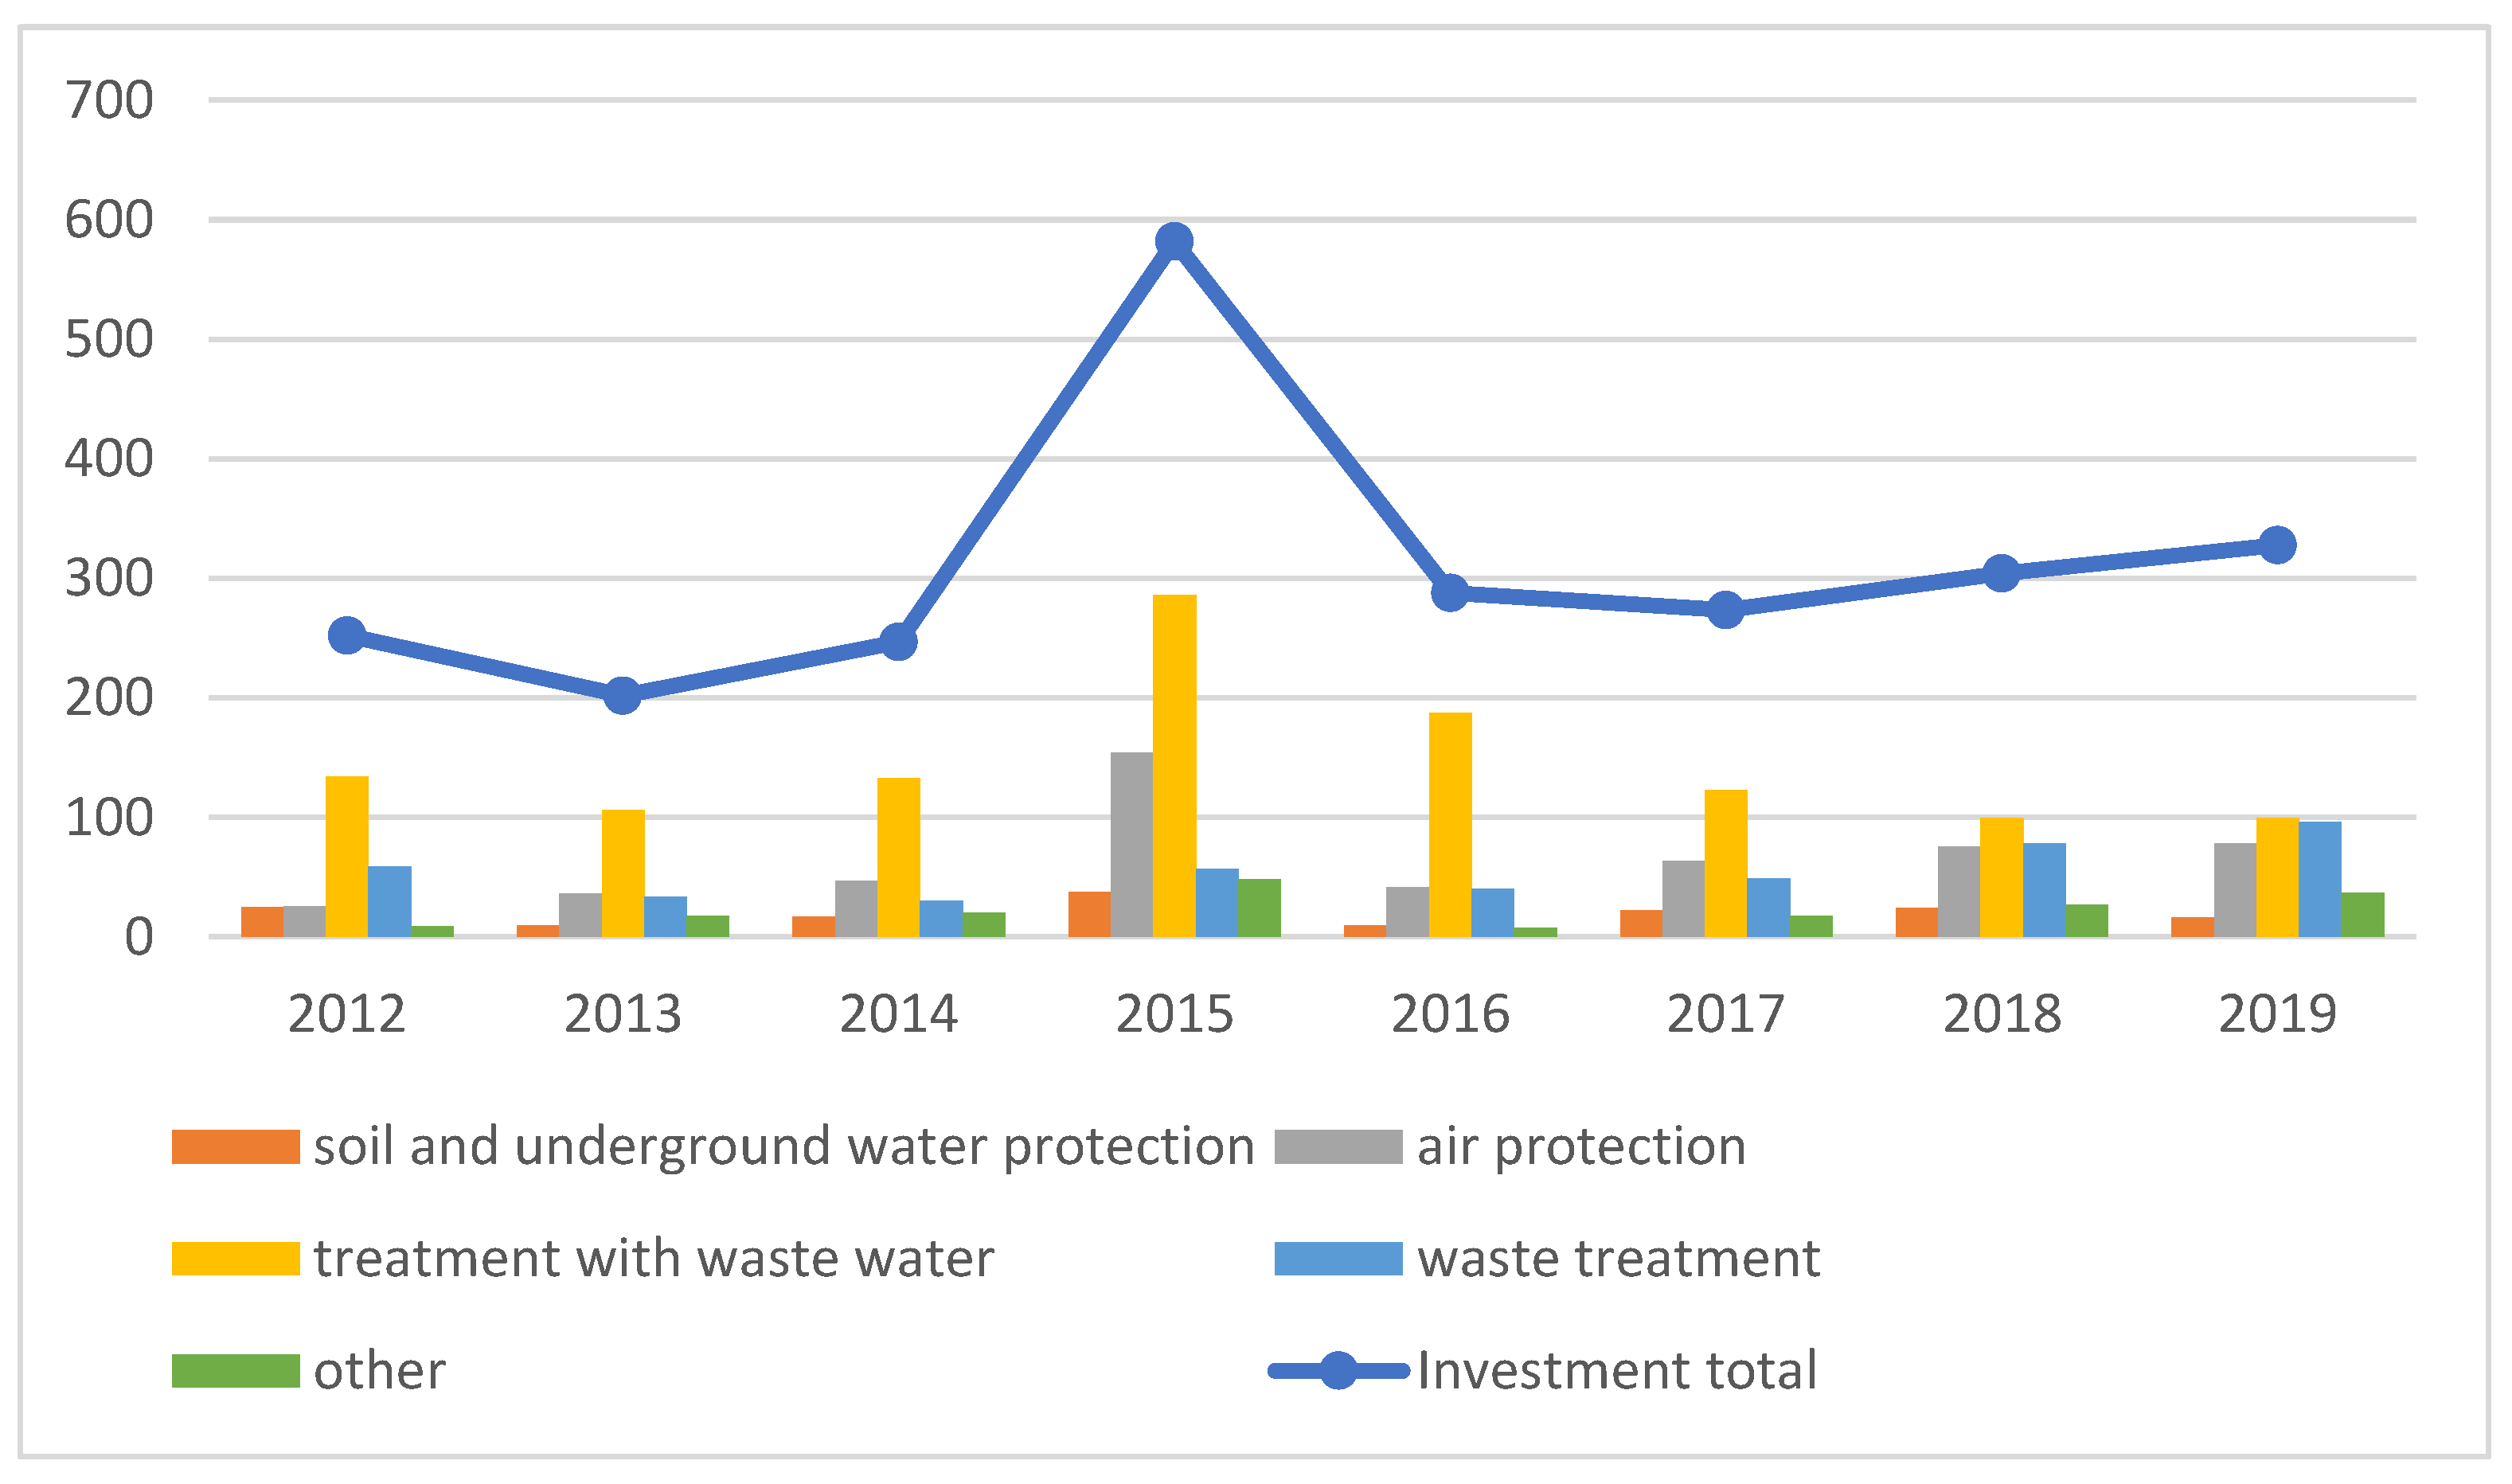
From the presented data, it can be stated that in Slovakia, too, investments flow the most in the management of wastewater and waste, as follows from the analysis in EU countries. Investments in environmental protection, as well as investments in the field of waste management, had a fluctuating character, which is also presented in Figure 12.
The value for the observed period increased by 30% for total investments in the environment and by 63% for investments in waste management. The highest value was in the case of total investments in the environment in 2015, and then in the following year, these investments decreased more significantly. After 2016, however, it is possible to follow their growing trend again, including investments in waste management, while the highest value of investments in waste management, as well as their share in total investments, was recorded in the last monitored year 2019. This follows from the need to meet Slovakia’s goals set by the European Union in the field of waste management. Investments went mainly to technological innovations aimed at increasing the rate of waste recovery with a focus on their preparation for reuse and recycling. At the same time, activities related to the improvement of separate collection of municipal waste, especially biodegradable waste, were and still are supported.

5. Discussions and Conclusions

In the content analysis of the paper, we pointed out the importance of investing in environmental protection and one of the environmental problems—the growing amount of waste. We have defined public spending and investment in the environment and pointed to many authors who have researched this aspect in their scientific papers. The main part of the paper was devoted to the analysis of trends and comparison of public expenditures and investments in the EU and Slovakia in individual areas of the environment. The analysis shows a growing trend of expenditures on environmental protection both in the EU (Figure 4) and in the Slovak Republic (Figure 7). Figure 10 and Figure 12 then present the area of the most significant investments in the EU and in the Slovak Republic. In both cases, wastewater and waste management come to the fore.
Due to the focus of the paper on waste management, analyses of the state and development trend of selected waste management indicators in the EU (Figure 1 and Figure 2) and in Slovakia (Table 1) were also carried out. The performed analysis shows the growing trend of municipal waste production and increasing material and energy recovery of this type of waste. Despite progress, Slovakia is still lagging behind in meeting the EU’s environmental objectives, especially in the high landfill rate of municipal waste, which is at the level of 52%, and the insufficient recycling rate of municipal waste of 38.5%.
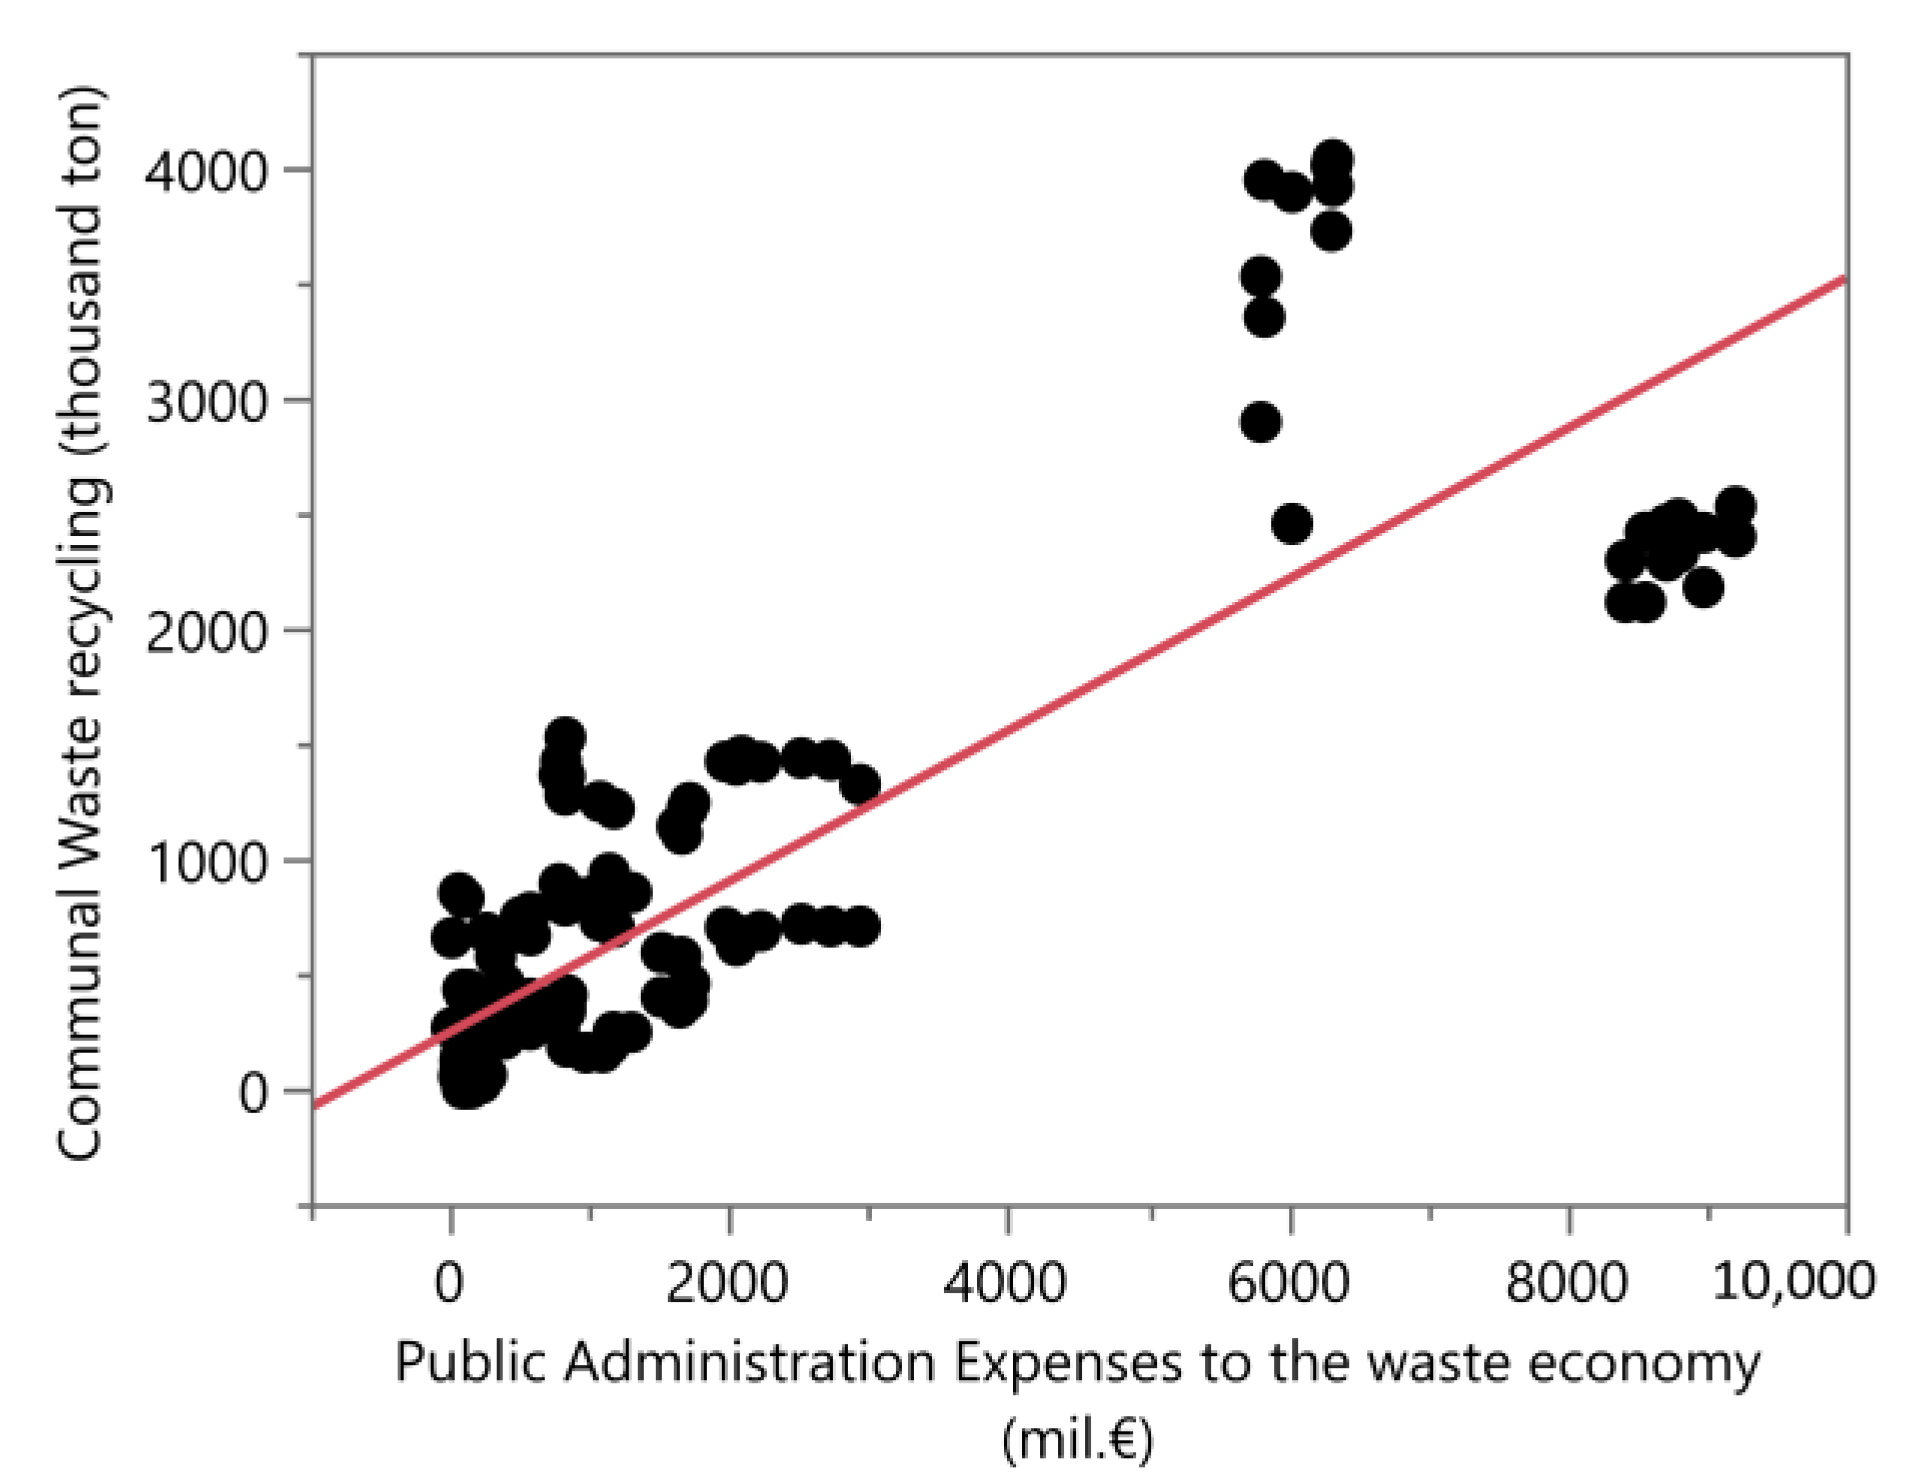
The development trends of the surveyed indicators, especially in the last 4 years, point to a more significant increase in public expenditure and investment in waste management in Slovakia, as well as an acceleration in the growth rate of municipal waste recycling [41,42]. Based on the above, we investigated the relationship between public spending and municipal waste recovery. The dependence study was carried out due to the larger amount of data and higher statistical reliability for the whole European Union and is presented in Figure 13 and Figure 14.
  • Linear Fit
Communal Waste recycling (thousand tons) = 244.62859 + 0.3274381 Public Administration Expenses to the waste economy (mil. €)
  • Summary of Fit
RSquare0.719316
RSquare Adj0.717625
Root Mean Square Error507.285
Mean of Response766.5595
Observations (or Sum Wgts)168
  • Analysis of Variance
SourceDFSum of SquaresMean SquareF Ratio
Model1109,474,709109,474,709425,4120
Error16642,718,127257,338,11Prob > F
C. Total167152,192,835 <0.0001
  • Parameter Estimates
TermEstimateStd Errort RatioProb > |t|
Intercept244.6285946.606045.25<0.0001
Public Administration Expenses to the waste economy (mil. €)0.32743810.01587520.63<0.0001
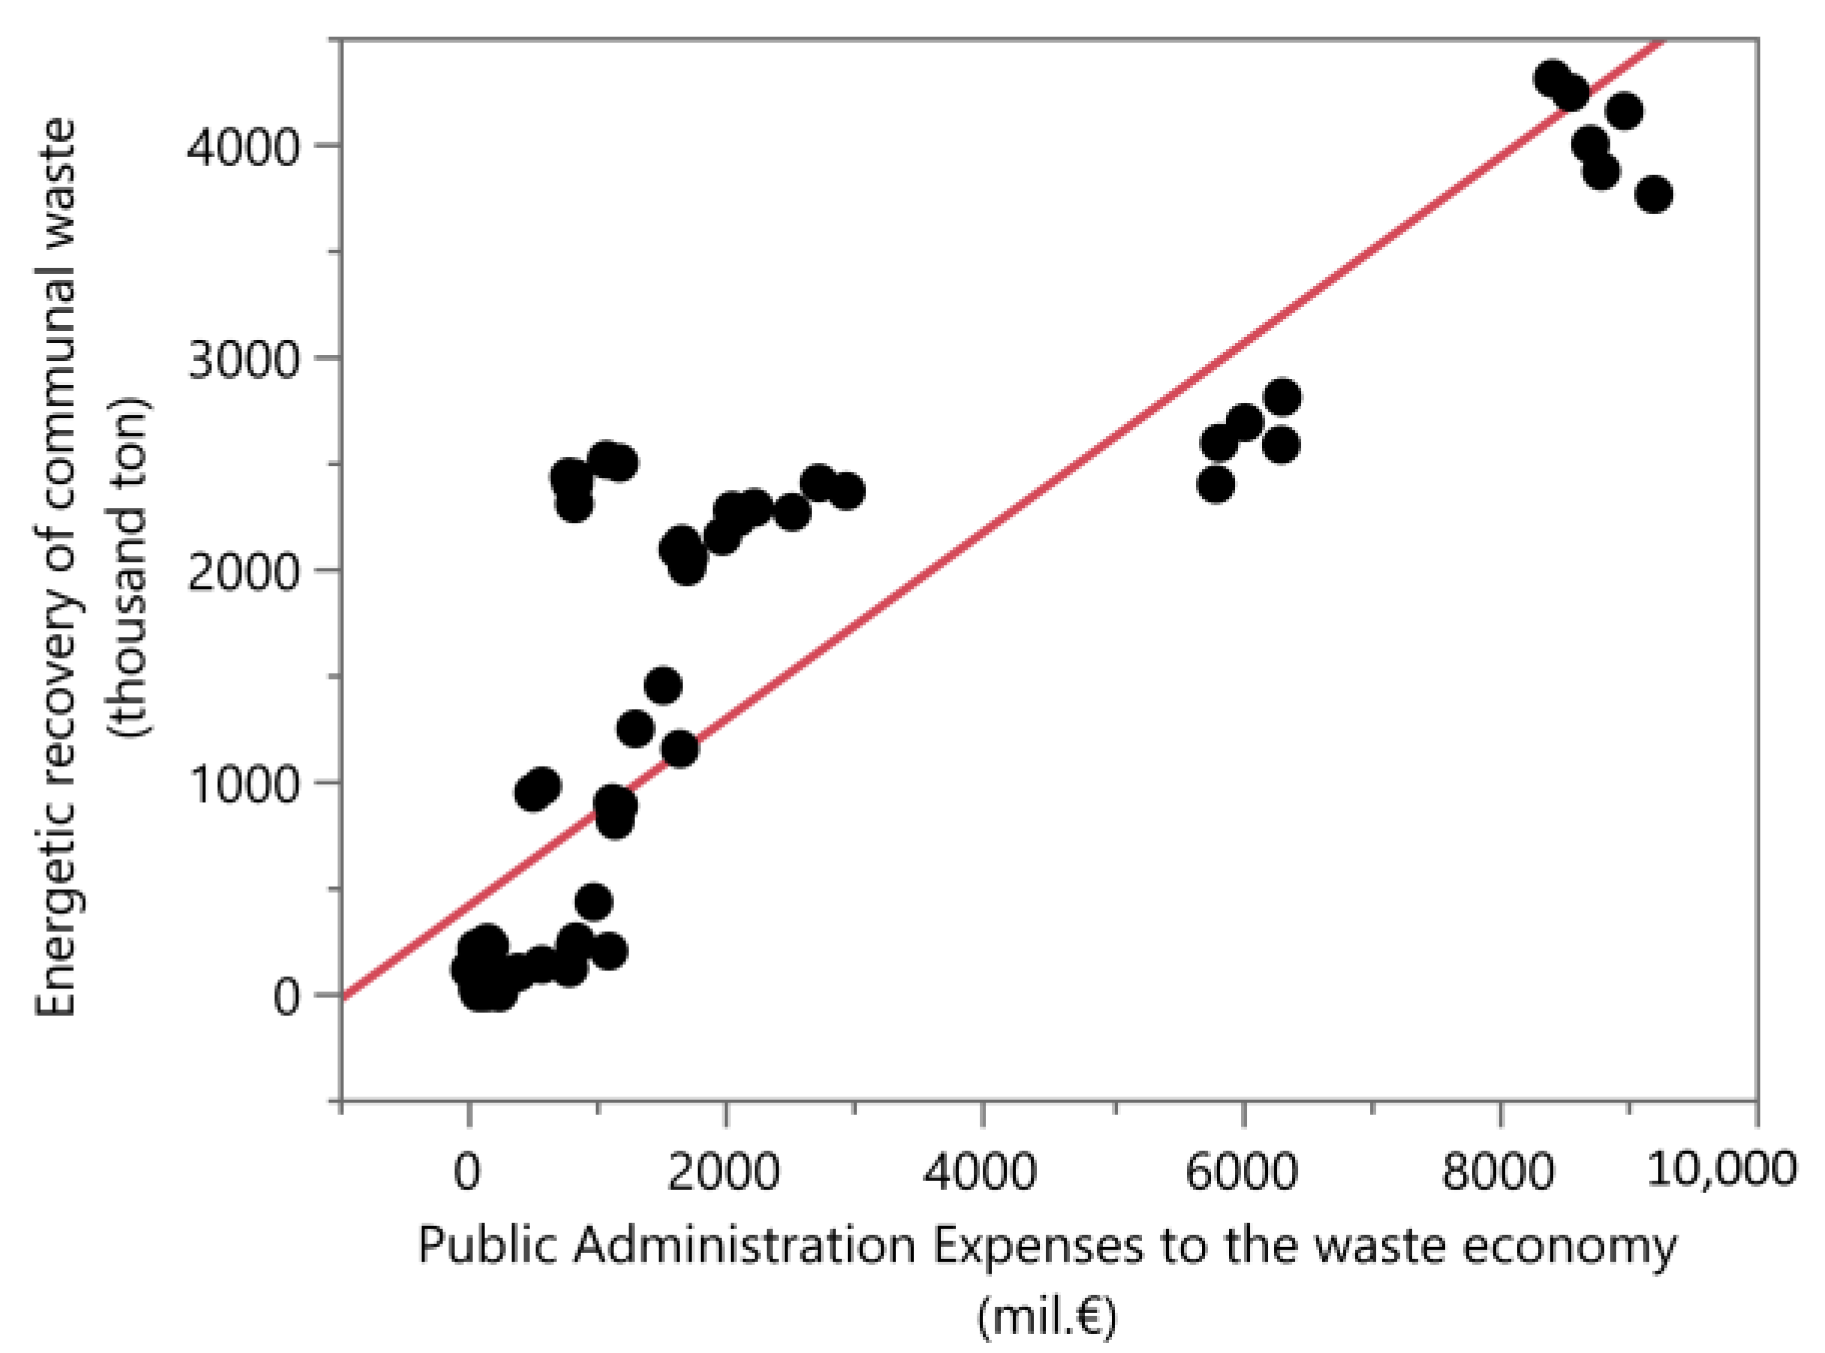
The regression analysis shows that the rate of municipal waste recycling increases with the growth of waste management expenditures, as shown in Figure 13. The result is a statistically significant linear dependence of the variables described by the linear regression model. The R Square value is the value of the coefficient of determination, which indicates that the model describes 72% of the variability of Communal Waste recycling. In the Analysis of Variance section, the null hypothesis was tested, which states that the model we have chosen to explain the dependence (in our case a linear regression line) is not suitable (the alternative hypothesis states the opposite). The F test is used to evaluate this statement. The F test result with a p-value is less than 0.0001 (significance level alpha = 0.05), so we reject H0, which means that the model was chosen correctly. In the parameter estimates section, null hypotheses concerning the significance of the locating constant and the regression coefficient were tested, while the null hypothesis states the insignificance of the respective coefficient and the alternative hypothesis its significance. The p-value for the locating constant and for the regression coefficient is less than 0.0001. This suggests that the locating constant and the regression coefficient are statistically significant.
The result of the following regression analysis shows that the growth of public expenditures has a positive effect not only on the growth of material but also on the growth of energy recovery of municipal waste to a statistically significant extent. The result mathematically expresses a linear regression model that describes almost 73% (RSquare) of the unknown (Figure 14). Even in the case of this regression model, the results of the F test with a p-value of less than 0.0001 showing that the model was chosen appropriately and the variables of the model (intercept, Public Administration Expenses to the waste economy) are statistically significant.
Figure 14. Dependence between public expenses and energy recovery of the communal waste.
Sustainability 14 05270 g014
  • Linear Fit
Energetic recovery of communal waste (thousand tons) = 405.28606 + 0.4402192 Public Administration Expenses to the waste economy (mil. €)
  • Summary of Fit
RSquare0.728032
RSquare Adj0.724716
Root Mean Square Error671.3638
Mean of Response1106.988
Observations (or Sum Wgts)84
  • Analysis of Variance
SourceDFSum of SquaresMean SquareF Ratio
Model198,938,01798,938,017219,5065
Error8236,959,81045,072,939Prob > F
C. Total83135,897,827 <0.0001
  • Parameter Estimates
TermEstimateStd Errort RatioProb > |t|
Intercept405.2860687.229444.65<0.0001
Public Administration Expenses to the waste economy (mil. €)0.44021920.02971314.82<0.0001
The confirmed dependencies show the expenditure on waste management is efficiently spent, contributing to achieving environmental policy objectives more effectively. The results support the statement of Loncric et al. (2021) that the application of the economy in a linear way as before is affecting the degradation of the environment [43]. Andabaka et al. (2019) found similar results that the recycling rate of municipal waste had, together with other economic indicators, a statistically significant and positive effect on eco-innovation, influencing the living environment [44]. Van Caneghem et al. (2019) state although waste-to-energy figures are on a lower level in the European waste hierarchy than recycling, it plays, from an overall sustainability point of view, an essential, complementary and facilitating role due to the environmental reasons [45]. According to van Ewijk and Stegemann (2020), waste management focuses long-time on the protection of the living environment [46]. The authors pointed to the environmental principles of the waste economy together with legal requirements.
Public spending on the environment presents one of the important economic tools for achieving environmental policy objectives and can positively influence polluters’ behavior.
The presented paper examined public expenditures and investments in environmental protection in the EU and the Slovak Republic and the efficiency of their spending in relation to waste management. This category of investment was chosen because one of the factors that significantly affect the environment in the Slovak Republic and Slovakia still lags behind the EU average in the evaluation of their indicators is waste. In Slovakia, the amount of municipal waste is growing at a relatively fast pace, and their high landfill rate is a negative phenomenon. The main goal of the formulated measures within the environmental policy is to complete the waste management infrastructure focused on improving the collection and sorting of municipal waste and, subsequently, on their recovery, especially material waste. Funding for the mentioned activities comes mainly from the EU structural funds (90%) and the Environmental Fund (10%) [47].
The aim of the paper was also to point out the relationship between public expenditure and the rate of recovery of municipal waste. The paper consists of the analysis of the dependence in EU countries, and it confirmed that with the growth of public expenditure on waste management, the rate of recovery of municipal waste also increases. This is a signal of the efficient use of funds to improve waste management indicators. Based on this, we can conclude the need to evaluate the indicators expressing the management of municipal waste with a link to the use of funds spent on improving the waste management system. This will help to assess their effective implementation and the fulfillment of environmental objectives.

Author Contributions

Conceptualization, E.M., M.T.; methodology, E.M., M.T.; software, M.T.; validation, K.Č.; formal analysis, E.M., M.T.; resources, K.Č.; data curation, M.T.; writing—original draft preparation, K.Č.; writing—review and editing K.Č.; visualization, M.T.; supervision, E.M.; project administration, K.Č.; funding acquisition, M.T. All authors have read and agreed to the published version of the manuscript.

Funding

This research was funded by VEGA 1/0797/20.

Institutional Review Board Statement

Not applicable.

Informed Consent Statement

Not applicable.

Data Availability Statement

Not applicable.

Acknowledgments

Contribution presents the partial result of grant project VEGA 1/0797/20.

Conflicts of Interest

The authors declare no conflict of interest.

References

  1. EEA. Living Environment and Health. 2020. Available online: https://www.eea.europa.eu/sk/themes/human/intro (accessed on 17 November 2021).
  2. Transforming Our World: The 2030 Agenda for Sustainable Development. 2015. Available online: https://www.unep.org/resources/report/transforming-our-world-2030-agenda-sustainable-development (accessed on 14 January 2021).
  3. European Green Agreement. Available online: https://www.enviroportal.sk/odpady/europska-zelena-dohoda-2019 (accessed on 10 January 2022).
  4. Vivian, W.L.; Tam, W.Y. Construction waste management policies and their effectiveness in Hong Kong: A longitudinal review. Renew. Sustain. Energy Rev. 2013, 23, 214–223. [Google Scholar] [CrossRef] [Green Version]
  5. Zaharova, T.J. The effectiveness of environmental policy: From solving global problems to establishing university campuses. Tomsk. State Univ. J. Philos. Sociol. Polit. Sci. 2019, 47, 179–188. [Google Scholar] [CrossRef]
  6. van Timmeren, A. Waste management in the built environment on the basis of decentralization and integration strategies: The ‘urban metabolism’. Trans. Ecol. Environ. 2008, 109, 51–63. [Google Scholar] [CrossRef] [Green Version]
  7. Çimen, Ö. Construction and built environment in circular economy: A comprehensive literature review. J. Clean. Prod. 2021, 305, 127180. [Google Scholar] [CrossRef]
  8. Akhimien, N.G.; Latif, E.; Hou, S.S. Application of circular economy principles in buildings: A systematic review. J. Build. Eng. 2021, 38, 102041. [Google Scholar] [CrossRef]
  9. Ladaru, G.R.; Petre, I.L.; Nica, M.; Caraman Costel, A.A. Investment Efficiency of Waste Reduction on the Quantity of Municipal Waste in Romania. In Proceedings of the 34th International-Business-Information-Management-Association (IBIMA) Conference, Madrid, Spain, 13–14 November 2019; pp. 5799–5805. [Google Scholar]
  10. Huang, W.; Wang, J.; Dai, X.; Li, M.; Harder, M.K. More than financial investment is needed: Food waste recycling pilots in Shanghai, China. J. Clean. Prod. 2014, 67, 107–116. [Google Scholar] [CrossRef] [Green Version]
  11. Agaton, C.B.; Guno, C.S.; Villanueva, R.O.; Villanueva, R.O. Economic analysis of waste-to-energy investment in the Philippines: A real options approach. Appl. Energy 2020, 275, 115265. [Google Scholar] [CrossRef]
  12. Abdallah, M.; Shanableh, A.; Shabib, A.; Adghim, M. Finacial feasibility of waste to energy strategies in the United Arab Emirates. Waste Manag. 2018, 82, 207–219. [Google Scholar] [CrossRef]
  13. Fernandez-Gonzalez, J.M.; Grindlay, A.L.; Serrano-Bernardo, F.; Rodriguez-Rojas, M.I.; Zaromano, M. Economic and environmental review of waste-to-energy systems for municipal solid waste management in medium and small municipalities. Waste Manag. 2017, 67, 360–374. [Google Scholar] [CrossRef]
  14. Banacu, C.S.; Busu, M.; Ignat, R.; Trica, C.L. Entrepreneurial innovation impact on recycling municipal wate. A panel data analysis at the EU level. Sustainability 2019, 11, 5125. [Google Scholar] [CrossRef] [Green Version]
  15. Busu, M. Adopting Circular Economy at the European Union Level and Its Impact on Economic Growth. Soc. Sci. 2019, 8, 159. [Google Scholar] [CrossRef] [Green Version]
  16. Callan, S.J.; Thomas, J.M. Economies of scale and scope: A cost analysis of municipal solid waste services. Land Econ. 2001, 77, 548–560. [Google Scholar] [CrossRef]
  17. da Cruz, N.F.; Simões, P.; Marques, R.C. Economic cost recovery in the recycling of packaging waste: The case of Portugal. J. Clean. Prod. 2012, 37, 8–18. [Google Scholar] [CrossRef] [Green Version]
  18. Grant, R. E-waste challenges in Cape Town: Opportunity for the green economy? Urbani Izziv-Urban Chall. 2019, 30, 5–23. [Google Scholar] [CrossRef]
  19. Peng-Fei, L.; Wag, K.H.; Meng, L.; Xue, D. An overview of municipal organic waste disposal in China. Energy Environ. Sustain. Ecosyst. Dev. 2015. [Google Scholar] [CrossRef]
  20. Athanasiu, C.J.; Tsalkidis, D.A.; Kalogirou, E.; Voudrias, E.A. Feasibility analysis of municipal solid waste mass burning in the Region of East Macedonia—Thrace in Greece. Waste Manag. Res. 2015, 33, 561–569. [Google Scholar] [CrossRef]
  21. Jakubiak, M. Analysis of implementing sustainable municipal solid waste management. Krakow city case study. In Proceedings of the International Multidisciplinary Scientific GeoConference-SGEM, Albena, Bulgaria, 17–26 June 2014; Volume 2, pp. 17–24. [Google Scholar]
  22. Getz, M.; Walter, B. Environmental policy and competitive structure: Implications of the hazardous waste management program. Policy Stud. J. 1980, 9, 404–414. [Google Scholar] [CrossRef]
  23. Wachira, M. Public policy and sustainability: A public policy on waste management. Eur. J. Bus. Manag. 2017, 9, 130–134. [Google Scholar]
  24. Valaoras, G. Waste Management Policies in the United States of America. Health Impacts of Waste Management Policies; Environmental Science and Technology Library Series; Springer: Dordrecht, The Netherlands, 2000; Volume 16, pp. 121–131. [Google Scholar]
  25. Ministry of Investment, Regional Development and Informatization of Slovakia. 2020. Available online: https://rokovania.gov.sk/RVL/Material/25655/1 (accessed on 13 December 2021).
  26. Envirostrategy. Strategy of Environmental Policy in Slovakia to 2030. 2019. Available online: https://www.minzp.sk/files/iep/03_vlastny_material_envirostrategia2030_def.pdf (accessed on 13 December 2021).
  27. Helm, D. Economic Instruments and Environmental Policy. Econ. Soc. Rev. 2005, 36, 205–228. [Google Scholar]
  28. Khan, S.A.R.; Ponce, P.; Thomas, G.; Yu, Z.; Al-Ahmadi, M.S.; Tanveer, M. Digital Technologies, Circular Economy Practices and Environmental Policies in the Era of COVID-19. Sustainability 2021, 13, 12790. [Google Scholar] [CrossRef]
  29. Mlynárová, D.; Ščerba, K. Environmental Public Expenditure and the Economic Growth. Available online: http://www.ef.umb.sk/konferencie/kfu_2017/prispevky%20a%20prezentacie/prispevky/Mlyn%C3%A1rov%C3%A1,%20%C5%A0%C4%8Derba.pdf (accessed on 18 December 2021).
  30. Eurostat. Environmental Protection Investments of General Government by Environmental Protection Activity—Waste Management. 2022. Available online: https://ec.europa.eu/eurostat/databrowser/view/env_ac_epigg/default/table?lang=en (accessed on 7 January 2022).
  31. Bishop, B.H. Context and Place Effects in Environmental Public Opinion; Duke University Library: Durham, NC, USA, 2013; Available online: https://dukespace.lib.duke.edu/dspace/handle/10161/7273 (accessed on 9 December 2021).
  32. Mandalová, K. An Assessment of the Expenditure to be Spent for Environmental Protection. 2012. Available online: http://www.slpk.sk/eldo/2012/zborniky/025-12/13.pdf (accessed on 18 December 2021).
  33. Čech, J. Current environmental economics. Acta Montan. Slovaca 2005, 10, 403–407. [Google Scholar]
  34. Bobáková, V.; Mihaliková, E. Public Expenditure for the Environmental Protection in Slovakia. TEM J. 2019, 8, 921–927. [Google Scholar] [CrossRef]
  35. Mihaliková, E.; Džuňová, J. Ekonomické aspekty ochrany životného prostredia s dôrazom na odpadové hospodárstvo. In Proceedings of the 10th Annual International Scientific Conference Competition, Jihlava, Czech, 17–18 May 2018; pp. 280–288. [Google Scholar]
  36. OECD. Regulatory Frameworks for Urban Services—Background Discussion Paper to Inform the Regulatory Reform Review of China; OECD Publishing: Paris, France, 2007; Available online: www.oecd.org/gov/regulatory-policy/39218313.pdf (accessed on 8 January 2022).
  37. Romančíková, E. Economy and Living Environment; Ekonómia: Bratislava, Slovakia, 2011; p. 105. (In Slovak) [Google Scholar]
  38. Statistical Office SR. Costs and Revenues in Living Environment Protection (2012–2019). Available online: https://slovak.statistics.sk/wps/portal/ext/themes/environment/environment/indicators (accessed on 15 January 2022).
  39. Eurostat. Recycling Rate of Municipal Waste. 2022. Available online: https://ec.europa.eu/eurostat/databrowser/view/cei_wm011/default/table?lang=en (accessed on 7 January 2022).
  40. Ministry of Finance SR. Budget of Public Administration SR (2012–2019). Available online: http://www.finance.gov.sk/Default.aspx?CatID=60 (accessed on 15 January 2022).
  41. Mihaliková, E.; Dzunová, J.; Fiala, R.; Pospíšil, J.Z. Economic aspects of environmental protection with focus on waste economy. In Proceedings of the 10th Annual International Scientific Conference Competition, Jihlava, Czech, 17–18 May 2018; pp. 280–288. [Google Scholar]
  42. Eurostat. C Generation of Municipal Waste Per Capita. Available online: https://ec.europa.eu/eurostat/databrowser/view/cei_pc031/default/table?lang=en (accessed on 7 January 2022).
  43. Loncric, R.; Sudaric, T.; Milkovic, S.J. Circular economy and agricultural waste management in Croatia. In Proceedings of the 10th International Scientific Symposium Region Entrepreneurship Development, Online, 17 June 2021; pp. 787–1803. [Google Scholar]
  44. Andabaka, A.; Sertic, M.B.; Harc, M. Eco-innovation and economic growth in the European Union. Zagreb Int. Rev. Econ. Bus. 2019, 22, 43–54. [Google Scholar] [CrossRef] [Green Version]
  45. Van Caneghem, J.; Van Acker, K.; De Greef, J.; Wauters, G.; Vandecasteele, C. Waste-to-energy is compatible and complementary with recycling in the circular economy. Clean Technol. Environ. Policy 2019, 21, 925–939. [Google Scholar] [CrossRef]
  46. van Ewijk, S.; Stegemann, J.A. Recognizing waste use potential to achieve a circular economy. Waste Manag. 2020, 105, 1–7. [Google Scholar] [CrossRef] [PubMed]
  47. Environmental Fund. Available online: http://www.envirofond.sk/sk/vyrocne-spravy (accessed on 22 January 2022).
Figure 1. Production in CW in thousand tons in EU208 in 2009–2018.
Sustainability 14 05270 g001
Figure 2. Treatment with communal waste in EU28 (thousand tons).
Sustainability 14 05270 g002
Figure 3. Development of communal waste per inhabitant in EU and Slovakia (in kg).
Sustainability 14 05270 g003
Figure 4. Expenses to the living environment protection in the whole economy in EU28–development in 2005–2020.
Sustainability 14 05270 g004
Figure 5. EU comparison—Expenses of public administration to the living environment protection in mil. Eur (left) and in % GDP (right).
Sustainability 14 05270 g005
Figure 6. EU comparison—Expenses of the public administration to the living environment protection in % GDP. Note: Red points—countries over or below average values. Green points—countries with average values.
Sustainability 14 05270 g006
Figure 7. Development of Ministry of Environment expenses in Slovakia to the individual areas of the environment (in thousand EUR). Source: own processing.
Sustainability 14 05270 g007
Figure 8. Development of Ministry of Environment expenses in Slovakia to the waste economy (in thousand EUR).
Sustainability 14 05270 g008
Figure 9. Investment in the living environment protection according to the environmental activities in EU in 2006–2019.
Sustainability 14 05270 g009
Figure 10. Cartographer–investment in the living environment protection (average in 2006–2019).
Sustainability 14 05270 g010
Figure 11. Countries comparison–investment to the waste economy in 2005–2019. Note: Red points—countries over or below average values. Green points—countries with average values.
Sustainability 14 05270 g011
Figure 12. Investment in the Living Environment Protection in Slovakia in thousand EUR.
Sustainability 14 05270 g012
Figure 13. Dependence between public expenses and measure of communal waste recycling.
Sustainability 14 05270 g013
Table 1. Development of communal waste production and its stocking.
20122013201420152016201720182019
EU27–CW488478478480490496496501
EU27–CW stocking 153142134127121120119121
Measure of stocking in the EU (%)31.3529.7128.0326.4624.6924.1923.9924.15
Measure of recycling in EU (%) 40.941.543.444.946.546.947.248.1
SR–CW306304320329348378414421
SR–CW stocking 224213214226228229229219
Measure of stocking in SR (%)73.2070.0766.8868.6965.5260.5855.3152.01
Measure of recycling in SR in %13.410.810.314.92329.836.338.5
Table 2. Structure of data collection in the EU.
IndexNumber of MeasurementsAnalyzed Period
Investment in the living environment in mil. €29282006–2019
National expenses to the living environment protection35552006–2020
Environmental donation77.5742011–2019
Expenses to the living environment protection per inhabitant14.7961995–2013
Communal waste21.9271995–2020
Table 3. Expenses of Ministry of Living Environment to the individual areas (thousand EUR).
20122013201420152016201720182019
Water economy 164.844187.834150.930442.879186.512137.313172.520200.377
Air protection 30.29322.532902247.39012.9273918414447.766
Waste economy 76.37749.35930.13281.45010.580581368.69980.473
Protection of the nature and the country 17.12623.71720.57437.90515.94015.75426.04640.170
Administrative 37.82438.74225.50152.21445.69844.85587.814144.670
Low carbon economy 400021.27946.00387.284109.194
IT systems support 25722940
Risk and extra events management 1247197
Total resources 326.466322.187236.160665.840292.939256.231449.573629.847
Waste economy/Expenses (%)23.415.3212.7612.233.612.2715.2812.78
Source: own processing.
Table 4. Investment in the living environment protection (in thousand EUR).
2012201320142015
Value%Value%Value%Value%
Total investment252.115 201.790 246.667 581.739
Soil and underground water protection24.9299.899.2154.5716.8436.8337.0856.37
Air protection25.25610.0236.33018.0047.04519.07153.98826.47
Treatment with wastewater 134.03353.16105.70752.38132.36553.66285.63949.10
Waste treatment 58.99923.4033.08416.4030.15012.2256.5979.73
Others 8.8993.5317.4548.6520.2638.2147.8978.23
2016201720182019
Value%Value%Value%Value%
Total investment 287.702 273.347 304.066 327.713
Soil and underground water protection 9.7073.3721.8738.0024.3518.0116.2364.95
Air protection 41.48414.4263.34423.1775.63824.8877.98723.80
Treatment with wastewater187.56565.19122.43144.7999.31232.6699.57130.38
Waste treatment39.92813.8848.53017.7578.28725.7596.33629.40
Others 7.5052.6117.1686.2826.4788.7136.41711.11
Publisher’s Note: MDPI stays neutral with regard to jurisdictional claims in published maps and institutional affiliations.