Abstract
Mining fracture is the key factor in realizing water-conservation mining, stability evaluation of coal mining subsidence areas, and accurate restoration of the surface eco-environment. To clarify, the evolution and distribution of mining fractures, based on the key strata theory and the mining degree of overburden failure, the contact state of rock stratum after overburden critical failure was analyzed, the formation mechanism of “saddle shaped” water conducting fracture zone was revealed, and the permanent mining fractures were determined to be primarily concentrated in the overburden structure at the boundary of the working face. According to the shear test of sandstone in the fracture zone, the damage degree of the rock sample was positively correlated with shear stress, and the overburden structure exhibited no instability. Based on the distribution of mining fractures, the fracture zone was divided into the original fracture, tensile fracture, structural void, and void compaction areas in the horizontal direction. The structural void area had the largest residual deformation in the goaf. A regional division method based on overburden critical failure was proposed and applied in engineering by using surface movement monitoring. The results showed that the surface subsidence near the boundary of working face was greater than that in the middle, and the residual surface deformation in the goaf was closely related to the mining time, which has long-term characteristics. The rationality of the regional division method of mining fractures was also verified.
1. Introduction
Underground coal mining produces disturbances equivalent to its mining volume, causing varying degrees of damage to the overburden in the form of the changing fracture field. Then, it might cause problems, such as soil and water loss, surface collapse, landslides, vegetation degradation, and debris flows, affecting the eco-environment and the safe mining [1,2,3], especially in coal mining areas with dense population, developed economy, resources depletion, and fragile eco-environment [4,5,6]. The effective control of overburden failure height is the key factor for realizing safe coal mining under water-bodies, water conservation mining, and effective protection of the water eco-environment. Its essence lies in overburden fracture distribution and evolution induced by coal mining [7,8,9]. Meanwhile, the overburden void is also the main reason for the surface residual subsidence, which plays an important role in revealing the formation mechanism of the surface residual deformation and the rational utilization of the mining subsidence area. Therefore, the study of mining fractures based on overburden critical failure is vital for the development of green mining technology, efficient gas drainage, accurate stability evaluation, and efficient ecological restoration of subsidence areas.
The mining overburden failure is a result of the combined effect of geological, mechanical, and engineering disturbance [10,11]. Combined with the overburden movement and failure characteristics, Qian et al. indicated that the characteristics of overburden movement depended on the breaking of hard strata, and proposed the key strata theory and masonry beam structure model, which suggested the direction for strata movement and ground control [12]. Based on the location of key strata, Xu et al. proposed a method to predict the height of overburden failure, a potential indicator of water diversion fracture zone height [13]. Rezaei et al. established a time-independent analytical model to determine the height of water conduction fracture zone, which incorporates both possible influencing geometrical and geo-mechanical parameters [14]. Li et al. established a mechanical model to describe the rotational motion of the masonry beam structure formed in the key stratum, and obtained the angular velocity equation of the rotational motion of the wedge beam structure in the key stratum [15]. Compared with field measurement, simulation analysis and geophysical methods can more intuitively observe and study the whole dynamic change process of overburden deformation and failure [16,17]. Ghabraie et al. used the physical models to investigate the subsidence mechanisms, and pointed out that the incremental subsidence and substrata movement profiles after lower seam extraction can be separated into three different zones [18]. Ju et al. studied the physical simulation of overburden failure based on sand particle size, providing effective guidance for the design of coal mining parameters [19]. Asaue et al. used the MT method to clarify the overburden structure in a coal-mining area in Kushiro, Japan [20]. Yu et al. analyzed and clarified the relationship between the overburden failure height and advancing distance of the working face, and put forward a formula for predicting the maximum overburden failure height of an ultra-thick coal seam in longwall mining [21]. Mills et al. measured shear movements in the overburden strata ahead of longwall mining by inclinometers [22]. Based on the time-space settlement model of overburden movement established by Han et al. [23], the movement of overburden under an advancing speed was clarified, and the mining stress characteristics under different advancing speed were explained. Combined with the variation of expansion coefficient, Xu et al. clarified the relationship between fracture path parameters, fracture angle, panel width, and mining height, establishing the trapezoidal fracture model of overburden failure to study the overburden collapse mode [24]. According to the division of water diversion fractures, Cao et al. analyzed their seepage mechanical characteristics, and constructed the main channel distribution model of a water conduction fracture zone based on the breaking size of key strata at the panel boundary [25]. Karacan and Goodman (2009) presented the results of downhole monitoring studies performed to estimate the changes in hydraulic conductivity (mainly horizontal permeability) [26]. By employing the combination of the full view borehole photography and seismic CT scanner techniques, Li et al. studied the deformation and failure of overlying strata of a fully mechanized caving face in a shallow coal seam and determined the failure development of the overburden [27]. Based on the two-block voussoir beam, Hu et al. revealed the strain distribution at the voussoir beam joint using a digital image correlation system and obtained the relationship between the transverse load and midspan displacement of the voussoir beam [28]. Shi and Zhang used physical modeling, numerical simulation and field observation to analyze the distribution characteristics of the overburden fracture rate in goaf and determined that the rock fracture rate decreased logarithmically with the increase of the distance from the coal seam [29]. Majdi et al. presented five mathematical approaches for estimating the height of the destressed zone and argued that while the short-term height of the destressed zone ranges from 6.5 to 24 times the mining height, it is 11.5 to 46.5 times the mining height in the long term [30]. He et al. systematically studied the height of the water conduction fracture zone in the layered overburden through similarity simulation, theoretical analysis, and engineering verification, and reflected on whether water inrush occurred in the coal mine by fracture penetration criterion value and compression tension ratio (i.e., the ratio of compressive to tensile stress) [31]. Guo et al. analyzed the relationship between the height of the water conduction fracture zone and the mining degree of the working face, proposed the definition of overburden critical failure, and put forward a prediction method of failure height based on overburden failure transfer theory [32].
Therefore, based on the key strata theory and the definition of overburden critical failure, combined with the overburden failure characteristics, with the mining fractures within the fracture zone as the research object, the overburden failure and structure formation conditions were analyzed in this study. Then, the regional division method of mining fractures was proposed, and its rationality was verified through surface movement and deformation monitoring, which provides a theoretical basis for safe mining under water-bodies, efficient gas drainage, and accurate ecological restoration of subsidence areas.
2. Overburden Critical Failure and Mining Fracture Distribution
The overburden failure height is the main index for realizing water-conservation mining, surface eco-environment protection, and green mine construction. The calculation accuracy lies in the development and distribution of overburden mining fractures [33,34,35], and the overburden mining fracture height depends on the mining degree of overburden failure. To accurately determine the mining degree of the overburden, the mining degree and characteristics of overburden failure must be analyzed.
2.1. Mining Degree of Overburden Failure
In recent years, the mining depth of coal mines in China extend downward by 8–12 m/year. For the strike longwall mining method, with the increase of mining depth, the ratio of panel size to mining depth gradually decreases. When it was less than 1.2–1.4, the mining degree of the working face changed from supercritical mining to subcritical mining. The surface movement and deformation did not generally reach the critical mining, which was the essence of realizing water-conservation mining, safe coal mining under buildings, and reduction of surface ecological environment damage. Based on the difference in the height of the water conduction fracture zone and the definition of mining degree, Guo and Lou defined overburden critical mining as the stage when the height of overburden failure reached the maximum under its geological conditions and did not increase with the increase of mining size [36]. Moreover, the theoretical discrimination method of overburden critical failure in longwall mining was proposed [37]. To further analyze the development characteristics and evolution of overburden failure height, combined with the definition of overburden critical failure (Figure 1), the characteristics of overburden mining degree were analyzed.
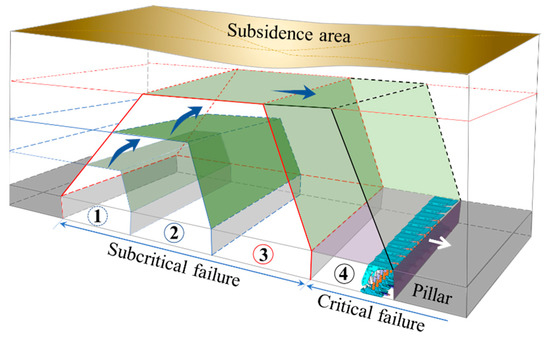
Figure 1.
Diagram of overburden critical failure.
The above figure shows that when the overburden reaches critical failure, there will be a stable separation space at the junction of the fracture and bending zones. With continuous mining of the panel, the contact state of the rock interface in the middle of the goaf will change from no contact to point–surface, line–surface, and surface–surface contacts, and the separation space will gradually decrease under the load of the bending zone. At this time, the failure height of overburden reaches the maximum.
Based on the equivalent substitution principle and the definition of a surface subsidence basin, when the overburden reaches critical failure, there is only one maximum subsidence point at the top of the fracture zone. With the continuous advancement of the working face, the subsidence of the top rock stratum does not increase and has a flat bottom shape. The fracture shape in the water conduction fracture zone is similar to that of a subsidence basin, which is in line with the saddle shape of high at both ends and low in the middle (Figure 2). Therefore, the maximum separation height is equivalent to the mining height at the same location, and the mining impact will continue to transfer upward.
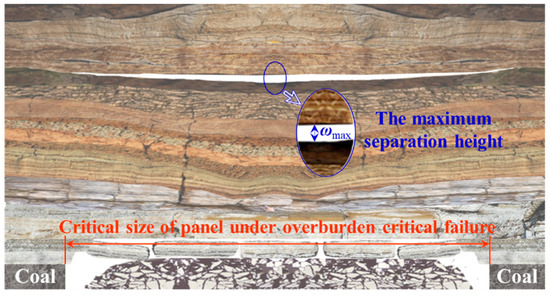
Figure 2.
Separation height of the overburden critical failure.
Therefore, for the working face where the height of the water conduction fracture zone does not reach the surface, when the overburden reaches critical failure, the surface has not reached critical mining; that is, the overburden reaches critical mining earlier than the surface. Combined with the characteristics of the bending zone, when the overburden failure height is taken as the research object, the overburden bending zone is equivalent to the homogeneous load applied on the top of the fracture zone, so as to analyze the mechanical characteristics of the masonry beam structure and crack development in the fracture zone. In addition, for coalmines with different geological and mining conditions, the number and location of overburden key strata and the height of water conduction fracture zone are different. It is necessary to determine the fracture angle according to overburden lithology and similar simulation methods. For working faces with different mining widths, when the mining size is small, the overburden damage does not reach critical mining, and there will be no void compaction area in the area of water conduction fracture zone, such as strip mining or other partial mining methods. Therefore, when gas drainage is carried out in the mining process, the drainage boreholes shall be arranged in the upper part of the structural void area as far as possible, so as to realize safe mining of the working face more efficiently.
2.2. Characteristics of Overburden Failure and Fracture Distribution
Based on the geological and mining conditions of Liangbei coalmine in Xuchang City, Henan Province, China, the characteristics of overburden failure and mining fracture distribution were analyzed by physical simulation test. Coal seam 21# of the Shanxi formation was mainly mined in the mining area, where the overlying strata were medium hard lithology. The coal seam dips at 5°, and the longwall panels were laid out along the strike. The panel length was 1200 m and panel width was 136 m with a mining height of 3 m under an average overburden depth of 580 m. The strike longwall coal mining caving method was used to manage the roof.
According to the regulations for mining under buildings, water-bodies, and railways, the calculation for the height of water conduction fracture zone is as shown in Formula (1):
where Hli is the height of the water conduction fracture zone, m; and M is the mining height, m.
From the above formula, the height of water conduction fracture zone is calculated as 30.1–41.3 m, i.e., it ranges from 10 to 14 times the mining height. To analyze the impact of coal mining on overburden more intuitively, the coal seam is leveled. Combined with the dimensions of the working face and physical simulation test-bed (long × wide × high = 2.5 m × 0.2 m × 1.2 m), the rock strata 63.2 m above the coal seam are simulated with a geometric ratio of 1:50, a time ratio of 1:10, bulk density ratio of 3:5, Poisson’s ratio of 1, strength and elastic modulus ratio of 0.012, external force ratio of 2 × 10⁻⁶. Meanwhile, the remaining rock strata are uniformly applied on the top of the model with a load of 0.3 MPa. The physical simulation material selects fine sand as aggregate and calcium carbonate and gypsum as cementitious materials, borax as retarder, mica powder as weak surface between rock layers, and water as solvent. By changing the different ratio of materials, the rock layers with different strength in overburden are simulated. The mechanical parameters of each rock stratum in the model are shown in Table 1.

Table 1.
Rock mechanics parameters of the physical model.
Based on the overburden failure under the mining influence, the relationship between overburden structure and periodic pressure after mining 87 m of the working face is shown in Figure 3.
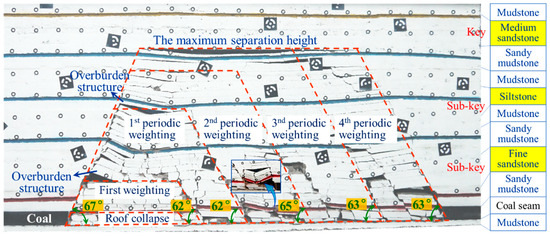
Figure 3.
Overburden structure and periodic weighting.
Figure 3 shows that there are overburden structures and through cracks when the overburden fracture is under periodic pressure, and the overburden failure is trapezoidal distribution (36.4 m from the coal seam roof). In the vertical direction, when the height of the caved zone is reached, the overburden in the fracture zone forms a triangular spatial structure with different shapes at the breaking position. This is primarily due to the different fracture distances of each sub-key layer. With periodic pressure, the overburden structure periodically develops in the form of “formation–stability–instability–stability” as the panel advances. The average breaking angle in the advancing direction is 62–65°, which is less than 67° of the overburden at the setup room, showing a typical skewness phenomenon [38]. The overburden structure at the boundary of goaf is usually a permanent structure and is one of the sources of residual surface deformation in goaf. Moreover, it is also the main research object of water conservation mining, gas drainage and goaf stability evaluation.
Combined with the overburden failure characteristics under the mining influence, taking the fracture zone as the research area, the mining fractures in this area display obvious zoning characteristics in the horizontal direction, as follows:
- Only tensile or fine fractures. After the mining of the working face is completed, the setup room and stopping line of the working face are bounded by the fracture angle formed by overburden failure on one side of the coal pillar; the mining impact is tensile deformation or no impact. At this time, there are only tensile or original fractures in the overburden, i.e., the area ranges from the coal pillar side to the overburden fracture;
- Obvious overburden structure. When the overburden is broken to a certain height layer by layer under the mining influence, the broken block is hinged to form a masonry beam structure because the free space below does not meet the conditions of rock block sliding and instability. With the upward transmission of rock fracture, the sub-key layer within the fracture zone forms a hinged structure owing to the large fracture distance, and its return angle gradually decreases with the increase of the distance from the coal seam roof until it is transmitted to the top of the fracture zone, forming an obvious layer separation. Then, the mining fractures are the permanent through ones;
- Closure of mining cracks in the overburden. As the working face advances, the mining cracks located in the fracture zone are developed periodicity in form of “formation-penetration-closure-compaction”. When the overburden reaches critical mining, the mining cracks and separation layers gradually close under the periodic pressure of the main roof above the working face, reducing the water conductivity of the rock strata. Meanwhile, the equivalent subsidence coefficient reaches maximum. The caved zone and fracture zone are compacted within this range, therefore, the surface in the middle of the goaf is also the target area for effective utilization of the mining subsidence area due to the small surface residual deformation in this area.
Based on the above analysis, mining fractures are concentrated in the overburden structure at the boundary of the working face. When there are multiple sub-key layers in the fracture zone, the fracture angles of the rock strata differ slightly with the mechanical properties and burial depth. Therefore, it is necessary to analyze the damage and structure formation of the hard rock strata.
3. Hard Rock Failure and Structure Formation
Based on the key layer theory, the key layer controls the movement and deformation of the multi-layer rock above it. When the overburden failure is transmitted to the key layer, the failure will occur when the separation space length reaches the breaking distance of key layer. This process can be simplified as the shear failure of the key layer under the overburden load. When the shear stress reaches the peak, the rock sample will break, and its shear displacement can be used as the maximum value of rock bending and subsidence. Combined with the geological and mining conditions of the working face and based on the key strata theory, there are two sub-key layers in the fracture zone, and their lithology is sandstone. Therefore, the displacement of sandstone should be studied when the hard rock strata are broken.
3.1. Shear Deformation Test
As the shear test of the rock samples is related to the joint surface roughness and normal stress, this test only considers the influence of joint surface roughness and different normal stress on the shear test. By scanning the joint surface of the cylinder sample (50 mm × 100 mm) with a three-dimensional laser scanner, the slope root mean square Z2 of 16 interface bisected section lines is calculated according to Formula (2) [39]:
where Zi is the height coordinate of the joint surface profile; l is the number of data points; and Δx is the interval of data points.
The roughness of each section line (JRCi) can be calculated by substituting each two-dimensional section line (Z2i) into Formula (3) [40]. The joint roughness coefficient of the rock sample can be obtained by taking the weighted average value of the roughness of each section line:
where Z2i is the root mean square of the slope for the ith contour line; and JRCi is the roughness coefficient of the ith contour line.
To analyze the stress–strain characteristics of rock samples at different mining depths, nine groups of rock samples were subjected to shear testing. The shear rate was set to 1 mm/min and terminated when the displacement reached 8 mm. The test parameters are shown in Table 2.
Table 2.
Shear test parameters for each rock sample.
Based on the normal stress, normal displacement, shear stress, and shear displacement obtained during the test, the shear stress displacement curve of sandstone joints was obtained, as shown in Figure 4.
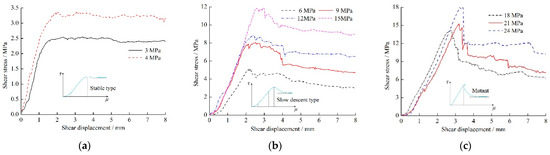
Figure 4.
Shear stress displacement curves under different normal stresses. (a) Stable type; (b) Slow descent type; and (c) Mutant.
As seen in Figure 4, the shear stress displacement curve first increases and then decreases under different normal stresses. The process can be divided into compaction, linear, yield, and softening stages. In the post peak softening stage, the amplitude and rate of the decreasing shear stress increase with the increase of normal stress. The change characteristics of each stage are as follows:
- Compaction stage. Owing to the incomplete contact between joint bulges (roughness) in the initial state, the contact area and pressure of joint bulges increase with the increase of shear displacement, and the shear stress increases nonlinearly;
- Linear stage. When the displacement increases, the undamaged contact joint bulge increases the friction between joints, and the shear stress increases linearly;
- Yield stage. The shearing of the joint bulge reduces the roughness coefficient and causes the shear stress to increase slowly until the shear bearing capacity of the joint reaches its peak;
- Softening stage. With the increase of normal stress, the roughness of the joint surface smooths gradually, which shows that the reduction of shear stress increases with the increasing normal stress.
In conclusion, with the increase of shear stress, the damage degree of the sample also increases gradually, and obvious failure occurs when the normal stress is greater than 6 MPa. According to geological and mining conditions, the original rock load of overburden bending zone is approximately about 15 MPa. At this time, the displacement of the rock strata at peak stress is approximately about 5% of the sample along the shear direction. Combined with the shear test of joint samples with different lengths [41], the maximum subsidence deflection of the rock strata under the corresponding overburden load is 5% of the thickness of the broken rock strata.
3.2. Formation and Stability of Overburden Structure
Under the mining influence, when the rock stratum reaches the limit breaking distance, it breaks and forms a caved zone. There are voids between broken rocks in the caved zone, when reaching a certain height, therefore, the free space height under the rock layer directly affects the contact between rock blocks and is the key factor for forming the overburden structure.
When the buried depth of the coal seam is large, the rock layer before failure can be regarded as a beam model with a rectangular section, and the overburden load is evenly distributed above it. Combined with the key strata theory and fixed beam model, the maximum deflection of the fixed beam ωmax can be obtained by Formula (4) [42]:
where h is the thickness of the structural rock stratum, m; σt is its tensile strength, MPa; q is the load borne by the rock, MPa; E is the elastic modulus, MPa; and b is the width of the rectangular section, m.
From the above formula, the maximum bending deformation before the initial fracture of rock stratum is shown to be primarily affected by its own mechanical parameters and ratio of thickness to width. To improve the feasibility of the maximum rock strata deflection in engineering, combined with the stress-strain characteristics of sandstone during the shear test, five percent of the strata thickness is set as its maximum subsidence deflection, and the following assumptions are made: (1) the hard rock stratum is regarded as a homogeneous continuum, and the masonry beam structure is formed when it is broken for the first time; (2) the key blocks in contact with the collapse zone are paved above that zone and are in a stable state due to the overburden load; and (3) the expansion coefficient of the caved zone is the final constant value, which has little effect on the overburden structure. Therefore, when the overlying strata form a masonry beam structure, the conditions meet the following formula:
where ωmax is 0.05 h, m; L is the initial limit breaking distance of the rock stratum, m; θ is the angle for the key blocks of the overburden structure, °; Hm is the height of the caved zone, m; k0 is the expansion coefficient of the caved zone; and M is the mining thickness of the coal seam, m.
Combined with the sliding-rotation stability theory of surrounding rock structure [43], the conditions for no instability of the key blocks in the masonry beam are as follows:
where i = h/lz, lz is the length of the periodic broken block, m; tan φ is the friction coefficient between broken blocks, 0.3; P is the load on the key block, MN; and σc is the compressive strength of the rock stratum, MPa.
Based on the physical simulation test and mining conditions of adjacent working faces, the initial breaking distance of the working face is 42.4 m; therefore, the length of the broken block is 21.2 m. According to Formula (5), the angle of the overburden structure, θ, is 5.12°; the periodic pressing step lz near the working face is approximately 10 m, and the load on the key block is P = γ(Hli − Hm), approximately 1.02 MPa. The overburden structure meets the required conditions for no instability.
4. Regional Division Method and Discussion of Mining Fracture
4.1. Division and Discrimination of Mining Fractures in Overburden
Mining fracture is the main basis for ensuring the safe mining under water and efficient gas drainage, evaluating the stability of overburden and revealing the mechanism of surface residual deformation in abandoned goaf. Combined with the physical simulation of the overburden migration under mining influence, through the layout of survey lines in the overburden fracture zone, the separation rate distribution of each layer is shown in Figure 5.
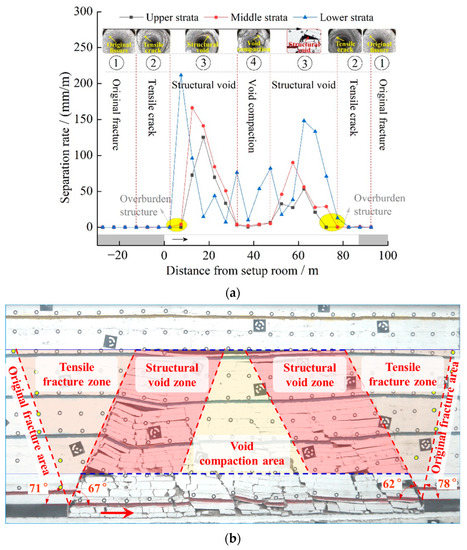
Figure 5.
Distribution and division of mining fracture. (a) Distribution of separation rate in the fracture zone; (b) Division of overburden fracture under coal mining.
As shown in Figure 5a, (1) the shape of the separation rate curve for different layers in the overburden fracture zone is basically the same, a saddle shape with a high at both ends and a low in the middle; (2) the layer separation rate at the side of the setup room in the same layer is greater than that at the stopping line because the length and compaction time of the broken rock block at the side of the setup room are greater than that at the stopping line; (3) there are relatively few separated layers in the middle of the goaf due to the re-compaction of the broken rock block by overburden load, resulting in the closure of mining fractures; and (4) with the increase of the overburden failure height, the position of the maximum separation rate of the rock stratum shifts to the center of the goaf, indicating that the overburden structure in the fracture zone is trapezoidal upward conduction. Therefore, within the range of the overburden fracture zone, the representative positions of mining fracture are the boundary and center of goaf and the overburden structure. Then, the fracture zone is divided into “four horizontal zones”: original fracture, tensile fracture, structural void, and void compaction, as shown in Figure 5b.
The height of the fracture zone is the range of each area in the vertical direction, and the boundaries in the horizontal direction are defined as follows:
- Original fracture area. Combined with the mining subsidence theory and the maximum bending deflection of the rock stratum, the boundary with an inclination value of 3 mm/m (layer separation rate of 3‰) in the movement angle is the boundary between the original and tensile fractures, which is the position of the yellow point in the Figure 5b;
- Tensile fracture zone. The connecting line between the measuring point with an inclination value of approximately 3 mm/m in the physical simulation and the mining boundary is taken as the boundary between the original and the tensile fracture zones. The interface angle at the setup room of the working face is 71°, while at the stopping line, it is 78°. The rock block forms a masonry beam structure after the overburden is broken, therefore, the overburden shape and stress state change significantly. Therefore, the overburden fracture is taken as another boundary of the tensile fracture area. The length l1 of this area at the top of the fracture zone is:where Hli is the height of the water conduction fracture zone and can be calculated in the regulation, which is 36.4 m; and θ1 and θ2 are the movement and breaking angles of the overburden, respectively, at 71° and 67°. The length of this area is 27.98 m, and the length within the goaf is 15.45 m;
- Structural void zone. The structural void zone begins when the masonry beam structure is formed. With the advance of the working face, as the fracture zone reaches the maximum, the separation gap between the fracture and bending zones reaches the maximum, and the overburden reaches the critical failure. Then, the midpoint of the ultimate breaking distance of the rock stratum at the bottom of the bending zone is taken as the base point, and the rock strata breaking boundaries are created parallel to the overburden structure. The area between the adjacent boundary lines is the structural fracture area. The relationship between overburden failure height and separation void meets the following conditions:The bending deflection of the hard rock layer at the upper part of the fracture zone is the largest when it reaches the initial limit breaking distance. According to the above formula, when the overburden failure reaches the critical height and the adjacent layer reaches the initial limit breaking distance L, the advancing distance of working face with overburden critical mining is the largest, i.e., Ls = Hli(cot θ’1 + cot θ’2) + L. Ls = 79.6 m, and the error from the critical advancing distance (75 m) of the working face in Figure 5 is only 5.7%. Therefore, this formula can be used to determine the advancing distance of working face when the overburden failure reaches critical mining, and also to determine the range of the structural fracture area, providing a basis for overburden separation grouting and goaf stability evaluation;
- Void compaction area. After overburden failure reaches supercritical mining, the separation gap of the rock stratum at the bottom of the bending zone reaches the maximum, which is equivalent to the bottom of the surface subsidence basin. This area is located in the middle of the structural fracture area. Combined with Figure 5 and the evolution of overburden fractures, it is consistent with the physical simulation.
4.2. Engineering Practice
Combined with the geological and mining conditions of the Liangbei coalmine, the surface movement and deformation enter into the decline stage (the surface subsidence rate is lower than 1.67 mm/d) after mining ceased five years (2019). A surface movement observation station is arranged above the coalfield, and the relationship between measuring points and working face is shown in Figure 6. It should be noted that in the physical simulation, the distribution of mining overburden voids is along the advancing direction of the working face, while the on-site monitoring is perpendicular to the advancing direction. This is mainly because the overburden damage and void distribution on the strike of the working face are basically consistent with the tendency. Therefore, the on-site monitoring data can verify the characteristics of overburden void distribution.
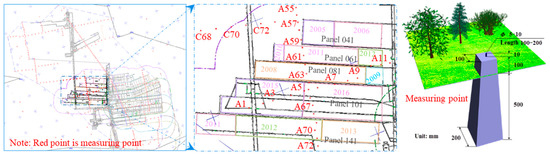
Figure 6.
Location of old goaf and surface survey points.
Real-time kinematic have been used to monitor the surface residual deformation for 2 years, and the cumulative subsidence of the surface measurement points (A1–A12, A57–A72) is obtained, as shown in Figure 7.
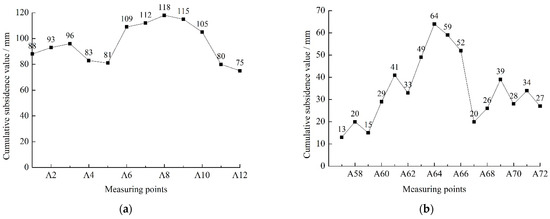
Figure 7.
Cumulative surface subsidence in the goaf. (a) Measuring points A1–A12 (February 2019–October 2021). (b) Measuring points A57–A72 (February 2019–October 2021).
As shown in Figure 7a, in the near strike direction of the old goaf, the subsidence of the monitoring point at the boundary of the panel goaf is greater than that at the middle of the goaf. Primarily, overburden structure and voids are observed in the uncompact caved zone on both sides of the goaf. The cumulative maximum subsidence value of A8 at the boundary of the working face is 118 mm, which is mainly due to the latest mining time of the 101 panel, and the surface movement and deformation may not enter the decline stage.
To eliminate the influence of surface movement and deformation not fully entering the decline stage, the subsidence points of A54–A72 were measured from February 2019 to October 2021. As seen in Figure 7b, the cumulative subsidence curve of the measuring point shows first increasing and then decreasing variation characteristics. The subsidence value reaches the maximum at measuring point A64, which also verifies the accuracy of the above analysis. After passing point A68, the subsidence curve presents a wavy shape, owing to the fact that the measuring point at the rising point is located at the boundary of the working face and the one at the lowering point is located in the middle of the goaf, indicating that the void at the overburden structure gradually decreases under the long-term bearing action; the middle of the goaf will further compact the caved and fracture zones. However, the decline on both sides of the goaf is greater than that in the middle, which also verifies the rationality of overburden regional division.
5. Conclusions
- (1)
- Based on the overburden critical failure, the characteristics of overburden fracture were analyzed. The fracture zone was divided horizontally into original rock fracture, tensile fracture, structural void, and void compaction areas, and the description of each area was proposed;
- (2)
- The formation mechanism for the shape of the water conduction fracture zone was determined to be the same as the surface mining subsidence. The relationship between the maximum subsidence deflection of the hard rock layer and the thickness of the broken rock layer was clarified with the deduced theoretical formula, and the masonry beam structure was found to have long-term stability;
- (3)
- Based on field monitoring of surface deformation, the subsidence characteristics of measurement points at different positions above the working face were analyzed. The overburden structure on both sides of the working face and the void in the uncompact caved zone was suggested to be the main factor causing different subsidence of the measuring points, and the rationality of overburden regional division was verified, which is vital for safe mining under water, accurate restoration of the eco-environment in mining subsidence areas, sustainable development of the mining industry, and economic growth.
Author Contributions
Conceptualization, E.B. and W.G.; methodology, E.B., W.G. and Y.T.; formal analysis, E.B., M.G. and P.W.; investigation, E.B., Z.M. and W.Y.; data curation, E.B., Y.T. and Z.L.; writing—original draft preparation, E.B.; writing—review and editing, Y.T. and W.G.; funding acquisition, E.B., W.G. and Y.T. All authors have read and agreed to the published version of the manuscript.
Funding
This research was funded by the National Natural Science Foundation of China (52104127 and 51974105), the Key Project of the National Natural Science Foundation of China (U21A20108 and U1810203), the Research fund of Henan Key Laboratory for Green and Efficient Mining & Comprehensive Utilization of Mineral Resources (Henan Polytechnic University) (KCF202002), the Key Scientific Research Projects of Colleges and Universities in Henan Province (21A440003), the Henan Science and Technology Research Project (212102310399 and 222102320058), the Open fund of State Key Laboratory of Coal Resources in Western China (SKLCRKF20-01), and the Open Fund of Shaanxi Key Laboratory of Geological Support for Coal Green Exploitation (DZBZ2020-04).
Institutional Review Board Statement
Not applicable.
Informed Consent Statement
Not applicable.
Data Availability Statement
Relevant data are listed in the paper.
Conflicts of Interest
The authors declare no conflict of interest.
References
- Bell, F.G.; Stacey, T.R.; Genske, D.D. Mining subsidence and its effect on the environment: Some differing examples. Environ Geol. 2020, 40, 135–152. [Google Scholar] [CrossRef]
- Fan, L.M.; Ma, X.D. A review on investigation of water-preserved coal mining in western China. Int. J. Coal Sci. Technol. 2018, 5, 411–416. [Google Scholar] [CrossRef]
- Karakus, M.; Tutmez, B. Fuzzy and Multiple Regression Modelling for Evaluation of Intact Rock Strength Based on Point Load, Schmidt Hammer and Sonic Velocity. Rock Mech. Rock Eng. 2006, 39, 45–57. [Google Scholar] [CrossRef]
- Bai, E.H.; Guo, W.B.; Tan, Y. Negative externalities of high-intensity mining and disaster prevention technology in China. Bull. Eng. Geol. Environ. 2019, 78, 5219–5235. [Google Scholar] [CrossRef]
- Sun, Q.; Zhang, J.X.; Li, M.; Zhou, N. Experimental evaluation of physical, mechanical, and permeability parameters of key aquiclude strata in a typical mining area of China. J. Clean. Prod. 2020, 267, 122109. [Google Scholar] [CrossRef]
- Sasaoka, T.; Takamoto, H.; Shimada, H.; Oya, J.; Hamanaka, A.; Matsui, K. Surface subsidence due to underground mining operation under weak geological condition in Indonesia. J. Rock Mech. Geotech. Eng. 2015, 7, 337–344. [Google Scholar] [CrossRef]
- Yu, S.C.; Xu, J.M.; Zhu, W.B.; Wang, S.H.; Liu, W.B. Development of a combined mining technique to protect the underground workspace above confined aquifer from water inrush disaster. Bull. Eng. Geol. Environ. 2020, 79, 3649–3666. [Google Scholar] [CrossRef]
- Altun, A.O.; Yilmaz, I.; Yildirim, M. A short review on the surficial impacts of underground mining. Sci. Res. Essay 2010, 21, 3206–3212. [Google Scholar]
- Yang, B.B.; Yuan, S.C.; Liang, Y.K.; Liu, J.W. Investigation of overburden failure characteristics due to combined mining: Case study, Henan Province, China. Environ. Earth Sci. 2021, 80, 143. [Google Scholar] [CrossRef]
- Kim, J.M.; Parizek, R.R.; Elsworth, D. Evaluation of fully-coupled strata deformation and groundwater flow in response to longwall mining. Int. J. Rock Mech. Min. Sci. 1997, 34, 1187–1199. [Google Scholar] [CrossRef]
- Wang, G.; Wu, M.M.; Wang, R.; Xu, H.; Song, X. Height of the mining-induced fractured zone above a coal face. Eng. Geol. 2017, 216, 140–152. [Google Scholar] [CrossRef]
- Qian, M.G.; Miao, X.X.; Xu, J.L. Theoretical study of key stratum in ground control. J. China Coal Soc. 1996, 21, 225–230. [Google Scholar]
- Xu, J.L.; Zhu, W.B.; Wang, X.Z. New method to predict the height of fractured water-conducting zone by location of key strata. J. China Coal Soc. 2012, 37, 762–769. [Google Scholar]
- Rezaei, M.; Hossaini, M.F.; Majdi, A. A time-independent energy model to determine the height of destressed zone above the mined panel in longwall coal mining. Tunn. Undergr. Space Technol. 2015, 47, 81–92. [Google Scholar] [CrossRef]
- Li, Z.; Xu, J.L.; Ju, J.F.; Zhu, W.B.; Xu, J.M. The effects of the rotational speed of voussoir beam structures formed by key strata on the ground pressure of stopes. Int. J. Rock Mech. Min. Sci. 2018, 108, 67–79. [Google Scholar] [CrossRef]
- Castro, T.; Trueman, R.; Halim, A. A study of isolated draw zones in block caving mines by means of a large 3D physical model. Int. J. Rock Mech. Min. Sci. 2007, 44, 860–870. [Google Scholar] [CrossRef]
- Hatherly, P. Overview on the application of geophysics in coal mining. Int. J. Coal Geol. 2013, 114, 74–84. [Google Scholar] [CrossRef]
- Ghabraie, B.; Ren, G.; Zhang, X.; Smith, J. Physical modelling of subsidence from sequential extraction of partially overlapping longwall panels and study of substrata movement characteristics. Int. J. Coal Geol. 2015, 140, 71–83. [Google Scholar] [CrossRef]
- Ju, M.H.; Li, X.H.; Yao, Q.L.; Liu, S.Y.; Liang, S.; Wang, X.L. Effect of sand grain size on simulated mining-induced overburden failure in physical model tests. Eng. Geol. 2017, 226, 93–106. [Google Scholar] [CrossRef]
- Asaue, H.; Sasahara, M.; Yoshinaga, T.; Obara, Y.; Uchida, K.; Matsumoto, H. Clarifying geological structure for coal and marsh gas development using magnetotelluric method. Acta Geodyn. Geomater. 2013, 10, 155–162. [Google Scholar] [CrossRef][Green Version]
- Yu, B.; Zhao, J.; Kuang, T.J.; Meng, X.B. In situ investigations into overburden failures of a super-thick coal seam for longwall top coal caving. Int. J. Rock Mech. Min. Sci. 2015, 78, 155–162. [Google Scholar] [CrossRef]
- Mills, K.W.; Garratt, O.; Blacka, B.G.; Daigle, L.C.; Rippon, A.C.; Walker, R.J. Measurement of shear movements in the overburden strata ahead of longwall mining. Int. J. Min. Sci. Technol. 2015, 26, 97–102. [Google Scholar] [CrossRef]
- Han, P.H.; Zhang, C.; Ren, Z.P.; He, X.; Jia, S. The influence of advance speed on overburden movement characteristics in longwall coal mining: Insight from theoretical analysis and physical simulation. J. Geophys. Eng. 2021, 18, 163–176. [Google Scholar] [CrossRef]
- Xu, D.J.; Peng, S.P.; Xiang, S.Y.; He, Y.L. A Novel Caving Model of Overburden Strata Movement Induced by Coal Mining. Energies 2017, 10, 476. [Google Scholar] [CrossRef]
- Cao, Z.G.; Ju, J.F.; Xu, J.L. Distribution model of water-conducted fracture main channel and its flow characteristics. J. China Coal Soc. 2019, 44, 3719–3728. [Google Scholar]
- Karacan, C.O.; Goodman, G. Hydraulic conductivity changes and influencing factors in longwall overburden determined by slug tests in gob gas ventholes. Int. J. Rock Mech. Min. Sci. 2009, 46, 1162–1174. [Google Scholar] [CrossRef]
- Li, S.; Fan, C.J.; Luo, M.K.; Yang, Z.H.; Lan, T.W.; Zhang, H.F. Structure and deformation measurements of shallow overburden during top coal caving longwall mining. Int. J. Min. Sci. Technol. 2017, 27, 1081–1085. [Google Scholar] [CrossRef]
- Hu, C.S.; Apel, D.; Sudak, L.J.; Liu, W.V.; Chu, Z.Y. Physical investigation on the behaviours of voussoir beams. J. Rock Mech. Geotech. 2020, 12, 516–527. [Google Scholar] [CrossRef]
- Shi, X.C.; Zhang, J.X. Characteristics of overburden failure and fracture evolution in shallow buried working face with large mining height. Sustainability 2021, 13, 13775. [Google Scholar] [CrossRef]
- Majdi, A.; Hassani, F.P.; Nasiri, M.Y. Prediction of the height of destressed zone above the mined panel roof in longwall coal mining. Int. J. Coal Geol. 2012, 98, 62–72. [Google Scholar] [CrossRef]
- He, C.C.; Lu, W.Y.; Zha, W.H.; Wang, F. A geomechanical method for predicting the height of a water-flowing fractured zone in a layered overburden of longwall coal mining. Int. J. Rock Mech. Min. Sci. 2021, 143, 104798. [Google Scholar] [CrossRef]
- Guo, W.B.; Zhao, G.B.; Lou, G.Z.; Wang, S.R. A New Method of Predicting the Height of the Fractured Water-Conducting Zone Due to High-Intensity Longwall Coal Mining in China. Rock Mech. Rock Eng. 2018, 52, 2789–2802. [Google Scholar] [CrossRef]
- Palchik, V. Formation of fractured zones in overburden due to longwall mining. Environ. Geol. 2003, 44, 28–38. [Google Scholar] [CrossRef]
- Zhou, D.W.; Wu, K.; Miao, X.X. Combined prediction model for mining subsidence in coal mining areas covered with thick alluvial soil layer. Bull. Eng. Geol. Environ. 2018, 77, 283–304. [Google Scholar] [CrossRef]
- Bai, E.H.; Guo, W.B.; Zhang, D.S.; Tan, Y.; Guo, M.J.; Zhao, G.B. Using the Magnetotelluric Method for Detecting Aquifer Failure Characteristics under High-Intensity Mining of Thick Coal Seams. Energies 2019, 12, 4397. [Google Scholar] [CrossRef]
- Guo, W.B.; Lou, G.Z. Definition and distinguishing method of critical mining degree of overburden failure. J. China Coal Soc. 2019, 44, 755–766. [Google Scholar]
- Guo, W.B.; Zhao, G.B.; Bai, E.H. Critical failure of overlying rock strata and its criteria induced by high-intensity longwall mining. J. China Coal Soc. 2020, 45, 3657–3666. [Google Scholar]
- Yu, Q.G.; Zhang, H.X.; Deng, W.N.; Zou, Y.P. Analysis of influencing factors of surface skewed subsidence based on key strata theory. J. China Coal Soc. 2018, 43, 1322–1327. [Google Scholar]
- Tian, Y.C.; Liu, Q.S.; Liu, D.F.; Kang, Y.S.; Deng, P.H.; He, F. Updates to Grasselli’s Peak Shear Strength Model. Rock Mech. Rock Eng. 2018, 51, 2115–2133. [Google Scholar] [CrossRef]
- Li, Y.R.; Zhang, Y.B. Quantitative estimation of joint roughness coefficient using statistical parameters. Int. J. Rock Mech. Min. Sci. 2015, 77, 27–35. [Google Scholar] [CrossRef]
- Barton, N.; Choubey, V. The shear strength of rock joints in theory and practice. Rock Mech. 1977, 10, 1–54. [Google Scholar] [CrossRef]
- Chen, L.; Wu, B.; Xu, X.K.; Shang, Y.R. Determination of overburden failure height in alternate strata of mudstone and sandstone with fully mechanized caving method. J. Min. Saf. Eng. 2017, 34, 431–436. [Google Scholar]
- Qian, M.G.; Zhang, D.L.; Li, L.J.; Kang, L.X.; Xu, J.L. “S-R” stability for the voussoir beam and its application. Coal Technol. Northeast China 1994, 3, 6–10. [Google Scholar]
Publisher’s Note: MDPI stays neutral with regard to jurisdictional claims in published maps and institutional affiliations. |
© 2022 by the authors. Licensee MDPI, Basel, Switzerland. This article is an open access article distributed under the terms and conditions of the Creative Commons Attribution (CC BY) license (https://creativecommons.org/licenses/by/4.0/).