Improving Water Quality in the Citarum River through Economic Policy Approaches
Abstract
1. Introduction
1.1. Research Background
1.2. Research Objectives
2. Materials and Methods
2.1. Overview of the Study Area
2.2. Simulation Conditions
2.3. Policies to Be Introduced
2.4. Setting up the Simulation Case
2.5. Formulation of the Model
2.5.1. Water Pollutant Flow Balance Model
- Water pollutant loads flowing into the Citarum River
- 2.
- Load of water pollutants from household sources:
- 3.
- Load of water pollutants from non-point sources:
- 4.
- Load of water pollutants from industrial activities:
2.5.2. Socio-Economic Model
- Household generation sources:
- a. Population of each area
- b. Population using each domestic wastewater treatment facility
- c. Population using the sewerage system
- d. Construction investment for the sewerage system
- e. Maintenance cost of the sewerage system
- f. Subsidization for the installation of septic tanks
- 2.
- Non-point generation sources:
- a. Land use
- b. Change in land use
- 3.
- Industrial generation sources:
- a. Production function and curtailment
- b. Accumulation of the working capital
- 4.
- The cost of the Citarum River water quality improvement measures:
- 5.
- Flow balance in commodity markets:
2.5.3. Social Cost
2.5.4. Constraints on the Inflow of Water Pollutants
3. Results
3.1. Analysis of the Current Situation and Setting of the Simulation Criteria
3.2. Simulation Results
3.3. Estimation of Social Costs in Each Case
4. Discussion
4.1. Discussion of Main Results
4.2. Determination of the Optimal Inflow Rate Target
5. Conclusions
5.1. Summary
5.2. Limitation of the Study
Author Contributions
Funding
Institutional Review Board Statement
Informed Consent Statement
Data Availability Statement
Conflicts of Interest
References
- Zaidi, S.A.H.; Zafar, M.W.; Shahbaz, M.; Hou, F. Dynamic linkages between globalization, financial development and carbon emissions: Evidence from Asia Pacific Economic Cooperation countries. J. Clean. Prod. 2019, 228, 533–543. [Google Scholar] [CrossRef]
- Chen, J.; Zhou, C.; Wang, S.; Li, S. Impacts of energy consumption structure, energy intensity, economic growth, urbanization on PM2. 5 Concentrations in countries globally. Appl. Energy 2018, 230, 94–105. [Google Scholar] [CrossRef]
- Zhang, C.; Wang, Y.; Song, X.; Kubota, J.; He, Y.; Tojo, J.; Zhu, X. An integrated specification for the nexus of water pollution and economic growth in China: Panel cointegration, long-run causality and environmental Kuznets curve. Sci. Total Environ. 2017, 609, 319–328. [Google Scholar] [CrossRef] [PubMed]
- Guo, L.L.; Qu, Y.; Tseng, M.L. The interaction effects of environmental regulation and technological innovation on regional green growth performance. J. Clean. Prod. 2017, 162, 894–902. [Google Scholar] [CrossRef]
- Yang, W.; Song, J.; Higano, Y.; Tang, J. Exploration and assessment of optimal policy combination for total water pollution control with a dynamic simulation model. J. Clean. Prod. 2015, 102, 342–352. [Google Scholar] [CrossRef]
- Hirose, F. Environmental Policy for Reducing Influent Pollutants in the Kasumigaura Basin. Master’s Thesis, University of Tsukuba, Ibaraki, Japan, 2000. [Google Scholar]
- Mizunoya, T.; Sakurai, K.; Kobayashi, S.; Higano, Y. Simulation analysis for an optimal environmental policy including the introduction of new technologies. Stud. Reg. Sci. 2007, 37, 199–227. [Google Scholar] [CrossRef][Green Version]
- Mizunoya, T.; Nozaki, N.; Singh, R.K. Impact of the municipal merger on watershed management: A study of Lake Kasumigaura, Japan. Asia-Pac. J. Reg. Sci. 2021, 5, 673–704. [Google Scholar] [CrossRef]
- Nozaki, N. Simulation Analysis of Environmental and Economic Policies for Simultaneous Reduction of Environmental Pollutants in Water and Air in Tokyo. Ph.D. Thesis, University of Tsukuba, Ibaraki, Japan, 2020. Available online: https://tsukuba.repo.nii.ac.jp/records/55083#.YXFCqZ7P02y (accessed on 28 October 2021).
- Kerstens, S.M.; Hutton, G.; Firmansyah, I.; Leusbrock, I.; Zeeman, G. An integrated approach to evaluate benefits and costs of wastewater and solid waste management to improve the living environment: The Citarum River in west Java, Indonesia. J. Environ. Prot. 2016, 7, 1439. [Google Scholar] [CrossRef][Green Version]
- Ministry of the Environment. Current Status of Environmental Pollution in Indonesia. 2016. Available online: https://www.env.go.jp/air/tech/ine/asia/indonesia/files/pollution/files/pollution2016.pdf (accessed on 10 October 2020).
- West Java Province Environment Agency. NANJING. 2015. Available online: http://dlh.jabarprov.go.id/index.php/layanan/dokumen/kualitas-air/lampiran-storet-sungai-citarum/81-nanjung/file (accessed on 20 August 2020).
- West Java Environment Agency. Activity Resume PPK DAS Citarum Year 2020. 2021. Available online: https://www.oecc.or.jp/jprsi/event/envweek/program/files/20210115_sem_7-opening_westjava.pdf (accessed on 9 June 2021).
- Yamagishi, M. Simulation Analysis for Reduction of Air and Water Pollutants in the Tone River Basin, Chiba, Japan. Master’s Thesis, University of Tsukuba, Ibaraki, Japan, 2018. [Google Scholar]
- Japan International Cooperation Agency; Nihon Suido Consultants Co., Ltd. The Republic of Indonesia, Development of Basic Design of Draft Management Criteria for Sewerage Service Providers: Basic Design of Draft Management Criteria for Sewerage Service Providers: Final. 2010. Available online: https://openjicareport.jica.go.jp/pdf/252904.pdf (accessed on 4 November 2021).
- World, B. Urban Sanitation Review: Indonesia Country Study. Washington, DC. 2013. Available online: https://openknowledge.worldbank.org/handle/10986/17614 (accessed on 10 January 2021).
- Japan International Cooperation Agency; Daie Industry Co., Ltd. Feasibility Study on the Introduction of Septic Tanks as a Decentralized Wastewater Treatment System for Public Facilities in Indonesia Project Completion Report. 2017. Available online: https://openjicareport.jica.go.jp/pdf/12288510.pdf (accessed on 26 November 2021).
- Statistics of Jawa Barat. Total Population by Regency/City (People), 2015–2017. 2020. Available online: https://jabar.bps.go.id/indicator/12/133/2/total-population-by-regency-city.html (accessed on 26 November 2021).
- Statistics of Jawa Barat. Number of Households by Regency/City in Jawa Bara Province (household), 2015–2017. 2020. Available online: https://jabar.bps.go.id/indicator/12/131/2/number-of-households-by-regency-city-in-jawa-bara-province.html (accessed on 26 November 2021).
- Agaton, M.; Setiawan, Y.; Effendi, H. Land use/land cover change detection in an urban watershed: A case study of upper Citarum Watershed, West Java Province, Indonesia. Procedia Environ. Sci. 2016, 33, 654–660. [Google Scholar] [CrossRef]
- Statistics of Jawa Barat. Gross Regional Domestic Product of Jawa Barat Province by Industry 2015–2019. 2020. Available online: https://jabar.bps.go.id/publication/2020/04/30/4bd06c5c77afd67a52b5d332/produk-domestik-regional-bruto-provinsi-jawa-barat-menurut-lapangan-usaha-2015-2019.html (accessed on 15 January 2021).
- Yang, W. Comprehensive Evaluation of Socio-Economic and Environmental Policies for Mitigating Water Pollution and Scarcity in Source Region of Liao River. Ph.D. Thesis, University of Tsukuba, Ibaraki, Japan, 2015. [Google Scholar]
- Statistics Indonesia. Input Output Table Indonesia 2010. 2015. Available online: https://www.bps.go.id/publication/2015/12/30/eb1ce54ade495db2654b85e2/input-output-table-indonesia-2010.html (accessed on 10 October 2020).
- Kasumigaura Countermeasures Section, Living Environment Department, Ibaraki Prefecture. Materials for Formulation of the Fourth Kasumigaura Lake Water Quality Conservation Plan; Kasumigaura Countermeasures Section, Living Environment Department, Ibaraki Prefecture: Kasumigaura, Japan, 2002. [Google Scholar]
- Tang, K.; Hailu, A.; Yang, Y. Agricultural chemical oxygen demand mitigation under various policies in China: A scenario analysis. J. Clean. Prod. 2020, 250, 119513. [Google Scholar] [CrossRef]
- Sandhu, H.; Scialabba, N.E.H.; Warner, C.; Behzadnejad, F.; Keohane, K.; Houston, R.; Fujiwara, D. Evaluating the holistic costs and benefits of corn production systems in Minnesota, US. Sci. Rep. 2020, 10, 1–12. [Google Scholar] [CrossRef] [PubMed]
- World, B. GDP Growth (Annual%)-Indonesia. 2022. Available online: https://data.worldbank.org/indicator/NY.GDP.MKTP.KD.ZG?end=2020&locations=ID&start=1961&view=chart (accessed on 14 April 2022).
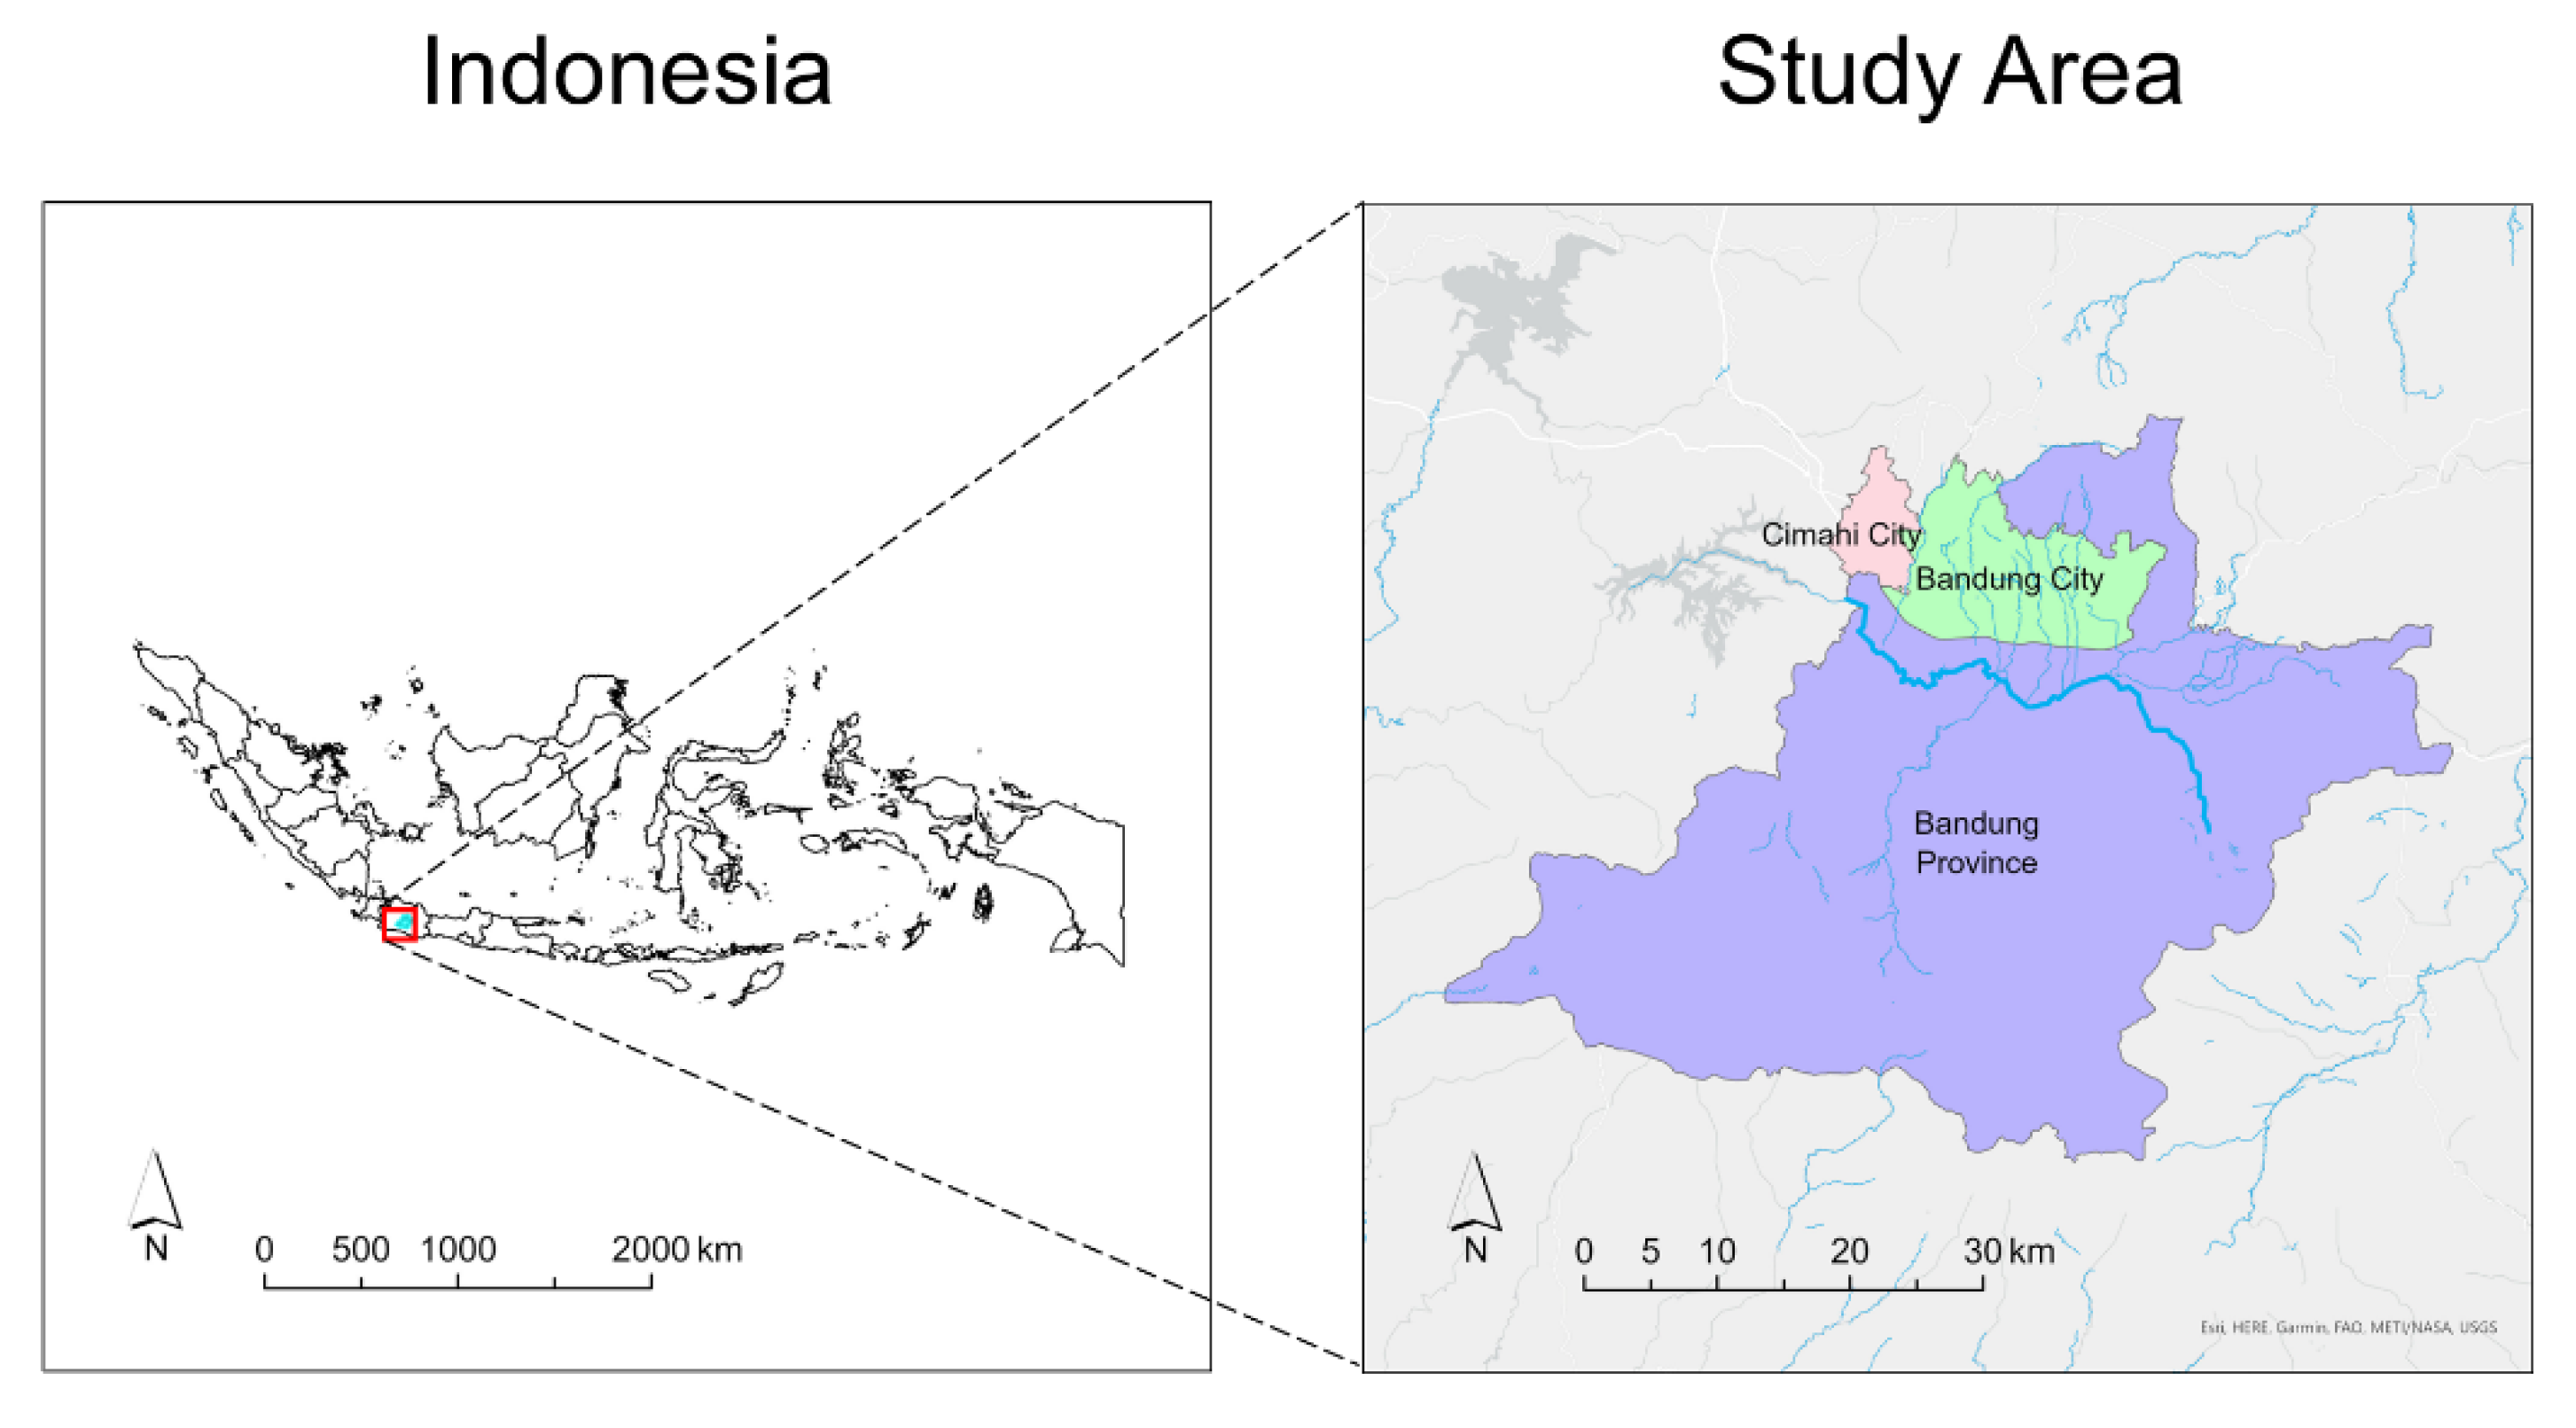


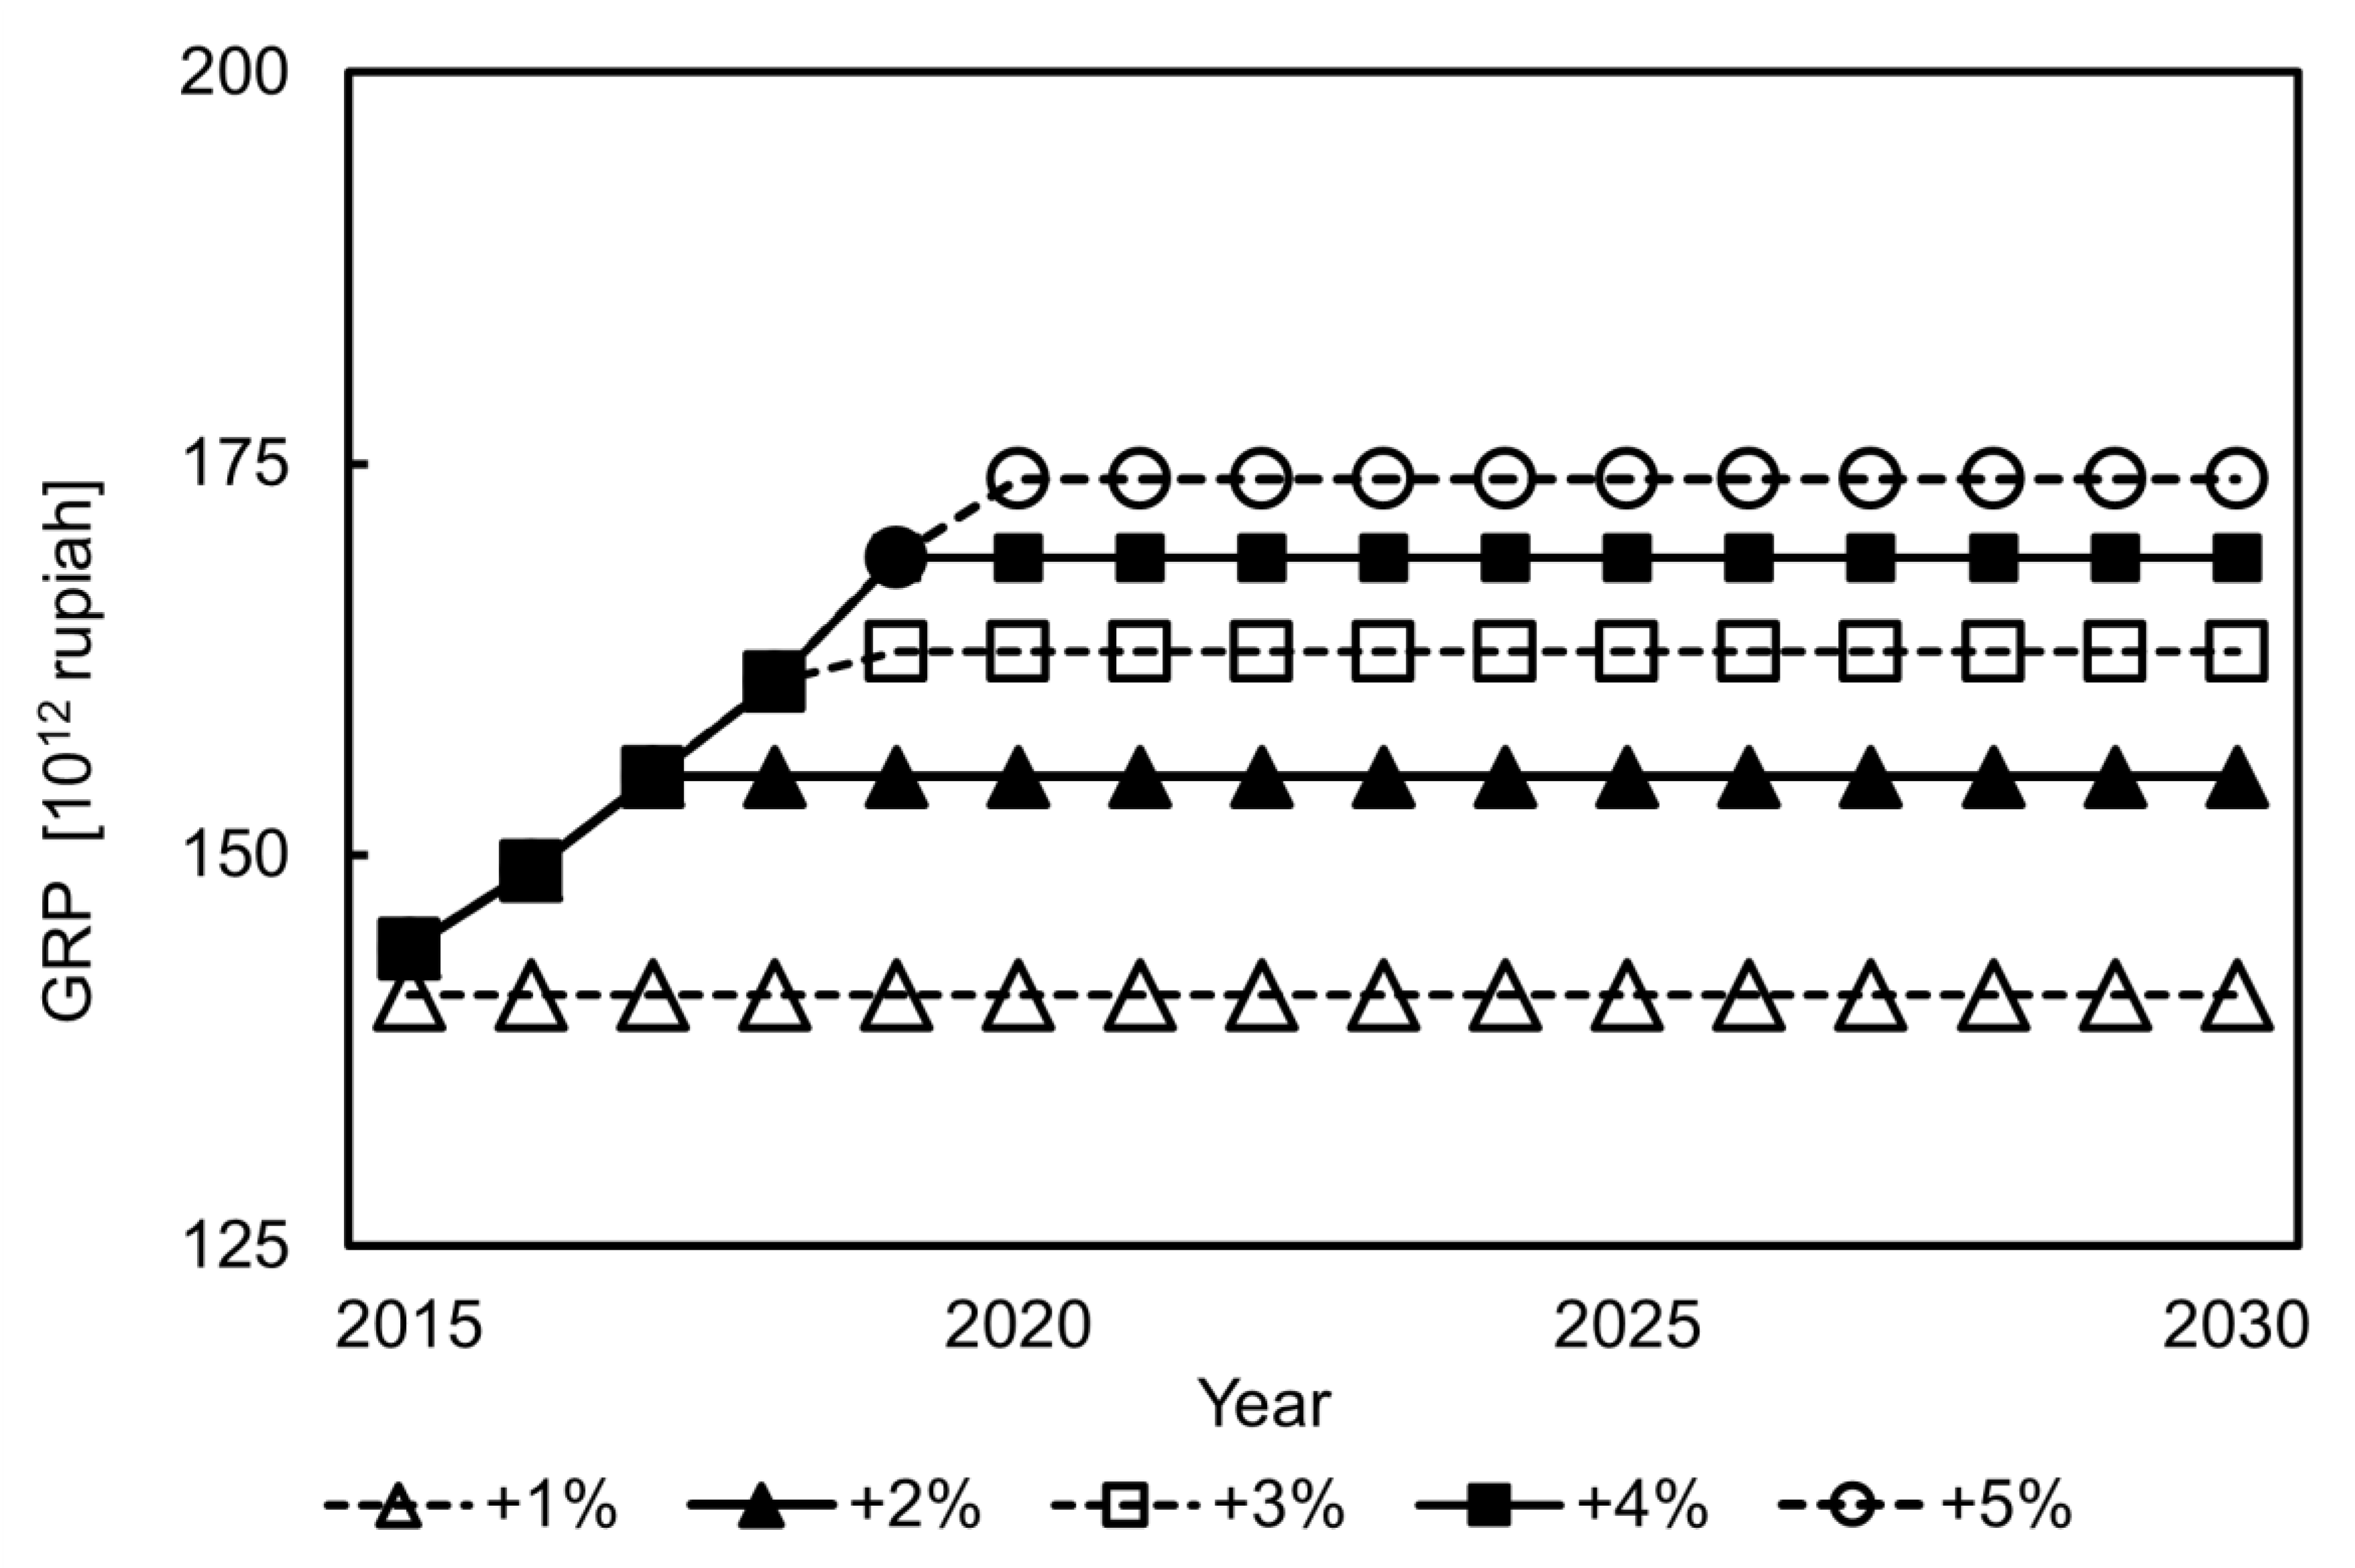
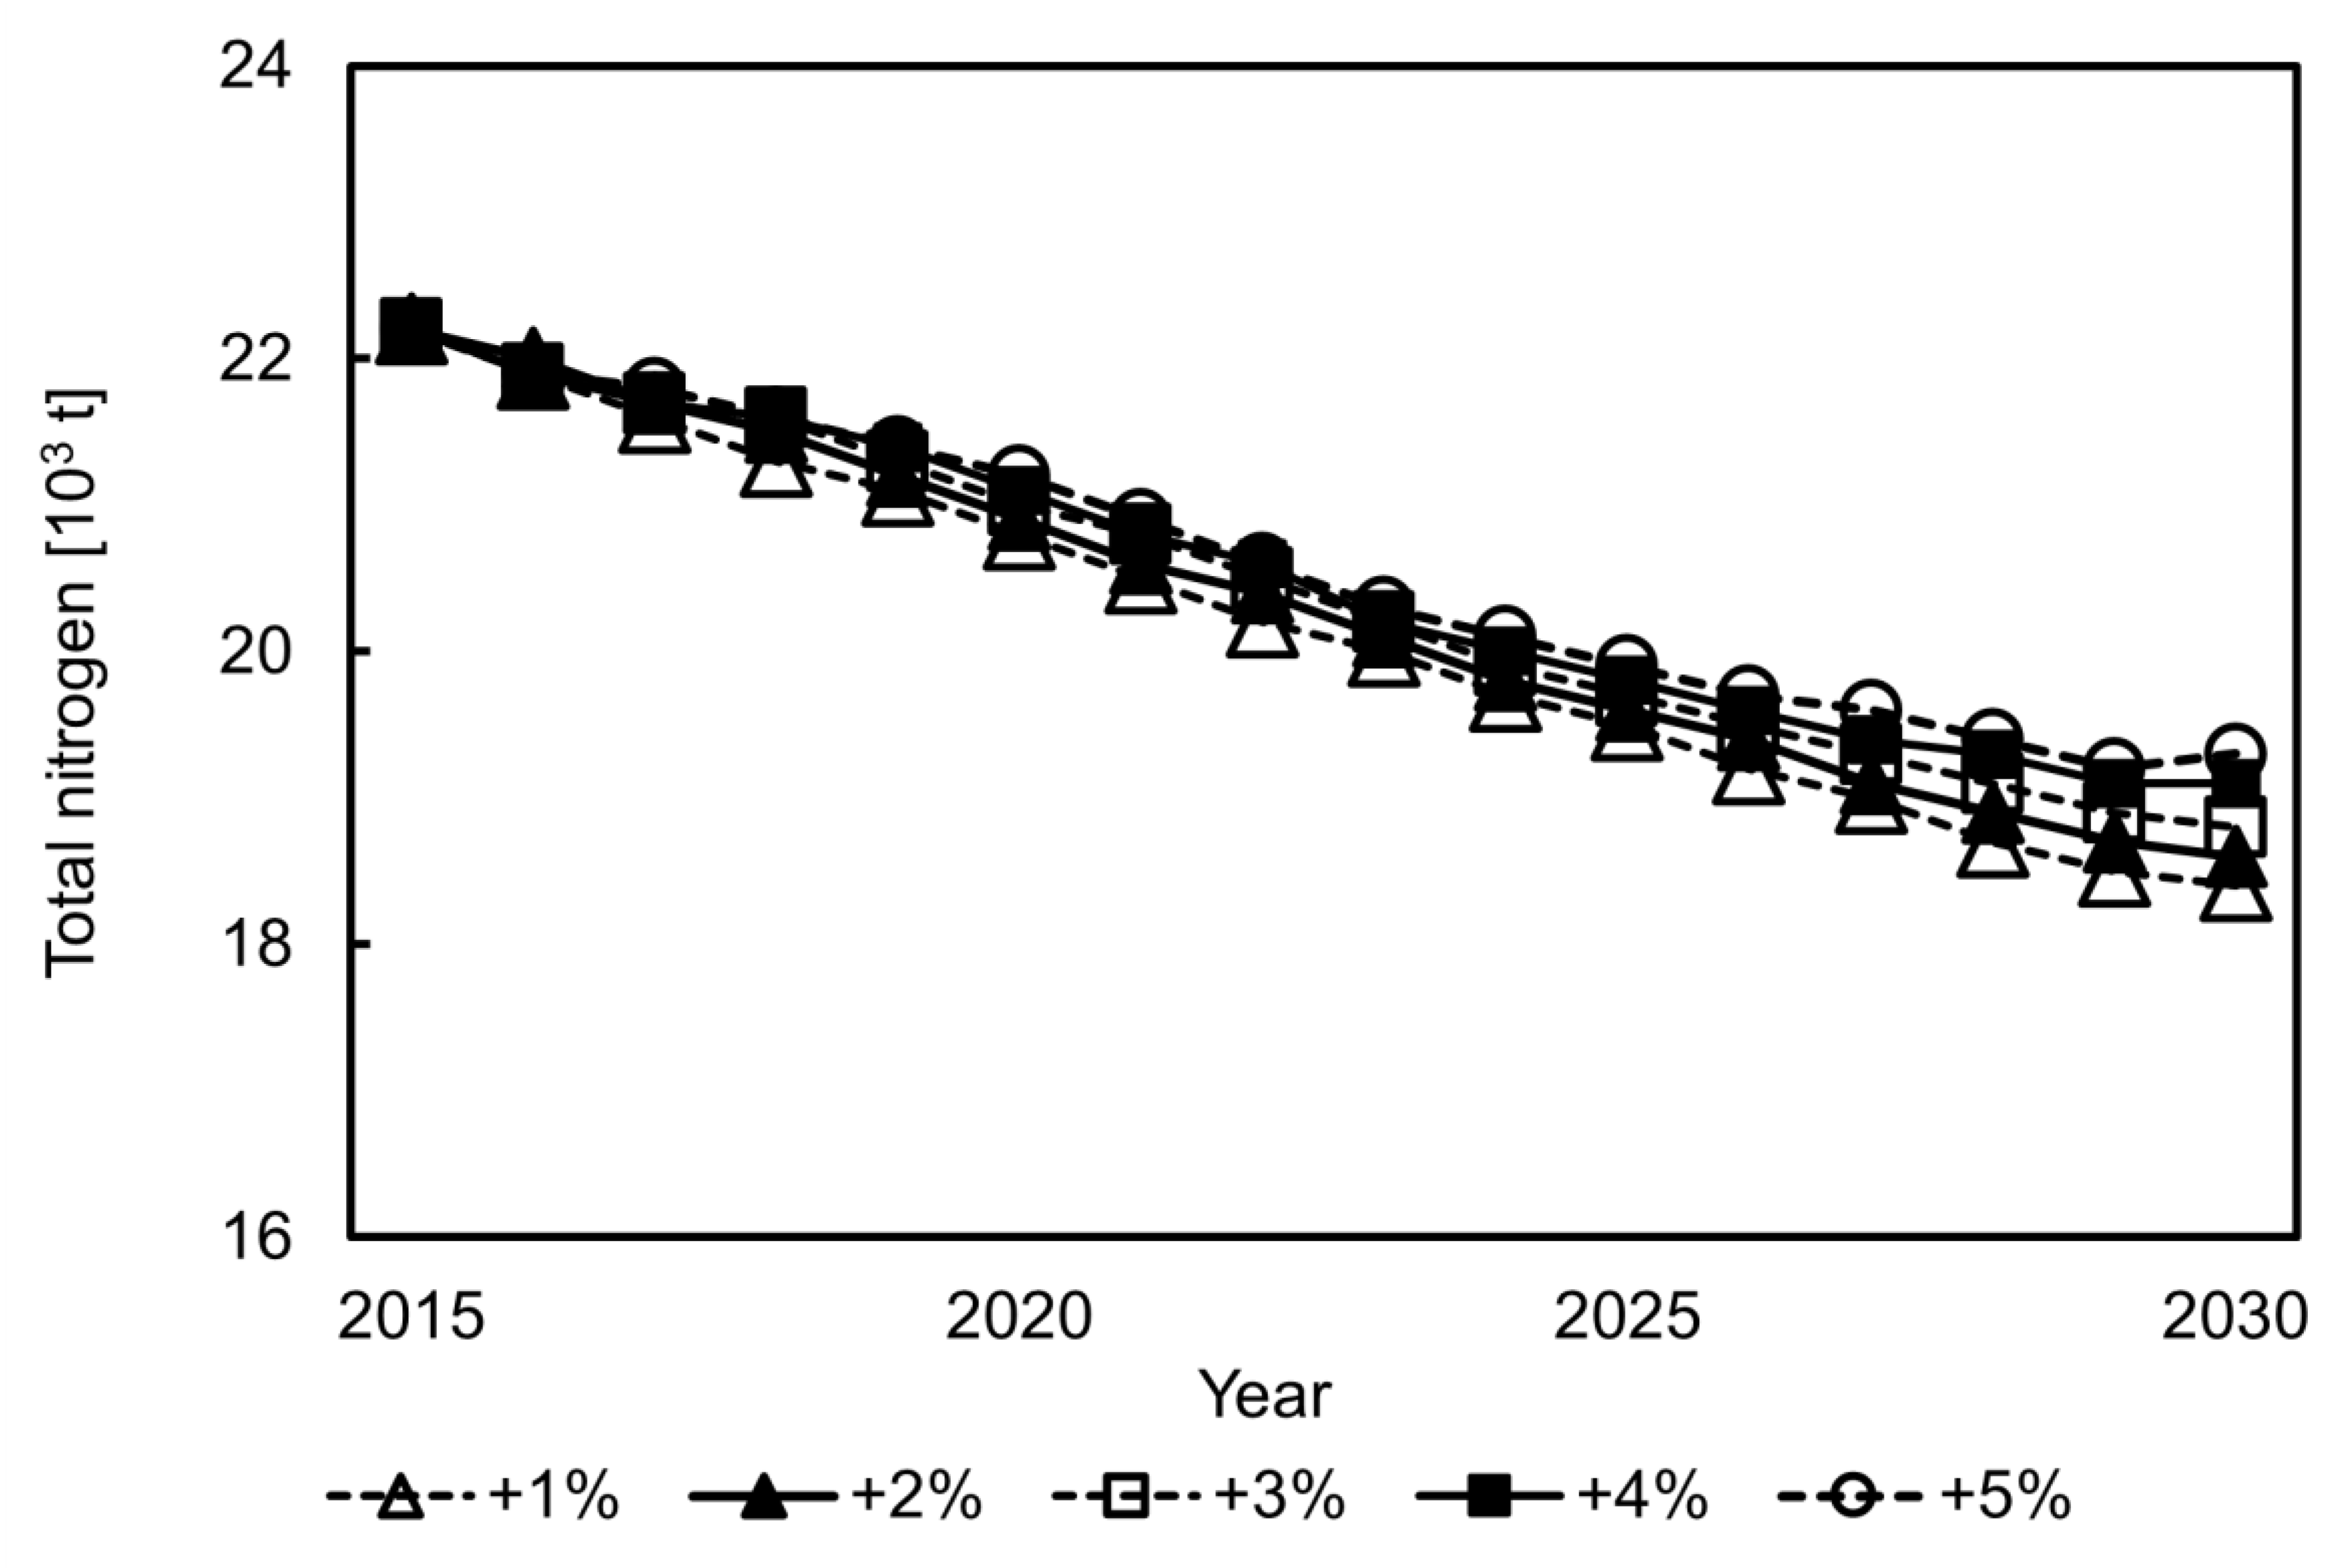
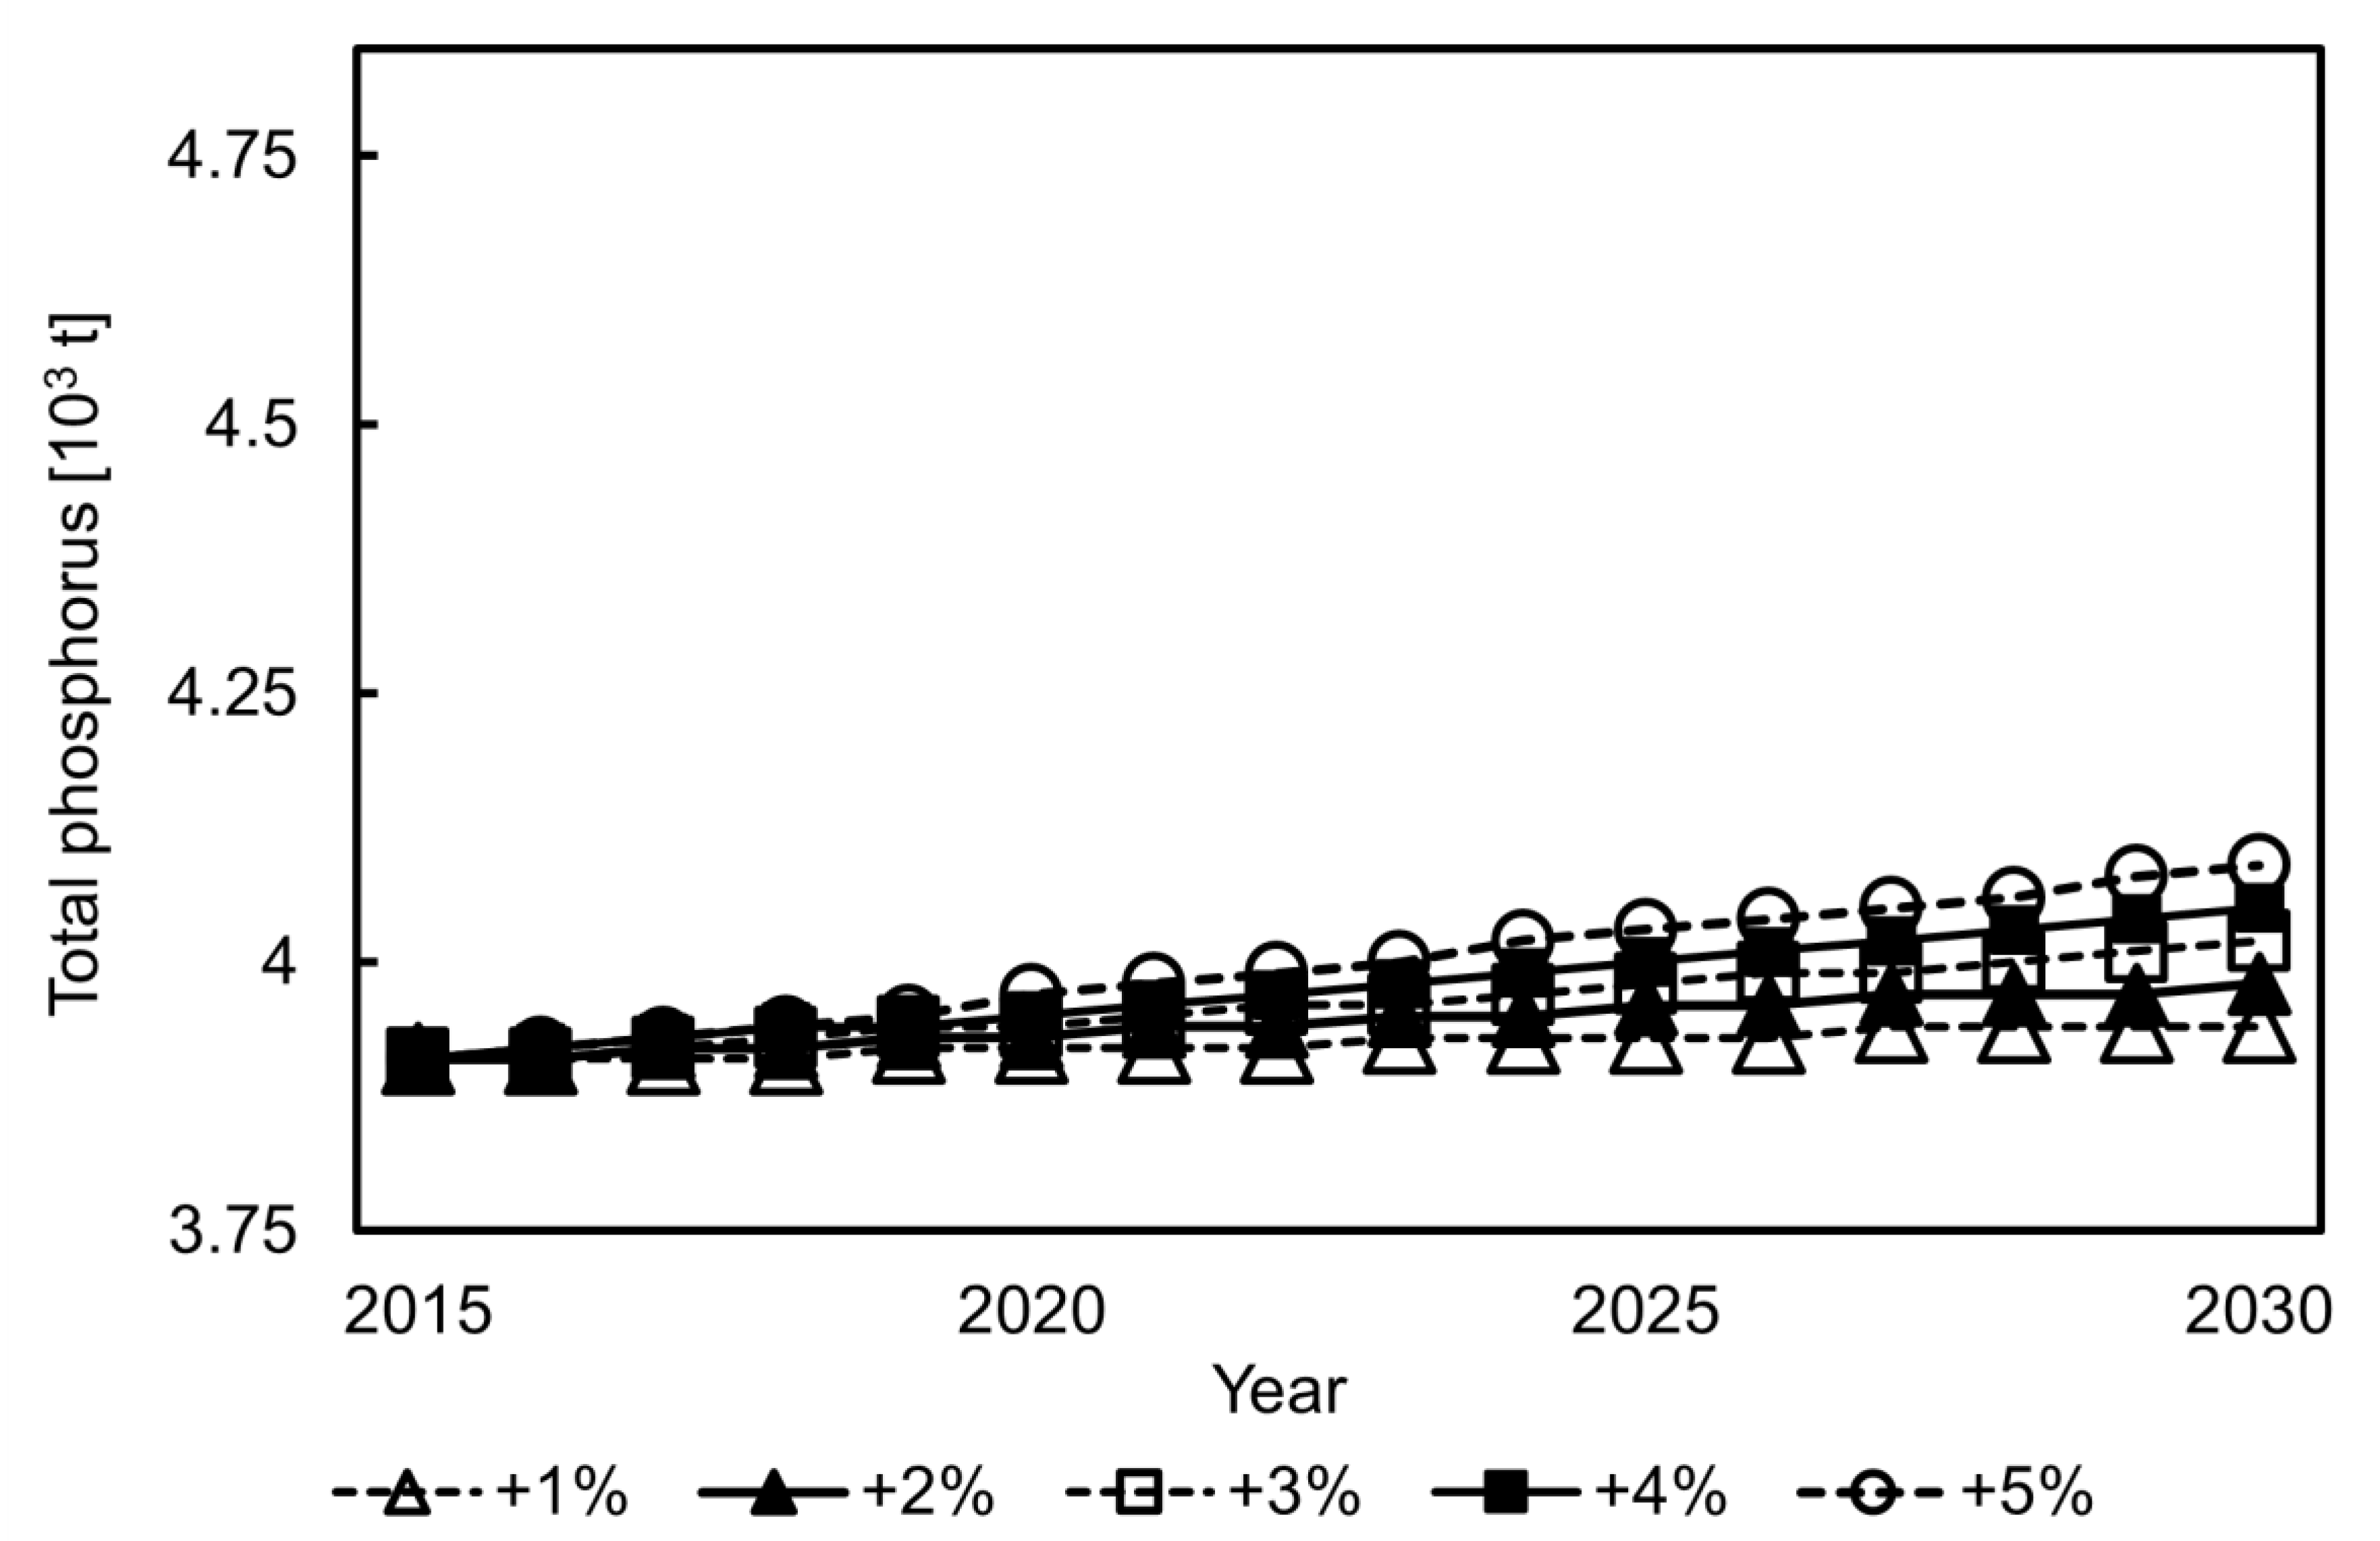
| No. | Water Pollutants (Index in the Model: P) | Area Division | Source of Water Pollutants | |||
|---|---|---|---|---|---|---|
| City or Regency (Index in the Model: j) | Percentage of Area That belongs to the Watershed | Household Domestic Wastewater Treatment Facility (Index in the Model: k) | Non-Point Land Use (Index in the Model: l) | Industry Sector (Index in the Model: m) | ||
| 1 | Total nitrogen | Bandung Regency | 78% | Sewerage system | Forest | Agriculture |
| 2 | Total phosphorus | Bandung City | 100% | Septic tank | Agricultural land | Livestock |
| 3 | COD | Cimahi City | 100% | Untreated | Urban area | Fishery |
| 4 | Pasture | Manufacturing | ||||
| 5 | Others | Other industries | ||||
| Case | Measures for Household | Maximum Budget (Million Rupiah/Year) | Note |
|---|---|---|---|
| Case 0 | — | — | — |
| Case 1-1 | Introduced | 11,365 | Actual value |
| Case 1-2 | Introduced | 56,825 | Actual value 5 |
| Case 1-3 | Introduced | 113,650 | Actual value 10 |
| Case 1-4 | Introduced | No budget constraint | — |
| Source | Value | Unit | Emission Pollutant Load (Ton/Year) | |||
|---|---|---|---|---|---|---|
| Total Nitrogen | Total Phosphorus | COD | ||||
| Household | ||||||
| Sewerage system | 654,850 | Person | 658 | 288 | 1873 | |
| Septic tank | 2,439,051 | Person | 7718 | 1438 | 34,880 | |
| Untreated | 2,730,542 | Person | 10,166 | 1694 | 65,081 | |
| Total | 5,824,443 | Person | 18,543 | 3421 | 101,834 | |
| Land use | ||||||
| Forest | 158.18 | km2 | 84 | 5 | 103 | |
| Agricultural land | 1045.77 | km2 | 982 | 74 | 1377 | |
| Urban area | 249.27 | km2 | 241 | 22 | 1340 | |
| Pasture | 40.45 | km2 | 25 | 2 | 33 | |
| Others | 92.28 | km2 | 78 | 5 | 131 | |
| Total | 1585.95 | km2 | 1410 | 109 | 2985 | |
| Industry | ||||||
| Livestock | 714,222 | 106 rupiah | 216 | 78 | 617 | |
| Fishery | 612,834 | 106 rupiah | 211 | 50 | 513 | |
| Manufacturing | 85,744,280 | 106 rupiah | 1785 | 248 | 9455 | |
| Others | 193,964,798 | 106 rupiah | 0 | 0 | 0 | |
| Total | 285,204,308 | 106 rupiah | 2212 | 376 | 10,585 | |
| Total inflow amount | 22,164 | 3906 | 115,405 | |||
| Industry | Added Value (Million Rupiah) |
|---|---|
| Agriculture | 3,427,281 |
| Livestock | 488,785 |
| Fishery | 517,826 |
| Manufacturing | 36,921,487 |
| Others | 102,615,137 |
| Total = gross regional product (GRP) | 143,970,516 |
| Constraints on Water Pollutant Inflows in 2030 Compared with 2015 Values | |||||
|---|---|---|---|---|---|
| Changes in the Cases | +5% | +10% | +15% | +20% | +25% |
| Case 0 → Case 1-1 | — | — | — | — | 1800.0 |
| Case 1-1 → Case 1-2 | — | — | 790.7 | 488.4 | 333.3 |
| Case 1-2 → Case 1-3 | — | 326.9 | 300.0 | 176.5 | 37.7 |
| Case 1-3 → Case 1-4 | 69.3 | 9.3 | 25.3 | 4.3 | 4.4 |
| Case | Inflows in 2030 (Compared with 2015) | Total Nitrogen (%) | Total Phosphorus (%) | COD (%) |
|---|---|---|---|---|
| Case 0 | +21% | +15 | +14 | +20 |
| Case 1-1 | +15% | +11 | +12 | +15 |
| Case 1-2 | +7% | −3 | +6 | −6 |
| Case 1-3 | +1% | −17 | +1 | −23 |
| Case 1-4 | −1% | −22 | −1 | −39 |
| Budget Ceiling (Times) | Inflows in 2030 (Compared with 2015) | Benefit (1012 Rupiah) | Cost (1012 Rupiah) | B/C | Objective Function (1012 Rupiah) |
|---|---|---|---|---|---|
| × | +21% | — | — | — | (1348) |
| 1 | +15% | 0.56 | 0.11 | 5.17 | (1310) |
| 1.5 | +13% | 0.72 | 0.16 | 4.62 | (1377) |
| 2 | +11% | 1.14 | 0.21 | 5.43 | (1319) |
| 2.5 | +11% | 1.27 | 0.26 | 4.84 | (1402) |
| 3 | +10% | 1.66 | 0.32 | 5.15 | (1367) |
| 3.5 | +9% | 2.06 | 0.37 | 5.60 | (1338) |
| 4 | +8% | 2.47 | 0.42 | 5.88 | (1300) |
| 4.5 | +8% | 2.57 | 0.47 | 5.45 | (1385) |
| 5 | +7% | 2.98 | 0.54 | 5.55 | (1348) |
| 5.5 | +6% | 3.39 | 0.58 | 5.87 | (1310) |
| 6 | +5% | 3.51 | 0.63 | 5.57 | (1394) |
| 6.5 | +5% | 3.94 | 0.68 | 5.76 | (1357) |
| 7 | +4% | 4.29 | 0.74 | 5.84 | (1319) |
| 7.5 | +4% | 4.41 | 0.79 | 5.60 | (1394) |
| 8 | +4% | 4.80 | 0.84 | 5.71 | (1348) |
| 8.5 | +2% | 5.18 | 0.89 | 5.81 | (1291) |
| 9 | +2% | 5.31 | 0.95 | 5.61 | (1377) |
| 9.5 | +1% | 5.39 | 1.00 | 5.40 | (1310) |
| 10 | +1% | 5.60 | 1.05 | 5.33 | (1348) |
| No budget constraint | −1% | 6.36 | 3.83 | 1.66 | (1281) |
| Inflows in 2030 (Compared with 2015) | Total Nitrogen (%) | Total Phosphorus (%) | COD (%) |
|---|---|---|---|
| +1% | −17 | +1 | −23 |
| +2% | −16 | +2 | −22 |
| +3% | −15 | +3 | −22 |
| +4% | −14 | +4 | −21 |
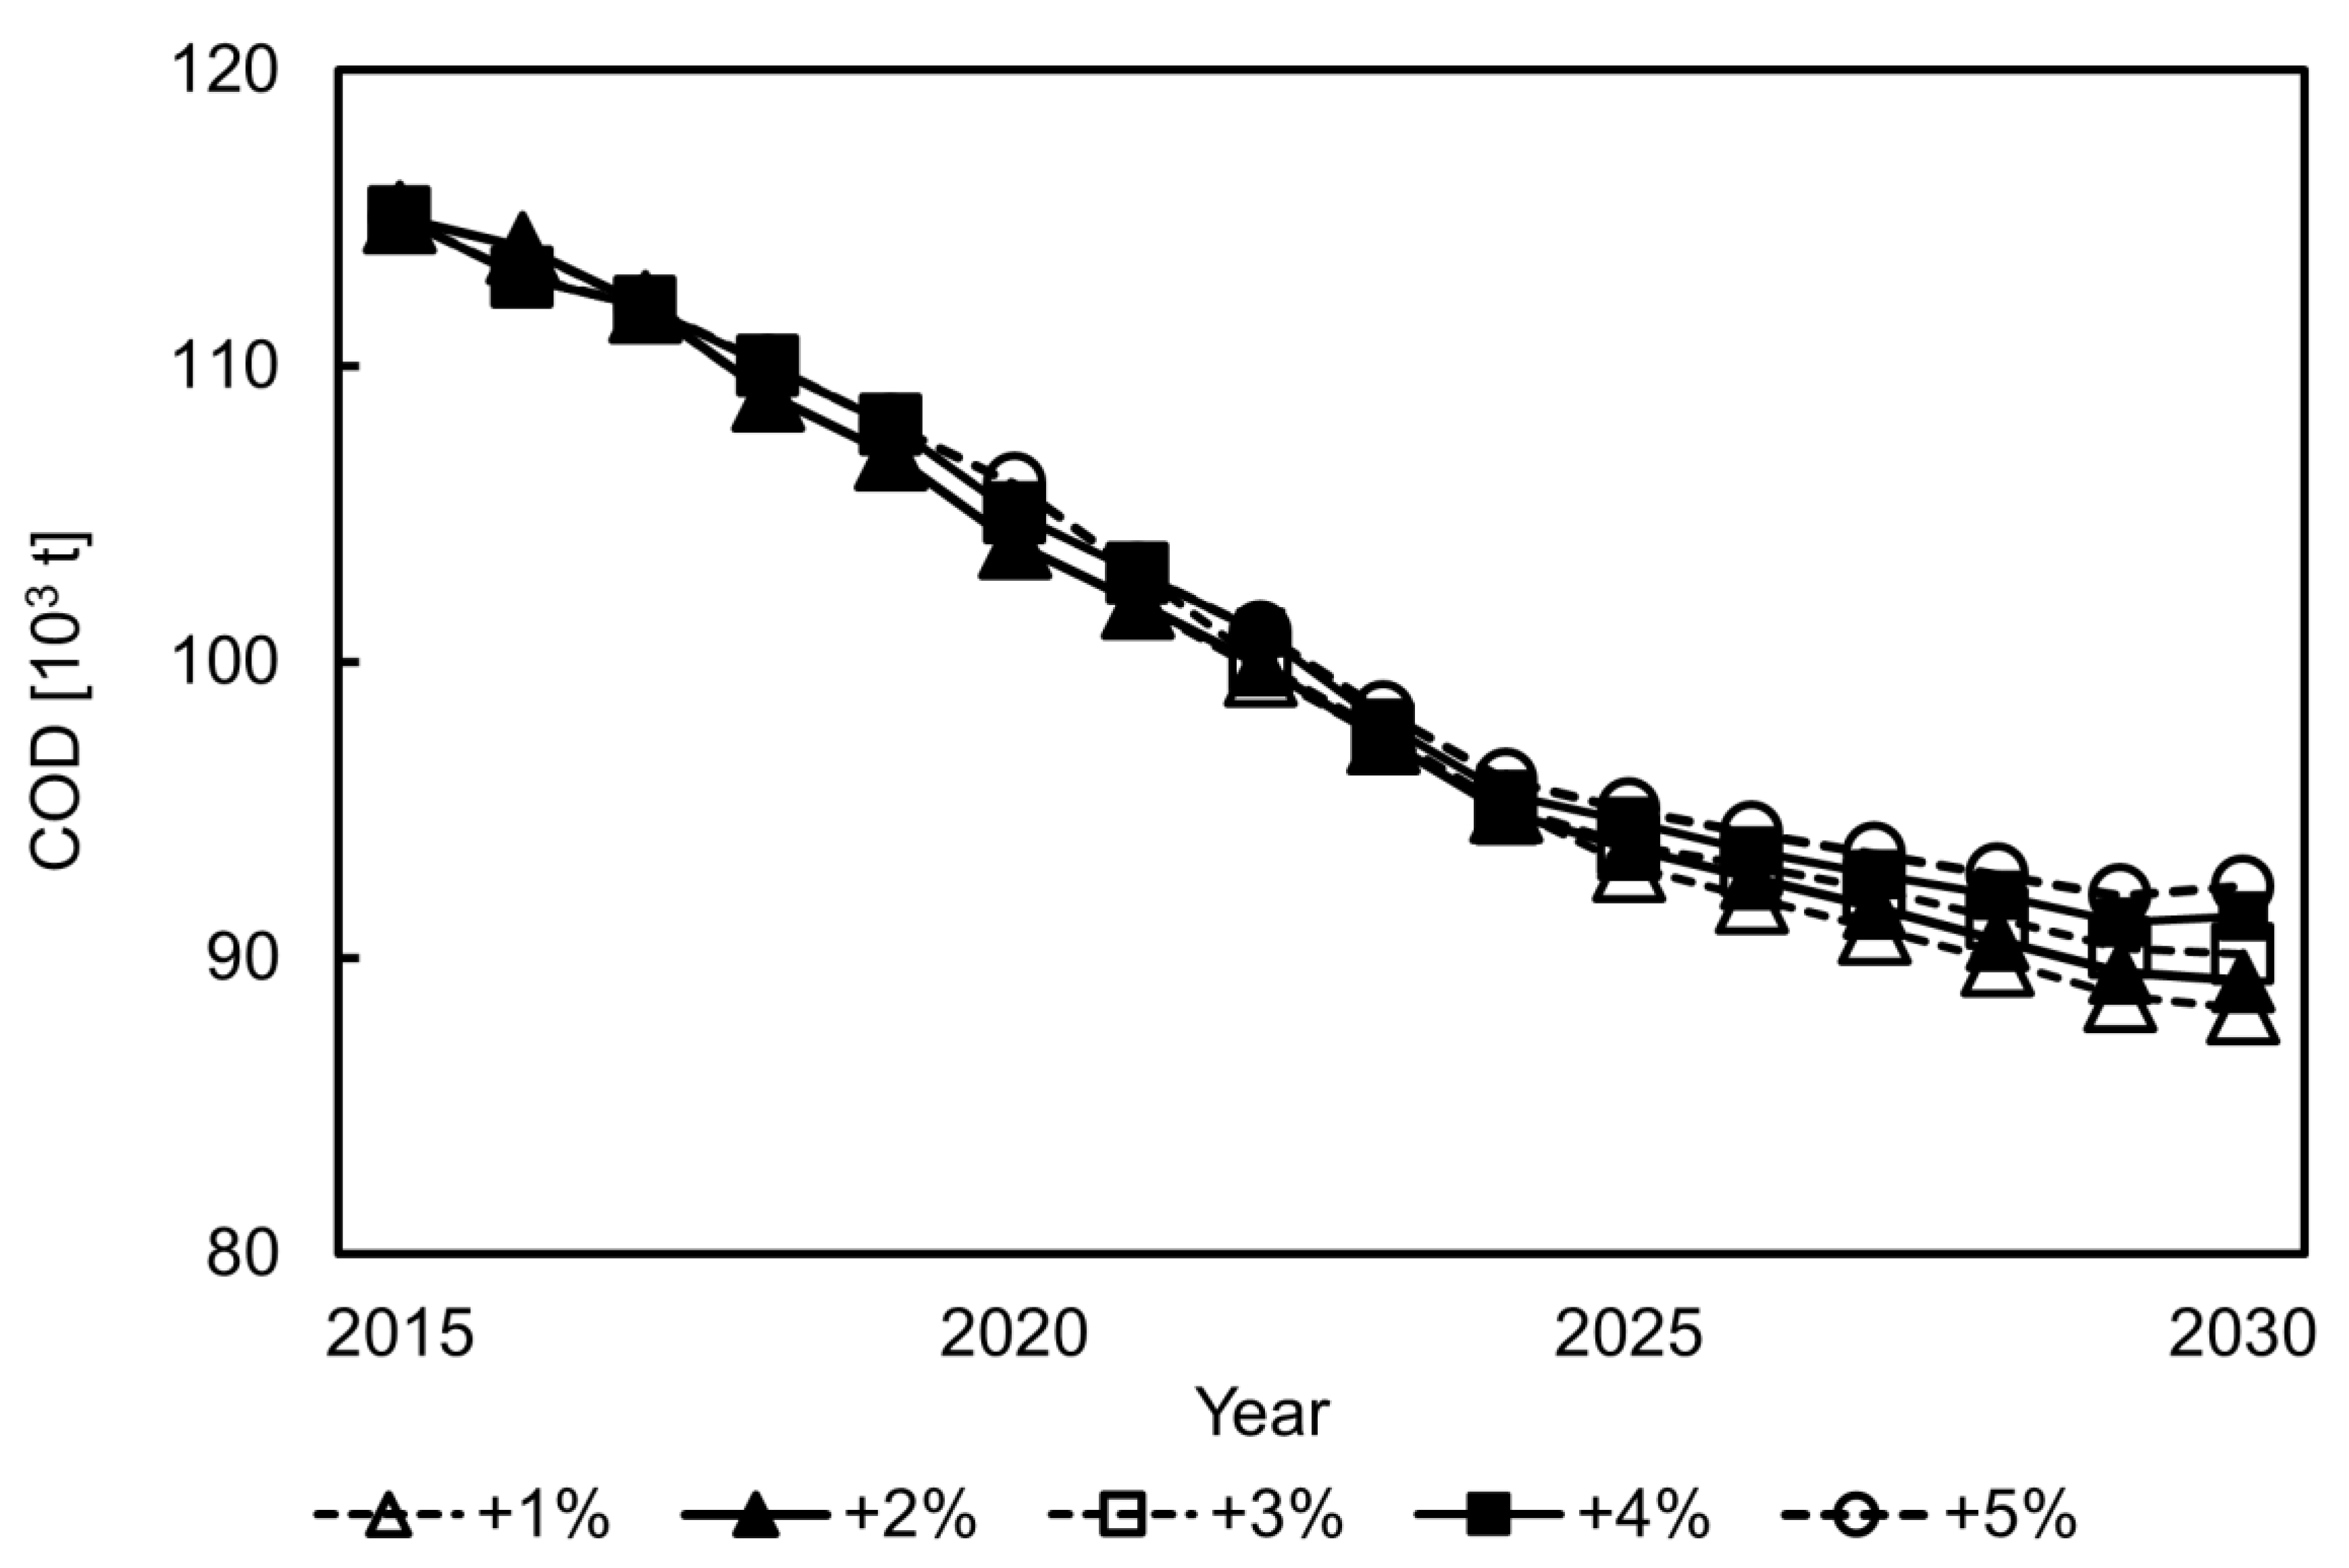
| +5% | −13 | +5 | −20 |
Publisher’s Note: MDPI stays neutral with regard to jurisdictional claims in published maps and institutional affiliations. |
© 2022 by the authors. Licensee MDPI, Basel, Switzerland. This article is an open access article distributed under the terms and conditions of the Creative Commons Attribution (CC BY) license (https://creativecommons.org/licenses/by/4.0/).
Share and Cite
Yokosawa, R.; Mizunoya, T. Improving Water Quality in the Citarum River through Economic Policy Approaches. Sustainability 2022, 14, 5038. https://doi.org/10.3390/su14095038
Yokosawa R, Mizunoya T. Improving Water Quality in the Citarum River through Economic Policy Approaches. Sustainability. 2022; 14(9):5038. https://doi.org/10.3390/su14095038
Chicago/Turabian StyleYokosawa, Riku, and Takeshi Mizunoya. 2022. "Improving Water Quality in the Citarum River through Economic Policy Approaches" Sustainability 14, no. 9: 5038. https://doi.org/10.3390/su14095038
APA StyleYokosawa, R., & Mizunoya, T. (2022). Improving Water Quality in the Citarum River through Economic Policy Approaches. Sustainability, 14(9), 5038. https://doi.org/10.3390/su14095038


