Next Article in Journal
Branding Built Heritage through Cultural Urban Festivals: An Instagram Analysis Related to Sustainable Co-Creation, in Budapest
Previous Article in Journal
Understanding the Correlation of Demographic Features with BEV Uptake at the Local Level in the United States
 
 
sustainability-logo
Article Menu

Article Menu

Article

Physiological Indices and Subjective Thermal Perception of Heat Stress-Exposed Workers in an Industrial Plant

School of Resources Engineering, Xi’an University of Architecture and Technology, Xi’an 710055, China
*
Author to whom correspondence should be addressed.
Sustainability 2022, 14(9), 5019; https://doi.org/10.3390/su14095019
Submission received: 2 March 2022 / Revised: 16 April 2022 / Accepted: 20 April 2022 / Published: 22 April 2022
(This article belongs to the Topic Sustainable Built Environment)

Abstract

:
This study aimed to investigate the thermal responses of acclimated workers exposed to heat stress in a real work environment. The physiological indices and subjective thermal perception of the 14 acclimated workers were measured in an industrial plant. The effects of wet bulb globe temperature (WBGT) on physiological indices and subjective thermal perception were studied. The differences in thermal responses between the acclimated workers and unacclimated college students exposed to heat stress were compared and analyzed. The relationship between the mean skin temperature and the thermal sensation was revealed. The results show that the mean skin temperature, oral temperature, and heart rate of the acclimated workers increase with WBGT, while the blood pressure decreases with WBGT. Compared with the unacclimated college students, the acclimated workers felt more comfortable and tolerant under the same heat stress. The thermal neutral mean skin temperature of the acclimated workers is 32.3 °C, which is approximately 1.0 °C lower than that of the unacclimated college students. The results of this study can help ensure the occupational safety and health of heat stress-exposed workers.

1. Introduction

China is the largest manufacturing country, and heavy industry accounts for 59% of the industrial enterprises [1]. Due to the production process requirements, there are often high-temperature heat sources in heavy industry, such as in manufacturing and steel industry workshops [2,3]. Heat stress is a common occupational hazard in the workplace. Heat stress work refers to a workplace where the average wet bulb globe temperature (WBGT) is greater than, or equal to, 25.0 °C during the process of production [4]. Workers in hot environments are more likely to suffer from hypertension and electrocardiogram abnormalities compared to other people [5,6]. Research shows that heat stress exposure and a heavy workload adversely affect workers’ health and reduce their work capacities [7,8,9]. The responses of workers’ physiology and perception in hot environments are important issues of occupational safety and health.
Many physiological strain indices have been proposed for evaluating heat stress. McArdle et al. [10] developed the predicted four-hour sweat rate (P4SR), which considers metabolic heat production and environmental conditions. Belding and Hatch [11] suggested the heat stress index (HSI), which is the ratio of the required evaporative cooling to the maximum evaporative cooling due to environmental or physiological limits. Moran et al. [12] developed a physiological strain index (PSI) based on rectal temperature and heart rate. Malchaire et al. [13] described and justified the development of the predicted heat strain (PHS) model. The PHS model was proposed in the ISO 7933 [14] and validated through a set of lab and field experiments [15]. Rowlinson and Jia [16,17] developed heat stress management tools by applying the PHS model in the Hong Kong construction industry. Du et al. [18] modified the PHS model to predict the physiological responses of Chinese workers in hot work places. Yang et al. [19] proposed a multi-node human thermal model by considering the effects of high temperature on heat production, blood flow rate, and heat exchange coefficients, which accurately predicts human thermal responses in hot environments. However, a single physiological indicator cannot comprehensively reflect the physical state. The fuzzy comprehensive evaluation method was introduced into the physiological state evaluation in indoor high-temperature environments [20,21].
Heat stress not only affects physiological indices but also affects subjective thermal perception. Pantavou et al. [22] evaluate human thermal sensation and thermal comfort by calculating four biometeorological indices during an extremely hot summer in Athens. Zhang et al. [23] develop predictive models of local and overall thermal sensation and comfort under non-uniform and transient thermal environments. Nag et al. [24] examine the physiological and psychological reactions of 11 male volunteers under 7 climatic conditions in a climatic chamber. The results suggest acceptable and tolerable limits for human exposure in hot situations. Zhang et al. [25,26] study the effect of directed thermal radiation on human skin temperature, subjective perception, and productivity in hot humid environments. They show that directed thermal radiation is a major factor affecting the health of people in hot environments. The coupled effect of air temperature and radiant temperature on human thermal comfort was investigated in non-uniform environments [27]. The above-mentioned literature studies human thermal responses in a climatic chamber with different air temperatures, which cannot simulate a real work environment.
The thermal environment parameters include air temperature, air velocity, relative humidity, and thermal radiation. Ghani et al. [28,29] found that the wet bulb globe temperature (WBGT) is the most suitable index to assess heat stress in hot and arid environments. The WBGT is used in international and national standards for evaluating occupational heat stress exposure [4,30,31]. Gao [32] analyzes the relationship between subjective thermal perceptions and the WBGT. Zare et al. [33] investigate the correlation between the WBGT and physiological parameters among mine workers. Although many researchers have investigated the thermal responses of hot environments, the subjects are mostly college students never exposed to heat stress. Partial acclimatization may be achieved in 7 days by a gradual increase in heat stress. Therefore, the college students were unacclimated.
Acclimatization is a gradual physiological adaptation that improves an individual’s ability to tolerate heat stress. In an actual industrial plant, the workers with several working years exposed to heat stress are acclimated workers. According to ISO 7243, WBGT reference limits have a difference of 1.0–5.0 °C between acclimated and unacclimated persons [30]. The ACGIH sets a threshold limit value for acclimated persons and action limit for unacclimated persons, with a WBGT difference of 2.5–3.5 °C. However, according to the national occupational health standard GBZ 2.2, WBGT limits for heat stress work do not consider the differences between acclimated and unacclimated persons [4]. Tian et al. [34] found that heat acclimatization training induces biological adaptations, increases sweat rate, and reduces oral temperature. Similarly, the subjects are college students. There is a significant difference in the physical quality between the college students and the workers. The thermal responses of college students in previous studies cannot reflect the thermal responses of the workers. Research on the thermal responses of the workers is needed to protect workers’ health.
Therefore, the purpose of this study was to explore the thermal responses of acclimated workers exposed to heat stress in a real work environment. The physiological indices of 14 workers exposed to different WBGTs were measured in an industrial plant. The responses of subjective thermal perception were obtained by questionnaires. The differences in thermal responses between the acclimated workers and unacclimated college students exposed to heat stress were compared and analyzed. This study will provide guidance for ensuring the occupational safety and health of heat stress-exposed workers.

2. Methodology

2.1. The Industrial Plant

The industrial plant used in this study is a casting plant in Jiaozuo (located 35°15′ N, 113°15′ E), Henan Province, China. Jiaozuo has a temperate monsoon climate that is hot in summer and cold in winter. The casting plant is 200 m × 100 m × 15 m and consists of a melting area, a pouring area, and a finished product area, as shown in Figure 1. The raw materials are melted in the melting area, and then transported by crane to the pouring area to form cylinder sleeves. The cylinder sleeves are transported by a conveyor belt to the iron box and sent to the finished product area.
Airflow in the plant is mainly achieved by natural ventilation through windows and doors. In addition, there is airflow from fans at the work sites in summer. To reflect the thermal environment of the workers, the measuring points were close to the work sites. In this study, 7 work sites in the pouring area were chosen as the measuring points, as shown in Figure 1. In the 7 work sites, there were 14 workers with an average of 7.4 working years who were acclimated to heat stress. The detailed information of the 14 acclimated workers is shown in Table 1. All of the workers were in good health, and had no serious medical history or alcohol abuse. During the measurement, the 14 acclimated workers wore uniform work clothes with a thermal resistance of approximately 0.7 clo. The acclimated workers performed moderate labor intensity according to the physical labor intensity classification [4]. This research complies with the tenets of the Declaration of Helsinki and informed consent was obtained from each participant.

2.2. Measurement

The measurements were taken in summer from 14–17 June in 2021. The indoor environmental parameters include indoor air temperature, air velocity, relative humidity, and WBGT. As the workers stood all day, measurement points were placed close to the workers, at a height of 1.5 m above the floor [35].
Physiological indices collected from the 14 acclimated workers included skin temperature, oral temperature, blood pressure, and heart rate. Human skin temperature is an important physiological index significantly influenced by the external environment [36,37]. The core temperature is an important index to determine whether the thermal equilibrium of the human body is disrupted. The rectal temperature is usually taken as the core temperature in medicine. However, the oral temperature is easier to measure, and the measurement procedure is usually more acceptable to the subjects. The oral temperature is approximately 0.4 °C lower than the core temperature. Therefore, the oral temperature was chosen to replace the core temperature in this paper. Blood pressure reflects changes in the body’s cardiovascular system in the current environment, while heart rate is closely related to blood circulation. Therefore, blood pressure and heart rate were also used as physiological indices to evaluate heat stress. The details of the measuring instruments are provided in Table 2. All the physiological indices of the workers were measured during activity.
Subjective thermal perception included thermal sensation, thermal comfort, thermal preference, thermal acceptability, and thermal tolerance. The questionnaire survey was designed using subjective judgment scales based on ISO 10,551 and GB/T 18,977 [38,39], as shown in Table 3.
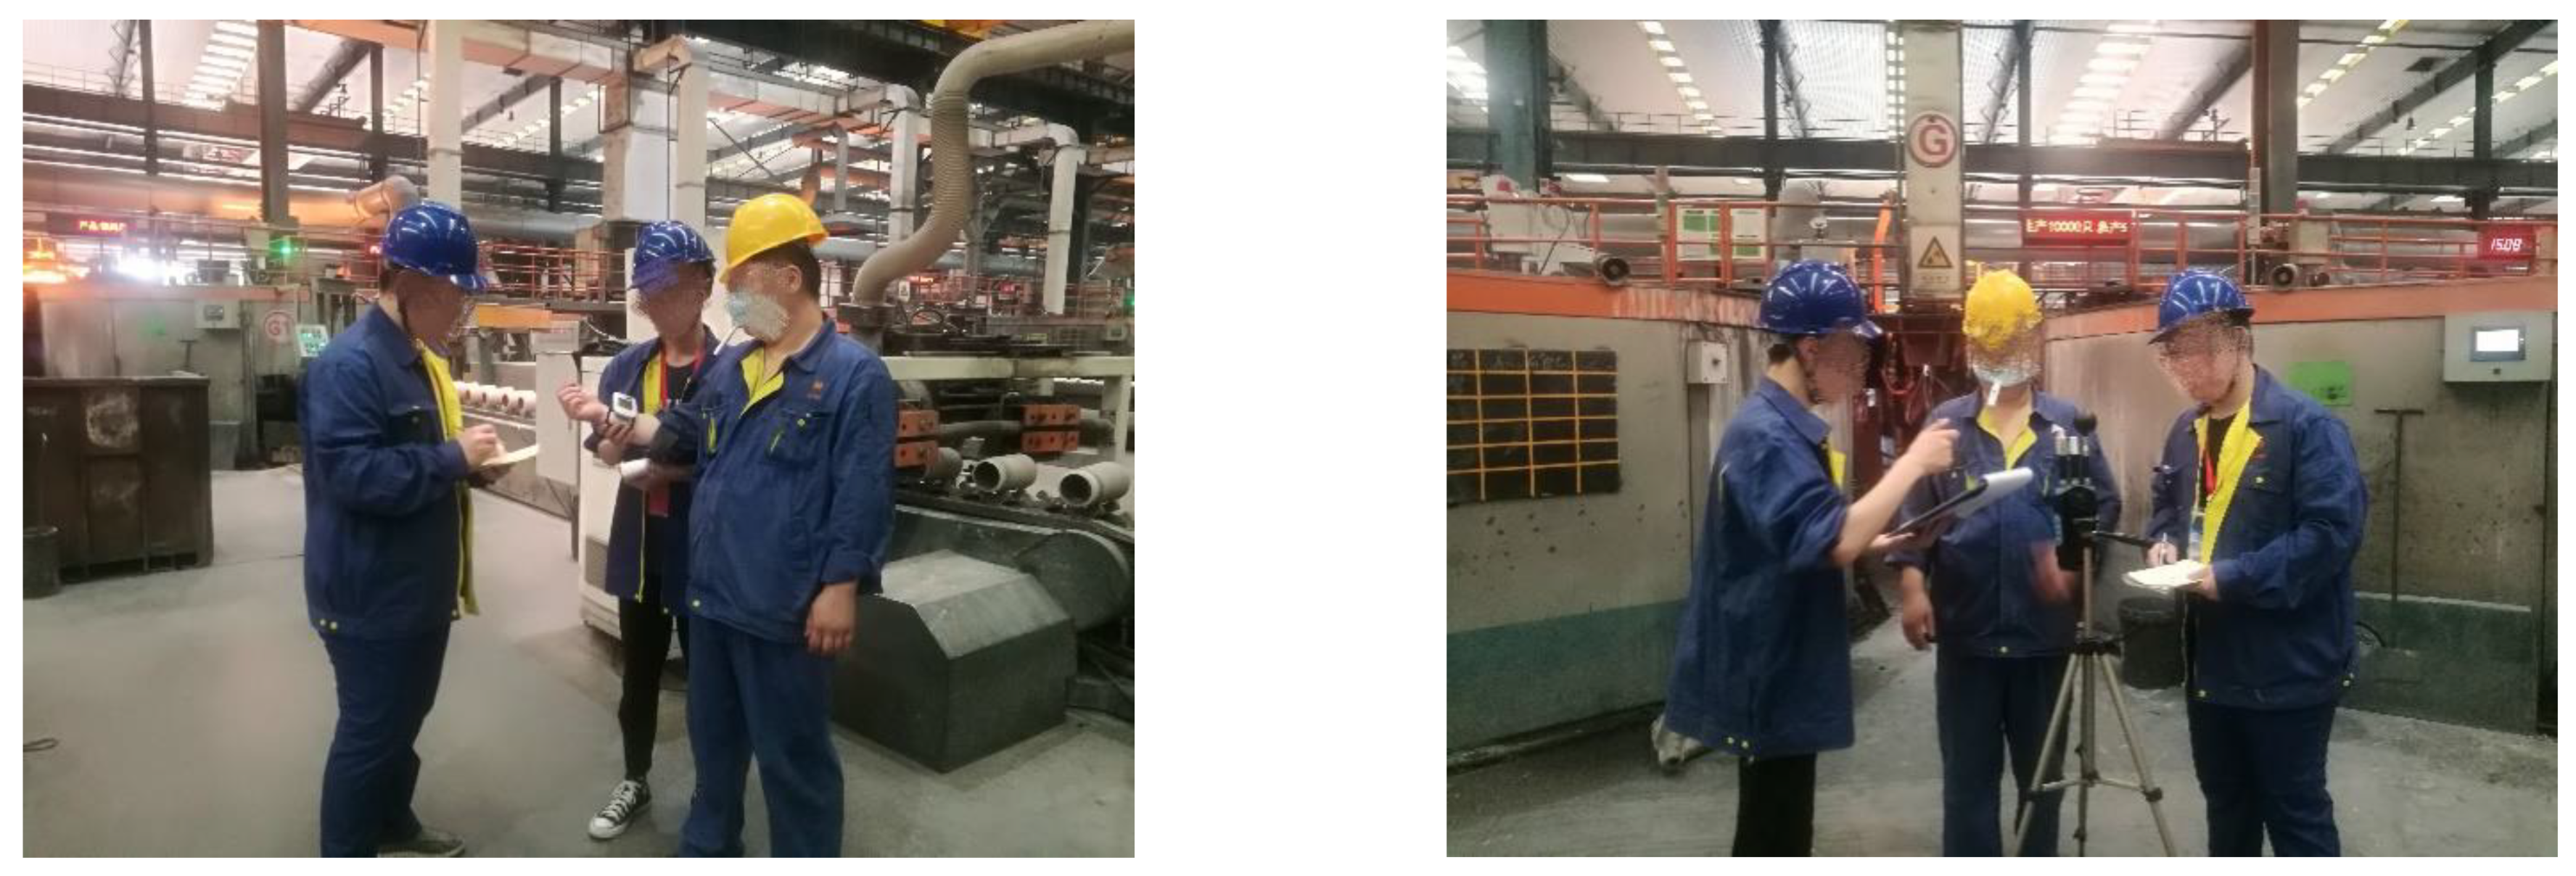
Due to the limited availability of instruments, two different measuring points were successively measured from 9:00 to 17:00 each day. Simultaneously, physiological indices and subjective thermal perception of the acclimated workers located at the measuring points were measured each hour. The workers completed the questionnaire of the thermal perception within two minutes. Pictures of the field measurements are shown in Figure 2. The Grubbs criterion [40] was used to eliminate the bad values of the data, and the significance level was 0.05. The physiological indices and subjective thermal perception of the 14 acclimated workers were then averaged at the same WBGT.

3. Results

The variations of physiological indices and subjective thermal perception of the acclimated workers with WBGT were studied. The differences in thermal responses between the acclimated workers and unacclimated college students for the same heat stress and labor intensity were compared and discussed. The physiological indices and subjective thermal perception of unacclimated college students were obtained from our research group [21,32] in which 16 college students were selected as participants, with an average age of approximately 23.0 years.

3.1. Physiological Indices

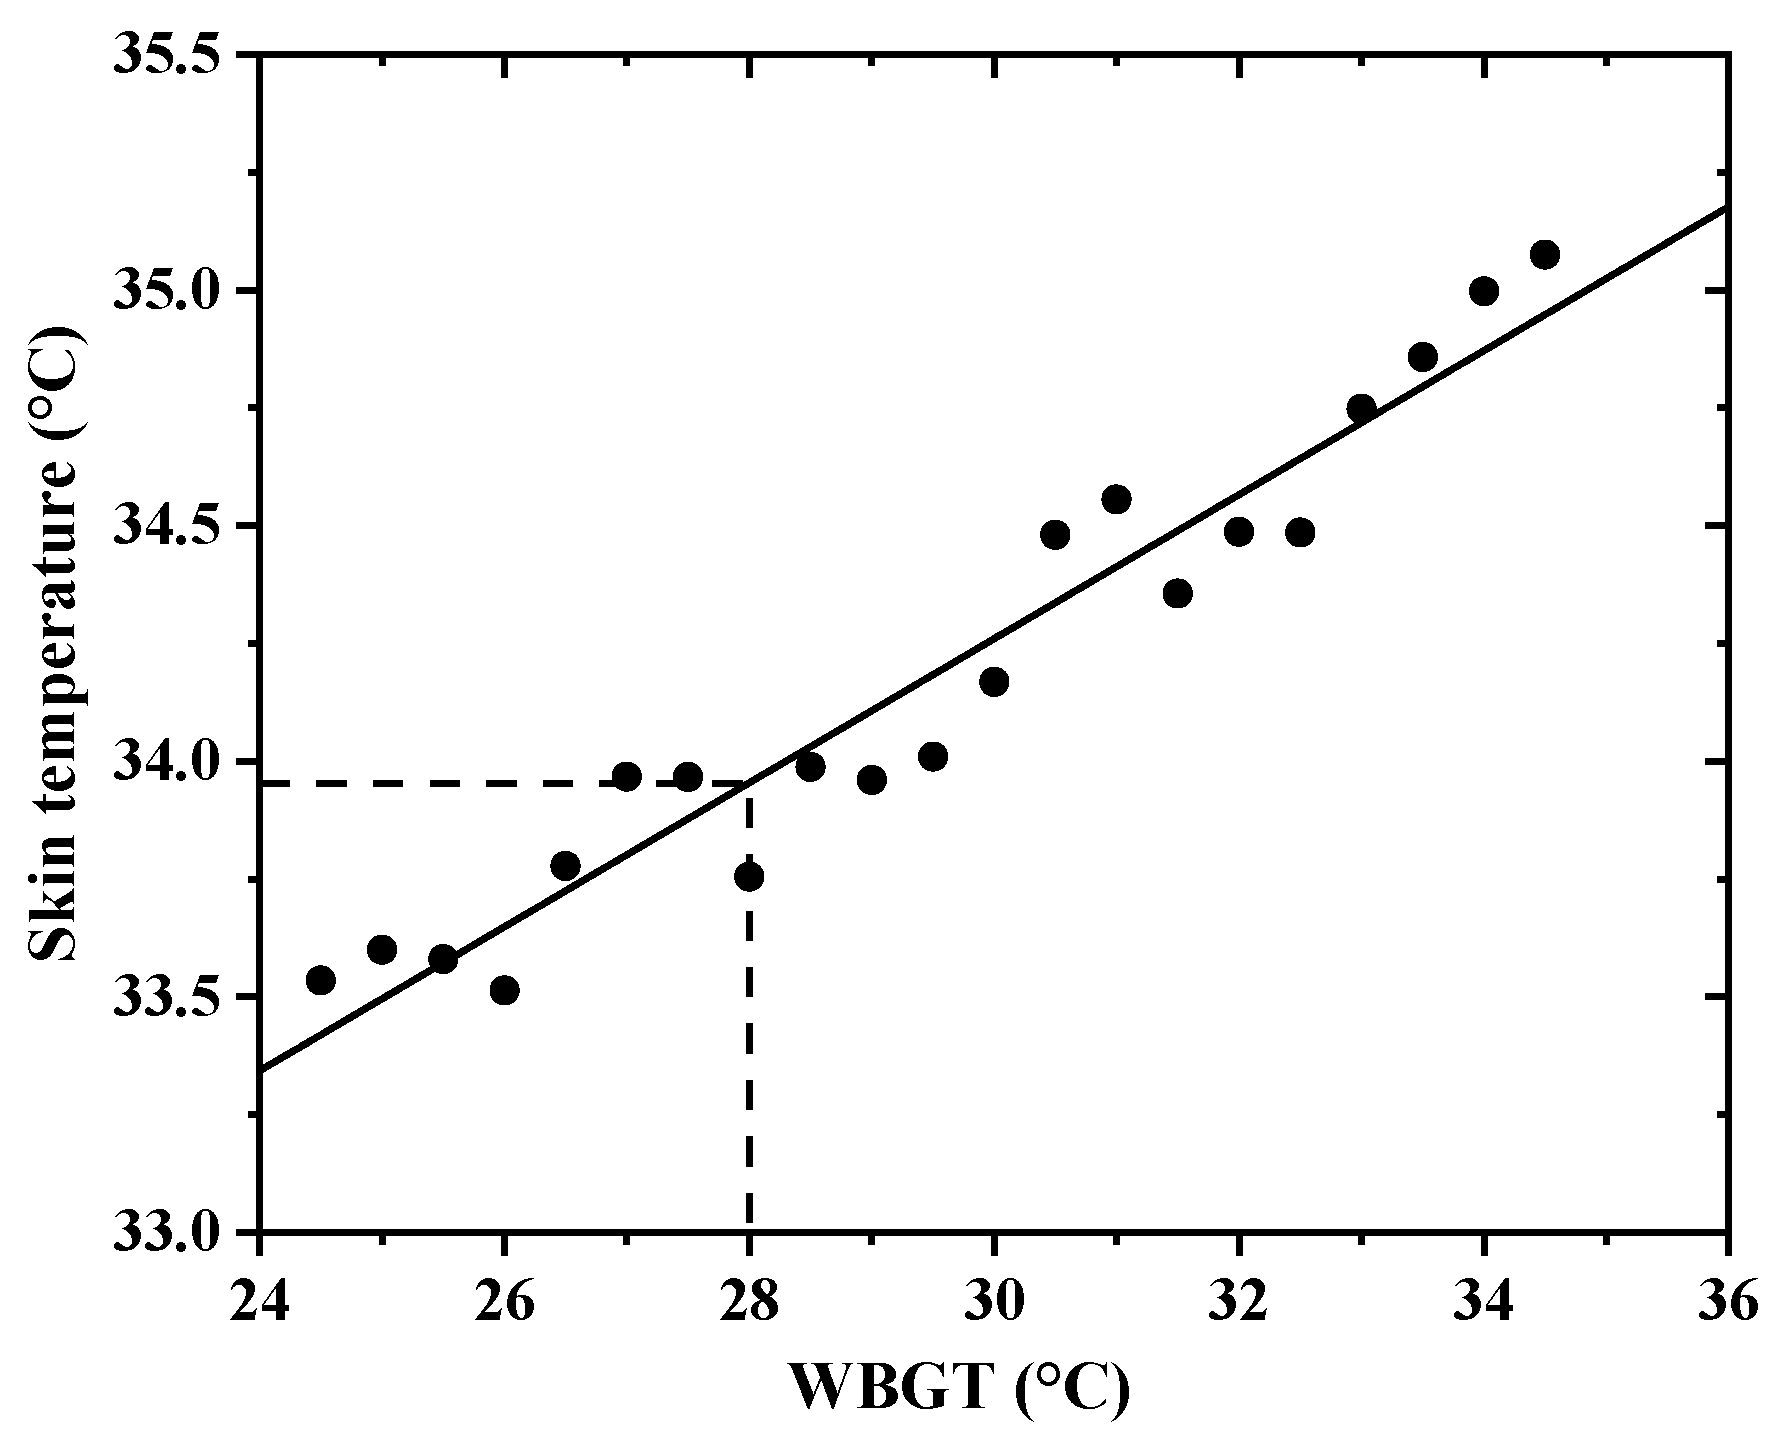
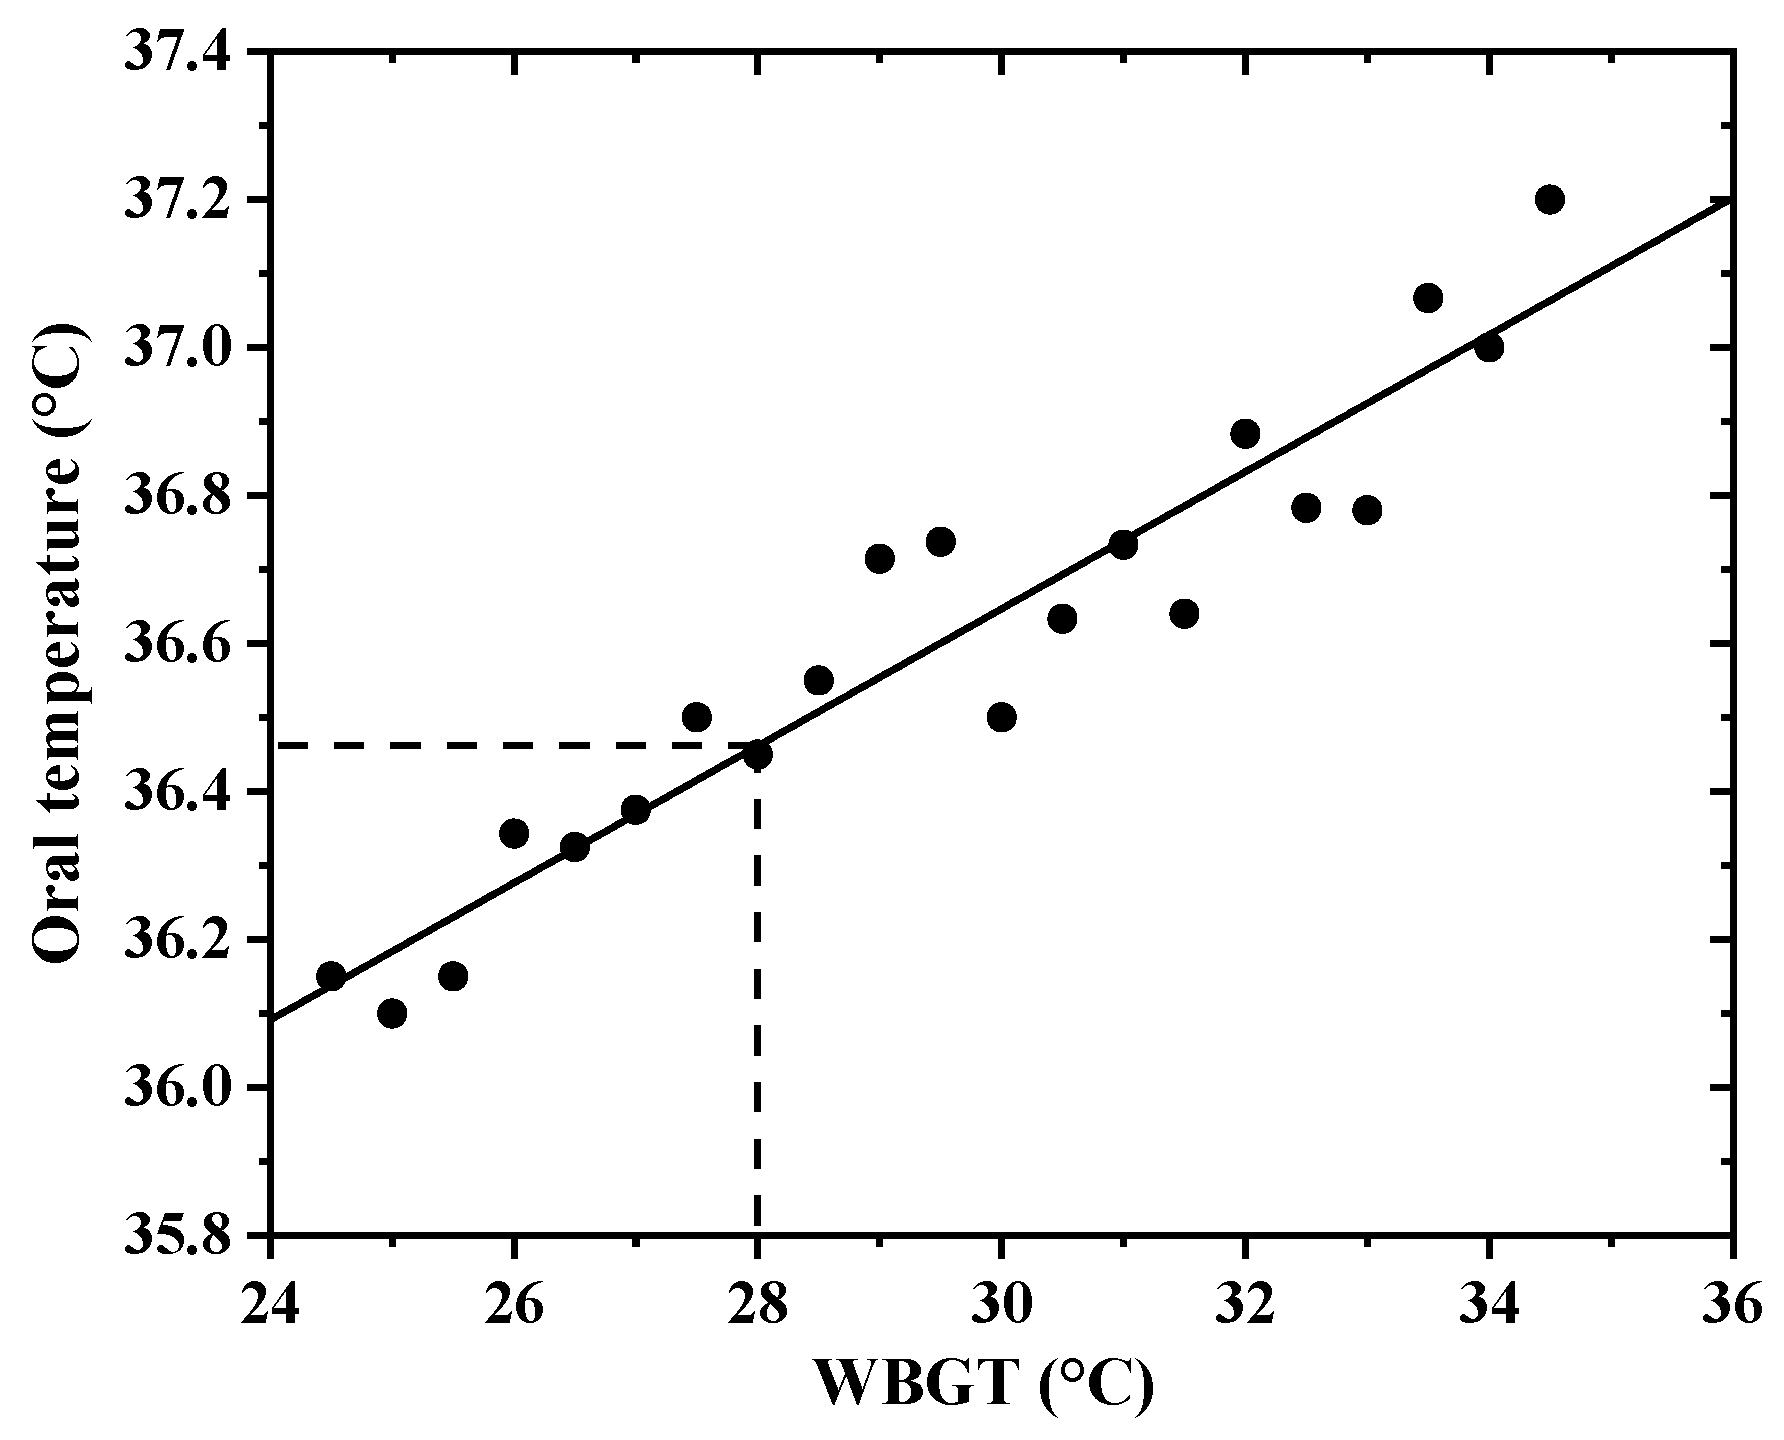
The mean skin temperature is calculated according to the four-point model in this paper [41]. The variations of the mean skin temperature and oral temperature of the acclimated workers with WBGT are shown in Figure 3 and Figure 4. The mean skin temperature and oral temperature increase as the WBGT increases. When the WBGT increases from 24.5 °C to 34.5 °C, the mean skin temperature increases from 33.5 °C to 35.1 °C, and the oral temperature increases from 36.2 °C to 37.2 °C. Therefore, when the WBGT increases by 1.0 °C, the mean skin temperature and oral temperature increase by 0.5% and 0.3%, respectively. According to the national occupational health standard GBZ 2.2 [4], the heat stress exposure limit WBGT is 28.0 °C for moderate labor intensity and 8 h working conditions. As shown in Figure 3 and Figure 4, when the WBGT is equal to 28.0 °C, the mean skin temperature and oral temperature of the acclimated workers are 34.0 °C and 36.5 °C, respectively. However, for the same heat stress and labor intensity, the mean skin temperature and oral temperature of the unacclimated male college students are 34.3 °C and 36.8 °C, respectively [21]. Therefore, the mean skin temperature and oral temperature of the acclimated workers are both 0.3 °C lower than those of the unacclimated college students.
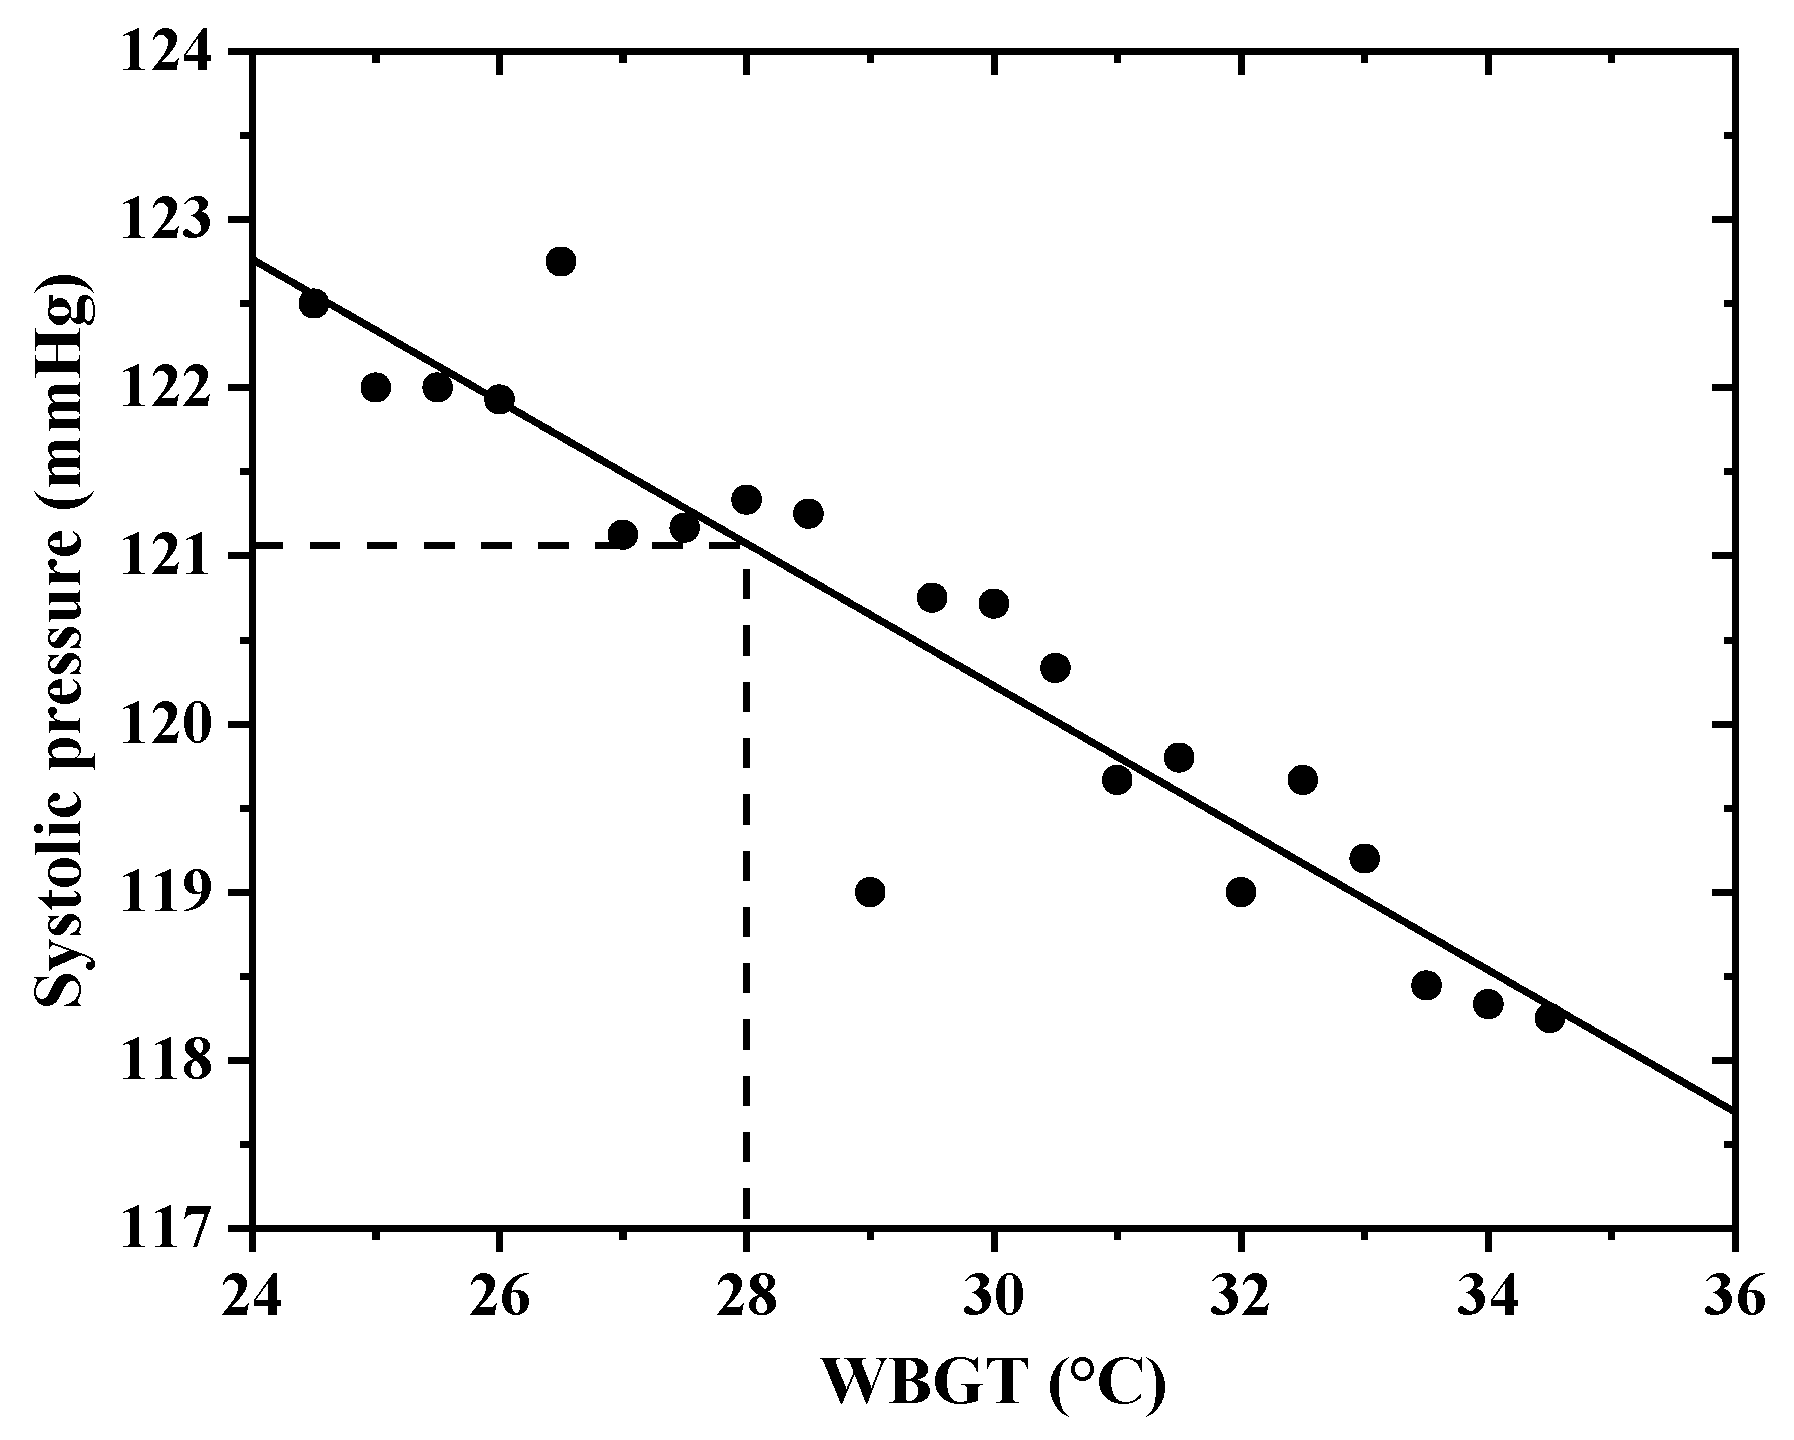
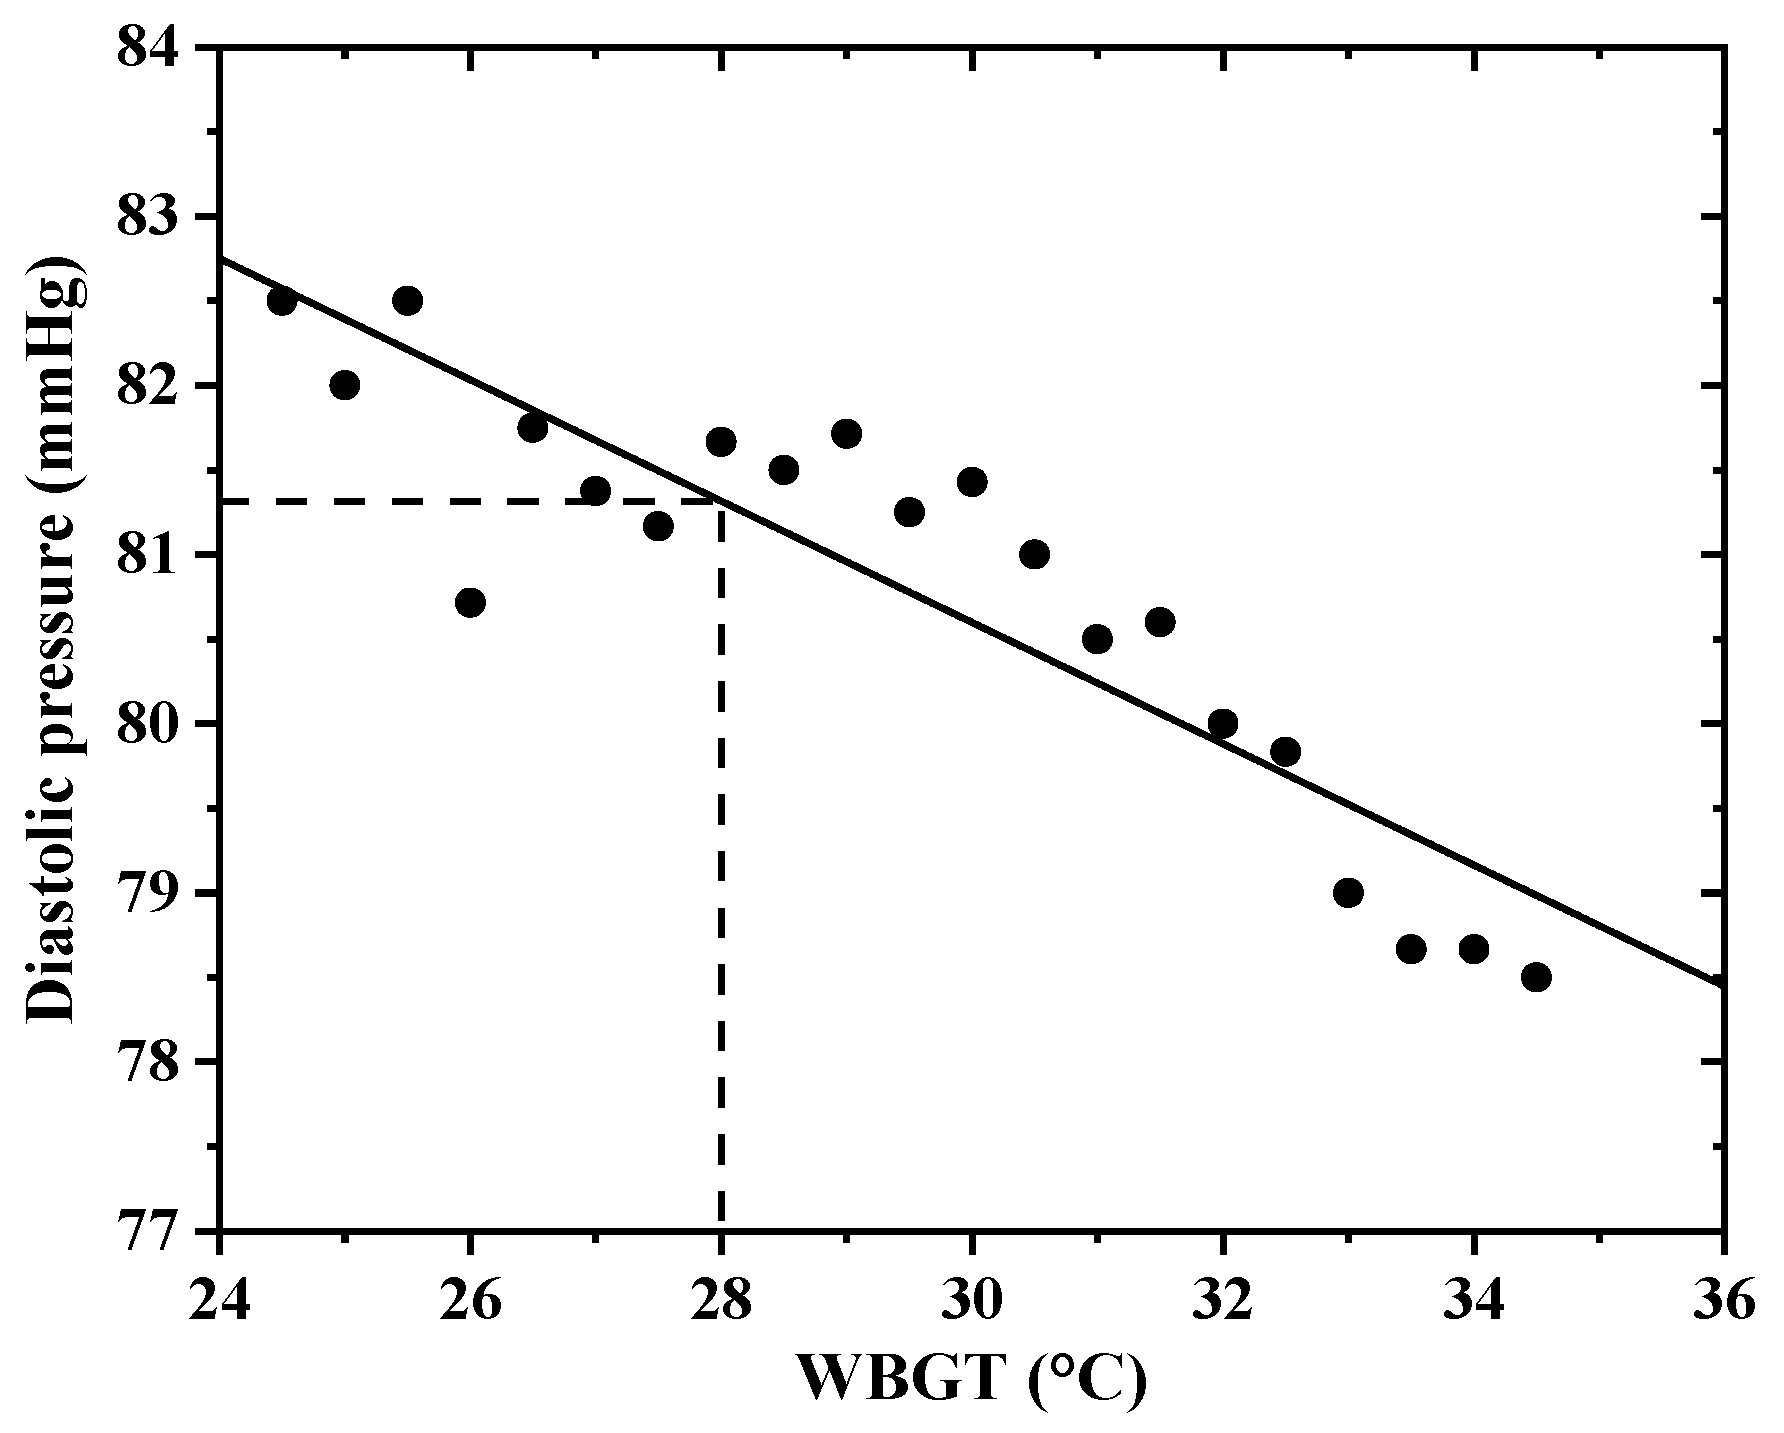
Figure 5 and Figure 6 present the variations of the blood pressure of the acclimated workers with WBGT. The systolic pressure and diastolic pressure both decrease with WBGT. When the WBGT increases from 24.5 °C to 34.5 °C, the systolic pressure decreases from 122.5 mmHg to 118.3 mmHg, and the diastolic pressure decreases from 82.5 mmHg to 78.5 mmHg. Therefore, when the WBGT increases by 1.0 °C, the systolic pressure and diastolic pressure decrease by 0.3% and 0.5%, respectively. As shown in Figure 5 and Figure 6, when the WBGT reaches the heat stress exposure limit (28 °C), the systolic pressure and diastolic pressure of the acclimated workers are 121.1 mmHg and 81.3 mmHg, respectively (Figure 5 and Figure 6). For the same heat stress and labor intensity, the systolic pressure and diastolic pressure of the unacclimated college students are 108.8 mmHg and 63.8 mmHg, respectively [21]. Thus, the systolic pressure and diastolic pressure of the acclimated workers are 12.3 mmHg and 17.5 mmHg higher than those of the unacclimated college students, respectively.
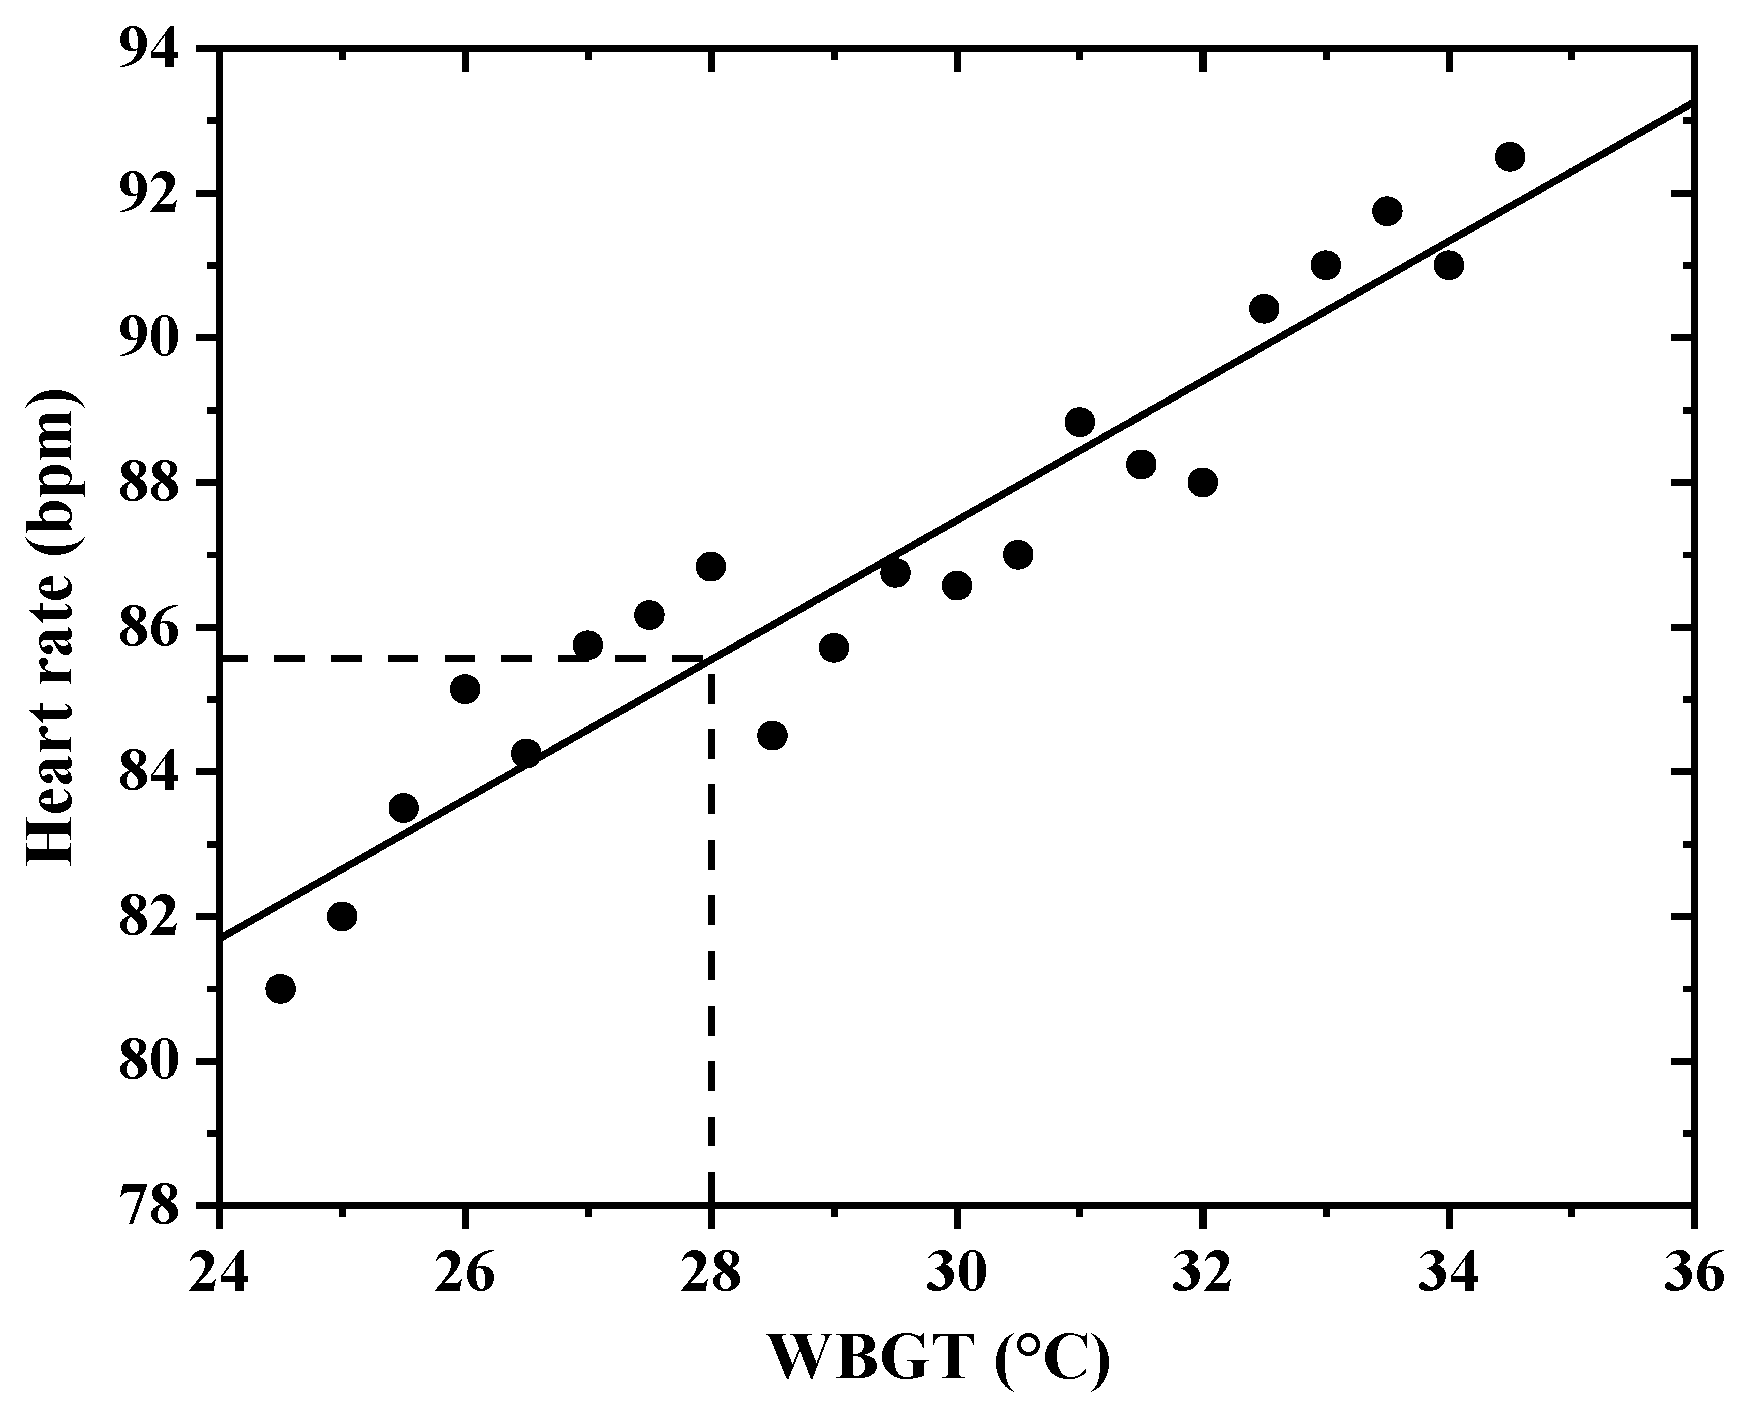
Figure 7 shows the variation in the heart rate of the acclimated workers with WBGT. When the WBGT increases from 24.5 °C to 34.5 °C, the heart rate increases from 81.0 bpm to 92.5 bpm. Therefore, when the WBGT increases by 1.0 °C, the heart rate increases by 1.4%. Figure 7 shows that the heart rate of the acclimated workers is 85.6 bpm when the WBGT reaches the heat stress exposure limit (28.0 °C). The heart rate of the unacclimated college students is 81.7 bpm [21], which is 3.9 bpm lower than that of the acclimated workers.
The physiological responses of the acclimated workers and unacclimated college students are significantly different. When the WBGT reaches the heat stress exposure limit (28.0 °C), the mean skin temperature and oral temperature of the acclimated workers are both 0.3 °C lower than those of the unacclimated college students. The systolic pressure, diastolic pressure, and heart rate of the acclimated workers are 12.3 mmHg, 17.5 mmHg, and 3.9 bpm higher than those of the unacclimated college students, respectively. This is because these workers have worked in hot environments for a long time, and have developed a certain degree of adaptation to heat stress. On the other hand, the workers are older than the college students. Therefore, the physiological indices of the college students obtained from the climatic chamber may not reflect the physiological responses of the workers in hot environments during the actual working process.

3.2. Subjective Thermal Perception

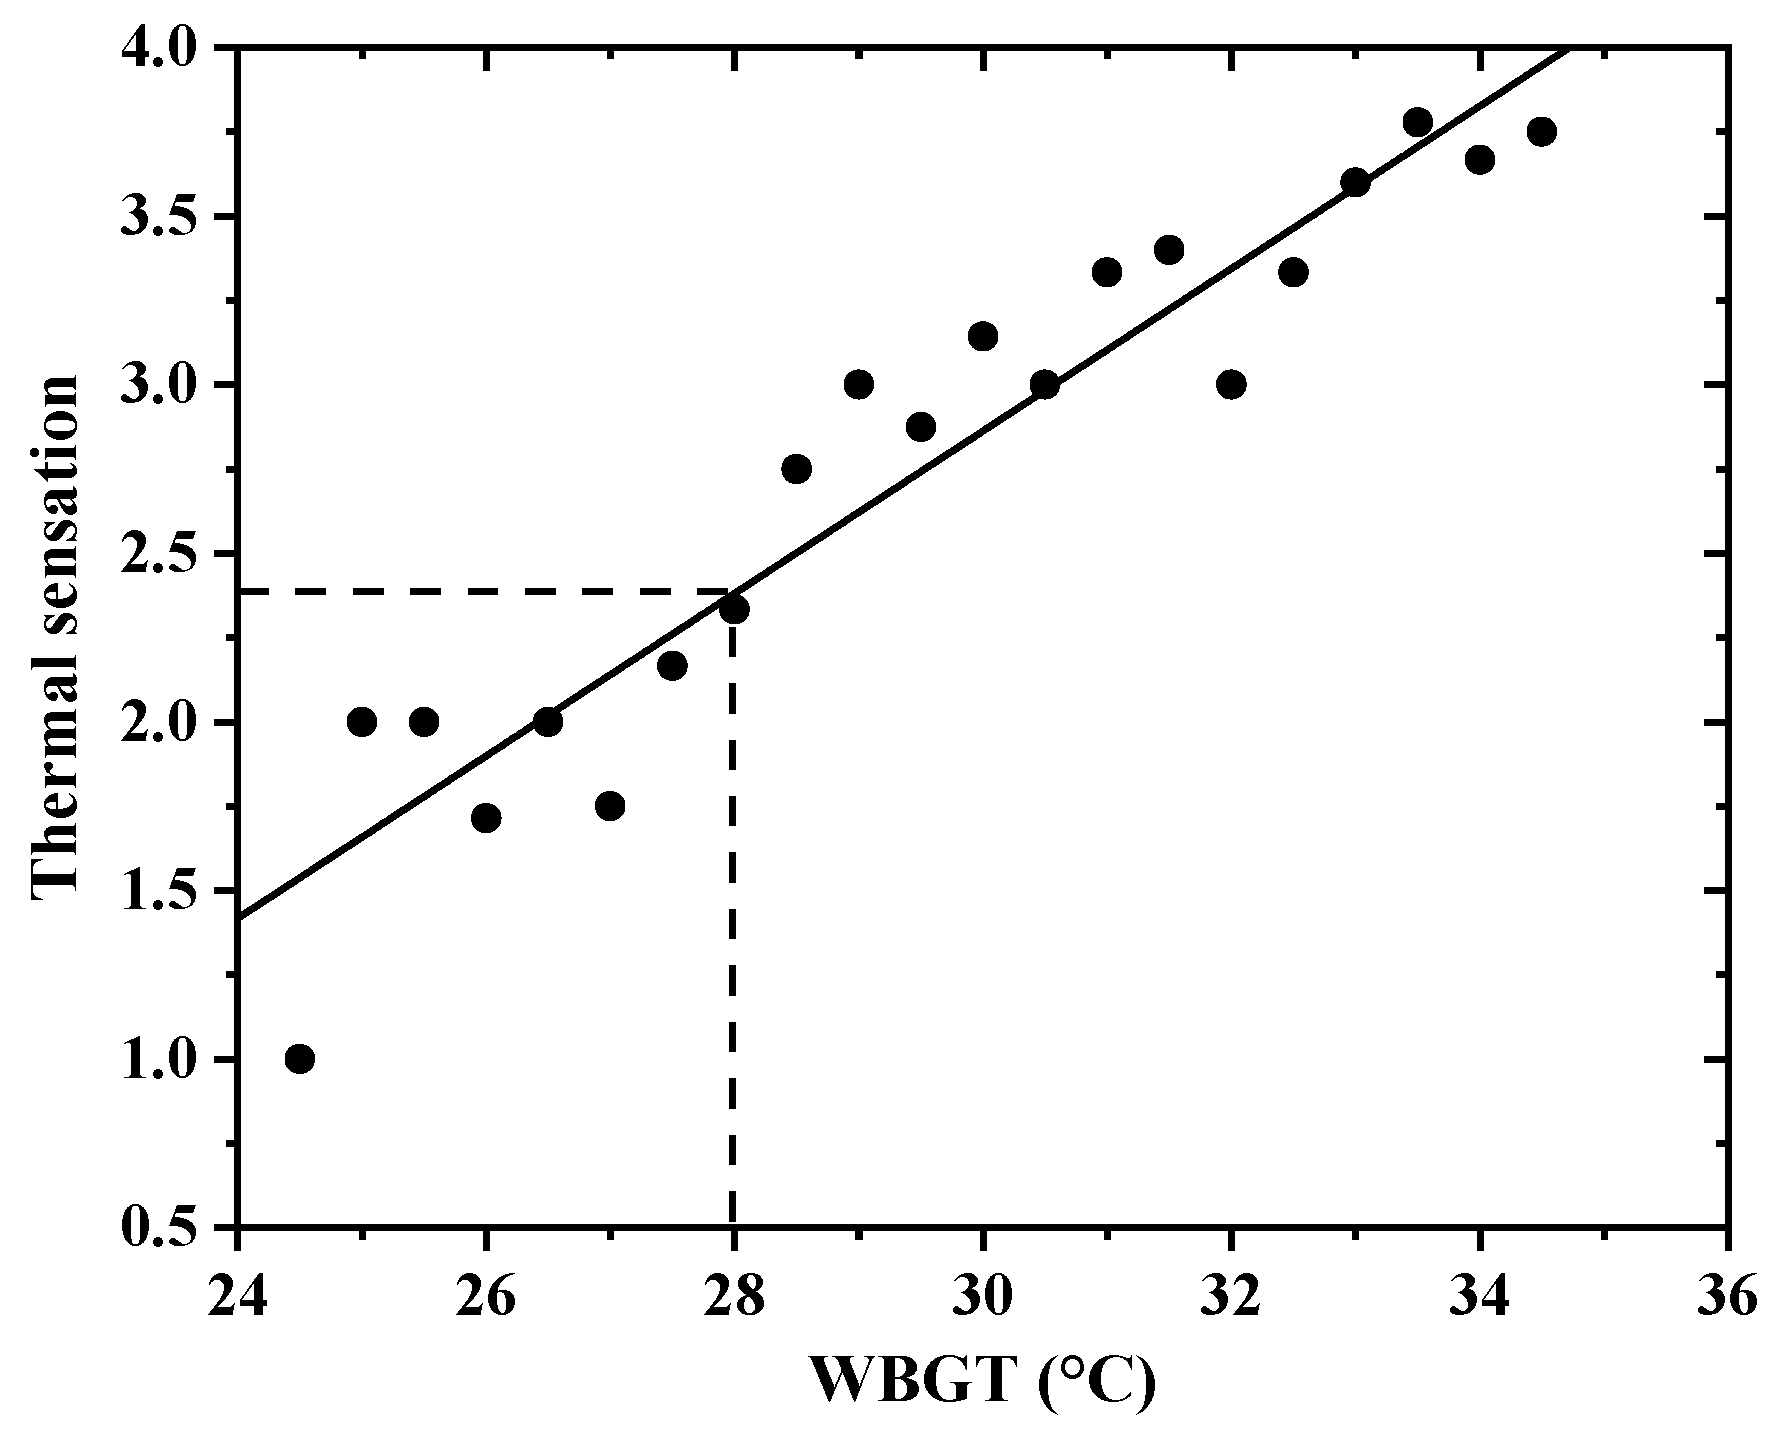
Figure 8 presents the variation of the thermal sensation of the acclimated workers with WBGT. The thermal sensation increases as the WBGT increases. When the WBGT increases from 24.5 °C to 34.5 °C, the thermal sensation score increases from 1.0 to 3.8. Therefore, when the WBGT increases by 1.0 °C, the thermal sensation score increases by approximately 0.3. This means that the thermal sensation increases by 3.0 scales, from slightly warm to very hot. When the WBGT reaches the heat stress exposure limit (28.0 °C), the thermal sensation score of the acclimated workers is 2.4 (as shown in Figure 8). For the same heat stress and labor intensity, the thermal sensation of the unacclimated college students is 3.2 [32]. Thus, the thermal sensation of the acclimated workers is 1.0 scale lower than that of the unacclimated college students.
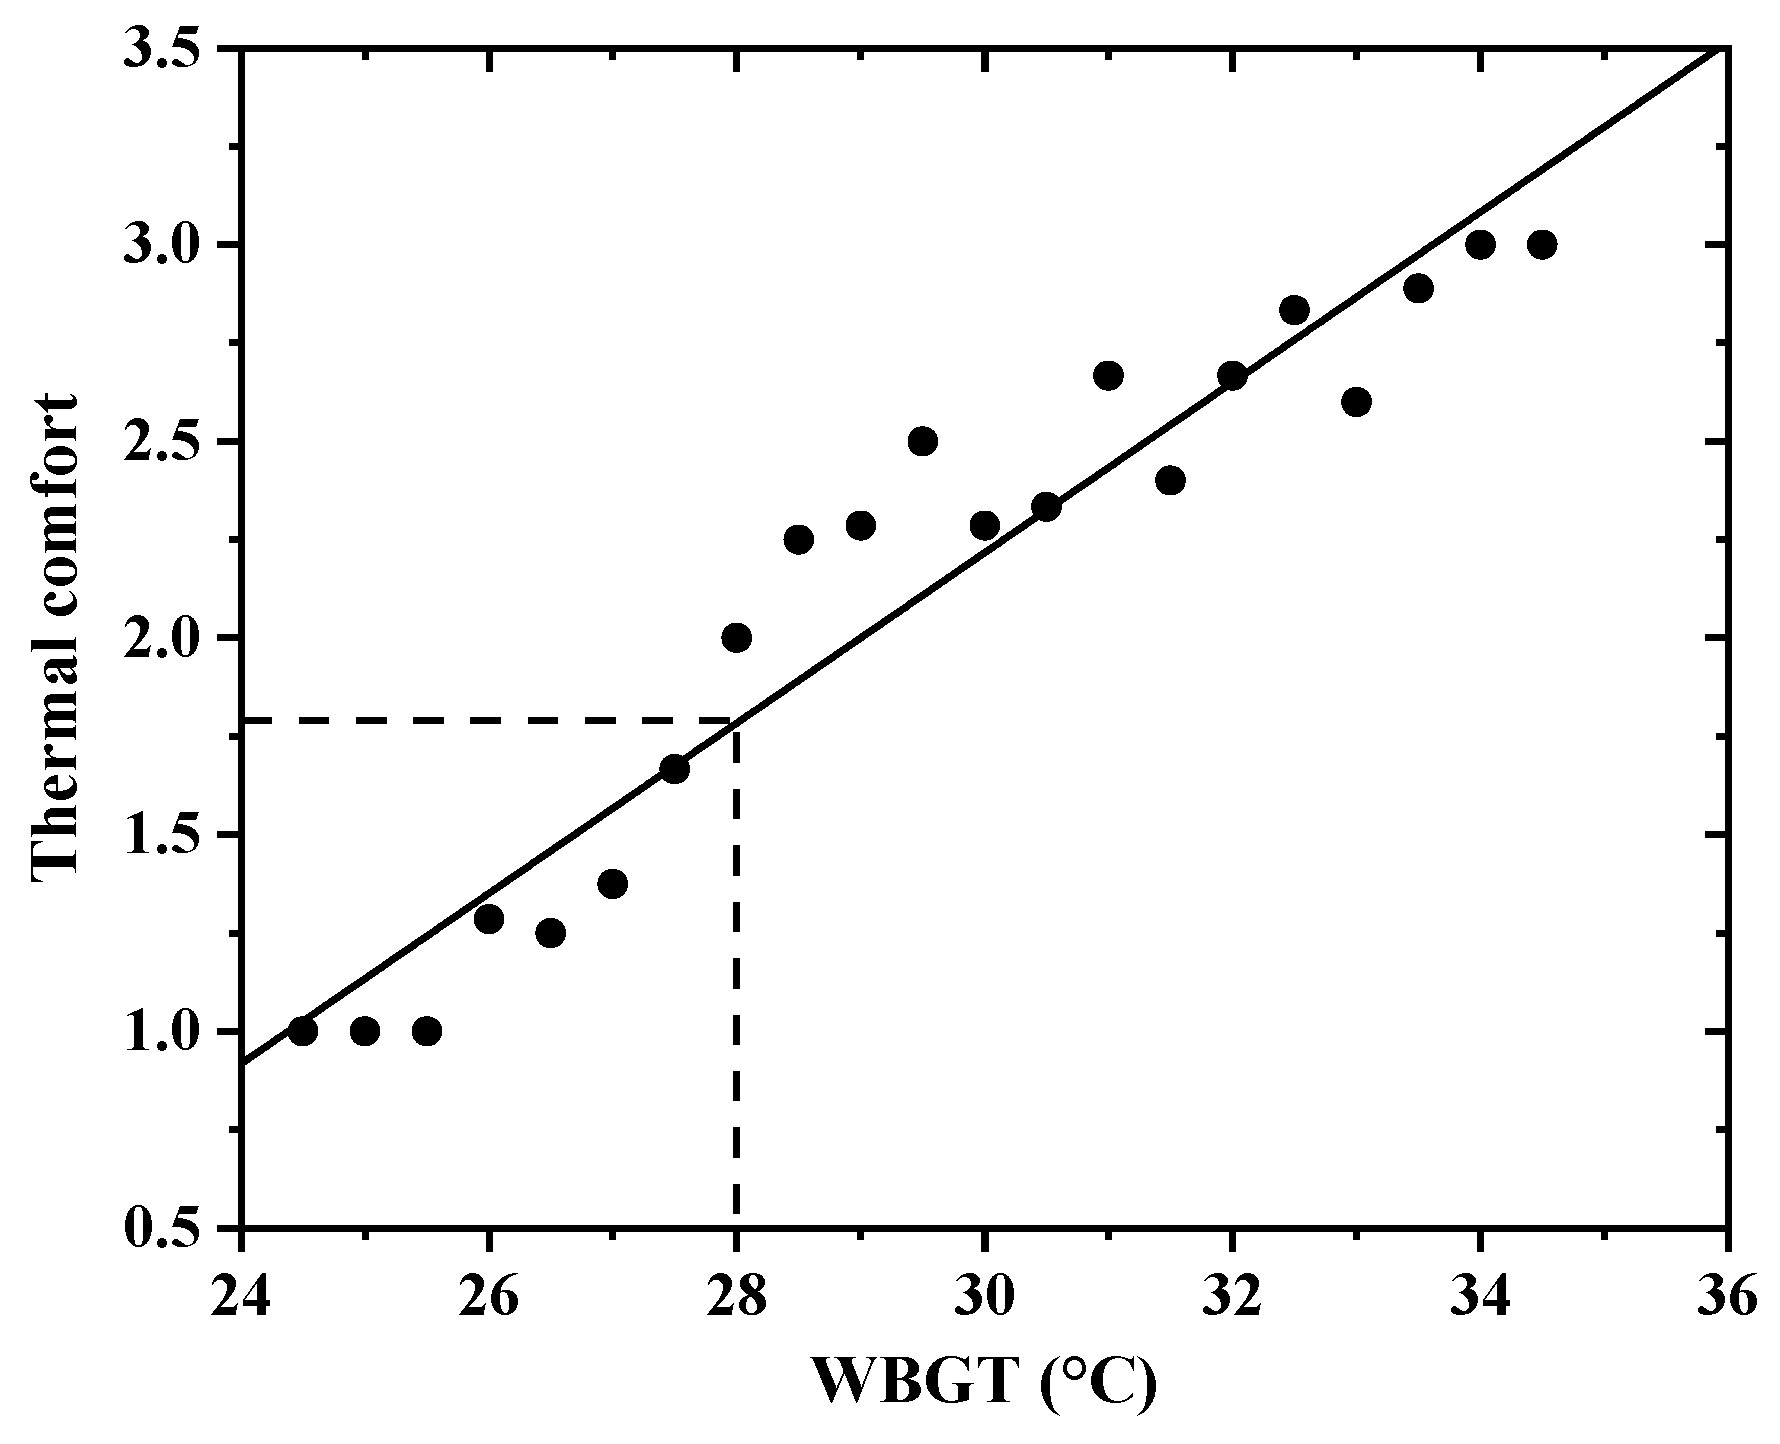
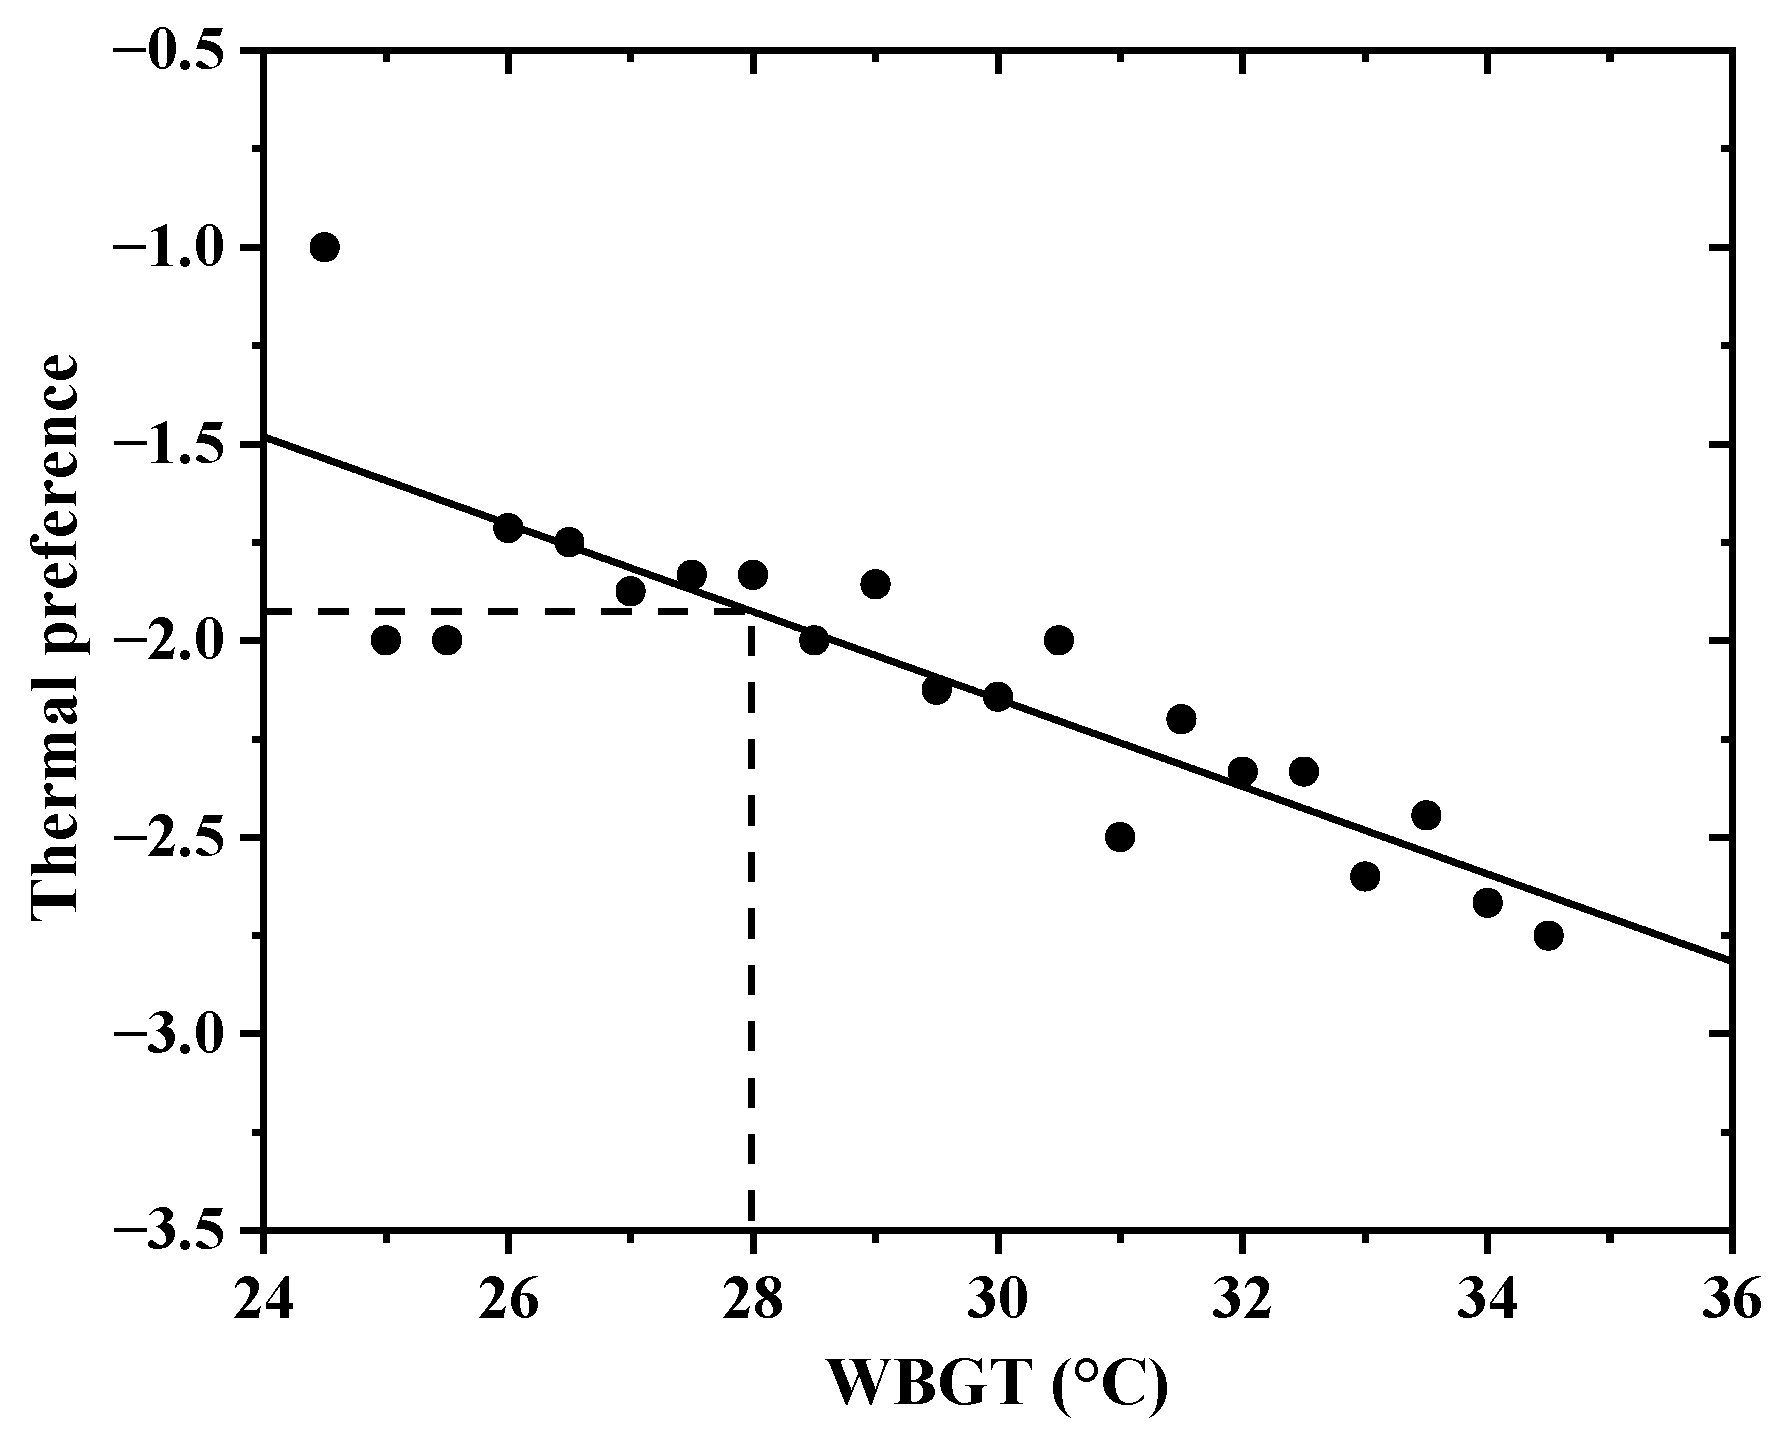
The variations of the thermal comfort and thermal preference of the acclimated workers with WBGT are shown in Figure 9 and Figure 10. As the WBGT increases, the thermal comfort increases, and the thermal preference decreases. When the WBGT increases from 24.5 °C to 34.5 °C, the thermal comfort score increases from 1.0 to 3.0, and the thermal preference score decreases from −1.0 to −2.8. Therefore, when the WBGT increases by 1.0 °C, the thermal comfort score increases by 0.2 and thermal preference score decreases by approximately 0.2, respectively. This means that the thermal comfort changes from slightly uncomfortable to very uncomfortable, and the thermal preference changes from slightly cooler to much cooler. When the WBGT reaches the heat stress exposure limit (28.0 °C), the thermal comfort and thermal preference scores of the acclimated workers are 1.8 and −1.9, respectively (as shown in Figure 9 and Figure 10). The thermal comfort and thermal preference scores of the unacclimated college students are 2.8 and −2.6, respectively [32]. Compared with the unacclimated college students, the acclimated workers feel more comfortable under the same heat stress.
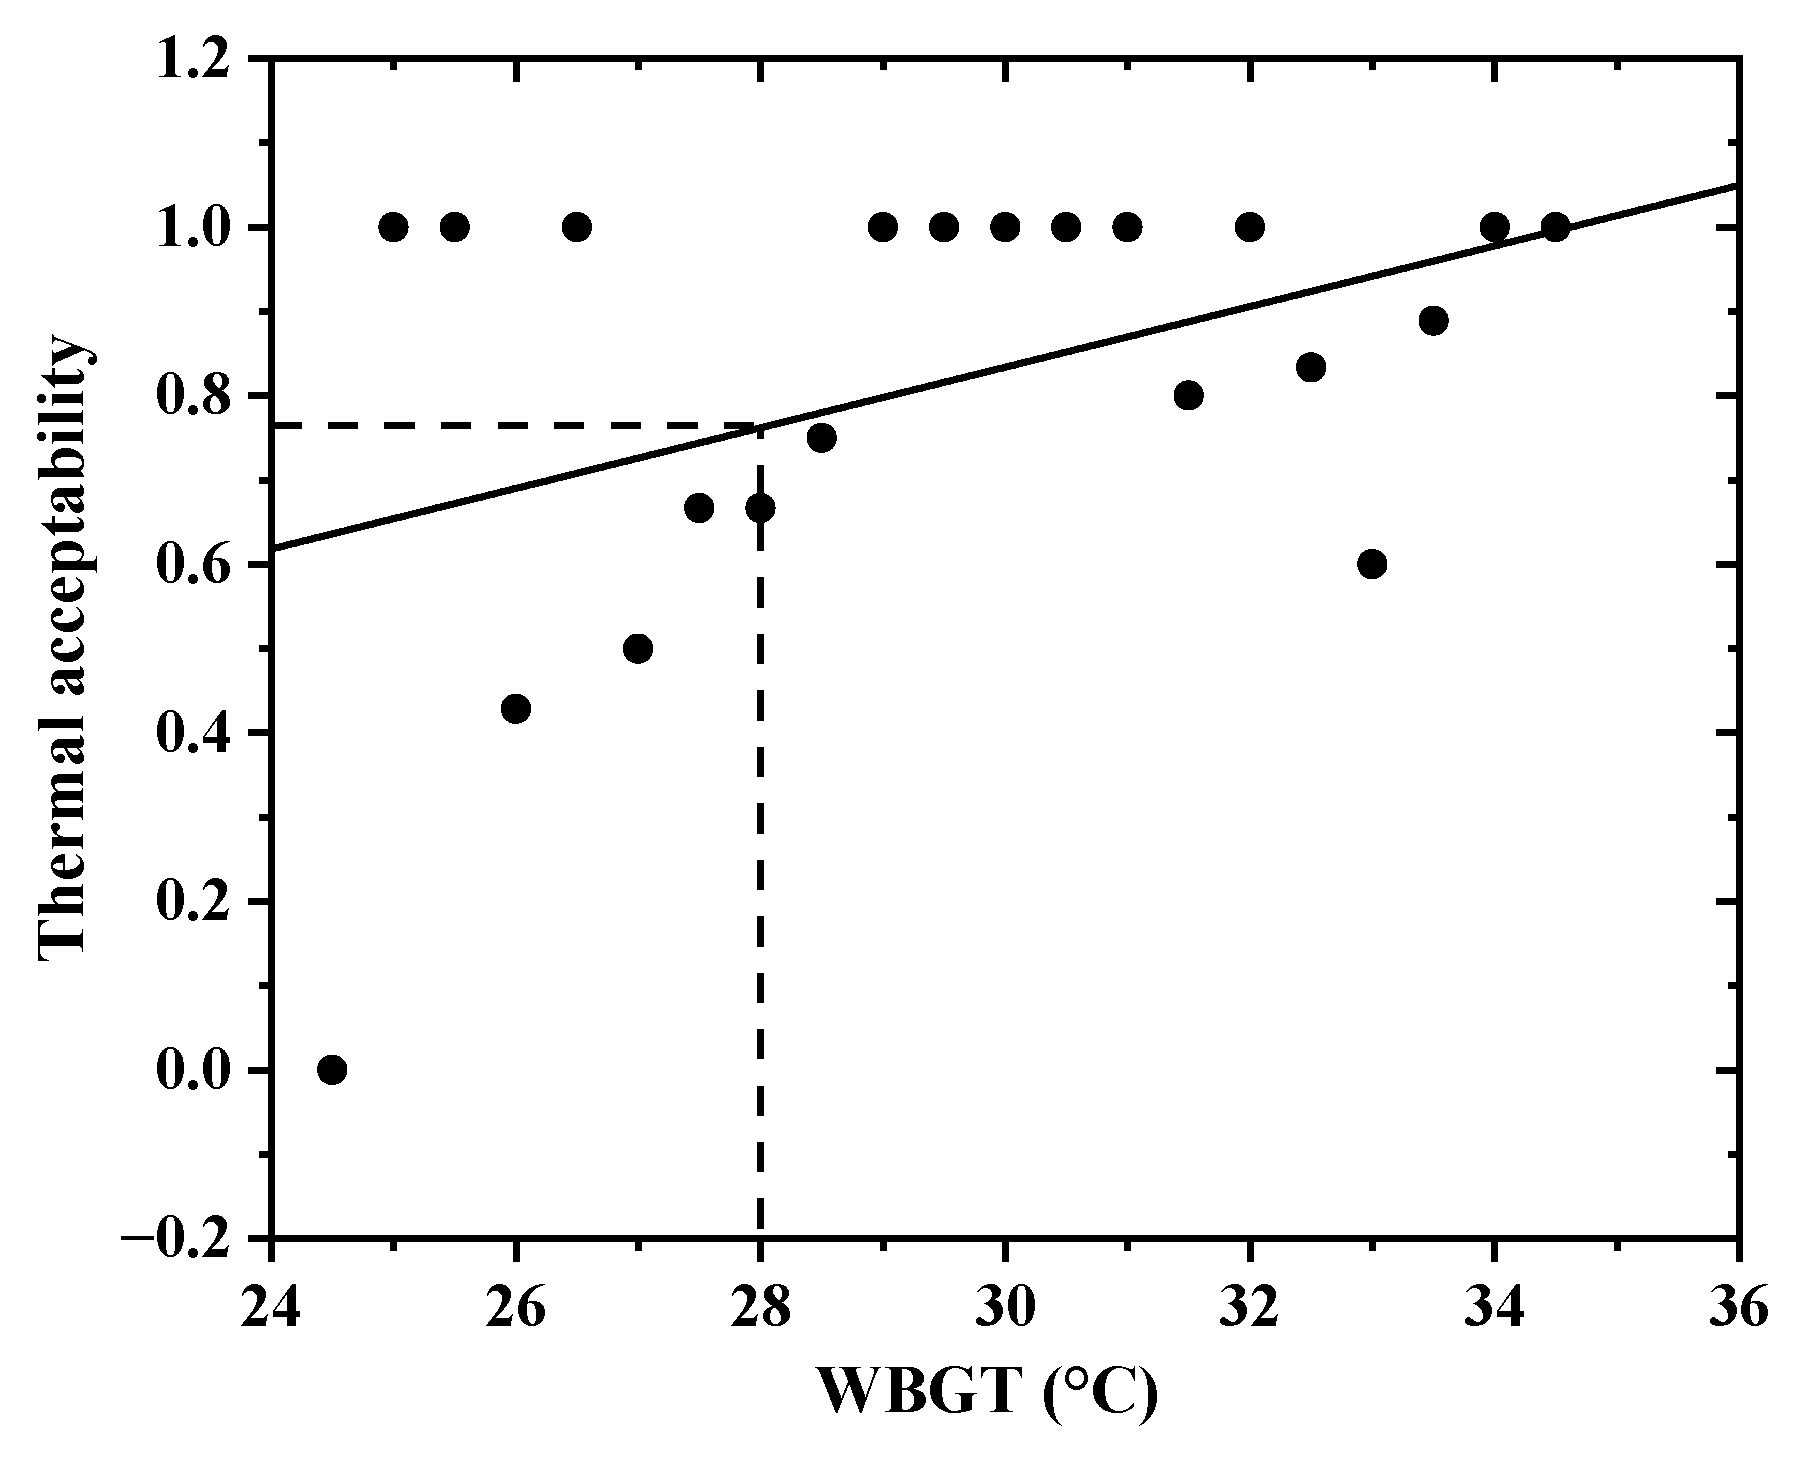
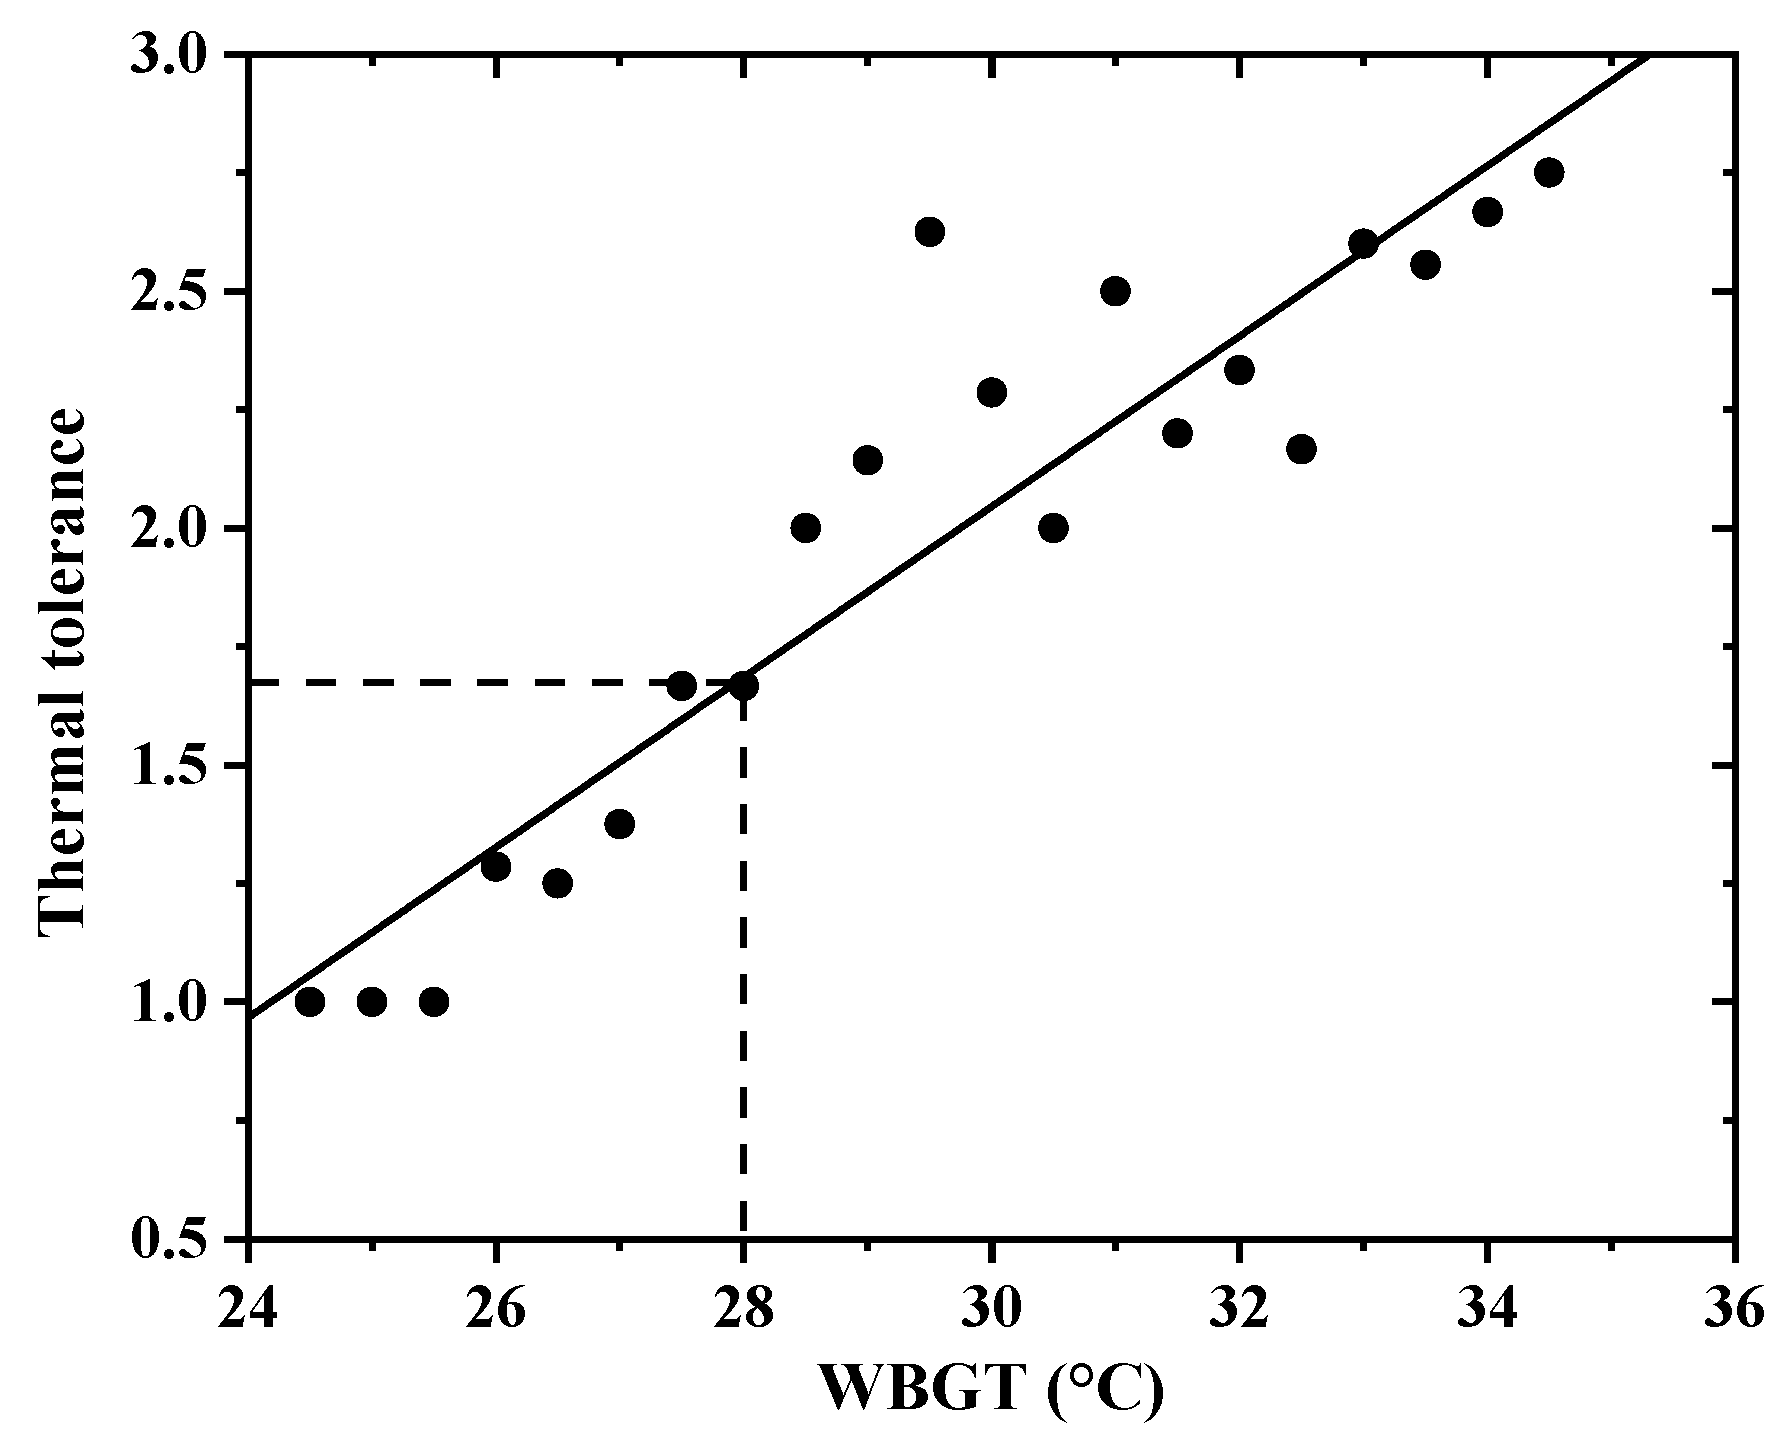
Figure 11 and Figure 12 show the variations of the thermal acceptability and thermal tolerance of the acclimated workers with WBGT. According to Figure 11, most workers cannot accept heat stress in hot environments, and the thermal acceptability is 1.0. The thermal tolerance increases as the WBGT increases, as shown in Figure 12. When the WBGT increases from 24.5 °C to 34.5 °C, the thermal tolerance score increases from 1 to 2.8. Therefore, when the WBGT increases by 1.0 °C, the thermal tolerance score increases by approximately 0.2. This means that the thermal tolerance changes from slightly intolerable to very difficult to tolerate. Figure 12 shows that the thermal tolerance is 1.7 when the WBGT reaches the heat stress exposure limit (28.0 °C). For the same heat stress and labor intensity, the thermal tolerance of the unacclimated college students is 2.4 [32]. Compared with the unacclimated college students, the acclimated workers feel more tolerant under the same heat stress. In addition, when the acclimated workers’ perception of the hot environments becomes fairly difficult to tolerate (thermal tolerance = 2.0), the WBGT is 29.7 °C, which is 3.2 °C higher than that of the unacclimated college students.
The thermal perceptions of the acclimated workers were analyzed. As the WBGT increases, the thermal sensation, thermal comfort, thermal acceptability, and thermal tolerance of the acclimated workers increases, while the thermal preference decreases. The acclimated workers feel the conditions are hot, uncomfortable, unacceptable, and fairly difficult to tolerate when the WBGT reaches the heat stress exposure limit (28.0 °C). Compared with the unacclimated college students, the acclimated workers feel more comfortable and tolerant under the same heat stress.

4. Discussion

4.1. Relationship between the Mean Skin Temperature and Thermal Sensation

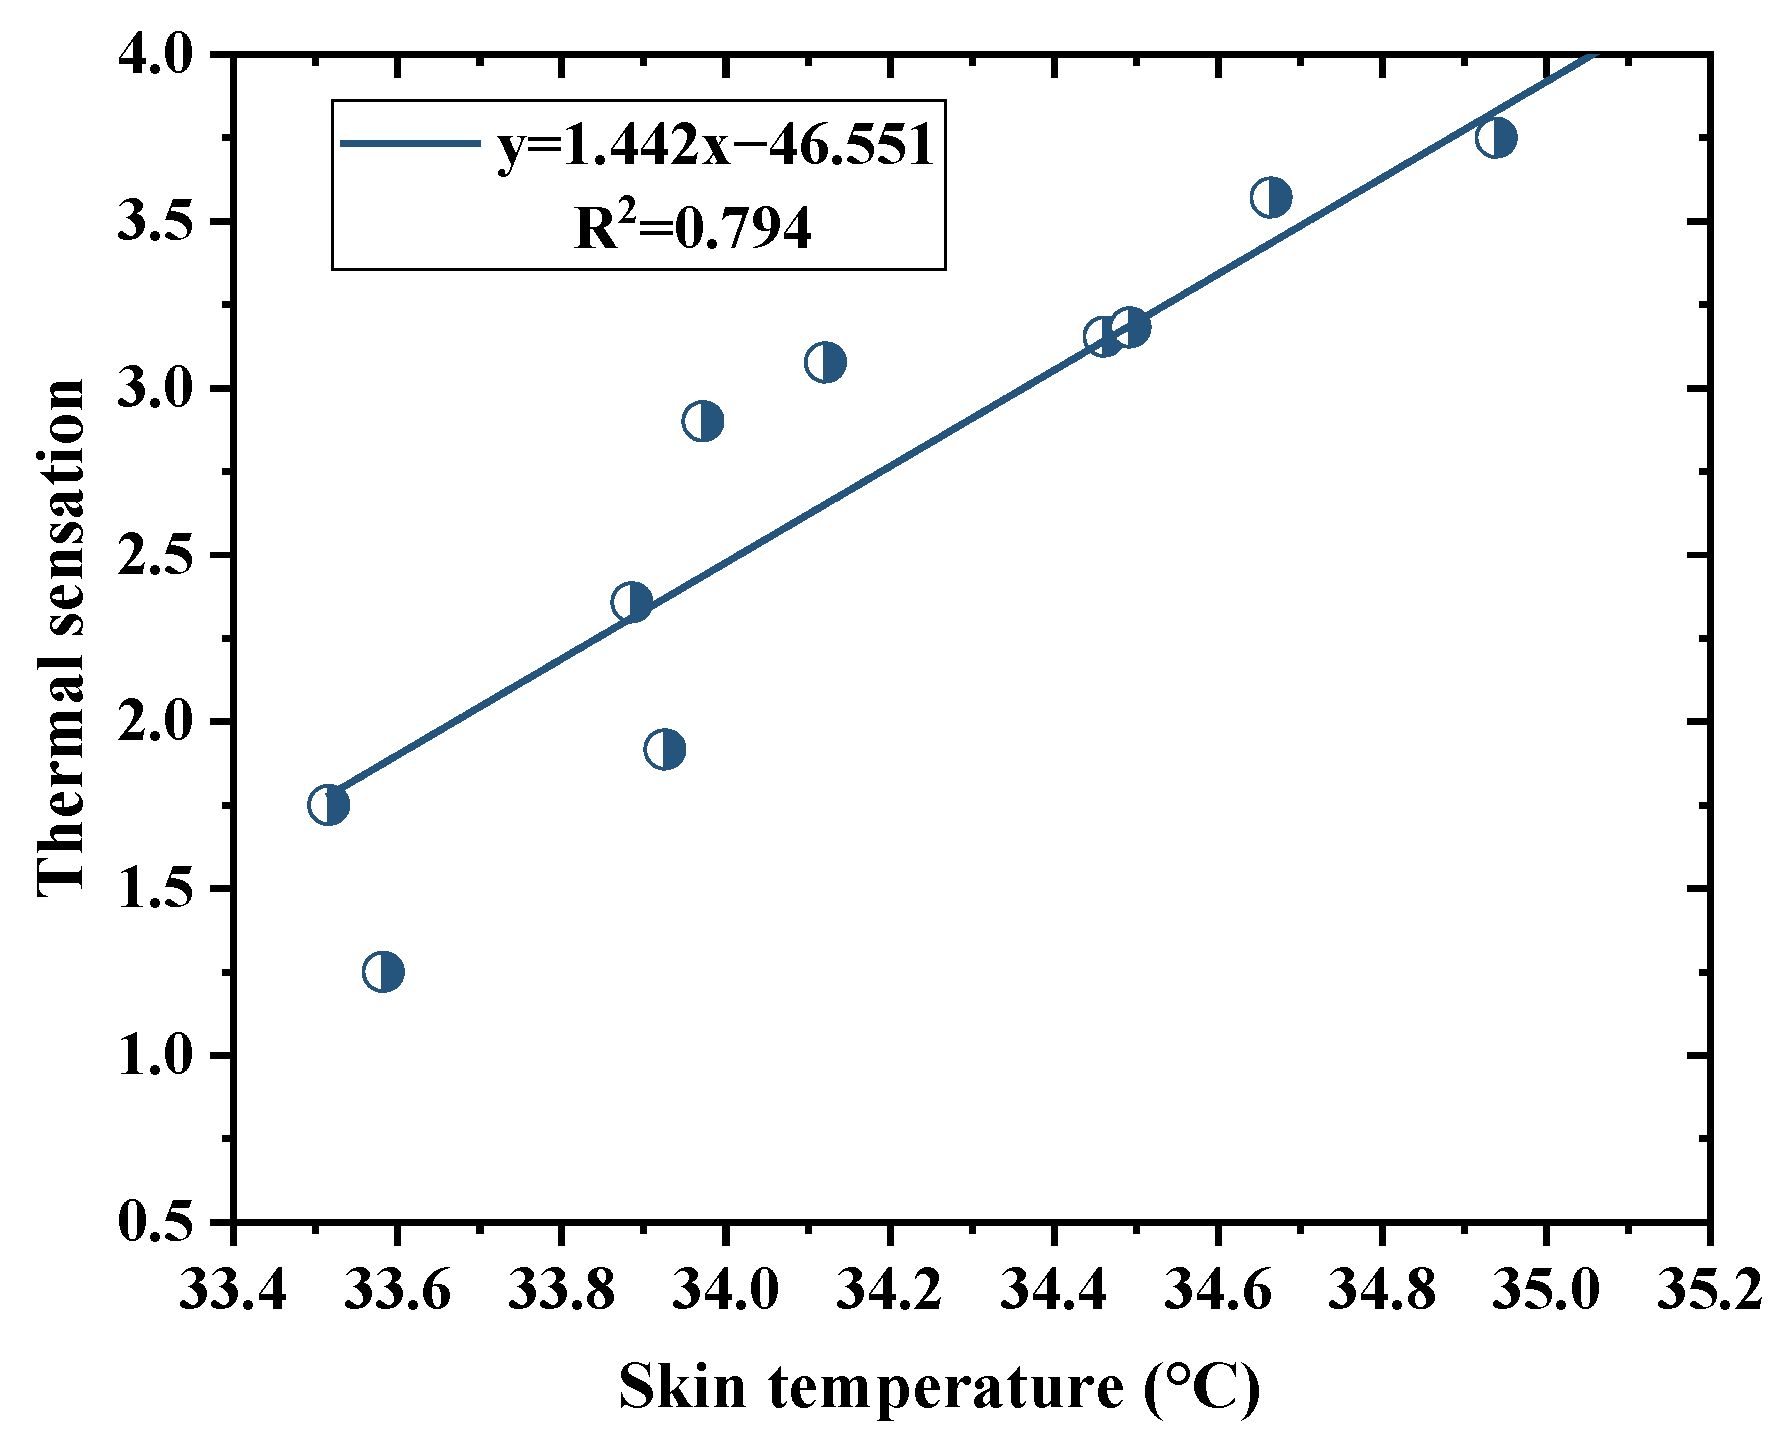
Previous studies shows that the mean skin temperature is significantly correlated with thermal sensation [26,27,42]. The relationship between the mean skin temperature and thermal sensation of the acclimated workers is shown in Figure 13. The thermal sensation increases linearly as the mean skin temperature increases. The linear relationship between the mean skin temperature (x) and thermal sensation (y) with R2 = 0.794 is as follows:
y = 1.442x − 46.551
According to Equation (1), the thermal sensation increases by approximately 1.4 scales when the mean skin temperature increases by 1.0 °C. The mean skin temperature is 32.3 °C when the acclimated workers felt thermal neutral in this study. In directed thermal radiation hot environments, the mean skin temperature of the subjects is 33.4 °C [26]. Wang et al. [27] found that the thermal neutral skin temperature is 33.6 °C in a non-uniform thermal environment. This is because the subjects in previous studies [26,27] are college students not acclimated to heat stress. However, this study focuses on subjects who are acclimated workers. Therefore, the thermal neutral mean skin temperature of the acclimated workers is approximately 1.0 °C lower than that in previous studies [26,27], and the acclimated workers have better adaptability to heat stress.

4.2. WBGT Limits for Heat Stress Work

In this paper, the workers performed at a moderate labor intensity. According to ISO 7243, WBGT reference limits have a difference of 2.0 °C between acclimated and unacclimated persons for moderate labor intensity [30]. The ACGIH sets a threshold limit value WBGT of 28.0 °C for acclimated persons, and an action limit WBGT of 25.0 °C for unacclimated persons, with a WBGT difference of 3.0 °C for moderate labor intensity [31]. However, WBGT limits for heat stress work do not consider the difference between acclimated and unacclimated persons in the national occupational health standard GBZ 2.2 [4]. In this study, the acclimated workers’ perception of the hot environments became fairly difficult to tolerate (thermal tolerance = 2.0) when the WBGT is 29.7 °C, which is 3.2 °C higher than that of the unacclimated college students. The result of this study coincides well with ISO 7243 and the ACGIH, which may help edit the national occupational health standard in China.
The subjects of the previous studies are mostly college students [25,26,27,32,34], and do not reflect the thermal responses of the workers. It required careful evaluation in applying the results of these studies. In addition, the climatic chamber cannot simulate the real work environment. The purpose of this study was to investigate the thermal responses of workers in an actual industrial plant. The differences in thermal responses between the acclimated workers and unacclimated college students exposed to heat stress were compared and analyzed. The findings of this study are important for protecting workers in hot environments.
In this paper, the workers worked in a casting plant. The correlation between physiological indices and WBGT was studied. Zare et al. [33] compare the correlation between heat stress indices and physiological parameters among mine workers. They found no measurable correlation between heat stress indices and workers’ physiological parameters. The statistically significant correlation coefficients between skin temperature and the WBGT were recorded. Therefore, the correlation coefficients on the relationships between heat indices and physiological parameters are not the same in various industries.
However, the exposure duration was not considered in this study. The thermal environment was a dynamic change in an actual industrial plant. In addition, the acclimated workers and unacclimated college students are not the same age and have different work history. The differences in thermal responses between acclimated and unacclimated workers, as well as the differences between acclimated and unacclimated college students exposed to heat stress, will be investigated in the future.

5. Conclusions

In this study, the thermal responses of heat stress-exposed workers in an industrial plant were investigated. During the measurement, the environmental parameters, physiological indices, and subjective thermal perception of the 14 acclimated workers were collected. The variations of the physiological indices and subjective thermal perception with WBGT were analyzed. The relationship between the mean skin temperature and thermal sensation was revealed. The main conclusions of this study are as follows:
The mean skin temperature, oral temperature, and heart rate of the acclimated workers increase with WBGT, while the blood pressure decreases with WBGT. The physiological responses of the acclimated workers and unacclimated college students are significantly different. When the WBGT reaches the heat stress exposure limit (28.0 °C), the mean skin temperature and oral temperature of the acclimated workers are both 0.3 °C lower than those of the unacclimated college students. The systolic pressure, diastolic pressure, and heart rate of the acclimated workers are 12.3 mmHg, 17.5 mmHg, and 3.9 bpm higher than those of the unacclimated college students, respectively.
As the WBGT increases, the thermal sensation, thermal comfort, thermal acceptability, and thermal tolerance of the acclimated workers increase, while the thermal preference decreases. The acclimated workers felt hot and uncomfortable, and the thermal environment was unacceptable and fairly difficult to tolerate when the WBGT reaches the heat stress exposure limit (28.0 °C). Compared with the unacclimated college students, the acclimated workers feel more comfortable and tolerant under the same heat stress.
The thermal sensation of the acclimated workers increases by approximately 1.4 scales when the mean skin temperature increases by 1.0 °C. The thermal neutral mean skin temperature of the acclimated workers is 32.3 °C, which is approximately 1.0 °C lower than that of the unacclimated college students.
When the WBGT exceeded the heat stress exposure limit, the workers faced heat stress risk. Specific control measures are recommended to mitigate the heat stress risk, including enhanced ventilation of the working environment and reduced working hours.

Author Contributions

Conceptualization, X.M. and S.X.; methodology, X.M.; data curation, S.X. and K.A.; writing—original draft preparation, S.X.; writing—review and editing, X.M. and Y.C. All authors checked the results and finalized the manuscript. All authors have read and agreed to the published version of the manuscript.

Funding

This research project was funded by the National Key R&D Program of China (Grant No. 2018YFC0705300).

Institutional Review Board Statement

The study was conducted in accordance with the Declaration of Helsinki. All subjects gave their informed consent for inclusion before they participated in the study.

Informed Consent Statement

Informed consent was obtained from all subjects involved in the study. Written informed consent was obtained from the patient(s) to publish this paper.

Data Availability Statement

The data presented in this study are available on request from the corresponding author.

Conflicts of Interest

The authors declare no conflict of interest.

References

  1. National Bureau of Statistics. Available online: http://www.stats.gov.cn/ (accessed on 15 March 2020).
  2. Meng, X.J.; Wang, Y.; Liu, T.N.; Xing, X.; Cao, Y.X.; Zhao, J.P. Influence of radiation on predictive accuracy in numerical simulation of thermal environment in industrial buildings with buoyancy-driven natural ventilation. Appl. Therm. Eng. 2016, 96, 473–480. [Google Scholar] [CrossRef]
  3. Wang, Y.; Gao, J.; Xing, X.; Liu, Y.L.; Meng, X.J. Measurement and evaluation of indoor thermal environment in a naturally ventilated industrial building with high temperature heat sources. Build. Environ. 2016, 96, 35–45. [Google Scholar] [CrossRef]
  4. GBZ 2.2; Occupational Exposure Limits for Hazardous Agents in the Workplace, Part 2: Physical Agents. PRC Hygiene Ministry: Beijing, China, 2007.
  5. Qian, Q.Z.; Cao, X.K.; Meng, C.Y.; Bai, Y.P.; Li, Q.Z.; Zhu, H.; Li, X.R.; Li, J. Hypertension and its risk factors among high temperature workers in Hebei Steel Group. Occup. Health 2017, 33, 1466–1469. [Google Scholar]
  6. Zhang, L. Analysis on electrocardiogram of 732 workers exposed to high temperature in an electrical appliance manufacturing enterprise of Guangzhou City. Occup. Health 2016, 32, 2631–2633. [Google Scholar]
  7. Krishnamurthy, M.; Ramalingam, P.; Perumal, K.; Kamalakannan, L.P.; Chinnadurai, J.; Shanmugam, R.; Srinivasan, K.; Venugopal, V. Occupational heat stress impacts on health and productivity in a steel industry in southern India. Saf. Health Work 2017, 8, 99–104. [Google Scholar] [CrossRef] [PubMed] [Green Version]
  8. Hemmatjo, R.; Motamedzade, M.; Aliabadi, M.; Kalatpou, O.; Farhadian, M. The effects of multiple firefighting activities on information processing and work performance in a smoke-diving room: An intervention study. Hum. Factor. Ergon. Manuf. Serv. Ind. 2017, 27, 261–267. [Google Scholar] [CrossRef]
  9. Park, H.-J.; Jeong, B.-Y. Construction Workers and Sustainability: Work-Related Risk Factors and Health Problems. Sustainability 2021, 13, 13179. [Google Scholar] [CrossRef]
  10. McArdle, B.; Dunham, W.; Holling, H.E.; Ladell, W.S.S.; Scott, J.W.; Thomson, M.L.; Weiner, J.S.; Hölling, H. The prediction of the physiological effects of warm and hot environments: The P4SR index. Med. Res. Coun. 1947, 47, 391–396. [Google Scholar]
  11. Belding, H.S.; Hatch, T.F. Index for evaluating heat stress in terms of resulting physiological strains. Heat. Pip. Air Condit. 1955, 27, 129–136. [Google Scholar]
  12. Moran, D.S.; Shitzer, A.; Pandolf, K.B. A physiological strain index to evaluate heat stress. Am. J. Physiol. 1998, 275, 129–134. [Google Scholar] [CrossRef] [Green Version]
  13. Malchaire, J.; Piette, A.; Kampmann, B.; Mehnert, P.; Gebhardt, H.; Havenith, G.; Hartog, E.D.; Holmer, I.; Parsons, K.; Alfano, G.; et al. Development and validation of the predicted heat strain model. Ann. Occup. Hyg. 2001, 45, 123–135. [Google Scholar] [CrossRef]
  14. ISO Standard 7933; Ergonomics of the Thermal Environment—Analytical Determination and Interpretation of Heat Stress Using Calculation of the Predicted Heat Strain. ISAO: Geneva, Switzerland, 2004.
  15. Malchaire, J. Occupational heat stress assessment by the predicted heat strain model. Ind. Health 2006, 44, 380–387. [Google Scholar] [CrossRef] [PubMed] [Green Version]
  16. Rowlinson, S.; Jia, A.Y. Application of the predicted heat strain model in development of localized, threshold-based heat stress management guidelines for the construction industry. Ann. Occup. Hyg. 2014, 58, 326–339. [Google Scholar] [PubMed] [Green Version]
  17. Jia, A.Y.; Rowlinson, S.; Ciccarelli, M. Climatic and psychosocial risks of heat illness incidents on construction site. Appl. Ergon. 2016, 53, 25–35. [Google Scholar] [CrossRef]
  18. Du, C.Q.; Li, B.Z.; Li, Y.Q.; Xu, M.N.; Yao, R.M. Modification of the predicted heat strain (PHS) model in predicting human thermal responses for Chinese workers in hot environments. Build. Environ. 2019, 165, 106349. [Google Scholar] [CrossRef]
  19. Yang, J.; Weng, W.G.; Zhang, B.T. Experimental and numerical study of physiological responses in hot environments. J. Therm. Biol. 2014, 45, 54–61. [Google Scholar] [CrossRef]
  20. Zheng, G.Z.; Li, K.; Bu, W.T.; Wang, Y.J. Fuzzy comprehensive evaluation of human physiological state in indoor high temperature environments. Build. Environ. 2019, 150, 108–118. [Google Scholar] [CrossRef]
  21. Meng, X.J.; Jia, K.F.; Zhang, D.W. Fuzzy comprehensive evaluation of human physiological state in the heat stress work environment. J. Safe Environ. 2021, 21, 1630–1635. [Google Scholar]
  22. Pantavou, K.; Theoharatos, G.; Mavrakis, A.; Santamouris, M. Evaluating thermal comfort conditions and health responses during an extremely hot summer in Athens. Build. Environ. 2011, 46, 339–344. [Google Scholar] [CrossRef]
  23. Zhang, H.; Huizenga, C.; Arens, E. Thermal sensation and comfort in transient non-uniform thermal environments. Eur. J. Appl. Physiol. 2004, 92, 728–733. [Google Scholar] [CrossRef]
  24. Nag, P.K.; Ashtekar, S.P.; Nag, A.; Kothari, D.; Bandyopadhyay, P.; Desai, H. Human heat tolerance in simulated environment. Indian J. Med. Res. 1997, 105, 728–733. [Google Scholar]
  25. Zhang, S.; Zhu, N.; Lv, S.L. Human response and productivity in hot environments with directed thermal radiation. Build. Environ. 2021, 187, 107408. [Google Scholar] [CrossRef]
  26. Zhang, S.; Zhu, N.; Lv, S.L. Responses of human perception and skin temperature to directed thermal radiation in hot environments. Build. Environ. 2021, 197, 107857. [Google Scholar] [CrossRef]
  27. Wang, D.J.; Chen, G.X.; Song, C. Experimental study on coupling effect of indoor air temperature and radiant temperature on human thermal comfort in non-uniform thermal environment. Build. Environ. 2019, 165, 106387. [Google Scholar] [CrossRef]
  28. Ghani, S.; Mahgoub, A.O.; Bakochristou, F.; Elbialy, E.A. Assessment of thermal comfort indices in an open air-conditioned stadium in hot and arid environment. J. Build. Eng. 2021, 40, 102378. [Google Scholar] [CrossRef]
  29. Ghani, S.; Bialy, E.M.; Bakochristou, F.; Gamaledin, S.M.A.; Rashwan, M.M.; Hughes, B. Thermal comfort investigation of an outdoor air-conditioned area in a hot and arid environment. Sci. Technol. Built Environ. 2017, 23, 1113–1131. [Google Scholar] [CrossRef] [Green Version]
  30. ISO Standard 7243; Ergonomics of the Thermal Environment—Assessment of Heat Stress Using the WBGT (Wet Bulb Globe Temperature) Index. ISAO: Geneva, Switzerland, 2017.
  31. ACGIH. TLVs® and BEIs®—Based on the Documentation of the Threshold Limit Values for Chemical Substances and Physical Agents & Biological Exposure Indices; ACGIH: Cincinnati, OH, USA, 2019. [Google Scholar]
  32. Gao, J. Study on the Evaluation Method of Indoor Thermal Environment in Naturally Ventilated Buildings with Different Temperature Heat Source. Ph.D. Thesis, Xi’an University of Architecture and Technology, Xi’an, China, 2016. [Google Scholar]
  33. Zare, S.; Shirvan, H.E.; Hemmatjo, R.; Nadri, F.; Jahani, Y.; Jamshidzadeh, K.; Paydar, P. A comparison of the correlation between heat stress indices (UTCI, WBGT, WBDT, TSI) and physiological parameters of workers in Iran. Weather Clim. Extrem. 2019, 26, 100213. [Google Scholar] [CrossRef]
  34. Tian, Z.; Zhu, N.; Zheng, G.Z.; Wei, H.J. Experimental study on physiological and psychological effects of heat acclimatization in extreme hot environments. Build. Environ. 2011, 46, 2033–2041. [Google Scholar] [CrossRef]
  35. GBZ/T 189.7; Measurement of Physical Agents in Workplace Part 7: Heat Stress. PRC Hygiene Ministry: Beijing, China, 2007.
  36. Nagano, K.; Takaki, A.; Hirakawa, M.; Tochihara, Y. Effects of ambient temperature steps on thermal comfort requirements. Int. J. Biometeorol. 2005, 50, 30–39. [Google Scholar] [CrossRef]
  37. Wang, Z.J.; He, Y.N.; Hou, J.; Jiang, L. Human skin temperature and thermal responses in asymmetrical cold radiation environments. Build. Environ. 2013, 67, 217–223. [Google Scholar] [CrossRef]
  38. ISO Standard 10551; Ergonomics of the Thermal Environment—Assessment of the Influence of the Thermal Environment Using Subjective Judgement Scales. ISAO: Geneva, Switzerland, 1995.
  39. GB/T 18977; Ergonomics of the Thermal Environment-Assessment of the Influence of the Thermal Environment Using Subjective Judgement Scales. Standards Press of China: Beijing, China, 2003.
  40. Zhao, H.X.; Zhou, S.N.; Xiao, H. The comparison and discussion of four criterions of Gross-error detection. Phys. Exp. Coll. 2017, 30, 105–107. [Google Scholar]
  41. Zhu, Y.X. Building Environment; China Architecture and Building Press: Beijing, China, 2010. [Google Scholar]
  42. Chen, C.P.; Hwang, R.L.; Chang, S.Y.; Liu, Y.T. Effects of temperature steps on human skin physiology and thermal sensation response. Build. Environ. 2011, 46, 2387–2397. [Google Scholar] [CrossRef]
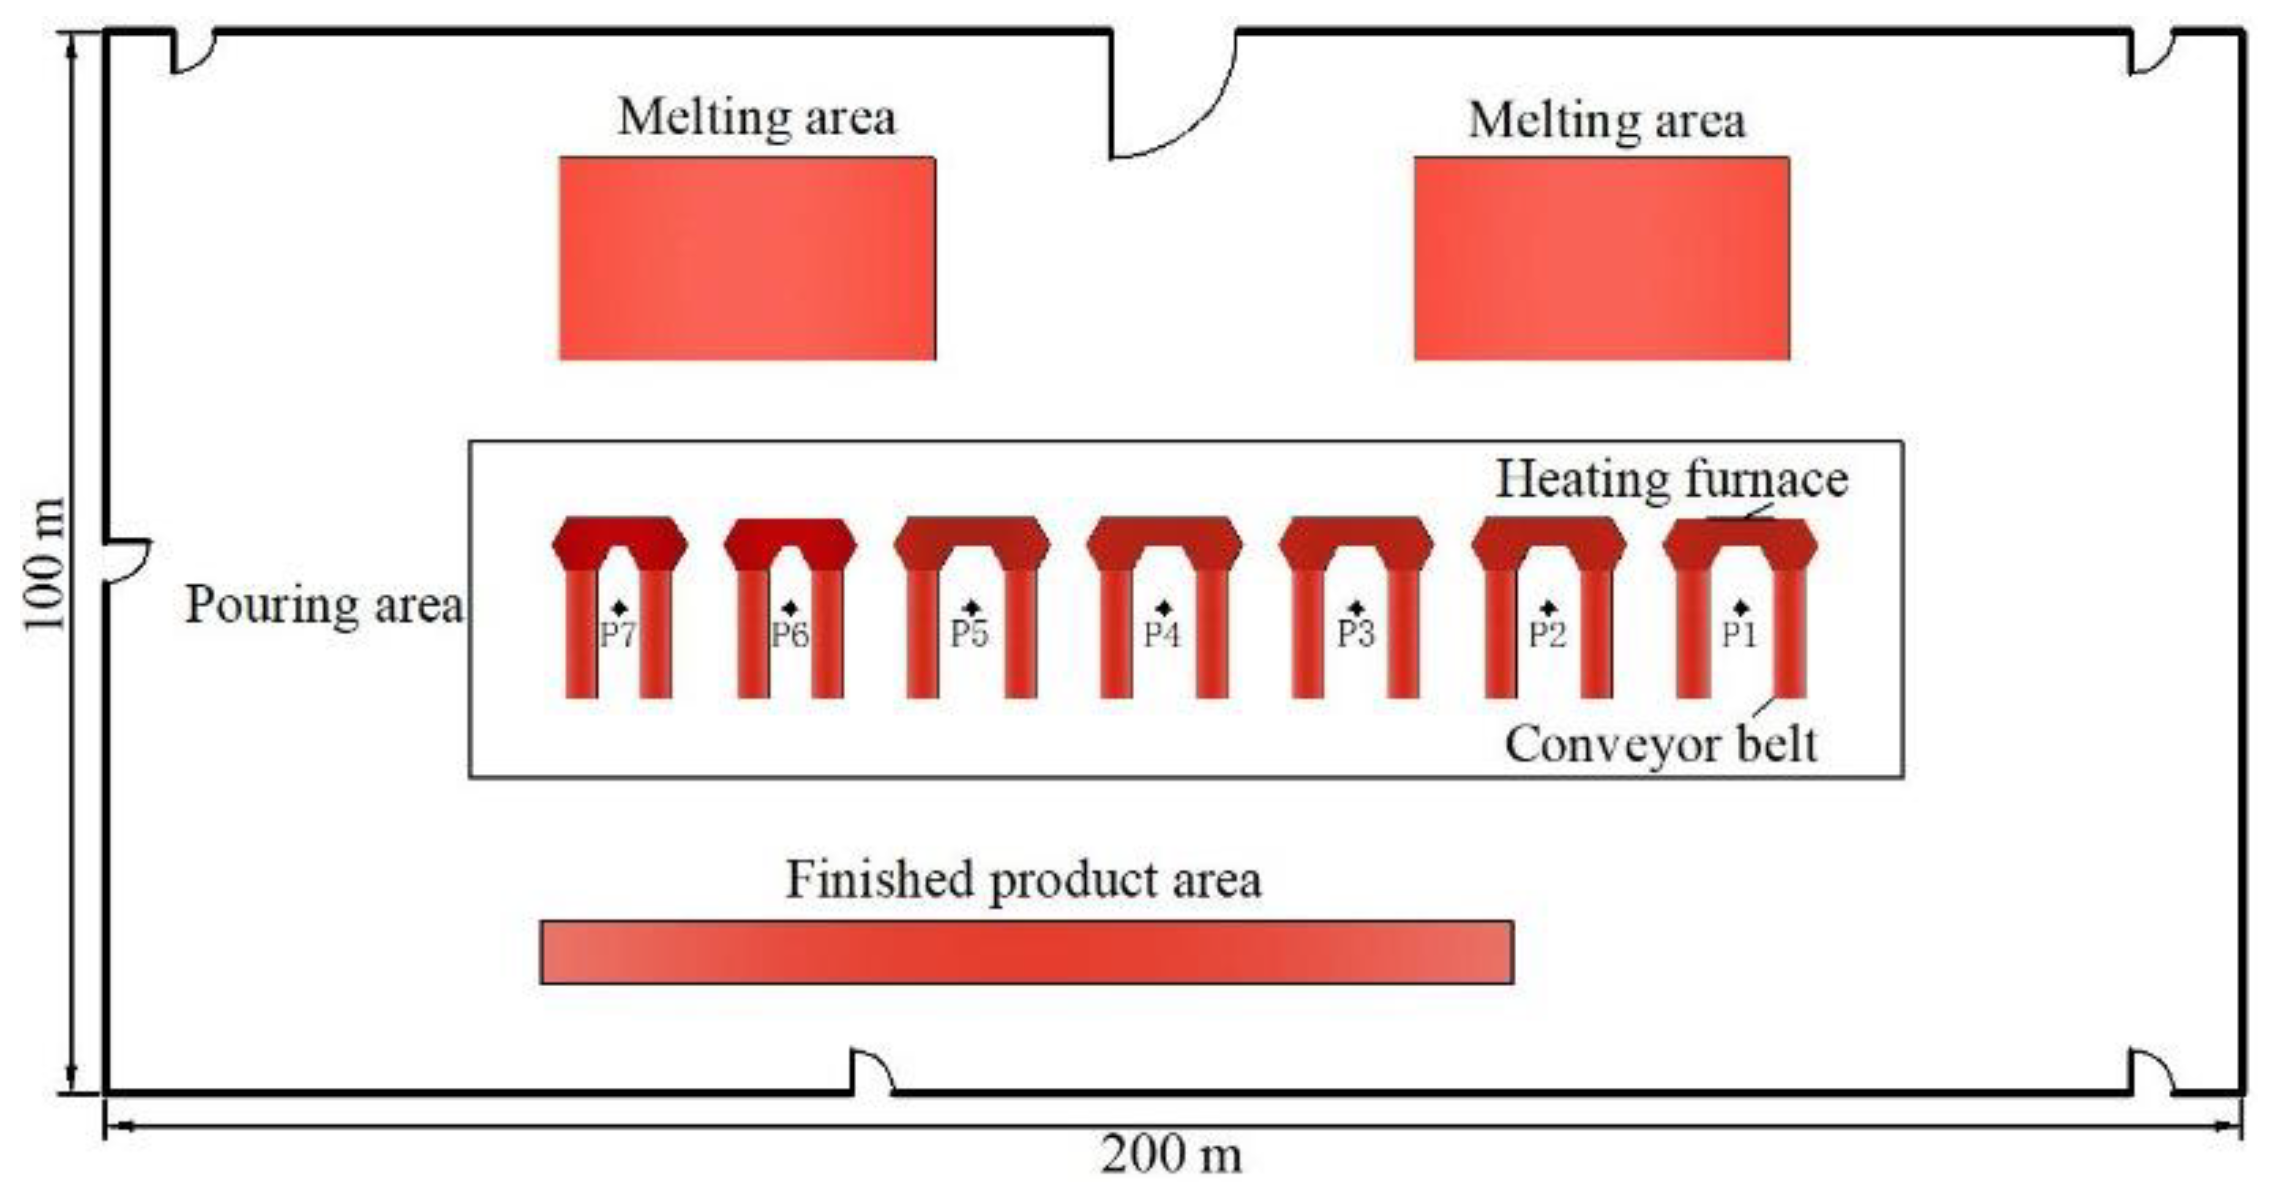
Figure 1. Layout of the casting plant (P denotes measuring point).
Sustainability 14 05019 g001
Figure 2. Pictures of the field measurements.
Sustainability 14 05019 g002
Figure 3. Variation of the mean skin temperature of the acclimated workers with WBGT.
Sustainability 14 05019 g003
Figure 4. Variation of the oral temperature of the acclimated workers with WBGT.
Sustainability 14 05019 g004
Figure 5. Variation of the systolic pressure of the acclimated workers with WBGT.
Sustainability 14 05019 g005
Figure 6. Variation of the diastolic pressure of the acclimated workers with WBGT.
Sustainability 14 05019 g006
Figure 7. Variation of the heart rate of the acclimated workers with WBGT.
Sustainability 14 05019 g007
Figure 8. Variation of the thermal sensation of the acclimated workers with WBGT.
Sustainability 14 05019 g008
Figure 9. Variation of the thermal comfort of the acclimated workers with WBGT.
Sustainability 14 05019 g009
Figure 10. Variation of the thermal preference of the acclimated workers with WBGT.
Sustainability 14 05019 g010
Figure 11. Variation of the thermal acceptability of the acclimated workers with WBGT.
Sustainability 14 05019 g011
Figure 12. Variation of the thermal tolerance of the acclimated workers with WBGT.
Sustainability 14 05019 g012
Figure 13. Relationship between the mean skin temperature and thermal sensation of the acclimated workers.
Sustainability 14 05019 g013
Table 1. Information of the 14 acclimated workers.
GenderNumberAgeHeight (cm)Weight (kg)BMI
Male1432.9 ± 4.7174.1 ± 2.469.5 ± 6.422.9 ± 1.7
Table 2. Details of the measuring instruments.
VariablesInstrumentsRangeAccuracy
Air temperatureMulti-functional tester (JT2020)−20–120 °C±0.5 °C
Air relative humidity10–90% RH±3%
WBGT0–50 °C±0.5 °C
Air velocityMulti-function ventilation
meter (TSI 9565)
0–50 m/s±0.015 m/s
Skin temperatureInfrared pyrometer
(DT-8806H)
0–60 °C±0.2 °C
Oral temperatureElectronic clinical thermometer
(Omron MC-341)
32–42 °C±0.1 °C
Blood pressureWrist sphygmomanometer
(Omron T30J)
0–299 mmHg±0.3 mmHg
Heart rate40–180 bpm±5%
Table 3. Questionnaire of the thermal perception.
VariablesRulers
Thermal sensationVery cold (−4), cold (−3), cool (−2), slightly cool (−1), neutral (0), slightly warm (+1), warm (+2), hot (+3), very hot (+4)
Thermal comfortComfortable (0), slightly comfortable (1), uncomfortable (2), very uncomfortable (3), extremely uncomfortable (4)
Thermal preferenceMuch warmer (+3), warmer (+2), little warmer (+1), neutral (0), slightly cooler (−1), cooler (−2), much cooler (−3)
Thermal acceptabilityAcceptable (0), unacceptable (1)
Thermal tolerancePerfectly tolerable (0), slightly difficult to tolerate (1), fairly difficult to tolerate (2), very difficult to tolerate (3), intolerable (4)
Publisher’s Note: MDPI stays neutral with regard to jurisdictional claims in published maps and institutional affiliations.