Article

Corruption as a Moderator in the Relationship between E-Government and Inward Foreign Direct Investment

1
College of Business Administration, University of Seoul, Seoul 02504, Korea
2
College of Business, Hankuk University of Foreign Studies, Seoul 02450, Korea
*
Author to whom correspondence should be addressed.
Sustainability 2022, 14(9), 4995; https://doi.org/10.3390/su14094995
Submission received: 15 February 2022 / Revised: 5 April 2022 / Accepted: 19 April 2022 / Published: 21 April 2022

Abstract

:
E-government initiatives help a country to publicize information with greater transparency and efficiency and are expected to reduce corruption in the country. The present study investigates the impact of a host country’s e-government system on inward foreign direct investment (FDI) which plays an important role in the sustainable growth of countries. Using a logistic regression method to model whether the inward FDI is positive or negative, this study provides empirical evidence on the effects of the e-government development level on inward FDI. In addition, the authors point out that the positive influence of e-government on FDI becomes greater when the target country is more corrupted, and they hypothesize that the impact of e-government is moderated by corruption. The estimation results show that the e-government effect becomes greater when the host country is more corrupted. The findings have practical implications for policymakers for sustainable development of their economies on how they can attract more FDI by controlling the market environment.

1. Introduction

One of the most substantial elements of sustainable development from an international business perspective is foreign direct investment (FDI) by multinational enterprises (MNEs) [1,2,3]. FDI has played an important role in facilitating mutualistic interactions between home and host countries for sustainable growth. A host country’s desire to acquire new knowledge and improve its balance of payments and a home country’s demand for capital have built bilateral relationships that are beneficial to both countries. Paul and Feliciano–Cestero [4] show an exhaustive review of FDI literature over the last five decades and emphasize the importance of FDI for cooperation and sustainable development of global economic units. According to Appiah–Kubi et al. [5], one of the most critical factors for African economic improvement is to attract FDI since the sustainable growth demands industrial infrastructure in the long run. As another example, Kim [6], Yue, Yang, and Hu [7], and Wu and Zhang [8] studied the direct relationship between FDI and environmental sustainability in uniquely different economic contexts: greenhouse gas emissions, green efficiency, and carbon emission efficiency. Despite the divergence of their opinions on the relationships, many scholars unanimously remark on the critical role of FDI in sustainable growth.
According to the OECD database [9], the FDI flows vary considerably by country. For example, the United States attracted 282 billion dollars in 2019, while Japan induced 15 billion dollars for the same period. Given the gulf between the countries, a naturally following question here is: “Why are some countries more successful in receiving more FDI than others?” To answer to this question, a large stream of FDI literature has identified crucial determinants for MNEs’ FDI activity. For example, Driffield, Jones, and Crotty [10] and Dunning [11] emphasized the economic factors, such as markets, resources, and strategic assets, while Habib and Zurawicki [12] and Brouthers, Gao, and McNicol [13] focused on social factors, such as corruption level, political stability, and regulatory quality.
Among the social factors, the host country’s corruption has been recognized as one of the most important factors, as widely studied by scholars. Transparency International (TI) defines corruption as the abuse of entrusted power by political leaders or bureaucracy for personal gain or specific group interest. Most past studies found a negative impact on the host country’s pulling FDI, although some exceptions reported that they could not find a statistically significant relationship [14,15]. Habib and Zurawicki [12] found a negative impact of corruption on FDI, saying that understanding the role of corruption in FDI is important because corruption creates distortions by providing some companies preferential access to profitable markets. Rose–Ackerman [16] stated that corruption could deter foreign investors if the costs of the potential deal exceed its benefits. Chen, Ding, and Kim [17] presented that corruption may reduce operational efficiency, distort public policy, and slow the dissemination of information. Many other published works support the negative influence of corruption on FDI [18,19,20]. In addition, Hoinaru et al. [21] showed empirical evidence that a higher level of corruption is correlated with a lower level of economic and sustainable development. Liu and Dong [22] explored the impacts of political corruption on haze pollution, which in turn causes unpredictable economic losses. Feruni et al. [23] empirically exhibited the impact of corruption on the economic development of both the Western Balkan countries and the EU countries. If so, how can the corruption level be controlled for economic and sustainable development?
One way to purify the corruption level of a country is through e-government initiatives. The United Nations defines an e-government strategy as the employment of the Internet and the World Wide Web for delivering government information and services to citizens. E-government is expected to enhance the efficiency and effectiveness of public service delivery through information technology (IT), information and communication technologies (ICTs), and web-based telecommunication technologies [24]. For example, according to Jun and Chung [25], the Korean government introduced the Government 3.0 program in 2013 for the purpose of enhancing the public accessibility of government data for higher transparency of state affairs. It provided a nonhierarchical, nonlinear, and multi-channel platform that can be accessed at any time and place according to citizens’ needs, uses, and satisfaction. For another example, in the Indian state of Andhra Pradesh, a computer system for 214 public offices’ documentation was established in 1998. Before its introduction, corrupt practices by a small group of people who were in charge of the responsibilities had prevailed [26]. The Global Corruption Report [27] also emphasizes the role of e-government. It argues that e-government offers a partial solution to corruption, since it reduces discretion and prevents some opportunities for arbitrary action, thus encouraging citizens and businesses to question unreasonable procedures and wrongful acts.
Some pieces of empirical evidence from public policy studies using country-level data support the positive relationship between e-government and corruption. Anderson [28] proved the positive impact of e-government on the control of corruption index using a panel data set from 149 countries for two years (1996 and 2006). The author focused on showing the robustness of the relationship, by controlling the e-government adoption decision of a corruptive government to resolve the endogeneity issue. Mistry and Jalal [29] demonstrate that the relationship between e-government and corruption differs as the development level of the country changes. Consistent with Anderson [28], their results show that the use of ICTs related to e-government reduces corruption. Additionally, the impact appears to be stronger in developing than developed countries. Shim and Eom [30] present another piece of empirical evidence. They study whether corruption is affected by three traditional factors (bureaucratic professionalism, bureaucratic quality, and law enforcement) and e-government. The results show that e-governments have a significant and positive influence on corruption as three other well-known determinants do. There are also many pieces of evidence for the importance of e-government in the sustainable development literature: Jameel et al. [31] showed the interplay between e-government, public trust, and corruption, Rodríguez–Martínez et al. [32] found the close relationship between e-government, corruption, and environmental performance, Myeong, Kwon, and Seo [33] examined the correlation between the quality of e-government and trust in government, and Lee [34] presented the direct influence of e-government on environmental sustainability as well as the indirect one through the enhancement of government effectiveness.
Our main research question stems from the above two findings in the literature: if (1) corruption negatively affects FDI and (2) e-government reduces corruption then would e-government positively influence FDI? (Of course, there exist different opinions in the literature against the effectiveness of e-government. For example, Anechiarico and Jacob [35] warn that law enforcement activities such as auditing and internal surveillance can make the government too rigid and reinforce bureaucracy. To the best of our knowledge, however, the major stream of past studies votes for the positive relationship between e-government and corruption, so we adopt the argument from this group for the development of our following logic.) A few precedent studies present some clues for our question. Azubuike [36] presents a qualitative analysis of African countries, which shows that there exists a strong relationship between the e-government index and information accessibility. Kachwamba [37] proposes a conceptual framework for the impact of e-government on transaction costs and FDI. Although the argument that e-government adoption and FDI inflows will be positively related is asserted through a vast literature review, the author does not statistically prove the theory under the framework suggested by the research. Prasetyo and Susanto [38] also show a similar approach and standpoint as Kachwamba [37]. Through a case study of an Indonesian city, they suggest that investors consider the governance environment factors, and e-government has a positive impact on investment attractiveness through the governance quality factor. All in all, although the e-government literature shows a convergent opinion on the positive impact of the e-government system on FDI, the direct and solid answer to our question, unfortunately, can hardly be found in the literature.
Empirical evidence on the relationship between e-government and FDI in the literature is very limited. To the best of our knowledge, the present study is one of the first studies to statistically investigate whether the level of e-government development is related to FDI, using a longitudinal data set. The only potential exceptions include Abu-Shanab [39] and Martins and Veiga [40]. The former reports a statistically significant relationship between the global opportunity index (GOI) and the e-government development of the host country. That is, the study shows that the country’s attractiveness to FDI is related to the e-government system, which does not necessarily imply the direct relationship between e-government and FDI per se. The latter research uses panel data that cover 167 countries over 6 years and analyzes the connection between the e-government development index variable and 10 metrics related to the ease of doing business in these countries. Their linear regression analysis shows statistically significant relations for 6 out of 10 metrics: starting a business, attaining electricity, registering property, acquiring credit, trading across borders, and protecting minority investors. However, it also has the same limitation since it does not directly show the e-government’s relationship with FDI.
In addition, theoretically, the relationship between e-government and FDI has not been a focal object while many other components in MNEs’ FDI activities have been broadly and deeply explained by the OLI paradigm and institutional theory in the literature. First, the OLI paradigm shows a conceptual framework explaining MNEs’ FDI activities with an eclectic model that contains three elements: ownership-specific, location-specific, and internalization advantages [41,42]. Among those three advantages, the location-specific advantages include the region’s macroeconomic factors (e.g., gross domestic product, interest rate) as well as social factors (e.g., political stability, international outlook) [43,44]. As a new element in the social factors, information-related components have received greater attention in this digitalization era as an advantage in the host country [45]. Since there exists the “liability of foreignness” in unfamiliar countries, the risks from information deficiency can be a critical factor in FDI decisions. While we believe that e-government can be a non-negligible component as an L-specific advantage related to information, it has not received great attention from scholars. Second, according to institutional theory, organizational decisions are affected by all kinds of institutions related to human interactions through cognitive, normative, and regulative pillars, and all three institutional pillars present fundamentals for FDI studies [46,47]. Furthermore, institutions are known as a critical factor in MNE’s FDI decisions [48]. However, considerable past studies on FDI have focused on regional market factors (e.g., market size, efficiency, and growth) rather than institutional factors [49]. Furthermore, unlike other regulative pillars such as tax and trade policies, the e-government initiative has not been considered much as a regulative pillar. Recognizing the lack of consideration of e-government in the OLI paradigm and institutional theory, our study is expected to fill this gap in the literature.
The present research makes several additional contributions to the literature. First, we investigate the yet unanswered question, “Does a host country’s e-government affect MNEs’ FDI activity?” We used a quantitative means by employing a logistic regression method on a longitudinal data set at the country level. We faced up to the sensitive agenda in the era of digitalization (e.g., e-government). We hypothesized a positive relationship and tested it in the next chapters. Second, we considered both the host country’s corruption and e-government in our statistical model to explain the variation of inward FDI by country and year. Given the literature on the impact of corruption on FDI and the influence of e-government on corruption, the past studies imply that e-government has an indirect impact on FDI through corruption. Our regression result would enable us to distinguish the direct impact of e-government on FDI from the indirect one, under the control of the corruption variable in the same regression equation. Third, we exhibited the interaction effect between e-government and corruption in affecting FDI: whether the relationship between e-government and FDI becomes stronger or weaker for more corruptive host countries. We hypothesized that, when a host country is more corrupted, inward FDI would be more influenced by a host country’s e-government development level. Prior experiments have a propensity to choose a fragmental approach by examining the effect of either corruption or e-government on inward FDI separately. Unlike these studies, under the premise that both concepts are mutually important, we attempted to draw a bigger picture by integrating corruption with e-government’s effect on FDI. Our results, which are presented in the below chapters, will enable policymakers to come up with the answers to what efforts they should make to attract more FDI to their economy.
The remainder of the paper is organized as follows: The following section introduces a theoretical lens and develops hypotheses based on the reviews of extant e-government and FDI literature. The next two sections introduce 16 countries’ bilateral FDI inflow data for 5 years used in the main analysis and discuss the estimation results from statistical models. Then, the last two sections follow with more discussion on findings and conclude the research.

2. Theoretical Framework and Hypotheses Development

2.1. FDI, Information, and E-Government

The OLI paradigm, which provides a conceptual framework explaining the prerequisites for MNEs to undertake FDI, is called an eclectic model in that it is established by the combination of three elements. First, it includes an ownership-specific advantage, which indicates that a firm having an intent to invest in foreign markets must possess sufficient competitiveness and valuable organizational assets. Second, it considers location-specific advantages and argues that a host country wanting to attract MNEs’ investment should capitalize on its unique advantages. Third, it also highlights that the avoidance of market imperfection through the internalization of international transactions provides an incentive to MNEs (i.e., internalization advantage) [41,42].
Particularly, the location-specific advantage is a relatively new seminal concept, which implies that it is still valuable to scrutinize the insights of the “L” advantage. For example, macroeconomic factors such as gross domestic product, interest rate, capital market indicators, exchange rate, and inflation have been widely used to analyze the effects of the location advantage, particularly in the market potential and risk perspectives [43,44]. In addition to such economic factors, other various constituents (e.g., political stability, international outlook, government regulation and regime, infrastructure, the liability of foreignness) are also considered as vehicles to create an overall attractive investment climate [45,50,51]. Among the variety of “L” advantages, researchers have connected FDI to information accessibility and transparency.
Information accessibility and transparency have received greater attention in this digitalization era as an advantage in a home country. The “liability of foreignness” is a well-known challenge to foreign investors [45]. First, information accessibility plays an important role in FDI since MNEs have potential business and environmental uncertainty and unfamiliarity in target markets [37]. The lack of relevant information in host countries incurs additional costs for MNEs to collect more knowledge of higher quality [52,53], and so the accessibility of information positively influences the FDI activity and triggers the mitigation of transaction costs in new markets [54]. Second, if information transparency is not guaranteed, the high level of information accessibility does not necessarily resolve the host country’s uncertainty issue. Low information transparency means, by definition, that some do not know what some others do know. If this asymmetry works in an unfavorable way for foreign investors, they are reluctant to enter the market and instead search for other locations that provide better opportunities to access necessary information. Information gaps in opaque states can restrain direct investment [55].
One of the numerous critical impacts of ICTs, particularly e-government, on market participants is to enhance information accessibility and transparency. The swift diffusion of the Internet has enabled the general public to access governmental information that was previously unavailable. Governments disclose their information through ICTs more effectively, and at the same time, the general public can examine the history of government agencies [56]. ICTs have reduced many of the transaction costs of participating in sub-contracting through business-to-business (B2B) interaction, and it is facilitating the operations of low-cost suppliers of IT [57]. Brin [58] says that transparency of public information should be assured since, if so, the government will not be able to hide its secrets. In reality, governments have a propensity to publicize information and services with greater transparency and efficiency when they desire to resolve the “liability of foreignness” issue [59]. The United Nations [24] also reports that e-government is expected to enhance the efficiency and effectiveness of the delivery of public information through information technology (IT), information and communication technologies (ICTs), and web-based telecommunication technologies.

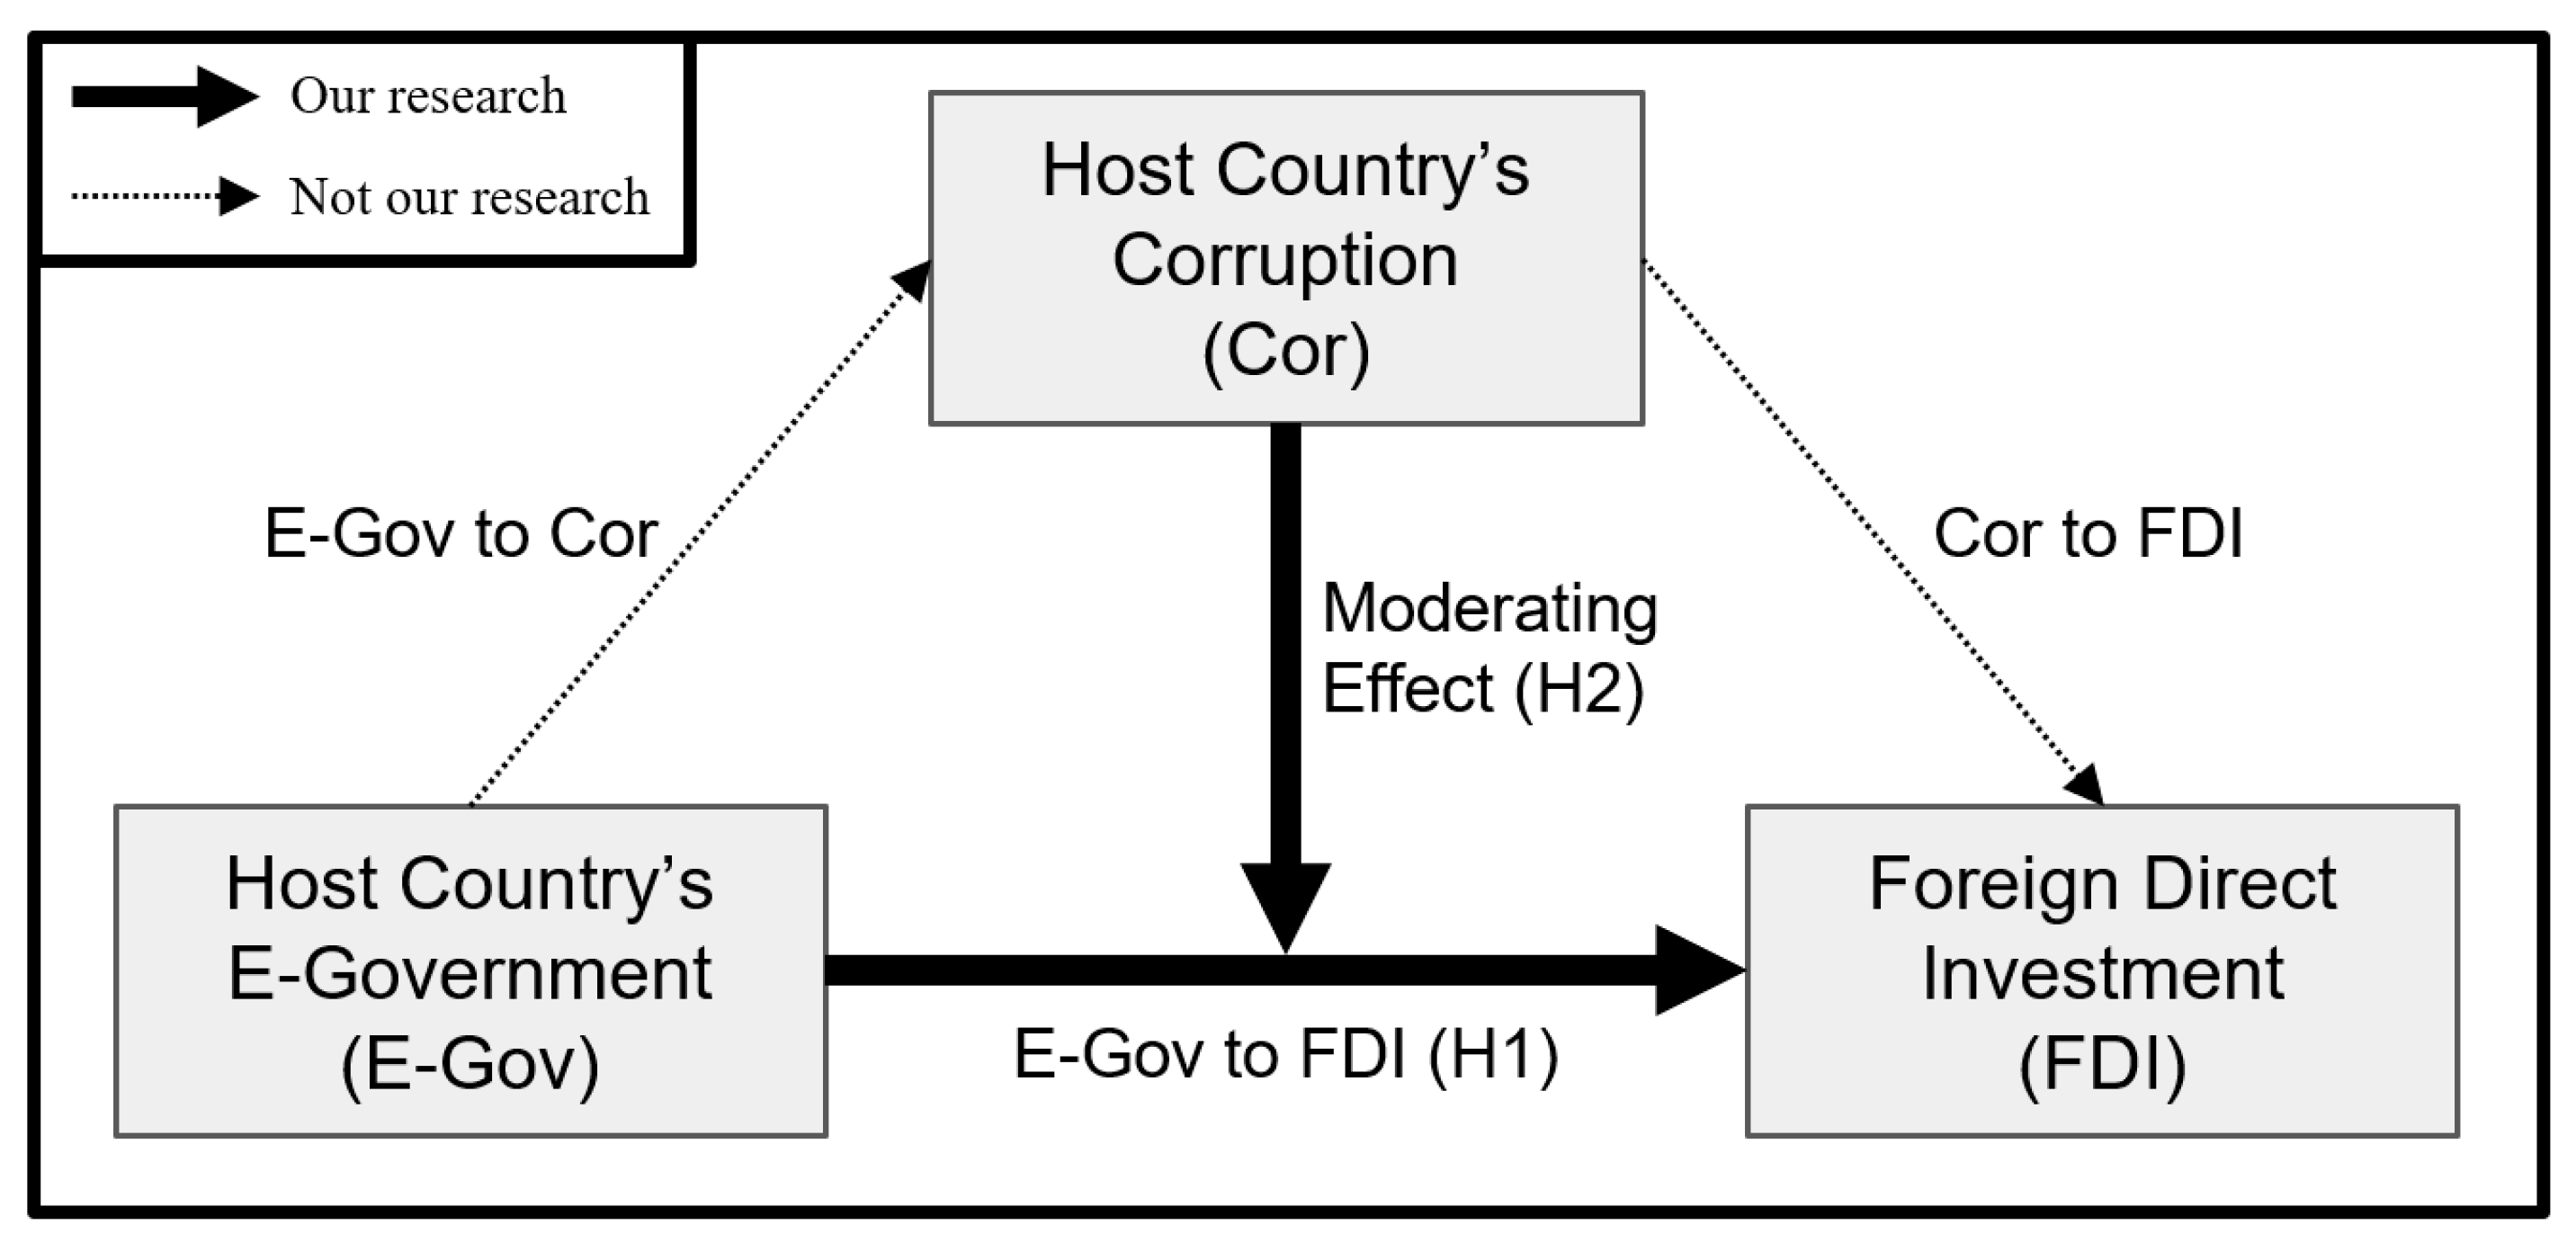
2.2. Hypotheses Development

The above our discussions based on the literature are summarized as follows: the host country’s information accessibility and transparency are (1) important factors in inward FDI and (2) greatly enhanced by e-government initiatives. Therefore, we hypothesize that:
Hypothesis 1 (H1):
A host country’s e-government development level will be positively related to inward FDI.
If there exists a significant relationship between e-government and FDI, how would the association change as the host country becomes more corrupted? The common argument shared by the IB literature on corruption is that corruption creates significant costs to acquire and refine information for foreign entrants through unfamiliarity and information asymmetry that lowers the attractiveness of investment [18,19,20,21,22,23]. That is, corruption of the host country forces MNEs to be concerned for the risks from information acquisition, and so we conjecture that MNEs may want to manage the risks through the information offered by the e-government system. In this regard, we infer that MNEs recognize the greater necessity for reducing uncertainty when the host country is more corrupted.
Based on our conjecture that investor’s needs for e-government are smaller when the investing country is less corrupted, we expected that e-government’s marginal contribution to FDI would be decreased when the corruption status is better. If the host country’s corruption level is relatively high, the country’s e-government adoption would enhance the attractiveness to invest because the presence of e-government in the host country reduces the uncertainty caused by corruption. However, if the level of corruption remains low, the e-government system would not be very effective in increasing FDI because investors have already evaluated the country positively in the aspect of information accessibility and transparency. In this regard, we tested whether the corruption level is a moderator in the effect of the e-government system on inward FDI and hypothesize that:
Hypothesis 2 (H2):
If host country is more corrupted, the positive influence of e-government development level on inward FDI will be increased.
Hypothesis 2a (H2a):
The effect of the e-government development level on inward FDI is significantly positive when the corruption level of host country is relatively high.
Hypothesis 2b (H2b):
The effect of the e-government development level is not significant when the corruption level of a host country is relatively low.
We tested the above hypotheses (H1, H2, H2a, and H2b), which are visualized in Figure 1, by regressing whether the FDI inflow from a home country to a host country is positive or not (1 if FDI inflow is positive, and 0 otherwise) on two main independent variables, the e-government development index and the corruption perception index, and other control variables were also included in the research model.

3. Data Description

3.1. Data Collection

In this study, our hypotheses were tested using data from the Organisation for Economic Co-operation and Development (OECD) countries’ bilateral FDI inflows from 2014 to 2018. As mentioned, we focused on how bilateral FDI inflows were related to a host countries’ e-government system and corruption level. For this purpose, we constructed a database including the following four types of information obtained from different sources: (1) bilateral FDI flows from home countries to host countries from OECD Statistics, (2) host countries’ e-government qualities from the United Nation (UN) Department of Economic and Social Affairs, (3) host countries’ corruption levels from Transparency International (TI), and (4) control variables for host and home countries from the World Bank and the International Telecommunication Union (ITU) database. The summary statistics and correlations of the variables are presented in Table 1.
The sample used for our analysis was selected by the following steps. First, we removed countries whose FDI information was incomplete during the period 2014–2018. The OECD database has several missing cases because some countries did not publicize the information, or the OECD could not publish FDI data. As a result, we included 16 countries in our analysis, which are shown in Table 2. Second, we considered every possible pair for the 16 countries selected from the first step. Since our study concerned the bilateral relationships between countries for 5 years, our database included 1200 observations = 16 (home country) × 15 (host country) × 5 (year). This database can also be understood as 5 years of longitudinal panel data for 16 × 15 different bilateral relationships. Third, after the construction of 1200 FDI-dependent variables, the corresponding independent and control variables were matched to each corresponding occasion.

3.2. Measurements

3.2.1. Bilateral FDI Flow

We used the bilateral FDI flow from a home country to a host country [5], which has been widely used in IB literature [12,60]. For the dependent variable of regression analysis, we converted the bilateral FDI flow value as a binary variable, which equals (1) 1 if the FDI flow is positive or (2) 0 if zero or negative. According to the description of the OECD database, a negative FDI could be observed when the value of disinvestment by foreign investors was more than the value of capital newly invested in the host country over a specific period. It is worth noting that the bilateral FDI flows can have different values for the opposite ordered pairs for the same two countries: for example, the US to South Korea and South Korea to the US. The consideration of directional FDI flows enabled us to secure a greater amount of information for estimation, while many other empirical FDI studies used a cross-sectional or aggregate-level data set.

3.2.2. E-Government Quality

Our main independent variable was the e-government development index (EGDI), invented by the United Nations (UN) Department of Economic and Social Affairs [17]. The index is a broadly used measurement [61] to indicate the e-government development quality as a weighted average of the online service index (OSI), telecommunication infrastructure index (TII), and human capital index (HCI), which are considered to be related to a nation’s e-government quality [62,63]. Specifically, the index is computed by E G D I = 0.34 × O S I + 0.33 × T I I + 0.33 × H C L [50]. The UN reports the index bi-annually on even number years. To resolve the matching issue for the odd number years (2015 and 2017) in our FDI inflow observations, we linked the odd year number of the FDI to the previous even year number of the EGDI. That is, we used the 2014 EGDI for the 2015 FDI and the 2016 EGDI for the 2017 FDI. These values can theoretically range from 0.00 to 1.00. Table 2 shows the average EGDI for each of the 16 OECD countries used for our analysis.

3.2.3. Corruption Level

To measure the corruption level of each of the 16 OECD countries, following Di Carlo [64] and Voyer and Beamish [19], we used the corruption perceptions index (CPI). It uses a 100-point scale, and the higher index value means that the country has a clearer and less corrupted public system. Transparency International (TI) has published the CPI report every year since 1995 [27]. The index shows the perceived levels of public sector corruption in more than 150 countries based on expert evaluations and surveys. TI’s sample for CPI extensively covers all regions of the world and TI’s survey has included the steps to address measurement reliability and validity. Since the CPI data cover all years used in the analysis, we successfully matched CPI to FDI data without problems. For example, the 2018 CPI of South Korea was used for the FDI flow from each home country to South Korea in 2018.

3.3. Control Variables

We introduced the following three sets of control variables to minimize the endogeneity issue and increase the estimation precision by lowering the standard error.
First, we employed variables related to the economic characteristics of host countries, which are established factors for FDI in the literature: (1) the logarithm of gross domestic product (GDP) from the World Bank was included to control the size of the market and economy of host countries [12], (2) the trade per GDP ratio from the World Bank was used to consider the international export orientation of host countries [13,65], and (3) the GDP per capita represents the size of the domestic consumption market [66].
Second, we used additional variables related to host countries in order to resolve the endogeneity issue for the EGDI of host countries. The endogeneity problem in our analysis may arise when there exists an uncontrolled variable that is compounded with our main independent variable and is also significantly related to the investment attractiveness of the host countries. In this regard, our model incorporated the index of political stability and absence of violence from the rule of law database from the World Bank [67,68] and the number of mobile cellular subscriptions per 100 citizens from the International Telecommunication Union [69]. These variables are expected to be correlated with the EGDI variable and are likely to be connected to the location-specific advantages under the OLI paradigm [70].
Third, since we modeled the bilateral FDI flow from a home country to a host country, the effects of the home country had to be controlled, as well as the host country. For this purpose, we used the home country’s fixed effects in our model, which required 15 additional parameters to be estimated. The “Austria” effect was set to 0 as the baseline effect. The large number of observations (1200) enabled us to use such a fixed effect approach for the home country effects. It would be statistically more inefficient to use 14 additional parameters with a smaller cross-sectional or aggregate-level dataset.

4. Methods and Results

4.1. Main Results

To examine the bilateral FDI flows (positive or not) using EGDI, CPI, and control variables, we employed the logistic regression method. The estimation of the model was based on the maximum likelihood approach (MLE), which maximized the probability of observing the actual FDI flows in our data. Table 3 shows the estimation results from the 5 models. All of these results contained the control variables, but the inclusion of the main independent variables (CPI and EGDI) and the interaction effect (CPI × EGDI) depended on the model. In order to avoid the multicollinearity issue, which may become more serious with the inclusion of the interaction term, our models used CPI and EGDI variables in mean-centered forms. The independent variables of Model 3 were EGDI and the control variables in order to test H1, and Model 5 was the full model with all variables to test H2. Models 1, 2, and 4 were not our main interests by themselves, but for checking how robust or sensitive the estimates of parameters change according to the inclusion or exclusion of the main independent variables. As presented in Table 3, the estimates and significances of CPI, EGDI, and control variables did not largely vary across models. The full model (Model 5) can be written as follows:
U i j t = α + β 1 EGDI i t + β 2 CPI i t + β 3 EGDI i t × CPI i t + γ 1 l o g GDP i t + γ 2 TPG i t + γ 3 GPC i t + γ 4 POLI i t + γ 5 MOB i t + δ j Country j + ε i j t
The latent utility from home country j ’s investment in host country i at year t is written as U i j t . If U i j t > 0 , then the FDI flow from home country j to host country i is positive. Otherwise, country j does not act (zero FDI) or withdraws prior investment in the host country i (negative FDI). ε i j t captures the random logistic error unexplained by EGDI, CPI, control variables, and home country j ’s fixed effects.
The results from Model 3 confirm the hypothesis of the positive relationship between the e-government system and FDI flow (H1). The estimate was highly significant and positive (p < 0.001). Model 4’s results showed that even after controlling the CPI variable, the size of the parameter estimate appeared to be almost the same, and its significance does not change. The last column of Table 3 presents the full model estimation result that contains the interaction term. The estimate exhibits a highly significant and negative relationship (p < 0.001). This result is consistent with our second hypothesis (H2) that the impact of EGDI on FDI is lowered when the corruption level becomes lower (that is, higher CPI). It clearly shows that the e-government and corruption level of a host country interact in their effects on FDI. Another interesting finding, although it is not our main interest, is the fact that we could not find a significant relationship between CPI and FDI flows. The CPI estimates in the results from both Models 2 and 4 have relatively high p-values (p > 0.05), which does not support evidence found in the literature. Multicollinearity is considered serious when the maximum variance-inflation factor (VIF) is greater than 5 [71,72]. Our models did not exceed this threshold, which suggests that the mean-centering transformations were successful to resolve the multicollinearity issue.
Figure 2 more clearly presents the moderating role of CPI in the relationship between EGDI and FDI. It depicts how the predicted probabilities of positive FDI flows move as the values of EGDI and CPI change. The probability prediction was computed from the logistic model specification assuming the median values for the control variables when the home country is Japan as follows:
P r ( FDI i j t > 0 ) = e x p ( U i j t ) 1 + e x p ( U i j t )
We can easily check that the impact of EGDI changes for different CPI values, although the probabilities increase for both variables. When the CPI was the highest (CPI = 90), the probability increased by 24% as the EGDI grew. In contrast, when CPI was the lowest (CPI = 70), the probability became 627% times bigger for the same level of EGDI increase, which showed a much greater impact than the higher CPI case. We performed additional analyses to compare the p-values of the EGDI effects for different values of CPI. The results found when CPI equals 90 and 70, the p-values were 0.643 and 0.000, respectively. This result confirmed H2a and H2b, which meant that the significance of the effect also varied as the CPI level changes.

4.2. Robustness Check

To check whether the above findings were robust, we compared the results of the full model (Model 5) when only one year (2014, 2015, 2016, 2017, and 2018) of the entire five-year period was used for the estimation. The reason for this additional analysis was because we needed to determine whether the findings above were achieved only from that specific time window selection (2014–2018). If so, our findings would not be generalizable.
First, regarding H1, the entire sample showed a significantly positive relationship between EGDI and FDI flow. Table 4 presented the five sets of the estimation results for each year’s selection. All EGDI effects were shown to be statistically significant at the 10% level (p < 0.10), and the direction of the relationship was positive for all results. Second, the moderating effect of CPI on the relationship between EGDI and FDI, regarding H2, was significant in the main analysis. Only for 2 sub-samples (2016 and 2017), was the interaction effect found to be significant at 5% level (p < 0.05). However, the negativity of the effect was consistent over all sub-samples. In summary, although some of the sub-samples showed a weaker significance than the entire sample, the signs of the relationships appeared to be unchanging for any selection of the year. In this regard, the generalization of our findings to a more micro-level seems to have limitations yet. That is, our arguments were restricted to the average level of the sample used here. We hope that the generalization may be achieved by controlling other unknown factors affecting FDI, which may be found in future research.

4.3. Additional Analysis 1

In the above analyses, we tested the four hypotheses (i.e., the presence of e-government influence on FDI flow and the negative effects of interaction terms between e-government and corruption level on FDI) and found statistical support for each. Although we confirmed the statistical power of the interaction effect in the previous sections, we ran a further investigation into which may furnish the insights to better understand the interaction effect. However, this is beyond the scope of this study. Nonetheless, we believe that the results yielded by this examination will provide valuable insight into how e-government and corruption operate together in MNEs’ FDI activities.
The purpose of the analyses is to investigate how the difference in corruption level between host and home countries affects the e-government effect on FDI attraction. To model this, we created the absolute difference of the CPI’s variable, D i f f CPI i j t , and considered the possibility that the EGDI effect may differ between the large ( D i f f CPI i j t > 20 ) and small CPI difference ( D i f f CPI i j t 20 ) cases. Thus, Model 6 can be written as follows:
U i j t = α + β 1 EGDI i t + β 2 CPI i t + β 3 EGDI i t × CPI i t + β 4 D i f f CPI i j t > 20 EGDI i t + γ 1 l o g GDP i t + γ 2 TPG i t + γ 3 GPC i t + γ 4 POLI i t + γ 5 MOB i t + δ j Country j + ε i j t
The new term β 4 D i f f CPI i j t > 20 EGDI i t allowed us to consider the possibility that the EGDI effect may differ between the cases. The estimation result is shown in Table 5. The results for EGDI, CPI, and the interaction term were consistent with the previous testing for H1 and H2, and the effect sizes also did not differ from the result of the main analysis. However, more importantly, we tested whether the EGDI effects were different between the large and small CPI difference cases. The result showed that there was no significant difference (p = 0.192).
To explore the role of CPI difference in the EGDI effect, we separately considered two cases: superior and inferior dissimilar cases in terms of corruption level. We defined the superior dissimilar case as when the host country’s corruption level quality is far higher than the home country. In this scenario, the investor’s perception of the host country will be positive, so we named it superior dissimilarity. On the other hand, the inferior dissimilar case is when the host country’s corruption level quality is far lower than the home country. To model superior dissimilarity, we created the following dummy variable: H o s t CPI i j t > H o m e CPI i j t + 20 . If this condition held, the host country was regarded as in superior dissimilarity. To model inferior dissimilarity, we used the following dummy variable: H o s t CPI i j t H o m e CPI i j t 20 , which was the inferior dissimilarity condition. Model 7 considers different EGDI effects for inferior dissimilarity status and is written as:
U i j t = α + β 1 EGDI i t + β 2 CPI i t + β 3 EGDI i t × CPI i t + β 4 H o s t CPI i j t < H o m e CPI i j t 20 EGDI i t + γ 1 l o g GDP i t + γ 2 TPG i t + γ 3 GPC i t + γ 4 POLI i t + γ 5 MOB i t + δ j Country j + ε i j t
In this model, β 4 indicates the change in the EGDI effect if the host country is under the inferior dissimilarity condition. Model 8 considers the different EGDI effects for superior dissimilarity and is written as:
U i j t = α + β 1 EGDI i t + β 2 CPI i t + β 3 EGDI i t × CPI i t + β 4 H o s t CPI i j t > H o m e CPI i j t + 20 EGDI i t + γ 1 l o g GDP i t + γ 2 TPG i t + γ 3 GPC i t + γ 4 POLI i t + γ 5 MOB i t + δ j Country j + ε i j t
β 4 explains the EGDI effect change under the superior dissimilarity condition. The result for Model 7 shown in Table 5 revealed that the difference was negative and was marginally significant (p = 0.070). This implied that the EGDI effect on FDI may decrease if the host country had a relatively lower corruption status than the investor. The estimation result for Model 8, however, showed an opposite pattern. The difference in EGDI effects was not significant (p = 0.782). This result implied that when investors make an FDI decision on a country with a relatively higher corruption status, the importance of the host country’s e-government quality does not change. By comparing the results from Model 7 with those from Model 8, we concluded that the interaction between EGDI and CPI is asymmetric in terms of the CPI difference.

4.4. Additional Analysis 2

Through the above analyses, we focused on the e-government effect itself and how the e-government effect depends on the host country’s corruption level. Here, we analyze how the e-government effect differs for different home countries. For this purpose, we included the interaction between EGDI and the home country dummy variables in the model. That is, 16 different EGDI effects were estimated since there were 16 home countries in our data set. In addition, the same set of control variables were included, as in the previous models. The estimation result is presented in Table 6.
First, the EGDI effects were estimated as quite different across home countries. It showed that the importance of the host country’s e-government quality in bilateral FDI flows largely differed across home countries. For example, Korea (KOR) considered a host country’s e-government most important among those 16 countries. The next highest groups included Belgium (BEL), Switzerland (CHE), Luxemburg (LUX), and Turkey (TUR), whose EGDI importance was relatively higher than other countries, and the significance levels were mostly significant in 5%. The groups showing the lowest level of importance contained Austria (AUT), Canada (CAN), Czech Republic (CZE), Japan (JPN), and Sweden (SWE). Their estimates were lowest, and the significance levels were higher than 5%. In summary, the result implied that the EGDI importance level in FDI activities differed for each home country.
Second, we presented a scatter plot to visualize the relationship between the home country’s EGDI importance and their own EGDI. Figure 3 shows that there was no significant relationship between them (r = 0.05; p = 0.866). In contrast, Figure 4 depicts another scatter plot about the relationship between the home country’s EGDI importance and their own CPI, which showed a negative relationship (r = −0.29; p = 0.284). Although its p-value was still insignificant at 5%, considering that this significant testing was based on 16 observations (16 home countries), the p-value might be understood as a somewhat meaningful result. Although we were not presenting in this study a concrete argument on the reason why different home countries consider a host country’s e-government with a different importance level, we believe that the above results may provide subsequent research with useful insights. Additional discussion is provided in the following section.

5. Discussions

The above estimation results can be discussed in the following three folds. First, the results clearly showed the positive relationship between the host country’s e-government system and FDI attraction (H1). Our empirical finding was consistent with Azubuike [36], which was the only antecedent study testing the relationship using the FDI and the e-government index data. His analysis focused on 31 African countries in 2002 and found that 11 countries showed low accessibility to government information, and most of them (i.e., 9 out of those 11 nations) attracted a low level of foreign investment. The study argues that the e-government structure lowers information acquisition costs and attracts investors more effectively. Our research does not only support Azubuike [36]’s findings but also expanded its generalizability to include 16 OECD members, including developed and emerging countries over multiple continents. Furthermore, our results are based on conventional statistical methods using hypotheses testing and logit regression analyses, so that the present research demonstrates the relationship in a more rigorous and reliable manner.
Second, the interaction term between EGDI and CPI variables turns out to be significantly negative (H2). The impact of e-government on FDI attractiveness decreases when the corruption level becomes lower (i.e., the e-government accessibility becomes crucial for MNEs to enter foreign markets in the case that the relative level of corruption is high). It clearly shows that the value of e-government information for inward FDI is moderated by the corruption level of a host country. Moreover, the main analysis results (i.e., Models 1 and 5) are confirmed by ‘additional analysis 1’. This is perhaps because corruption represents environmental uncertainties for MNEs to operate overseas subsidiaries in a foreign market. In this vein, investment decisions for countries with a relatively high corruption level may rely on e-government information to some extent, and easy accessibility to such official information functions as a location-specific advantage that reduces business uncertainty [52,53,54].
Third, Figure 2 indicates that among MNEs in 16 countries, firms based in Korea, Turkey, Poland, Switzerland, Belgium, and Luxemburg place higher importance on the presence of e-government information when deciding whether they should enter foreign markets. Out of these 6 countries, Switzerland, Belgium, and Luxemburg are economically small countries, whereas Korea, Turkey, and Poland are emerging economies, though Korea is set to join the developed country group. This information suggests that compared to firms in traditionally responsible and conventional nations, such as the US and Japan, organizational failure through internationalization features greater information risks to firms based in small economies and emerging countries. Thus, the latter firms are very cautious in overseas investment decisions, and in this situation, the existence of transparent and accessible e-government information can act as a location-specific advantage for a host country (that is, Figure 2 also verifies the value of e-government information provided by host countries). Figure 3 points out that regardless of the level of corruption in home markets, the presence of e-government information in host countries generally encourages outward FDI for firms in the two country groups (i.e., small economies and emerging nations), which again confirms evidence in Figure 2. However, these discussions remain conjectures, and we will leave the extensive rationale for this as a future research avenue.
Fourth, we could not find a significant relationship between corruption in host economies and inward FDI. Although it was not our main research question, the impact of a host country’s corruption on FDI has been explored by many scholars in the FDI literature [16,18]. Most of the literature has reported empirical evidence on the negative relationship between corruption and FDI, which shows that more corrupt host countries have greater difficulty in attracting foreign investment. For example, Habib and Zurawicki [12] used data from the same source as the current study for FDI inflow and CPI measurements. However, their analysis considered only the host country’s characteristics, while our bilateral analysis covered all possible 240 pairs between 16 countries over 5 years. This key difference implies that Habib and Zurawicki [12] focused on the average level of the corruption effect so that their results consider investing countries as a homogeneous home country. Our result considers the heterogeneity in home countries because the unobserved differences between home countries are being controlled as independent variables in regressing bilateral FDI flows. Additional negative evidence by Voyer and Beamish [19] focuses on Japan’s FDI outflows to 59 host countries. The existence of the corruption effect on FDI in Japan may not necessarily be applied to other OECD countries. Another large stream of the literature presenting conflicting evidence uses firm-level data sets [17,18]. Given the reports so far in the literature, including ours, we propose that the influence of a host country’s corruption level on FDI is likely to depend on various characteristics of the host and home countries. In addition, since different reports in the literature utilize a different time window even from the same data source, the influence may be time-varying or depending on some unknown factors correlated with this time difference. In summary, our result implies that there are still many unexplored areas in this research field.

6. Conclusions

Using a longitudinal panel data set, we examined the influence of the host country’s e-government system on MNEs’ FDI activity. The results indicate that a higher development level of the e-government system triggers more FDI inflow. In addition, our empirical evidence demonstrates that the corruption level of a host country plays a moderating role in the effect of the e-government development on the FDI inflow. Our findings provide support for the perspective that a higher digitalization level of governments implies a competitive location-specific advantage for countries wishing to attract more inward FDI. Furthermore, countries with relatively higher corruption should invest more in e-government development as MNEs tend to look for official e-information to reduce potential business and environmental uncertainty in target markets.
Our findings have important practical implications for policymakers for sustainable development of their economies on how they can attract more FDI by controlling the market environment. First of all, host countries will be able to attract more inward FDI by investing in digitalized infrastructure. The spread of information and communication technology (ICT) will foster an investor-friendly environment by enhancing information accessibility and transparency on public services and information. Furthermore, considering the fact that many countries have made considerable efforts to control corruption for FDI attraction, we argue that e-government introduction can be a viable alternative to lure foreign investments. In particular, for emerging markets where corrupt practices are more prevalent, they should invest more aggressively in e-government introduction. This is because it can be an effective vehicle to induce foreign capital in that the sufficient and trustworthy information provided by local governments can function as a means to reduce business uncertainty.
On the theoretical side, we contribute to the OLI paradigm and particularly location-specific advantage by identifying the relationship between e-government and corrupt practices in host countries. As briefly stated at the beginning of the paper, IB scholars tend to turn their focus away from corrupt practices, for instance, in developing and underdeveloped host markets. Due to the same reason, empirical examinations of corrupt practices still remain in their infancy. Meanwhile, we often call the modern world the era of digitalization, and in a similar vein, to reiterate, we commonly consider that e-government information plays a pivotal role in attracting inward FDI from MNEs. Thus, we argue that it is time to simultaneously examine the role of e-government information with corrupt practices in local economies. Under this idea, our model proposes that e-government information may function as an important location-specific advantage and its effects can be moderated by the level of corruption (MNEs perhaps feel that corruption is also part of the business atmosphere as well as a location-specific factor that they should follow in local environments). (There may exist another viewpoint that ‘e-government’ can be understood as a part of government policy element under location-specific advantage rather than a new element. We believe that e-government has both roles of being a part of government policy itself and greasing government policies. The relevant questions which have been unanswered yet—such as, Which role dominates another? And, What factors moderate the role of e-government?—will be worthwhile for theoretical contributions to literature and are left for the future research.) Our study points out that IB scholars need to explore the extent to which the interactions of the two location-specific elements influence MNEs’ willingness to invest in a foreign market. We contribute to the OLI paradigm in that we found that transparent government information plays a pivotal role in luring foreign investment. Second, interestingly, well-developed institutional environments reduce the level of local corruption and decrease the costs associated with accessing e-government information, whereas the presence of corrupt practices increases the value of information accessibility and transparency provided by local governments. That is, under the presence of corrupt practices in local markets, e-government information can be a highly crucial location-specific advantage triggering MNEs’ intent to enter foreign markets.
Our research has several limitations. First, our analysis uses the EGDI measure to consider e-government development levels in each country. Although the EGDI variable is a widely used metric that was carefully designed by the UN, it is still a one-dimensional simplified index for the convenience of researchers. If we had a chance to perform the same analysis on various other metrics related to e-government, the estimation results would have a stronger external validity to generalize our findings. Second, we used disaggregated data to avoid confounding variable issues. It is generally known that as data used for regression analysis become more aggregated, the estimation result is more likely to imply a weaker argument on the relationship because of uncontrolled potential latent variables. Although our data set is large, it would be better to use a greater range of years and firm-level observations. It may provide higher statistical credibility as well as additional opportunities to address research questions yet unanswered. Third, the present study does not directly unveil the underlying mechanisms of the way in which e-government promotes foreign investment. Although we showed the existence of the e-government effect per se and suggested a theory based on the OLI paradigm, our data do not allow us to fully understand which specific component of the locational characteristics stimulates foreign investment. With more detailed information on various potential mediating variables, this question could be answered. Finally, with respect to ‘additional analysis 2’, we do not know why the presence of e-government information is particularly important for firms in small countries and emerging markets, and thus, we suggest that future research explores these reasons, which will enhance our understanding of the relationship between e-government information and corruption. Fourth, the control variables of our choice in the model may not fully explain the difference in FDI levels between countries. Although we thoroughly studied what variables were considered in the literature and incorporated those core variables into our model, there will exist some omitted factors influencing FDI. If those unknown factors are possibly correlated with our focal variables, the estimates of our main interest may be seriously biased. Inclusion of the factors found in the future studies will help to more clearly answer to our research question.

Author Contributions

Conceptualization, K.K. and J.A.; methodology, K.K. and J.A.; software, K.K. and J.A.; validation, K.K. and J.A.; formal analysis, K.K. and J.A.; investigation, K.K. and J.A.; resources, K.K. and J.A.; data curation, K.K. and J.A.; writing—original draft preparation, K.K. and J.A.; writing—review and editing, K.K. and J.A.; visualization, K.K. and J.A.; supervision, J.A.; project administration, J.A. All authors have read and agreed to the published version of the manuscript.

Funding

This work was supported by Hankuk University of Foreign Studies Research Fund.

Institutional Review Board Statement

Not applicable.

Informed Consent Statement

Not applicable.

Data Availability Statement

Not applicable.

Conflicts of Interest

The authors declare no conflict of interest.

References

  1. Alfaro, L.; Chanda, A.; Kalemli-Ozcan, S.; Sayek, S. FDI and Economic Growth: The Role of Local Financial Markets. J. Int. Econ. 2004, 64, 89–112. [Google Scholar] [CrossRef]
  2. Blonigen, B.A. A Review of the Empirical Literature on FDI Determinants. Atl. Econ. J. 2005, 33, 383–403. [Google Scholar] [CrossRef]
  3. Meyer, K.E. Perspectives on Multinational Enterprises in Emerging Economies. J. Int. Bus. Stud. 2004, 35, 259–276. [Google Scholar] [CrossRef]
  4. Paul, J.; Feliciano-Cestero, M.M. Five Decades of Research on Foreign Direct Investment by MNEs: An Overview and Research Agenda. J. Bus. Res. 2021, 124, 800–812. [Google Scholar] [CrossRef]
  5. Appiah-Kubi, S.N.; Malec, K.; Maitah, M.; Kutin, S.B.; Pánková, L.; Phiri, J.; Zaganjori, O. The impact of corporate governance structures on foreign direct investment: A case study of West African countries. Sustainability 2020, 12, 3715. [Google Scholar] [CrossRef]
  6. Kim, S. The effects of foreign direct investment, economic growth, industrial structure, renewable and nuclear energy, and urbanization on Korean greenhouse gas emissions. Sustainability 2020, 12, 1625. [Google Scholar] [CrossRef] [Green Version]
  7. Yue, S.; Yang, Y.; Hu, Y. Does foreign direct investment affect green growth? Evidence from China’s experience. Sustainability 2016, 8, 158. [Google Scholar] [CrossRef] [Green Version]
  8. Wu, S.; Zhang, K. Influence of urbanization and foreign direct investment on carbon emission efficiency: Evidence from urban clusters in the Yangtze River economic belt. Sustainability 2021, 13, 2722. [Google Scholar] [CrossRef]
  9. OECD. International Direct Investment Statistics 2019; OECD Publishing: Washington, DC, USA, 2019. [Google Scholar]
  10. Driffield, N.; Jones, C.; Crotty, J. International Business Research and Risky Investments, an Analysis of FDI in Conflict Zones. Int. Bus. Rev. 2013, 22, 140–155. [Google Scholar] [CrossRef] [Green Version]
  11. Dunning, J.H. Internationalizing Porter’s Diamond. MIR Manag. Int. Rev. 1993, 33, 7–15. [Google Scholar]
  12. Habib, M.; Zurawicki, L. Corruption and Foreign Direct Investment. J. Int. Bus. Stud. 2002, 33, 291–307. [Google Scholar] [CrossRef]
  13. Brouthers, L.E.; Gao, Y.; McNicol, J.P. Corruption and Market Attractiveness Influences on Different Types of FDI. Strat. Mgmt. J. 2008, 29, 673–680. [Google Scholar] [CrossRef]
  14. Hines, J. Forbidden Payment: Foreign Bribery and American Business after 1977; National Bureau of Economic Research: Cambridge, MA, USA, 1995. [Google Scholar]
  15. Wheeler, D.; Mody, A. International Investment Location Decisions. J. Int. Econ. 1992, 33, 57–76. [Google Scholar] [CrossRef]
  16. Rose–Ackerman, S. Corruption and Government. Int. Peacekeeping 2008, 15, 328–343. [Google Scholar] [CrossRef] [Green Version]
  17. Chen, C.J.; Ding, Y.; Kim, C. High-Level Politically Connected Firms, Corruption, and Analyst Forecast Accuracy around the World. J. Int. Bus. Stud. 2010, 41, 1505–1524. [Google Scholar] [CrossRef]
  18. Javorcik, B.S.; Wei, S.-J. Corruption and Cross-Border Investment in Emerging Markets: Firm-Level Evidence. J. Int. Money Financ. 2009, 28, 605–624. [Google Scholar] [CrossRef]
  19. Voyer, P.A.; Beamish, P.W. The Effect of Corruption on Japanese Foreign Direct Investment. J. Bus. Ethics 2004, 50, 211–224. [Google Scholar] [CrossRef]
  20. Wei, S.-J. How Taxing Is Corruption on International Investors? Rev. Econ. Stat. 2000, 82, 1–11. [Google Scholar] [CrossRef] [Green Version]
  21. Hoinaru, R.; Buda, D.; Borlea, S.N.; Văidean, V.L.; Achim, M.V. The impact of corruption and shadow economy on the economic and sustainable development. Do they “sand the wheels” or “grease the wheels”? Sustainability 2020, 12, 481. [Google Scholar] [CrossRef] [Green Version]
  22. Liu, Y.; Dong, F. Corruption, economic development and haze pollution: Evidence from 139 global countries. Sustainability 2020, 12, 3523. [Google Scholar] [CrossRef]
  23. Feruni, N.; Hysa, E.; Panait, M.; Rădulescu, I.G.; Brezoi, A. The impact of corruption, economic freedom and urbanization on economic development: Western Balkans versus EU-27. Sustainability 2020, 12, 9743. [Google Scholar] [CrossRef]
  24. Nationen, V. (Ed.) E-Government in Support of Sustainable Development; United Nations e-Government Survey: New York, NY, USA, 2018. [Google Scholar]
  25. Jun, C.N.; Chung, C.J. Big Data Analysis of Local Government 3.0: Focusing on Gyeongsangbuk-Do in Korea. Technol. Forecast. Soc. Change 2016, 110, 3–12. [Google Scholar] [CrossRef]
  26. Wescott, C. Combating Corruption in Southeast Asia. In Fighting Corruption in ASIA: Causes, Effects and Remedies; World Scientific: Singapore, 2003; pp. 237–269. [Google Scholar]
  27. Global Corruption Report; Transparency International: Berlin, Germany, 2018.
  28. Anderson, J. A Review of Governance and Anti-Corruption Indicators in East Asia and Pacific; World Bank: Washington, NJ, USA, 2009. [Google Scholar]
  29. Mistry, J.J.; Jalal, A. An Empirical Analysis of the Relationship between E-Government and Corruption. Int. J. Digit. Account. Res. 2012, 12, 145–176. [Google Scholar] [CrossRef]
  30. Shim, D.C.; Eom, T.H. E-Government and Anti-Corruption: Empirical Analysis of International Data. Int. J. Public Adm. 2008, 31, 298–316. [Google Scholar] [CrossRef]
  31. Jameel, A.; Asif, M.; Hussain, A.; Hwang, J.; Sahito, N.; Bukhari, M.H. Assessing the moderating effect of corruption on the e-government and trust relationship: An evidence of an emerging economy. Sustainability 2019, 11, 6540. [Google Scholar] [CrossRef] [Green Version]
  32. Rodríguez-Martínez, C.C.; García-Sánchez, I.M.; Vicente-Galindo, P.; Galindo-Villardón, P. Exploring Relationships between Environmental Performance, E-Government and Corruption: A Multivariate Perspective. Sustainability 2019, 11, 6497. [Google Scholar] [CrossRef] [Green Version]
  33. Myeong, S.; Kwon, Y.; Seo, H. Sustainable e-governance: The relationship among trust, digital divide, and e-government. Sustainability 2014, 6, 6049–6069. [Google Scholar] [CrossRef] [Green Version]
  34. Lee, Y.B. Exploring the relationship between E-government development and environmental sustainability: A study of small Island Developing States. Sustainability 2017, 9, 732. [Google Scholar] [CrossRef] [Green Version]
  35. Anechiarico, F.; Jacobs, J.B. The Pursuit of Absolute Integrity: How Corruption Control Makes Government Ineffective; University of Chicago Press: Chicago, IL, USA, 1996. [Google Scholar]
  36. Azubuike, A. Accessibility of government information as a determinant of inward foreign direct investment in Africa. In Proceedings of the World Library and Information Congress: 72nd IFLA General Conference and Council, Seoul, Korea, 20–24 August 2006. [Google Scholar]
  37. Kachwamba, M.A. Impact of E-Government on Transaction Cost and FDI Inflows: A Proposed Conceptual Framework. IJBM 2011, 6, p285. [Google Scholar] [CrossRef] [Green Version]
  38. Prasetyo, B.; Susanto, T.D. The Relationship Analysis of E-Government Implementation on Increasing Capital Investment in Region (Case Study: Banyuwangi City). IPTEK J. Eng. 2017, 3, 17–21. [Google Scholar] [CrossRef] [Green Version]
  39. Abu-Shanab, E. Antecedents of Trust in E-Government Services: An Empirical Test in Jordan. Transform. Gov. People Process Policy 2014, 8, 480–499. [Google Scholar] [CrossRef]
  40. Martins, J.; Veiga, L. Electronic Government and the Ease of Doing Business. In Proceedings of the 11th International Conference on Theory and Practice of Electronic Governance, Galway, Ireland, 4–6 April 2018; pp. 584–587. [Google Scholar]
  41. Dunning, J.H. Toward an Eclectic Theory of International Production: Some Empirical Tests. J. Int. Bus. Stud. 1980, 11, 9–31. [Google Scholar] [CrossRef]
  42. Dunning, J.H. The Eclectic Paradigm of International Production: A Restatement and Some Possible Extensions. In The Eclectic Paradigm; Palgrave Macmillan: London, UK, 2015; pp. 50–84. [Google Scholar]
  43. Boateng, A.; Hua, X.; Uddin, M.; Du, M. Home Country Macroeconomic Factors on Outward Cross-Border Mergers and Acquisitions: Evidence from the UK. Res. Int. Bus. Financ. 2014, 30, 202–216. [Google Scholar] [CrossRef]
  44. Kiymaz, H. The Impact of Country Risk Ratings on U.S. Firms in Large Cross-Border Acquisitions. Glob. Financ. J. 2009, 20, 235–247. [Google Scholar] [CrossRef]
  45. Eden, L.; Miller, S.R. Distance Matters: Liability of Foreignness, Institutional Distance and Ownership Strategy. In Advances in International Management; Emerald (MCB UP): Bingley, UK, 2004; Volume 16, pp. 187–221. [Google Scholar]
  46. Grosse, R.; Trevino, L.J. New Institutional Economics and FDI Location in Central and Eastern Europe. MIR: Manag. Int. Rev. 2005, 45, 123–145. [Google Scholar]
  47. Scott, W.R. Institutions and Organizations; Foundations for Organizational Science; SAGE: Thousand Oaks, CA, USA, 1995. [Google Scholar]
  48. North, D.C. A Transaction Cost Theory of Politics. J. Theor. Politics 1990, 2, 355–367. [Google Scholar] [CrossRef]
  49. Kostova, T. Country Institutional Profiles: Concept and Measurement. AMPROC 1997, 1997, 180–184. [Google Scholar] [CrossRef]
  50. Bartels, F.L.; Napolitano, F.; Tissi, N.E. FDI in Sub-Saharan Africa: A Longitudinal Perspective on Location-Specific Factors (2003–2010). Int. Bus. Rev. 2014, 23, 516–529. [Google Scholar] [CrossRef]
  51. Zaheer, S. Overcoming the Liability of Foreignness. AMJ 1995, 38, 341–363. [Google Scholar]
  52. Hoskisson, R.E.; Eden, L.; Lau, C.M.; Wright, M. Strategy in Emerging Economies. AMJ 2000, 43, 249–267. [Google Scholar]
  53. Mudambi, R.; Navarra, P. Institutions and Internation Business: A Theoretical Overview. Int. Bus. Rev. 2002, 11, 635–646. [Google Scholar] [CrossRef]
  54. Goldstein, I.; Razin, A. An Information-Based Trade off between Foreign Direct Investment and Foreign Portfolio Investment. J. Int. Econ. 2006, 70, 271–295. [Google Scholar] [CrossRef] [Green Version]
  55. Graham, B.A.T.; Johnston, N.P.; Kingsley, A.F. Even Constrained Governments Take: The Domestic Politics of Transfer and Expropriation Risks. J. Confl. Resolut. 2018, 62, 1784–1813. [Google Scholar] [CrossRef]
  56. Meijer, A. Understanding Modern Transparency. Int. Rev. Adm. Sci. 2009, 75, 255–269. [Google Scholar] [CrossRef]
  57. Matambalya, F.; Wolf, S. The role of ICT for the Performance of SMEs in East Africa. Empirical Evidence from Kenya and Tanzania; University of Bonn, Center for Development Research (ZEF): Bonn, Germany, 2001. [Google Scholar]
  58. Brin, S. Extracting Patterns and Relations from the World Wide Web. In The World Wide Web and Databases; Atzeni, P., Mendelzon, A., Mecca, G., Eds.; Lecture Notes in Computer Science; Springer: Berlin/Heidelberg, Germany, 1999; Volume 1590, pp. 172–183. [Google Scholar]
  59. Prattipati, S.N. Adoption of E-Governance: Differences between Countries in the Use of Online Government Services. J. Am. Acad. Bus. 2003, 3, 386–401. [Google Scholar]
  60. Fatima, S.T. Productivity Spillovers from Foreign Direct Investment: Evidence from Turkish Micro-Level Data. J. Int. Trade Econ. Dev. 2016, 25, 291–324. [Google Scholar] [CrossRef]
  61. Ullah, A.; Kui, Z.; Ullah, S.; Pinglu, C.; Khan, S. Sustainable utilization of financial and institutional resources in reducing income inequality and poverty. Sustainability 2021, 13, 1038. [Google Scholar] [CrossRef]
  62. Kneuer, M. E-Democracy: A New Challenge for Measuring Democracy. Int. Political Sci. Rev. 2016, 37, 666–678. [Google Scholar] [CrossRef]
  63. Pardo, T.A.; Nam, T.; Burke, G.B. E-Government Interoperability: Interaction of Policy, Management, and Technology Dimensions. Soc. Sci. Comput. Rev. 2012, 30, 7–23. [Google Scholar] [CrossRef]
  64. Di Carlo, E. How Much Is Really Known About the Meaning of the Term “Conflict of Interest”? Int. J. Public Adm. 2013, 36, 884–896. [Google Scholar] [CrossRef]
  65. Jun, K.W.; Singh, H. The Determinants of Foreign Direct Investment: New Empirical Evidence. Transnatl. Corp. 1996, 5, 67–106. [Google Scholar]
  66. Wells, L.T.; Wint, A.G. Marketing a Country: Promotion as a Tool for Attracting Foreign Investment; World Bank Publications: Washington, DC, USA, 2000. [Google Scholar]
  67. Globerman, S.; Shapiro, D. Governance Infrastructure and US Foreign Direct Investment. J. Int. Bus. Stud. 2003, 34, 19–39. [Google Scholar] [CrossRef]
  68. Godinez, J.R.; Liu, L. Corruption Distance and FDI Flows into Latin America. Int. Bus. Rev. 2015, 24, 33–42. [Google Scholar] [CrossRef] [Green Version]
  69. ITU. World Telecommunication/ICT Indicators Database; International Telecommunication Union: Geneva, Switzerland, 2019. [Google Scholar]
  70. Dunning, J.H. Location and the Multinational Enterprise: John Dunning’s Thoughts on Receiving the Journal of International Business Studies 2008 Decade Award. J. Int. Bus. Stud. 2009, 40, 20–34. [Google Scholar] [CrossRef]
  71. Neter, J.; Kutner, M.H.; Nachtsheim, C.J.; Wasserman, W. Applied Linear Statistical Models; Irwin: Huntersville, NC, USA, 1996. [Google Scholar]
  72. Studenmund, A.H.; Cassidy, H.J. Using Econometrics: A Practical Guide; Addison-Wesley Educational Publishers: Boston, MA, USA, 1992. [Google Scholar]
Figure 1. Our framework to explain the relationship between the host country’s e-government and FDI.
Sustainability 14 04995 g001
Figure 2. Relationships between FDI and EGDI for different CPI values.
Sustainability 14 04995 g002
Figure 3. Relationships between home country’s EGDI and importance of host country’s EGDI when home countries make FDI decisions.
Sustainability 14 04995 g003
Figure 4. Relationships between home country’s CPI and importance of host country’s EGDI when home countries make FDI decisions.
Sustainability 14 04995 g004
Table 1. Means, standard deviations, and correlation matrix.
VariableMeanS.D.(1)(2)(3)(4)(5)(6)(7)
(1) FDI (1 if positive, or 0)0.180.39
(2) Log GDP27.351.290.49 ***
(3) TPG111.1483.31−0.24 ***−0.72 ***
(4) GPC44,670.3425,003.34−0.01−0.19 ***0.63 ***
(5) POLI0.720.68−0.07 *−0.25 ***0.36 ***0.54 ***
(6) MOB122.2216.390.00−0.12 ***0.22 ***0.27 ***0.38 ***
(7) CPI70.6914.52−0.05 †−0.11 ***0.29 ***0.72 ***0.69 ***0.07 *
(8) EGDI0.770.190.37 ***0.52 ***−0.26 ***−0.01−0.01−0.06 *0.06 *
† Significance in 10% level, * Significance in 5% level, *** Significance in 0.1% level.
Table 2. E-government development indices of 16 countries (average).
E-Government Development Index (2014–2018)
RankCountryMean
1KOR0.99
2NDL0.98
3USA0.92
4JPN0.91
5CAN0.82
6SWE0.72
7ITA0.7
8DNK0.69
9AUT0.66
10PRT0.61
11LUX0.6
12POL0.57
13BEL0.51
14CHE0.49
15TUR0.46
16CZE0.39
Table 3. Logistic regression results.
Dependent Variable: Positive FDI Inflow or Not
Model 1Model 2Model 3Model 4Model 5
Control variables
Intercept−47.51 ***(4.331)−47.29 ***(4.382)−32.52 ***(4.718)−31.99 ***(4.803)−34.42 ***(5.061)
Log GDP1.658 ***(0.153)1.655 ***(0.155)1.107 ***(0.168)1.095 ***(0.171)1.201 ***(0.181)
TPG0.013 ***(0.003)0.013 ***(0.003)0.006 †(0.004)0.006(0.004)0.008 *(0.004)
GPC−0.000 *(0.000)−0.000(0.000)0.000(0.000)0.000(0.000)−0.000(0.000)
POLI0.018(0.174)0.171(0.244)−0.381 †(0.203)−0.179(0.274)−0.456(0.316)
MOB0.002(0.005)−0.002(0.007)0.002(0.006)−0.002(0.007)−0.003(0.007)
Partner country fixed effects
BEL−1.635 **(0.541)−1.636 **(0.540)−1.697 **(0.538)−1.697 **(0.537)−1.735 **(0.545)
CAN−0.918 †(0.491)−0.912 †(0.492)−0.974 †(0.502)−0.966 †(0.503)−1.003 *(0.511)
CHE−1.003 *(0.487)−1.003 *(0.487)−1.072 *(0.495)−1.073 *(0.496)−1.095 *(0.504)
CZE−1.866 ***(0.557)−1.861 ***(0.556)−1.902 ***(0.552)−1.898 ***(0.551)−1.949 ***(0.557)
DNK−0.763(0.468)−0.766(0.468)−0.803 †(0.482)−0.809 †(0.483)−0.828 †(0.491)
ITA−0.454(0.466)−0.438(0.466)−0.492(0.483)−0.472(0.484)−0.502(0.491)
JPN−0.081(0.445)−0.085(0.446)−0.096(0.466)−0.102(0.468)−0.108(0.477)
KOR−0.729(0.482)−0.721(0.482)−0.702(0.495)−0.690(0.496)−0.627(0.501)
LUX−0.522(0.455)−0.520(0.456)−0.569(0.471)−0.567(0.473)−0.584(0.480)
NLD−0.641(0.473)−0.653(0.474)−0.637(0.489)−0.657(0.490)−0.707(0.499)
POL−2.599 ***(0.642)−2.593 ***(0.641)−2.576 ***(0.629)−2.570 ***(0.627)−2.624 ***(0.632)
PRT−1.174 *(0.495)−1.173 *(0.495)−1.228 *(0.502)−1.228 *(0.503)−1.265 *(0.510)
SWE−1.014 *(0.486)−1.018 *(0.486)−1.064 *(0.496)−1.069 *(0.496)−1.095 *(0.504)
TUR−1.451 **(0.525)−1.452 **(0.524)−1.506 **(0.526)−1.508 **(0.526)−1.559 **(0.532)
USA0.203(0.426)0.205(0.427)0.207(0.450)0.209(0.452)0.224(0.458)
Independent variables
CPI −0.176(0.197) −0.222(0.200)0.293(0.243)
EGDI 0.951 ***(0.176)0.958 ***(0.177)0.960 ***(0.191)
CPI × EGDI −0.633 ***(0.158)
AIC825.26826.46790.78791.54775.39
N = 1200, † Significance in 10% level, * Significance in 5% level, ** Significance in 1% level, *** Significance in 0.1% level. The baseline country for partner country fixed effects is “AUT”.
Table 4. Robustness check results.
Dependent Variable: Positive FDI Inflow or Not
Year 2018Year 2017Year 2016Year 2015Year 2014Year 2014–2018
Control variables
Intercept−35.62 **(12.06)−30.66 *(12.72)−29.63 *(13.54)−16.07(26.66)−20.50(24.80)−34.42 ***(5.061)
Log GDP1.240 **(0.440)1.197 **(0.460)1.204 *(0.499)0.537(0.978)0.537(0.899)1.201 ***(0.181)
TPG0.011(0.009)−0.005(0.010)0.010(0.009)−0.005(0.017)−0.007(0.019)0.008 *(0.004)
GPC−0.000(0.000)−0.000(0.000)0.000(0.000)0.000(0.000)0.000(0.000)−0.000(0.000)
POLI1.636(1.247)−1.772(1.231)−2.895 **(1.043)−2.611 **(0.937)−3.994 **(1.384)−0.456(0.316)
MOB−0.043 *(0.021)−0.004(0.016)−0.042 *(0.017)0.002(0.019)0.028(0.026)−0.003(0.007)
Partner country fixed effects
BEL−0.001(1.144)−2.116 †(1.256)−2.175 †(1.264)−20.55(2145.)−2.106(1.593)−1.735 **(0.545)
CAN−0.529(1.235)−0.375(1.133)−1.937(1.299)−2.252 †(1.343)−0.791(1.297)−1.003 *(0.511)
CHE0.008(1.146)−2.122 †(1.254)−1.405(1.187)−3.624*(1.566)0.039(1.176)−1.095 *(0.504)
CZE−0.717(1.204)−1.310(1.152)−20.34(1276.)−2.296 †(1.327)−2.114(1.589)−1.949 ***(0.557)
DNK0.652(1.127)−1.276(1.161)−3.161 *(1.389)−1.283(1.193)0.099(1.185)−0.828 †(0.491)
ITA0.214(1.178)−0.265(1.121)−1.972(1.297)−0.388(1.116)−0.744(1.305)−0.502(0.491)
JPN1.040(1.147)−0.159(1.100)−0.919(1.194)−0.976(1.200)0.295(1.186)−0.108(0.477)
KOR0.454(1.161)−0.874(1.168)−2.387 †(1.339)−0.685(1.120)0.401(1.171)−0.627(0.501)
LUX0.021(1.149)−0.639(1.100)−0.719(1.147)−1.312(1.187)−0.752(1.304)−0.584(0.480)
NLD0.865(1.159)−1.243(1.168)−1.092(1.223)−2.124(1.373)−0.634(1.319)−0.707(0.499)
POL−1.681(1.392)−2.074(1.267)−3.168 *(1.387)−20.57(2166.)−18.27(1346.)−2.624 ***(0.632)
PRT−0.695(1.209)−1.309(1.152)−3.177 *(1.383)−1.332(1.181)−0.816(1.291)−1.265 *(0.510)
SWE0.015(1.147)−1.268(1.163)−2.179 †(1.262)−2.260 †(1.340)−0.760(1.302)−1.095 *(0.504)
TUR−0.715(1.204)−1.290(1.158)−2.174 †(1.264)−3.623 *(1.567)−2.097(1.596)−1.559 **(0.532)
USA0.500(1.150)−0.068(1.074)−0.121(1.118)−0.041(1.045)1.092(1.087)0.224(0.458)
Independent variables
CPI0.494(2.069)1.728(1.173)1.465 †(0.821)0.300(0.613)0.901(0.656)0.293(0.243)
EGDI3.712 **(1.292)1.290 †(0.725)3.157 ***(0.868)1.711 *(0.756)1.533 †(0.792)0.960 ***(0.191)
CPI × EGDI−1.385(1.622)−1.405 *(0.690)−1.680 **(0.639)−0.592(0.381)−0.263(0.310)−0.633 ***(0.158)
AIC189.61190.34164.21153.34160.57775.39
N = 240, † Significance in 10% level, * Significance in 5% level, ** Significance in 1% level, *** Significance in 0.1% level. The baseline country for partner country fixed effects is “AUT”.
Table 5. Logistic regression results in additional analysis 1.
Dependent Variable: Positive FDI Inflow or Not
Model 6Model 7Model 8
Control variables
Intercept−34.07 ***(5.084)−33.65 ***(5.110)−34.42 ***(5.061)
Log GDP1.190 ***(0.182)1.177 ***(0.183)1.200 ***(0.182)
TPG0.008 *(0.004)0.008 *(0.004)0.008 *(0.004)
GPC−0.000(0.000)0.000(0.000)−0.000(0.000)
POLI−0.459(0.316)−0.467(0.315)−0.456(0.316)
MOB−0.004(0.007)−0.005(0.007)−0.003(0.007)
Partner country fixed effects
BEL−1.735 **(0.547)−1.714 **(0.546)−1.738 **(0.545)
CAN−0.975 †(0.513)−0.931 †(0.511)−1.005 *(0.512)
CHE−1.074 *(0.506)−1.025 *(0.505)−1.098 *(0.505)
CZE−1.983 ***(0.561)−2.119 ***(0.568)−1.936 ***(0.560)
DNK−0.804(0.492)−0.761(0.490)−0.830 †(0.492)
ITA−0.443(0.492)−0.609(0.501)−0.470(0.503)
JPN−0.110(0.479)−0.121(0.477)−0.107(0.478)
KOR−0.588(0.501)−0.703(0.506)−0.604(0.507)
LUX−0.562(0.481)−0.524(0.479)−0.586(0.481)
NLD−0.673(0.501)−0.637(0.498)−0.706(0.499)
POL−2.687 ***(0.636)−2.789 ***(0.637)−2.621 ***(0.633)
PRT−1.345 **(0.517)−1.422 **(0.523)−1.269 *(0.511)
SWE−1.072 *(0.506)−1.026 *(0.505)−1.097 *(0.505)
TUR−1.501 **(0.532)−1.725 **(0.544)−1.519 **(0.550)
USA0.221(0.460)0.210(0.458)0.225(0.458)
Independent variables
CPI0.276(0.244)0.266(0.243)0.293(0.243)
EGDI1.089 ***(0.217)1.153 ***(0.223)0.974 ***(0.198)
CPI × EGDI−0.686 ***(0.162)−0.848 ***(0.199)−0.622 ***(0.163)
Dissimilarity in corruption level
Change of EGDI effect (when CPI difference > 20)−0.312(0.239)
Inferior dissimilarity in corruption level
Change of EGDI effect (when HostCPI < HomeCPI − 20) −0.715 †(0.395)
Superior dissimilarity in corruption level
Change of EGDI effect (when HostCPI > HomeCPI + 20) −0.094(0.341)
p-value for EGDI effect difference0.1920.070 †0.782
AIC775.69774.08777.32
N = 1200, † Significance in 10% level, * Significance in 5% level, ** Significance in 1% level, *** Significance in 0.1% level. The baseline country for partner country fixed effects is “AUT”.
Table 6. Logistic regression results in additional analysis 2.
Dependent Variable: Positive FDI Inflow or Not
Control variables
Intercept−31.63 ***(4.816)
Log GDP1.096 ***(0.171)
TPG0.005(0.004)
GPC0.000(0.000)
POLI−0.414 *(0.207)
MOB0.000(0.006)
Partner country fixed effects
BEL−4.398 *(2.111)
CAN−1.186 †(0.623)
CHE−3.538 *(1.719)
CZE−1.471 **(0.534)
DNK−1.296 †(0.694)
ITA−0.826(0.589)
JPN−0.169(0.454)
KOR−7.058 **(2.634)
LUX−3.177 *(1.527)
NLD−1.079 †(0.631)
POL−4.425 †(2.316)
PRT−1.856 *(0.861)
SWE−1.223 *(0.616)
TUR−5.135 *(2.281)
USA−0.017(0.464)
EGDI effect for each partner(home) country
AUT’s EGDI0.221(0.332)
BEL’s EGDI3.513 †(2.062)
CAN’s EGDI0.827(0.577)
CHE’s EGDI3.361 *(1.691)
CZE’s EGDI−0.372(0.459)
DNK’s EGDI1.212 †(0.679)
ITA’s EGDI0.994 †(0.545)
JPN’s EGDI0.357(0.369)
KOR’s EGDI7.904 **(2.763)
LUX’s EGDI3.667 *(1.534)
NLD’s EGDI1.155 †(0.631)
POL’s EGDI2.608(2.314)
PRT’s EGDI1.353(0.855)
SWE’s EGDI0.736(0.579)
TUR’s EGDI4.449 *(2.201)
USA’s EGDI0.788 *(0.396)
AIC 777.89
N = 1200, † Significance in 10% level, * Significance in 5% level, ** Significance in 1% level, *** Significance in 0.1% level. The baseline country for partner country fixed effects is “AUT”.
Publisher’s Note: MDPI stays neutral with regard to jurisdictional claims in published maps and institutional affiliations.

