Review

Bibliometric Analysis of Global Research on Ecological Networks in Nature Conservation from 1990 to 2020

1
Key Laboratory of Water Environment Simulation, School of Environment, Beijing Normal University, No. 19 Xinjiekouwai Street, Haidian District, Beijing 100875, China
2
College of Environmental Sciences and Engineering, Peking University, No. 5 Yiheyuan Road, Haidian District, Beijing 100871, China
*
Author to whom correspondence should be addressed.
Sustainability 2022, 14(9), 4925; https://doi.org/10.3390/su14094925
Submission received: 8 March 2022 / Revised: 14 April 2022 / Accepted: 18 April 2022 / Published: 20 April 2022
(This article belongs to the Topic Urban Biodiversity and Design)

Abstract

:
As a nature-based solution to land-use sustainability, ecological networks (ENs) have received substantial attention from researchers, planners, and decision-makers worldwide. To portray the global research on ENs in nature conservation during the period of 1990–2020, 1371 papers in 53 subject categories were reviewed with bibliometric methods and CiteSpace. The results showed a successive growth of publications at an annually averaged rate of 18.9% during the past three decades. Co-citation analysis indicated that the most popular topic was connectivity, on which the studies concentrated on quantifying connectivity, identifying priority areas, and integrating conservation planning. A recent hotspot is to study the landscape fragmentation effects on natural habitats or biodiversity under land-use changes in urbanized areas. Multidisciplinary approaches have been increasingly used to tackle more complex interplays among economic, social, ecological, and cultural factors, with the aim of alleviating ecological service losses attributed to human activities. Spatiotemporal dynamics and participatory design of ENs at different scales have become an emerging trend. In order to address increasing pressures on biodiversity or landscape connectivity brought about by land use and climate change, it is suggested to develop more research on the evaluation and management of the resilience of ENs.

1. Introduction

Ensuring a healthy ecosystem, biodiversity, and overall sustainability are the aims of the United Nations 2030 Sustainable Development Goals (SDGs, goal 15) [1]. However, urbanization, land-use change, and agricultural intensification have caused habitat fragmentation, ecosystem destruction, and biodiversity loss [2,3,4,5,6]. Faced with these problems, ecological networks (ENs) are becoming increasingly important, which are linking systems providing ecological continuity between otherwise isolated landscape components. They can maintain the ecosystem stability and promote sustainable development [7,8,9,10]. ENs facilitate the exchange of materials, energy, and information through specific measures and increase the structural and functional links between fragmented and isolated natural habitats in a region [11,12,13,14,15]. ENs have also been endowed with more functions, such as aesthetics, education, recreation, and cultural benefits [16].
Although European countries proposed ENs in the 1970s, they were not widely considered until the 1990s [17]. ENs were established initially primarily for nature and biodiversity conservation. In early studies, nature conservation was carried out by nature reserves and national parks [18]. However, there was a growing awareness that the protection of isolated nature reserves and individual biological elements has failed to halt the decline of biodiversity and habitat integrity [8,12]. Consequently, new developments in nature conservation based on landscape ecology were found in some countries, such as the restoration of nature reserves and areas with connecting functions (e.g., ecological corridors and greenways) [19,20]. Jongman [12] defined ENs as “systems of nature reserves and their interconnections that make a fragmented natural system coherent to support more biological diversity than in nonconnected form.” Estonia, the first country to formulate the basic principles of ENs, established the Network of Ecologically Compensating Areas in 1983 [21]. The International Union for Conservation of Nature (IUCN), at the 1996 World Conservation Congress, called on all its members to further develop ENs as a means to enhance the integrity and resilience of biodiversity at different levels (e.g., national, regional, and intercontinental) [22]. Bennett and Wit [22] considered ENs “a coherent system of natural and/or seminatural landscape elements configured and managed with the goal of maintaining or restoring ecological functions as a means of conserving biodiversity, while also providing appropriate opportunities for the sustainable use of natural resources.” Subsequently, the meanings and applications of ENs continued to extend from nature conservation to regional sustainable development [17]. The significance of establishing ENs has been widely recognized by researchers, planners, and decision-makers worldwide.
ENs consist of core areas, ecological corridors, and buffer zones [12,23]. The theoretical foundations of ENs are relatively well established, including island biogeography, metapopulation theory, and landscape ecology discipline [24]. In European countries, land use was considered to influence the structure and function of the whole landscape and the interaction of network elements. The term “ecological network” was commonly used in related studies [16,25]. American scholars focused much more on national parks and nature reserves and sometimes used “greenways” [13,26]. Connectivity is a crucial factor of ecological function and landscape restoration, which is important for gene flow, individual dispersal, and matter and energy exchange [8,27]. The connectivity research was based on Forman’s classic patch–matrix–corridor pattern [12]. However, this pattern provided only a cursory perspective, with almost no clear ecological support [24]. Thus, researchers sought to find a better way to quantify connectivity at different scales [28,29,30,31] and the critical role of habitat patches [32,33,34]. Significant breakthroughs have been made in theoretical research and methodological approaches [8,13,15,35,36]. Some researchers questioned the theoretical foundations and the validity of the evidence for such conservation strategies [24,37,38]. However, many empirical studies have confirmed the effectiveness and feasibility of ENs [39,40,41].
Today, EN proposals, plans, and projects can be found on all continents, in a wide range of geographical regions, and in landscapes ranging from almost primitive to highly developed [10,25,42,43]. The breadth and depth of EN research have considerably improved with the development of increasingly powerful algorithms and more sophisticated spatial analysis techniques [44,45]. Studies of ENs have been extended to include economic, social, ecological, and cultural factors, thus providing a multi-faceted perspective of biodiversity conservation and land-use planning. The studies mainly covered the following aspects: landscape planning [7], network design and construction [10,46], evaluation and optimization [47,48], and management [49]. However, these studies used single rather than multiple perspectives to study ENs. There was no comprehensive review of ENs from a quantitative or qualitative perspective. Therefore, in order to present a comprehensive and up-to-date review of the global research trends and features of ENs, it is necessary to survey the current status, elucidate progress and advances, and summarize the evolution and development of this field, especially in the face of severe climate change and urgent biodiversity conservation.
Bibliometrics, an important branch of informatics and philology, emerged in the early 20th century [50]. It uses mathematical, statistical, and bibliographic methods to quantitatively analyze the research characteristics of a specified field, including the number of publications, countries, institutions, journals, authors, and keywords [51]. Many researchers have widely used this methodology to conduct qualitative and quantitative analyses of research patterns and trends in a particular field. Li and Zhao [50] studied global environmental assessment (EA) research trends based on 113,468 articles published in the field over a 20-year period. Wang [52] reviewed 1084 publications on urban metabolism from 1991 to 2020 and suggested possible future research directions. In addition, knowledge mapping was also applied in this study, as it allowed knowledge domains to be visualized based on the obtained publications [53].
This paper aims to perform a systematic and up-to-date bibliometric review of research on global landscape ecological networks over 30 years. We combine bibliometric methods with CiteSpace visualization software to obtain a more comprehensive and insightful review of research in the field of ENs. This study investigates the current research status, including the temporal development of outputs, scientific collaboration, influential journals, and subject categories involved in EN research. Then, some exciting achievements and progress are summarized. Finally, the hotspots and possible emerging trends are discussed.

2. Materials and Methods

2.1. Data Collection and Screening

Web of Science (WOS) is a large multidisciplinary citation database maintained by the Institute for Scientific Information (ISI) since 1997. The data retrieval source used for the bibliometric analysis was based on the Web of Science Core Collection (WoSCC): Science Citation Index Expanded (SCI-Expanded) and Social Science Citation Index (SSCI). The search query was set as TS (Topic Search) = (landscap* AND “ecolog* network*”) OR (“landscap* ecolog*” AND network*) OR (“landscap* connectivi*” AND network*). The retrieved articles contained these words and their variants (with “*”) in the titles, keywords, and abstracts. The timespan was a custom year range: from 1990 to 2020. The search was performed within one day to avoid any deviation caused by the continuous update of the WOS database. During the 1990–2020 period, 1384 publications were retrieved that satisfied the selection standards. Upon further examination, 1371 of these publications (99.06% of the total) were categorized as “articles” or “reviews,” and these publications were further quantitatively analyzed as relevant citation items in this study.

2.2. Research Method

CiteSpace is a Java-based software package developed by Chen [54]. It uses dynamic time-series mapping to visualize the documents, including identifying key topics, detecting intellectual bases, and discovering hotspots and emerging trends. The highlight of the software is the co-citation analysis (including cited reference, cited author, and cited journal), which is a popular method used in quantitative scientific research [54,55]. A link is created between nodes A and B in the co-citation network when paper C cites paper A and B together [56]. The software version 5.8. R3 was applied to perform dynamic and multidimensional network analysis and draw the corresponding knowledge maps. We set the node types in CiteSpace as “country,” “institution,” “category,” “keyword,” “term,” and “cited reference.” The links between nodes indicate the strength of collaboration, co-occurrence, or co-citation [57]. The evolution of research subjects in this field can be visualized by setting the node type as “category” and selecting the timeline view. The knowledge base for research in this field was built on co-citation analysis to identify the most important citations and their evolution. Based on the analysis of keyword co-word and term co-occurrence (two keywords/terms appearing in the same paper), hot spots and emerging trends in EN research were explored. In addition, in order to identify research distributions across spatial scales, the R language (bibliometrix package) was introduced into the field of collaborative networks between country cooperation. Pivotal nodes (e.g., countries, journals) were identified by recognizing the nodes with high betweenness centrality, which were highlighted by purple rings in the CiteSpace software [56,58].

3. Results and Discussion

3.1. Publication Characteristics

3.1.1. Temporal Development

Figure 1 shows the characteristics of the annual output of the publication in the EN research from 1990 to 2020. The studies can be divided into three phases (1990–2004, 2005–2014, and 2015–2020) based on the number of annual publications. The number of publications in the first phase grew slowly, from 1 in 1990 to 9 in 2004, accounting for only 8.68% of the total publications. Although the amount of literature was not abundant at this stage, the concepts and methods of ENs were initially developed, laying the theoretical foundation for subsequent research [59]. Papers published in 2005–2020 accounted for 91.32% of the total, with a growth rate of 16.21%. The concepts and applications of ENs have gradually deepened and matured. Among them, the papers published in the second stage accounted for 36.47%, maintaining relatively high growth, and by 2014, publications were 5.16 times that of 2005. After 2015, the research entered a faster development stage, with papers accounting for 54.85% of the total. ENs have been designed and implemented at various scales: intercontinental [25], regional [60], national [43,61], urban agglomeration [62], and urban [48]. ENs have become a consensus to address biodiversity issues and enhance ecosystem services [63].

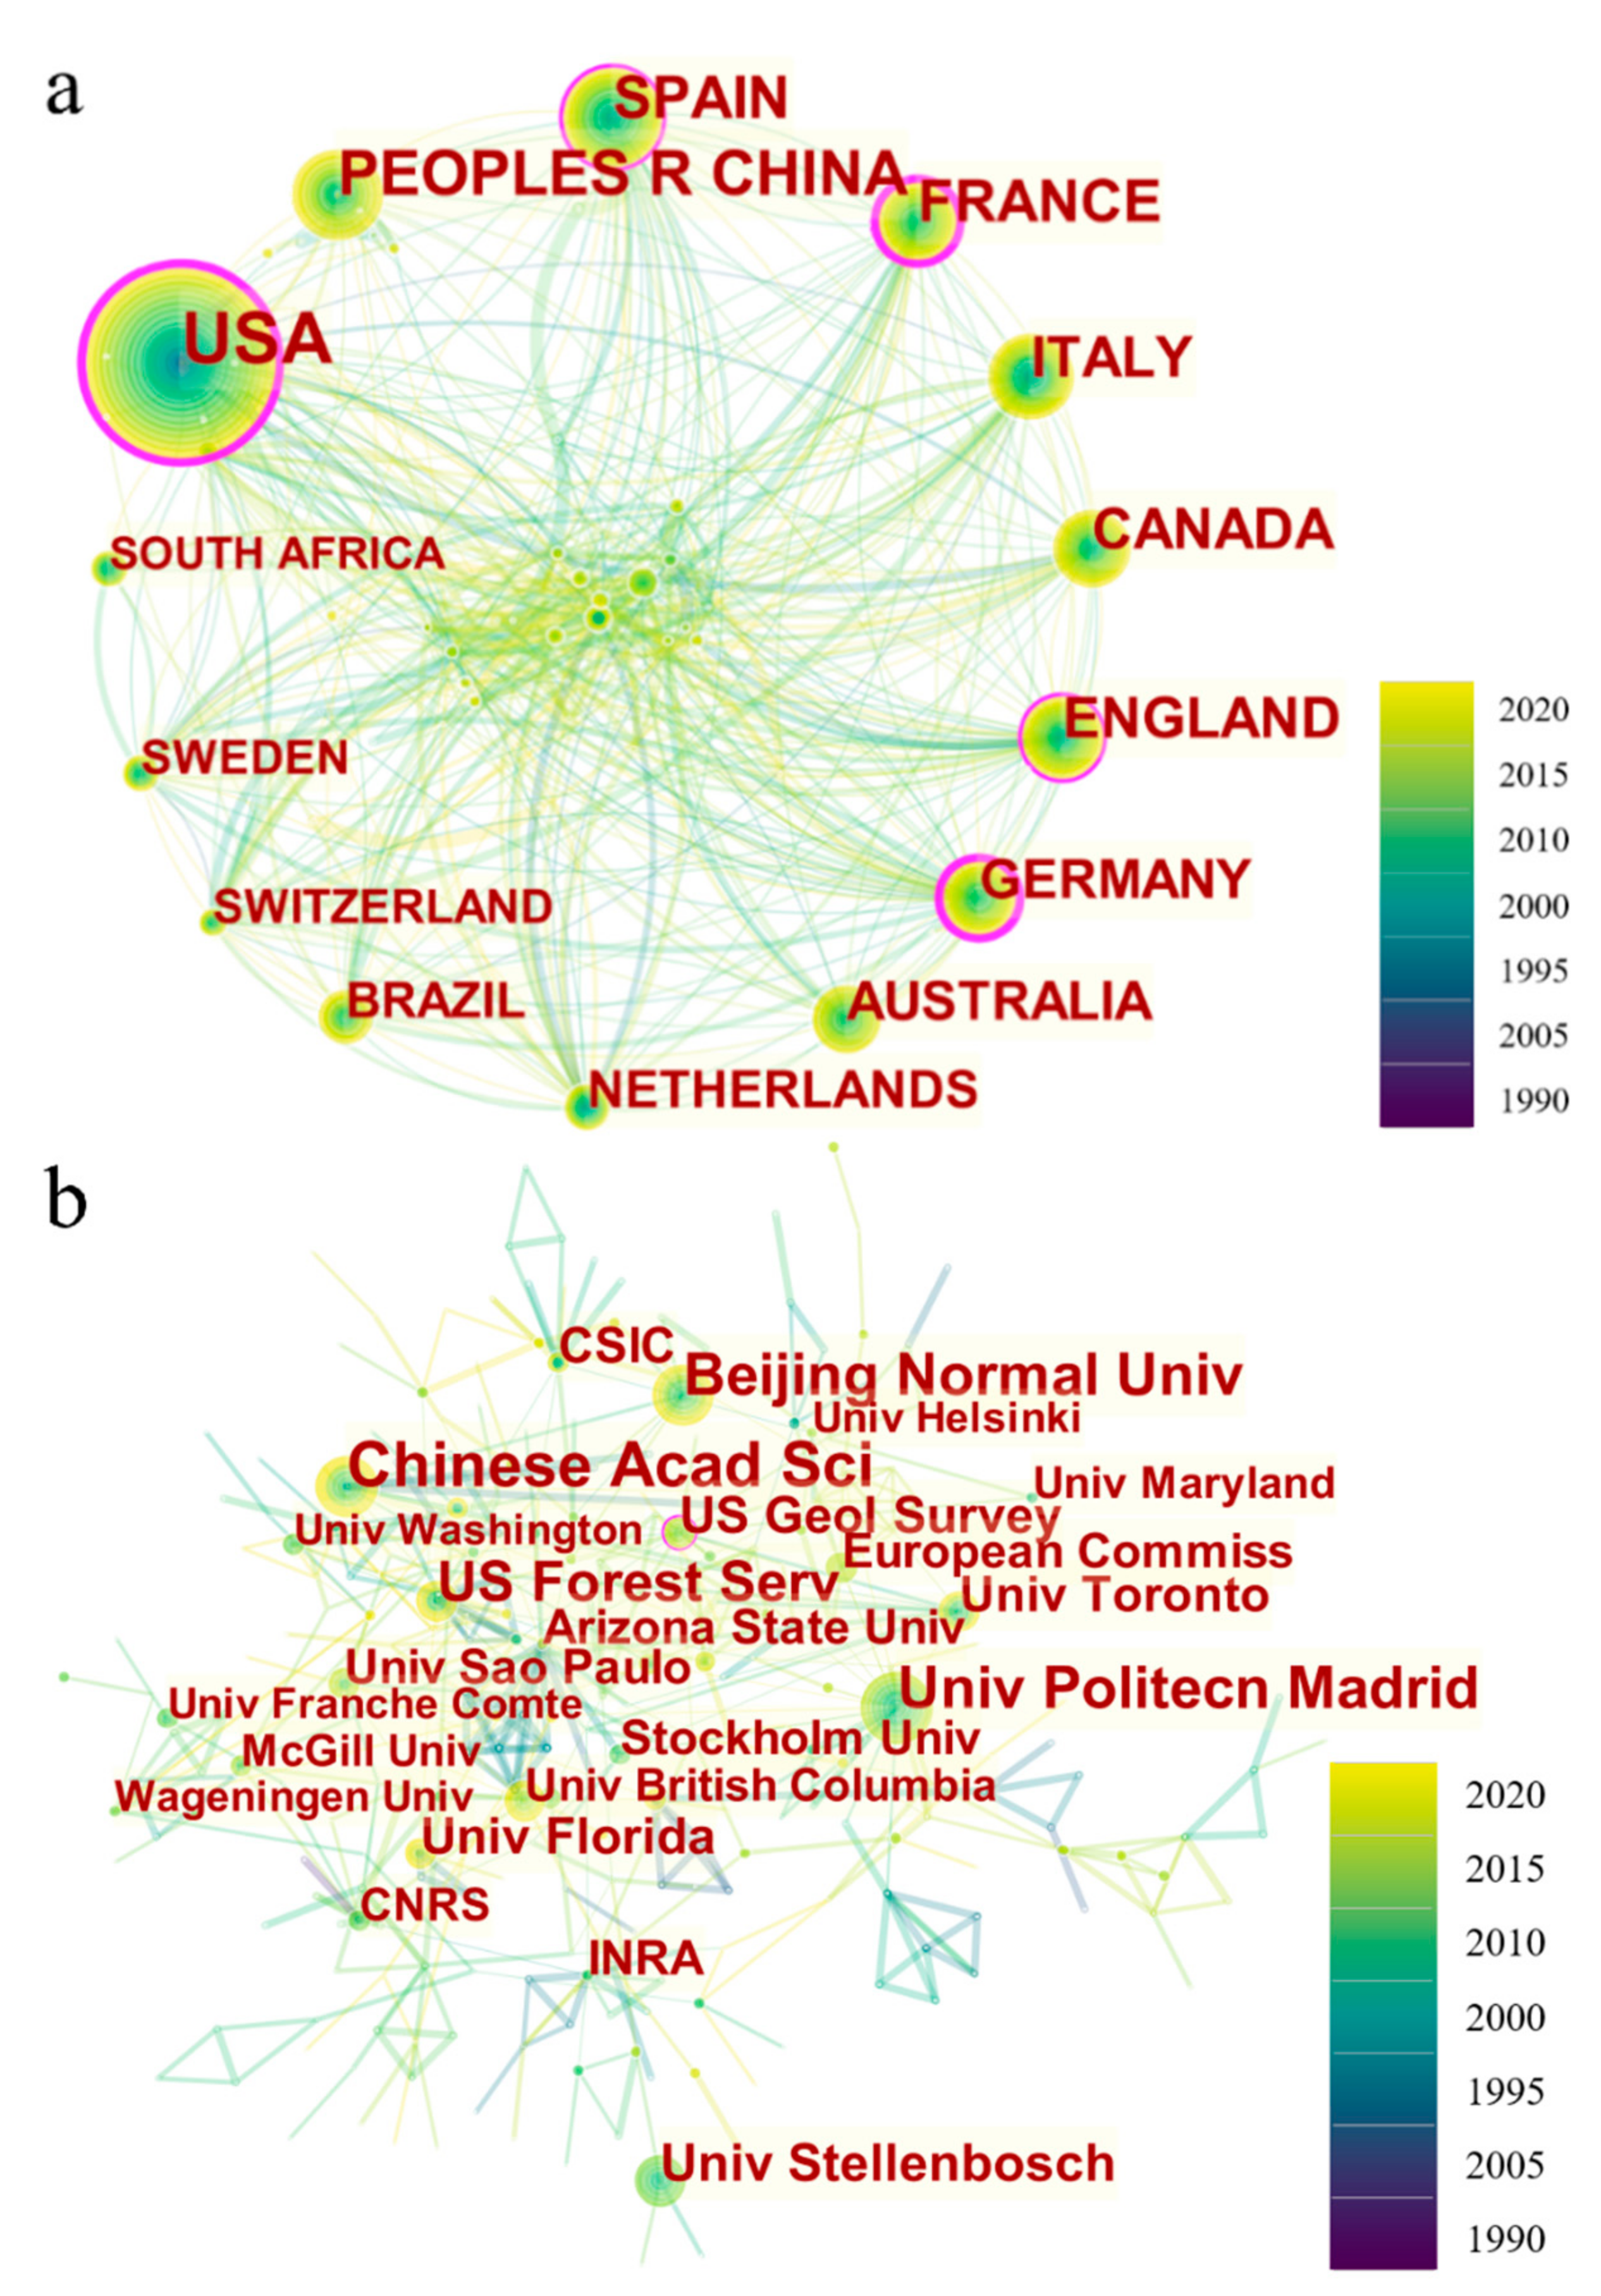
3.1.2. Distribution and Collaboration

Geographically, the publications covered 84 countries/regions and 1608 institutions, with the majority of papers distributed in North America, Europe, and East Asia (Figure 2). The USA published the most papers (387, 28.2% of the total), followed by China (171, 12.5%), France (127, 9.3%), Spain (126, 9.2%), Italy (111, 8.1%), Canada (108, 7.9%), and England (104, 7.6%), occupying 82.7% of the total publications. These countries house large numbers of universities and research institutions that have contributed significantly to EN studies. Few studies have been published in African countries (except South Africa), and many countries have no publications on ENs.
The rapid growth of worldwide attention on ENs strengthened international cooperation. Analyzing the collaborative networks among countries can identify influential countries and research institutions and their cooperative relationships. As seen from the dense lines between networks, most countries have conducted close international cooperation, indicating that EN research remains an essential topic worldwide. In addition, the countries that cooperated closely with other countries were mainly located in North America and Europe. This may be because ENs were initially considered in developed countries to reconcile biodiversity conservation with the economic development of exploited landscapes. In recent years, although developing countries have paid increasing attention to ENs to preserve biodiversity and natural resources and promote sustainable development, they still need to learn the latest technologies and methods from developed countries to plan and manage networks.
The influence of countries or institutions can be extracted by centrality, with active countries and institutions exhibiting higher centrality (Figure 3). The USA (centrality = 0.69) held a pivotal position in the national cooperation network, as it was the predominant collaborator of major producing countries, including France (centrality = 0.30) and Germany (centrality = 0.52). Both the USA and European countries have many research institutions, such as the United States Department of the Interior (count = 51), United States Geological Survey (count = 44), United States Department of Agriculture (count = 39), CNRS (France, count = 83), INRAE (France, count = 47), Wageningen University Research (Netherlands, count = 40), Universidad Politécnica de Madrid (Spain, count = 47), CSIC (Spain, count = 32), and the European Commission Joint Research Centre (count = 21). In contrast, research in China was mainly concentrated in several institutions, such as the Chinese Academy of Sciences (count = 40) and Beijing Normal University (count = 31). Overall, the collaboration network of institutions is still relatively limited at present, and no absolute leader emerged. Therefore, stronger international collaborations are needed to promote the development of this field.

3.1.3. Influential Journals

The retrieved articles were published in 334 journals. Table 1 lists the 15 journals with the highest number of articles published on EN studies. The top-ranked journal by the number of publications in the EN field was Landscape Ecology (with 126 records, 9.2% of the total), followed by Landscape and Urban Planning (69, 5.0%) and Biological Conservation (49, 3.6%). The most frequently cited journal was Landscape and Urban Planning, with 5517 total citations during the 1990–2020 period, followed by Landscape Ecology (4779). These two journals have been cited by more researchers and have contributed much to the development of research in the EN field. Although Ecology had the highest average citations (129.45), the number of publications was relatively low, with only 22 articles. The impact factor (IF) is usually used to measure the importance and influence of journals [50]. At the IF level, Ecology Letters had the highest IF (9.492), followed by Conservation Biology (6.560) and the Journal of Applied Ecology (6.528), which had an important influence on related research. However, journals with high IFs sometimes may affect the power of an article. Therefore, the h-index (h papers that have been cited at least h times) was often used to describe the impact of papers or journals within a given field [64]. Landscape Ecology and Landscape and Urban Planning were more influential than other journals because they had the highest h-index among the listed journals.

3.1.4. Subject Categories

The publication output of EN studies was distributed among 53 subject categories (Figure 4). The top three categories were Environmental Sciences and Ecology (1031 publications), Ecology (766), and Environmental Sciences (390), holding primacy for the past 30 years. ENs were originally studied in the field of environmental science and ecology. After 1995, ENs played a vital role in landscape planning and management, and some scholars applied them to urban studies, regional planning, and public administration [65,66]. Subsequently, at the beginning of the 21st century, the research covered a more comprehensive range of fields, including water resources, water biology, remote sensing, computer science, engineering, and other disciplines [45,67,68]. Today, EN studies have developed into an integrated interdisciplinary field, incorporating characteristics of the environment, ecology, geology, economics, urban planning, engineering, etc. Multidisciplinary approaches will become increasingly important in future EN studies, incorporating social, ecological, and cultural factors rather than pure natural components.
The centrality of the subjects in the above-mentioned categories showed that the gravity center revolves around Ecology (centrality = 0.54), which played an essential role in the field, followed by Environmental Sciences (centrality = 0.26) and Science and Technology—Other Topics (centrality = 0.25). Environmental Science and Ecology and Ecology were the two most significant subject categories with a high number and centrality of papers. Research in both areas has mainly focused on approaches [69], models [70], frameworks [71], and applications [48] for addressing environmental issues [63].

3.2. Knowledge Base Analysis

3.2.1. Frequent Co-Citation Literature

Key topics were analyzed based on co-citation and highly cited papers, which can reveal the knowledge structure in a given field. According to the statistics, a total of 54,214 references were cited in 1371 publications. Figure 5 shows that 15 publications were cited more than 35 times in the co-citation map. We found that connectivity is the emphasis of this field, defined as “the degree to which the landscape facilitates or impedes the movement of species and other ecological flows” [30]. Connectivity consists of two basic concepts: structural and functional connectivity [31,72]. It is a dynamic attribute of the landscape caused by disturbances and spatial and temporal variations in the landscape [8]. The challenge of designing ENs is to simultaneously satisfy the connectivity needs of multiple species at multiple spatial scales. Correa Ayram [73] discussed four topics for future connectivity research: connectivity in the context of climate change; the potential for restoration planning, modeling, and planning for land-use/cover change; and contribution to ecosystem services.
Many models and methods have been developed to measure connectivity [74]. The least-cost path (LCP) is the most widely used modeling method [73,75]. Sawyer [76] explored the strengths and limitations of the least-cost model. Other approaches include graph theory [77,78,79], landscape pattern indices [80], and circuit theory [36]. Graph theory is an abstraction of landscapes, where nodes and links represent habitat patches and specific mobility/ecological flows, respectively [81,82]. Graph theory provides a method for the whole network and individual patch levels. The associated methods are increasingly being applied to assess connectivity, simulate potential diffusion paths, and prioritize network patches for protection [72]. Circuit theory can be considered a network of nodes connected by resistors (conducting currents) and applied to graphs, providing a powerful tool for designing robust ENs. This method can still provide connectivity networks in the face of uncertain species dispersal data or shrinking habitat areas [36].
Table 2 lists the commonly used connectivity indices. The IIC [28], PC [83], and BC are increasingly popular [32]. Widely used software includes the ArcGIS spatial analysis module “cost distance” [48], Fragstats [84], Conefor Sensinode [33], Graphab [85], and Linkage Mapper [11]. Instead of depending on a single method, multiple approaches (usually two methods) are often combined to evaluate landscape structure and system function [47,86,87].

3.2.2. Co-Citation Clustering

Six main clusters were identified by clustering the cited publications to reflect the research knowledge base (Figure 6). Although the retrieved papers were published in 1990, there were insufficient publications to generate clusters until 1997. The “protected areas” (PAs) were the largest cluster (2006–2019) and contained the most cited publications, reflecting that PAs were one of the research concerns in the EN field. Studies have shown that PAs within ENs can enhance ecological functions and ecosystem services. Many countries have recognized the importance of PA connectivity and adopted ENs for national nature and biodiversity conservation, such as the Biogenetic Reserves [91], Natura 2000, and the Pan European Ecological Networks (PEEN) [25,92]. In the context of uncertain climate change and rapid urbanization, highly connected networks of PAs played an important role in biodiversity as a valuable conservation planning strategy [61]. In addition, protecting PAs requires a balance between ecological protection and economic development [43]. There is a need to improve PA connectivity as a conservation priority to support ecological sustainability and human development [93].
The “urban” cluster had a relatively long duration (2003–2010). Rapid urbanization and anthropogenic development have exacerbated the fragmentation and decreased the connectivity of urban landscapes. Protecting important areas in the urban ecological landscape and increasing connectivity is a valuable conservation strategy [43]. In most cases, an ecological network was designed with a technical procedure composed of identifying ecological sources, developing resistance surfaces [94], and extracting ecological corridors [48,95]. Some nature reserves and important ecological regions are directly regarded as ecological sources, or a comprehensive index system is constructed to select vital ecological regions [43]. Although scholars have proposed that the ecological source changes over time, the ENs in terrestrial ecosystems are still dominated by static source connections [96]. It is necessary to add temporal factors and dynamic changes to identify and evaluate the source [97]. Corridors are carriers of species movements and ecosystem service flows and are usually extracted through least-cost paths or minimum cumulative resistance (MCR) based on ecological resistance surfaces [46]. Circuit theory and morphological spatial pattern analysis (MSPA) [96,98] have been increasingly widely used in recent years. Although many node indicators have been proposed, most fail to integrate complex urban properties [99], such as social development, economic contribution, and population attractiveness. Researchers now focus on some novel physics concepts, such as network robustness, vulnerability, controllability, and resilience [7,99,100,101]. Existing studies have examined the resilience of ENs from various perspectives, such as network structure, conservation strategy, ecological security, landscape pattern, and urban planning [102,103,104]. Complex network analysis can be an effective tool for assessing network resilience by monitoring the behavior of key variables when nodes are subject to random and targeted attacks. However, the application of network analysis in ENs is insufficient.
The “landscape pattern” cluster was the last cluster to emerge (2012–2019), which to a certain extent reflects the current focus on pattern analysis in EN research. Landscape patterns play an important role in resource management and biodiversity conservation and refer to the arrangement of landscape components with different sizes and shapes [53]. There is a need to focus on the disruption of ecological processes and impacts on ecological functions, ecosystem services, and human well-being as a result of changes in landscape patterns. In addition, planning and management of ENs must fully consider the impact of human activities on landscape patterns. Quantifying landscape patterns can depict the interactions between landscape patterns and ecological processes and detect landscape dynamics and functions. Studies in this cluster include quantitative analysis [105], evolution [46], and network design and optimization [48].
“Landscape planning” (2001–2009) and “core areas” (2001–2008) had similar durations. The concept of ENs in landscape planning was developed at the beginning of the 21st century. Jongman [16] presented the theory, methodology, and practice of greenway planning. There is growing interest in designing, managing, and developing adaptive and long-term planning for connected landscapes [23,43,106]. Designing effective EN protection strategic planning from micro to macroecology perspectives is essential to ensure ecological functions and ecosystem services [107]. As a spatial planning tool targeting biodiversity and ecological connectivity, the implementation of ENs can be ensured by incorporating binding regulations into national and regional planning regulatory framework and management tools. For example, French legislation explicitly states that ENs are a planning tool. ENs first appeared in the legal framework for the Planning and Sustainable Development of the Territory of 1999. The Grenelle Environment Round Table in 2007 established the Green and Blue Network and produced a more ambitious and operational legal framework [108]. The “core areas” cluster is a key component of ENs. The identification of core areas in the initial context is important for the design and management of ENs [109]. There is a need to identify core habitat patches to improve landscape connectivity and effectively manage and plan networks [110]. Prioritization of core area conservation in practice requires multi-scale analysis using high-resolution data to identify key patches and potential priority corridors to provide initial guidance for urban planning and biodiversity conservation.

3.3. Research Hotspots and Emerging Trends

3.3.1. Keyword Co-Words

Keyword co-word network maps allow access to researching hotspots and reveal changes in the prevalence in a particular knowledge area [51]. Figure 7a shows the keywords with a frequency higher than 70, and the node size indicates the number of relevant keywords used. The top five most frequently used keywords were “landscape connectivity” (588), “conservation” (425), “biodiversity” (274), “ecological network” (236), and “landscape ecology” (174). The scope of EN research was broad, from network structure and function to planning and management, with studies addressing “biodiversity,” “pattern,” “model,” “dynamics,” “climate change,” “land use,” and “ecosystem service.” Figure 7b shows the connection between any two of the top 20 keywords. Thicker edges mean that the two topics are more co-occurring and that they are studied together more frequently. There were six research topic couples with more than 100 co-occurrences: connectivity and conservation (206), connectivity and fragmentation (136), connectivity and dispersal (112), conservation and fragmentation (109), biodiversity and conservation (108), and connectivity and graph theory (107). Four pairs were associated with connectivity. In addition, “models” (97), “corridors” (72), and “habitat patches” (60) also had high co-occurrences with connectivity. Meanwhile, “connectivity” (56) and “conservation” (57) were related to climate change. “Biodiversity conservation” (52) and “connectivity” (41) also frequently appeared in papers with management. Given that these keywords run through the development process of EN research and will be further discussed in Section 3.3.2 Term Co-Occurrence Analysis, they are not discussed here to avoid repetition.

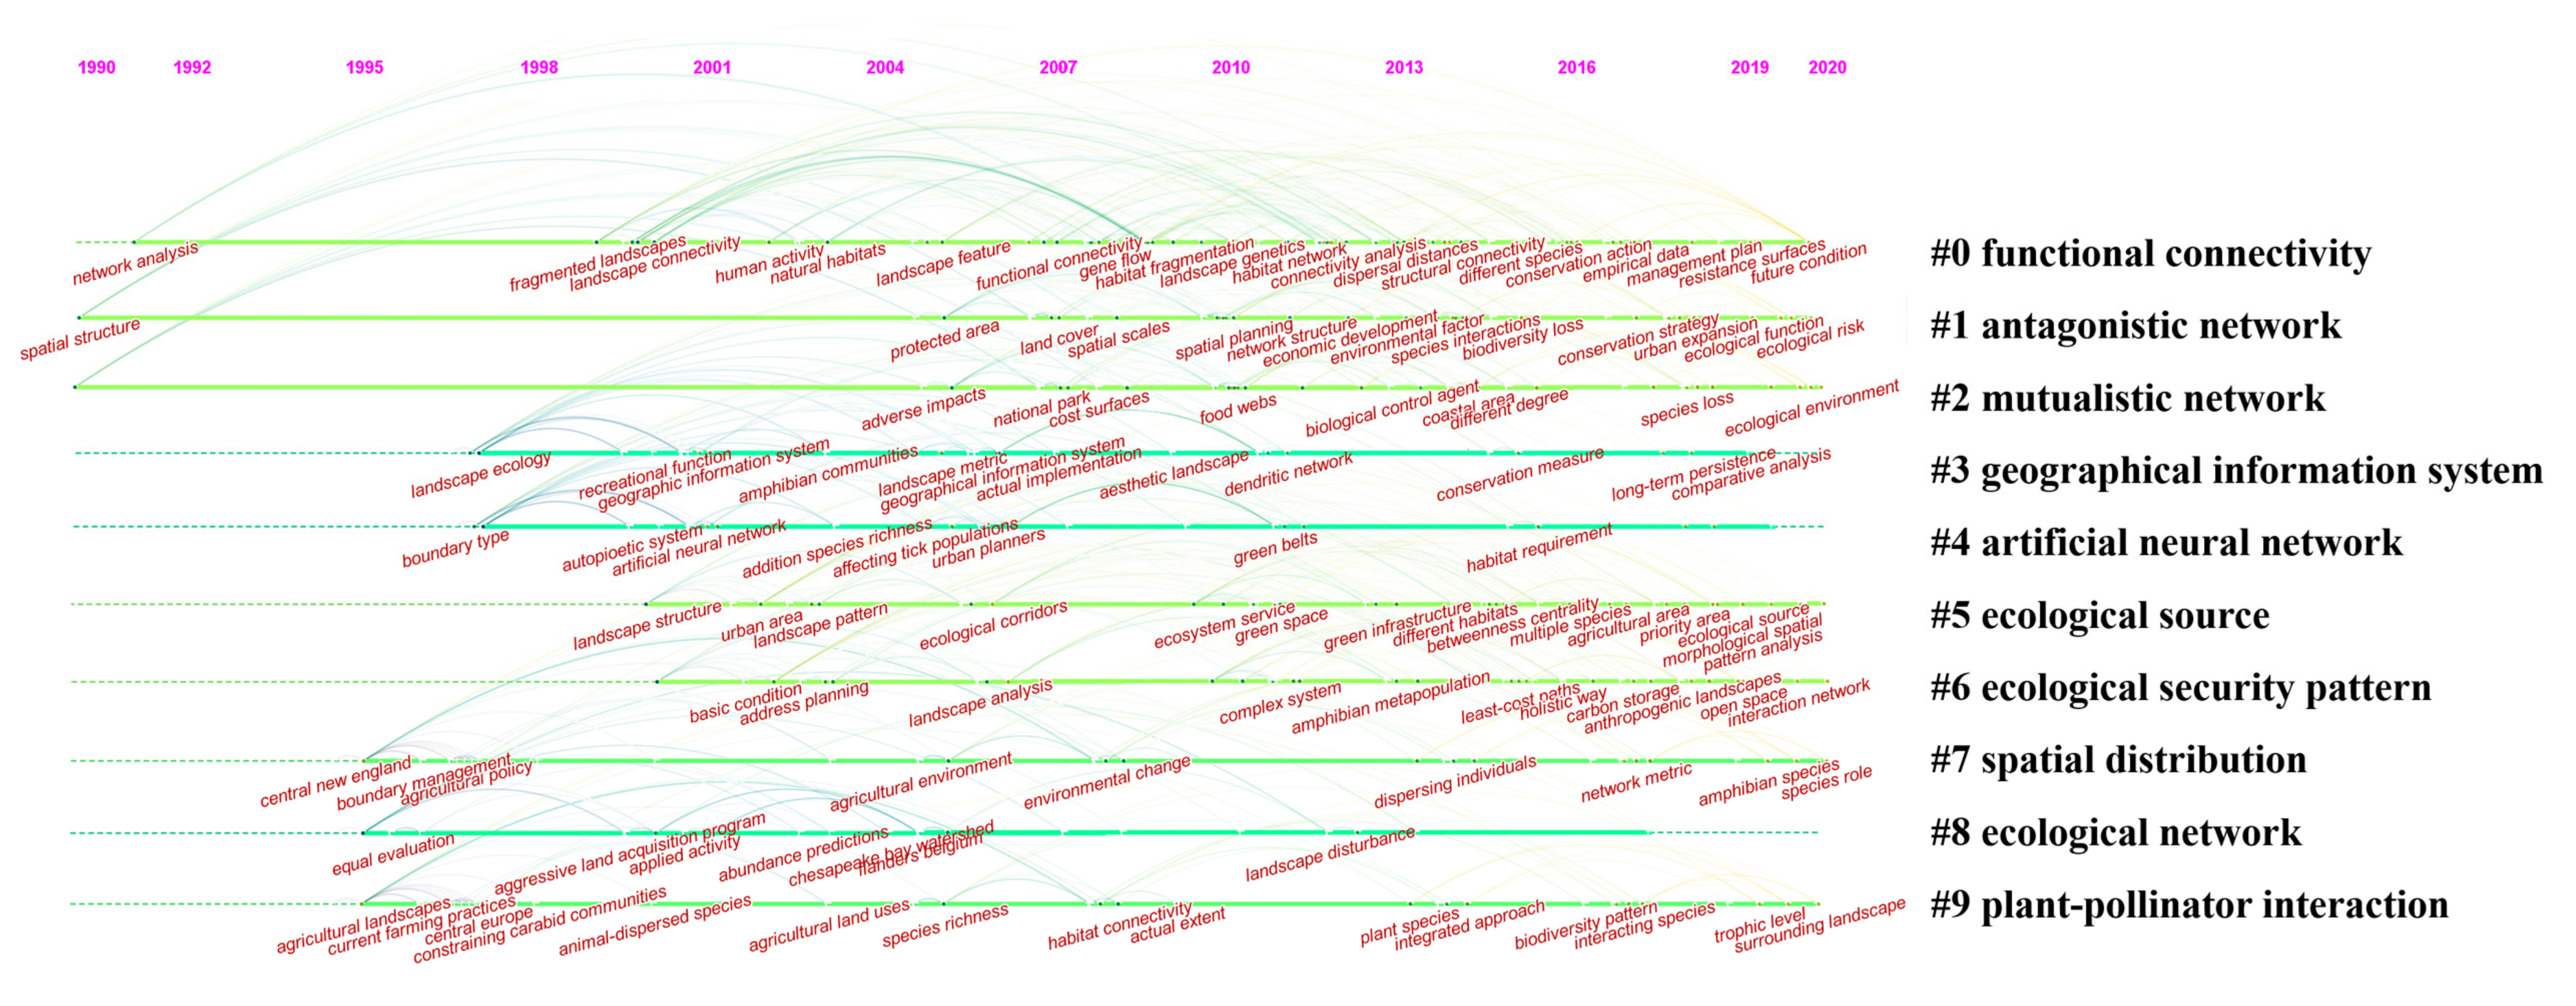
3.3.2. Term Co-Occurrence

Keyword analysis may not be sufficient to provide a comprehensive analysis of research in the field. Therefore, a term co-occurrence network analysis was performed. The temporal evolution of terminology frequency further revealed interesting terminology preferences (Table 3), which can be used to summarize the research trends from 1990 to 2020. “Habitat patches,” “biodiversity conservation,” “climate change,” and “landscape connectivity” appeared in all three periods, with frequencies increasing from 5, 4, 3, and 9 in 1990–2004 to 56, 45, 46, and 149 in 2015–2020, respectively. This profile indicated that these four terms continued to be emphasized in EN publications throughout research development. Global climate change has affected biotic interactions and ecosystem services, inevitably reducing the size or changing the structure of many species’ original habitats [5,111]. Maintaining and improving connectivity is a good way to alleviate the effects of climate change and habitat fragmentation [112]. Research on the design, quantification, and evaluation of ENs in the context of climate change remains a challenge. Large-scale Ens are important conservation strategies to address climate change risks [9]. Compared with the first stage, the terms in the second stage were “functional connectivity,” “protected area,” “network analysis,” “ecosystem service,” “habitat fragmentation,” “spatial pattern,” and “conservation planning.” After the third stage, the new terms were only “graph theory” and “human activity,” as the relevant terms were already defined in the previous two stages. Although the number of published papers continued to grow, few new terms appeared.
The top 10 major clusters were identified by clustering terms (Figure 8). The “geographical information system” and “artificial neural network” clusters had similar durations (1997–2019). The popularity and development of remote sensing, geographic information systems (GIS), and spatial modeling and technology have promoted the development of ENs. The largest cluster was “functional connectivity” (1991–2020), a term that researchers have focused on more than structural connectivity. “Antagonistic networks” and “mutualistic networks” represented the two main groups studied by ENs, each with of which had its own historical tradition [113].
“Spatial distribution” was a cluster with a long duration (1996–2020). The impacts of human activities on ENs have produced complex ecological and social consequences on different spatial scales. Changes in connectivity at spatial scales will threaten regional biodiversity and ecosystem services [106]. Therefore, priority needs to be given to the connectivity and spatial interactions between landscape elements. Conservation planning has shifted toward planning and protecting large-scale spatial ecological networks (SENs). Existing theoretical and empirical knowledge provides a framework for designing large-scale SENs [14]. The objectives of the SEN have been expanded to include socio-ecological criteria, including the sustainability of ecosystem services and their resilience to environmental change.
The “ecological security patterns” (ESPs) [95] had the same duration as the “ecological sources” cluster (2000–2020). Rapid urbanization directly affected urban landscape patterns and ecological sustainability and pressured biodiversity conservation, making ecological security a priority in regional landscape ecology. ESPs are considered to be the implementation of ecosystem-based management in landscape ecology and urban planning to ensure ecosystem security and sustainable development [114]. The concept of ESP refers to elements that are essential to maintaining the safety of landscape ecology (e.g., ecological sources and corridors), of which sources are essential for identifying ESPs and ensuring urban ecological security. However, the selection of ecological sources and the evaluation methods of resistance surfaces in the construction of ESPs are not yet complete, and further research is needed in the future [115]. Ecological corridors are heterogeneous in location and function, so determining priority corridors is particularly useful for conservation planners and policymakers. On the basis of identifying priority corridors, conservation measures can be dynamically adjusted and effective policies can be formulated to rationally allocate resources, thus avoiding over-investment in ecological construction projects.

4. Conclusions and Future Prospects

Recognizing the great potential of ENs in nature conservation, we developed an overview of global EN research over the past three decades. A total of 1371 publications in 53 subject categories were collected and studied with bibliometric methods and CiteSpace.
An increasing research interest in ENs was observed by a temporal trend analysis of all publications, which has been growing at an annually averaged rate of 18.9%. Remarkable progress has been made in EN studies, especially since 2005, during which 91.3% of the collected papers were published. Up to 2020, 84 countries/regions and 1516 institutions worldwide were involved in studies on ENs, while the research fields of Ens expanded from early environmental science and ecology to current multidisciplinary status involving environmental science, ecology, geology, regional and urban planning, and public administration. Multidisciplinary approaches have been increasingly used to tackle more complex interplays among economic, social, ecological, and cultural factors in studying ENs in areas with high-intensity human activities. A majority of the publications were authored by researchers in the USA (387, 20.7%), China (171, 12.5%), France (127, 9.3%), Spain (126, 9.2%), Italy (111, 8.1%), Canada (108, 7.9%), and England (104, 7.6%). Notably, more than 20% of the papers were published in Landscape Ecology (126, 9.2%), Landscape and Urban Planning (69, 5.0%), Biological Conservation (49, 3.6%), and the Journal of Applied Ecology (34, 2.5%), among which the first two journals had the greatest number of citations (4779 and 5517, respectively) and the highest h-index scores (33 and 34, respectively).
Connectivity is the emphasis of the EN field, which concentrates on quantifying connectivity, identifying priority areas, and integrating conservation planning. Many models, methods, and indices have been developed to measure connectivity. Global climate change has affected ecological functions and ecosystem services, so the simulation and assessment of connectivity should consider the potential impacts of human activity intensity and climate change. In addition, as landscape heterogeneity and changes in connectivity at spatial scales will affect regional ecological functions and ecosystem services, connectivity and spatial interactions between landscape elements need to be prioritized. Since 2005, landscape fragmentation has become a hotspot for studying the impacts of urban expansion and population concentration on natural habitats or biodiversity in urbanized areas. Building ENs has become a preferred option to prevent anticipated losses and the degradation of biodiversity or ecological services due to drastic changes in land use. In the context of uncertain climate change and rapid urbanization, there is a need to focus on improving urban landscape connectivity as a conservation priority to support ecological sustainability and human development. In addition, it is an emerging trend to combine multiple methods to identify ecological sources and build and optimize ecological networks.
EN research has yielded many achievements in theoretical analysis, methodological approaches, and case studies. Based on the findings and discussions, we propose the following future research directions to provide researchers with new insights, including spatiotemporal changes of ecological sources, the resilience of ENs, the construction of ENs in urban agglomerations, the coupling of natural and socio-economic systems, and ecological network management.
(1)
Building ENs by investigating spatiotemporal changes of the ecological sources can provide a deeper insight into their heterogeneity, internal mechanism, and even resilience in coping with climate change effects. Existing studies suggest that ecological sources change over time. However, the current construction of ENs is mainly based on static connections, and there are few practices to evaluate the dynamic changes of sources. Thus, monitoring and assessing the dynamics of ecological sources in terrestrial ecosystems is necessary to stabilize the structure of ENs. New models and methods must also be developed to quantify dynamic processes and integrate dynamics into the planning or construction of ENs.
(2)
To maintain ecological functions and landscape sustainability, it is necessary to sufficiently stabilize the structure and function of ENs to enhance the adaptability to disturbances and stresses. Resilience is an essential property of ENs, referring to the ability to remain stable and still function in the face of disturbances. If the resilience of ENs is ignored, ecological sources may not be able to sustain ecosystem services when the system is disturbed. The state of the ecological source determines the stability of the EN structure, which is particularly important for the resilience of ENs. Therefore, more research should be conducted on enhancing the resilience of ENs by investigating spaciotemporal changes in the sources and improving the dynamic evaluation of ENs.
(3)
Most developing countries are experiencing rapid urbanization with a high intensity of urban expansion and population concentration. Habitat isolation has become a major challenge for urban development. A recent hotspot is to study the landscape fragmentation effects on natural habitats or biodiversity under land-use changes in urbanized areas. Future studies on ENs could be extended from urbanized areas to urban agglomerations, which have a high level of urbanization and population size. Building ENs in urban agglomerations can mitigate land-use change and landscape fragmentation caused by cross-regional urban expansion, enhance the spatial connectivity between landscapes and habitat patches, and promote regional cooperation in improving biodiversity loss and ecosystem services.
(4)
Landscape sustainability requires balancing regional ecosystem conservation and socio-economic development, such as biodiversity conservation and infrastructure construction. Therefore, researchers need to explore the coupling of natural and socio-economic systems to gain insights into the relationship between nature and socio-economic or other systems. Understanding how the interaction of economic, social, ecological, and cultural factors influences urban landscape patterns is important for achieving sustainability in urbanized areas. This trend has prompted researchers to further consider complex urban properties (such as economic growth, population agglomeration, and social equity) and pay close attention to the natural and socio-economic factors and their complex interaction within the system.
(5)
ENs are a tool to improve landscape management for conservation. Research on integrated EN management is needed to maximize biodiversity conservation or ecosystem services, which emphasizes the integration of transdisciplinary knowledge, methods, and multi-source data. EN management should be combined with national or regional policy objectives (e.g., Convention on Biological Diversity). There is also a challenge to integrating the management of ENs into planning (e.g., spatial planning or landscape planning) to achieve sustainable landscapes. In addition, developing ENs with diverse stakeholders can ensure relevance to the local contexts, values, and interests. Such a participatory approach may help reconstruct a more positive relationship between humans and nature, especially in dealing with the challenges of sustainable land use under climate change.
The network is inherently difficult to understand due to (1) structural complexity, (2) dynamical complexity, (3) connection diversity, (4) node diversity, (5) network evolution, etc. [116], which make this paper inevitably contain some shortcomings. Besides, compared with the traditional reviews from experts, this article based on CiteSpace analysis also has some limitations due to the software itself. For example, the cluster can only be found on keywords, topics, and abstracts but not complete context analysis. However, the CiteSpace research and development team has continuously been revising the software, so this software will undoubtedly overcome these drawbacks and present a more accurate and profound knowledge domain in the future.

Author Contributions

Conceptualization, W.L. and Z.L.; methodology, Z.L. and Y.W.; software, Z.L. and Y.W.; validation, Z.L. and S.Z.; formal analysis, Z.L.; investigation, Z.L.; resources, Z.L.; data curation, Z.L. and S.Z.; writing—original draft preparation, Z.L.; writing—review and editing, Z.L. and W.L.; visualization, Z.L.; supervision, W.L.; project administration, W.L. All authors have read and agreed to the published version of the manuscript.

Funding

This research was funded by the Natural Science Foundation of China (grant No. 72050001), Second Tibetan Plateau Scientific Expedition and Research Program (2019QZKK0307).

Conflicts of Interest

The authors declare no conflict of interest.

References

  1. United Nations. Take Action for the Sustainable Development Goals. Available online:https://www.un.org/sustainabledevelopment/sustainable-development-goals/ (accessed on 15 January 2022).
  2. He, C.; Liu, Z.; Tian, J.; Ma, Q. Urban expansion dynamics and natural habitat loss in China: A multiscale landscape perspective. Glob. Chang. Biol. 2014, 20, 2886–2902. [Google Scholar] [CrossRef] [PubMed]
  3. Laurance, W.F.; Sayer, J.; Cassman, K.G. Agricultural expansion and its impacts on tropical nature. Trends Ecol. Evol. 2014, 29, 107–116. [Google Scholar] [CrossRef] [PubMed]
  4. Newbold, T.; Hudson, L.N.; Arnell, A.P.; Contu, S.; De Palma, A.; Ferrier, S.; Hill, S.L.; Hoskins, A.J.; Lysenko, I.; Phillips, H.R.; et al. Has land use pushed terrestrial biodiversity beyond the planetary boundary? A global assessment. Science 2016, 353, 288–291. [Google Scholar] [CrossRef] [PubMed]
  5. Synes, N.W.; Ponchon, A.; Palmer, S.C.F.; Osborne, P.E.; Bocedi, G.; Travis, J.M.J.; Watts, K. Prioritising conservation actions for biodiversity: Lessening the impact from habitat fragmentation and climate change. Biol. Conserv. 2020, 252, 108819. [Google Scholar] [CrossRef]
  6. Haddad, N.M.; Brudvig, L.A.; Clobert, J.; Davies, K.F.; Gonzalez, A.; Holt, R.D.; Lovejoy, T.E.; Sexton, J.O.; Austin, M.P.; Collins, C.D.; et al. Habitat fragmentation and its lasting impact on Earth’s ecosystems. Sci. Adv. 2015, 1, e1500052. [Google Scholar] [CrossRef] [Green Version]
  7. Ahern, J. Urban landscape sustainability and resilience: The promise and challenges of integrating ecology with urban planning and design. Landsc. Ecol. 2013, 28, 1203–1212. [Google Scholar] [CrossRef]
  8. Baguette, M.; Blanchet, S.; Legrand, D.; Stevens, V.M.; Turlure, C. Individual dispersal, landscape connectivity and ecological networks. Biol. Rev. Camb. Philos. Soc. 2013, 88, 310–326. [Google Scholar] [CrossRef]
  9. Opdam, P.; Wascher, D. Climate change meets habitat fragmentation: Linking landscape and biogeographical scale levels in research and conservation. Biol. Conserv. 2004, 117, 285–297. [Google Scholar] [CrossRef]
  10. Su, J.; Yin, H.; Kong, F. Ecological networks in response to climate change and the human footprint in the Yangtze River Delta urban agglomeration, China. Landsc. Ecol. 2020, 36, 2095–2112. [Google Scholar] [CrossRef]
  11. Beier, P.; Spencer, W.; Baldwin, R.F.; McRae, B.H. Toward best practices for developing regional connectivity maps. Conserv. Biol. 2011, 25, 879–892. [Google Scholar] [CrossRef]
  12. Jongman, R.H.G.; Kulvik, M.; Kristiansen, I. European ecological networks and greenways. Landsc. Urban Plan. 2004, 68, 305–319. [Google Scholar] [CrossRef]
  13. Linehan, J.; Gross, M.; Finn, J. Greenway Planning—Developing a Landscape Ecological Network Approach. Landsc. Urban Plan. 1995, 33, 179–193. [Google Scholar] [CrossRef]
  14. Opdam, P.; Steingrover, E.; van Rooij, S. Ecological networks: A spatial concept for multi-actor planning of sustainable landscapes. Landsc. Urban Plan. 2006, 75, 322–332. [Google Scholar] [CrossRef]
  15. Saura, S.; Rubio, L. A common currency for the different ways in which patches and links can contribute to habitat availability and connectivity in the landscape. Ecography 2010, 33, 523–537. [Google Scholar] [CrossRef]
  16. Jongman, R.H.G. Nature Conservation Planning in Europe—Developing Ecological Networks. Landsc. Urban Plan. 1995, 32, 169–183. [Google Scholar] [CrossRef]
  17. Jongman, R.H.G. Ecological networks are an issue for all of us. J. Landsc. Ecol. 2008, 1, 7–13. [Google Scholar] [CrossRef] [Green Version]
  18. Opdam, P.; Foppen, R.; Reijnen, R.; Schotman, A. The Landscape Ecological Approach in Bird Conservation—Integrating the Metapopulation Concept into Spatial Planning. J. Landsc. Ecol. 1995, 137, S139–S146. [Google Scholar] [CrossRef]
  19. Beier, P.; Noss, R.F. Do Habitat Corridors Provide Connectivity? Conserv. Biol. 1998, 12, 1241–1252. [Google Scholar] [CrossRef]
  20. Jordan, F.; Baldi, A.; Orci, K.M.; Racz, I.; Varga, Z. Characterizing the importance of habitat patches and corridors in maintaining the landscape connectivity of a Pholidoptera transsylvanica (Orthoptera) metapopulation. Landsc. Ecol. 2003, 18, 83–92. [Google Scholar] [CrossRef]
  21. Sepp, K.; Palang, H.; Mander, U.; Kaasik, A. Prospects for nature and landscape protection in Estonia. Landsc. Urban Plan. 1999, 46, 161–167. [Google Scholar] [CrossRef]
  22. Bennett, G.; Mulongoy, K. Review of Experience with Ecological Networks, Corridors and Buffer Zones; Secretariat of the Convention on Biological Diversity: Montreal, QC, Canada, 2006. [Google Scholar]
  23. Gurrutxaga, M.; Lozano, P.J.; del Barrio, G. GIS-based approach for incorporating the connectivity of ecological networks into regional planning. J. Nat. Conserv. 2010, 18, 318–326. [Google Scholar] [CrossRef]
  24. Boitani, L.; Falcucci, A.; Maiorano, L.; Rondinini, C. Ecological networks as conceptual frameworks or operational tools in conservation. Conserv. Biol. 2007, 21, 1414–1422. [Google Scholar] [CrossRef] [PubMed]
  25. Jongman, R.H.G.; Bouwma, I.M.; Griffioen, A.; Jones-Walters, L.; Van Doorn, A.M. The Pan European Ecological Network: PEEN. Landsc. Ecol. 2011, 26, 311–326. [Google Scholar] [CrossRef]
  26. Fabos, J.G. Introduction and Overview—The Greenway Movement, Uses and Potentials of Greenways. Landsc. Urban Plan. 1995, 33, 1–13. [Google Scholar] [CrossRef]
  27. Minor, E.S.; Urban, D.L. A graph-theory framework for evaluating landscape connectivity and conservation planning. Conserv. Biol. 2008, 22, 297–307. [Google Scholar] [CrossRef]
  28. Pascual-Hortal, L.; Saura, S. Comparison and development of new graph-based landscape connectivity indices: Towards the priorization of habitat patches and corridors for conservation. Landsc. Ecol. 2006, 21, 959–967. [Google Scholar] [CrossRef]
  29. Ricotta, C.; Stanisci, A.; Avena, G.C.; Blasi, C. Quantifying the network connectivity of landscape mosaics: A graph-theoretical approach. Community Ecol. 2000, 1, 89–94. [Google Scholar] [CrossRef]
  30. Taylor, P.D.; Fahrig, L.; Henein, K.; Merriam, G. Connectivity Is a Vital Element of Landscape Structure. Oikos 1993, 68, 571–573. [Google Scholar] [CrossRef] [Green Version]
  31. Tischendorf, L.; Fahrig, L. How should we measure landscape connectivity? Landsc. Ecol. 2000, 15, 633–641. [Google Scholar] [CrossRef]
  32. Baranyi, G.; Saura, S.; Podani, J.; Jordan, F. Contribution of habitat patches to network connectivity: Redundancy and uniqueness of topological indices. Ecol. Indic. 2011, 11, 1301–1310. [Google Scholar] [CrossRef]
  33. Saura, S.; Torne, J. Conefor Sensinode 2.2: A software package for quantifying the importance of habitat patches for landscape connectivity. Environ. Model. Softw. 2009, 24, 135–139. [Google Scholar] [CrossRef]
  34. Bodin, O.; Saura, S. Ranking individual habitat patches as connectivity providers: Integrating network analysis and patch removal experiments. Ecol. Modell. 2010, 221, 2393–2405. [Google Scholar] [CrossRef]
  35. Leibold, M.A.; Holyoak, M.; Mouquet, N.; Amarasekare, P.; Chase, J.M.; Hoopes, M.F.; Holt, R.D.; Shurin, J.B.; Law, R.; Tilman, D.; et al. The metacommunity concept: A framework for multi-scale community ecology. Ecol. Lett. 2004, 7, 601–613. [Google Scholar] [CrossRef]
  36. McRae, B.H.; Dickson, B.G.; Keitt, T.H.; Shah, V.B. Using circuit theory to model connectivity in ecology, evolution, and conservation. Ecology 2008, 89, 2712–2724. [Google Scholar] [CrossRef] [PubMed]
  37. Gippoliti, S.; Battisti, C. More cool than tool: Equivoques, conceptual traps and weaknesses of ecological networks in environmental planning and conservation. Land Use Policy 2017, 68, 686–691. [Google Scholar] [CrossRef]
  38. Van Der Windt, H.J.; Swart, J.A.A. Ecological corridors, connecting science and politics: The case of the Green River in the Netherlands. J. Appl. Ecol. 2007, 45, 124–132. [Google Scholar] [CrossRef] [Green Version]
  39. Cook, E.A. Landscape structure indices for assessing urban ecological networks. Landsc. Urban Plan. 2002, 58, 269–280. [Google Scholar] [CrossRef]
  40. Damschen, E.I.; Haddad, N.M.; Orrock, J.L.; Tewksbury, J.J.; Levey, D.J. Corridors increase plant species richness at large scales. Science 2006, 313, 1284–1286. [Google Scholar] [CrossRef] [Green Version]
  41. Samways, M.J.; Pryke, J.S. Large-scale ecological networks do work in an ecologically complex biodiversity hotspot. Ambio 2016, 45, 161–172. [Google Scholar] [CrossRef] [Green Version]
  42. Noss, R.F.; Quigley, H.B.; Hornocker, M.G.; Merrill, T.; Paquet, P.C. Conservation biology and carnivore conservation in the Rocky Mountains. Conserv. Biol. 1996, 10, 949–963. [Google Scholar] [CrossRef]
  43. Liang, J.; He, X.; Zeng, G.; Zhong, M.; Gao, X.; Li, X.; Li, X.; Wu, H.; Feng, C.; Xing, W.; et al. Integrating priority areas and ecological corridors into national network for conservation planning in China. Sci. Total Environ. 2018, 626, 22–29. [Google Scholar] [CrossRef] [PubMed]
  44. Auffret, A.G.; Plue, J.; Cousins, S.A. The spatial and temporal components of functional connectivity in fragmented landscapes. Ambio 2015, 44, S51–S59. [Google Scholar] [CrossRef] [PubMed] [Green Version]
  45. Fan, X.; Zhou, B.; Wang, H.H.X. Urban Landscape Ecological Design and Stereo Vision Based on 3D Mesh Simplification Algorithm and Artificial Intelligence. Neural Process. Lett. 2021, 53, 2421–2437. [Google Scholar] [CrossRef]
  46. Dong, J.H.; Dai, W.T.; Shao, G.Q.; Xu, J.R. Ecological Network Construction Based on Minimum Cumulative Resistance for the City of Nanjing, China. ISPRS Int. J. Geo-Inf. 2015, 4, 2045–2060. [Google Scholar] [CrossRef] [Green Version]
  47. An, Y.; Liu, S.; Sun, Y.; Shi, F.; Beazley, R. Construction and optimization of an ecological network based on morphological spatial pattern analysis and circuit theory. Landsc. Ecol. 2020, 36, 2059–2076. [Google Scholar] [CrossRef]
  48. Cui, L.; Wang, J.; Sun, L.; Lv, C.D. Construction and optimization of green space ecological networks in urban fringe areas: A case study with the urban fringe area of Tongzhou district in Beijing. J. Clean Prod. 2020, 276, 124266. [Google Scholar] [CrossRef]
  49. Lee, D.; Oh, K. The Green Infrastructure Assessment System (GIAS) and Its Applications for Urban Development and Management. Sustainability 2019, 11, 3798. [Google Scholar] [CrossRef] [Green Version]
  50. Li, W.; Zhao, Y. Bibliometric analysis of global environmental assessment research in a 20-year period. Environ. Impact Assess. Rev. 2015, 50, 158–166. [Google Scholar] [CrossRef]
  51. Ouyang, W.; Wang, Y.; Lin, C.; He, M.; Hao, F.; Liu, H.; Zhu, W. Heavy metal loss from agricultural watershed to aquatic system: A scientometrics review. Sci. Total Environ. 2018, 637–638, 208–220. [Google Scholar] [CrossRef]
  52. Wang, X.J.; Zhang, Y.; Zhang, J.; Fu, C.L.; Zhang, X.L. Progress in urban metabolism research and hotspot analysis based on CiteSpace analysis. J. Clean Prod. 2021, 281, 125224. [Google Scholar] [CrossRef]
  53. Chen, C.M. An information-theoretic view of visual analytics. IEEE Comput. Graph. Appl. 2008, 28, 18–23. [Google Scholar] [CrossRef] [PubMed]
  54. Chen, C.M. CiteSpace II: Detecting and visualizing emerging trends and transient patterns in scientific literature. JASIS 2006, 57, 359–377. [Google Scholar] [CrossRef] [Green Version]
  55. Chen, C.M.; Ibekwe-SanJuan, F.; Hou, J.H. The Structure and Dynamics of Cocitation Clusters: A Multiple-Perspective Cocitation Analysis. JASIS 2010, 61, 1386–1409. [Google Scholar] [CrossRef] [Green Version]
  56. Chen, C.M.; Dubin, R.; Kim, M.C. Emerging trends and new developments in regenerative medicine: A scientometric update (2000–2014). Expert Opin. Biol. Ther. 2014, 14, 1295–1317. [Google Scholar] [CrossRef] [PubMed] [Green Version]
  57. Li, M.N.; Porter, A.L.; Wang, Z.L. Evolutionary trend analysis of nanogenerator research based on a novel perspective of phased bibliographic coupling. Nano Energy 2017, 34, 93–102. [Google Scholar] [CrossRef]
  58. Freeman, L.C. Centrality in Social Networks Conceptual Clarification. Soc. Netw. 1979, 1, 215–239. [Google Scholar] [CrossRef] [Green Version]
  59. Sole, R.V.; Montoya, J.M. Complexity and fragility in ecological networks. Proc. Biol. Sci. 2001, 268, 2039–2045. [Google Scholar] [CrossRef]
  60. Jalkanen, J.; Toivonen, T.; Moilanen, A. Identification of ecological networks for land-use planning with spatial conservation prioritization. Landsc. Ecol. 2020, 35, 353–371. [Google Scholar] [CrossRef] [Green Version]
  61. Saura, S.; Bertzky, B.; Bastin, L.; Battistella, L.; Mandrici, A.; Dubois, G. Protected area connectivity: Shortfalls in global targets and country-level priorities. Biol. Conserv. 2018, 219, 53–67. [Google Scholar] [CrossRef]
  62. Serret, H.; Raymond, R.; Foltete, J.C.; Clergeau, P.; Simon, L.; Machon, N. Potential contributions of green spaces at business sites to the ecological network in an urban agglomeration: The case of the Ile-de-France region, France. Landsc. Urban Plan. 2014, 131, 27–35. [Google Scholar] [CrossRef]
  63. Samways, M.J.; Bazelet, C.S.; Pryke, J.S. Provision of ecosystem services by large scale corridors and ecological networks. Biodivers. Conserv. 2010, 19, 2949–2962. [Google Scholar] [CrossRef]
  64. Hirsch, J.E. An index to quantify an individual’s scientific research output. Proc. Natl. Acad. Sci. USA 2005, 102, 16569–16572. [Google Scholar] [CrossRef] [PubMed] [Green Version]
  65. Ahern, J. From fail-safe to safe-to-fail: Sustainability and resilience in the new urban world. Landsc. Urban Plan. 2011, 100, 341–343. [Google Scholar] [CrossRef] [Green Version]
  66. Kong, F.H.; Yin, H.W.; Nakagoshi, N.; Zong, Y.G. Urban green space network development for biodiversity conservation: Identification based on graph theory and gravity modeling. Landsc. Urban Plan. 2010, 95, 16–27. [Google Scholar] [CrossRef]
  67. Cui, B.S.; Zhang, Z.M.; Lei, X.X. Implementation of Diversified Ecological Networks to Strengthen Wetland Conservation. Clean-Soil Air Water 2012, 40, 1015–1026. [Google Scholar] [CrossRef]
  68. Singh, J.S.; Roy, P.S.; Murthy, M.S.R.; Jha, C.S. Application of Landscape Ecology and Remote Sensing for Assessment, Monitoring and Conservation of Biodiversity. J. Indian Soc. Remote Sens. 2010, 38, 365–385. [Google Scholar] [CrossRef]
  69. Bourdouxhe, A.; Duflot, R.; Radoux, J.; Dufrene, M. Comparison of methods to model species habitat networks for decision-making in nature conservation: The case of the wildcat in southern Belgium. J. Nat. Conserv. 2020, 58, 125901. [Google Scholar] [CrossRef]
  70. Peterson, E.E.; Hanks, E.M.; Hooten, M.B.; Ver Hoef, J.M.; Fortin, M.J. Spatially structured statistical network models for landscape genetics. Ecol. Monogr. 2019, 89, 1355. [Google Scholar] [CrossRef] [Green Version]
  71. Khoroshev, A. Landscape-Ecological Approach to Spatial Planning as a Tool to Minimize Socio-Ecological Conflicts: Case Study of Agrolandscape in the Taiga Zone of Russia. Land 2020, 9, 192. [Google Scholar] [CrossRef]
  72. Rayfield, B.; Fortin, M.J.; Fall, A. Connectivity for conservation: A framework to classify network measures. Ecology 2011, 92, 847–858. [Google Scholar] [CrossRef]
  73. Ayram, C.A.C.; Mendoza, M.E.; Etter, A.; Salicrup, D.R.P. Habitat connectivity in biodiversity conservation: A review of recent studies and applications. Prog. Phys. Geogr.-Earth Environ. 2016, 40, 7–37. [Google Scholar] [CrossRef]
  74. Marulli, J.; Mallarach, J.M. A GIS methodology for assessing ecological connectivity: Application to the Barcelona Metropolitan Area. Landsc. Urban Plan. 2005, 71, 243–262. [Google Scholar] [CrossRef]
  75. Adriaensen, F.; Chardon, J.P.; De Blust, G.; Swinnen, E.; Villalba, S.; Gulinck, H.; Matthysen, E. The application of ‘least-cost’ modelling as a functional landscape model. Landsc. Urban Plan. 2003, 64, 233–247. [Google Scholar] [CrossRef]
  76. Sawyer, S.C.; Epps, C.W.; Brashares, J.S. Placing linkages among fragmented habitats: Do least-cost models reflect how animals use landscapes? J. Appl. Ecol. 2011, 48, 668–678. [Google Scholar] [CrossRef]
  77. Bunn, A.G.; Urban, D.L.; Keitt, T.H. Landscape connectivity: A conservation application of graph theory. J. Environ. Manag. 2000, 59, 265–278. [Google Scholar] [CrossRef] [Green Version]
  78. Galpern, P.; Manseau, M.; Fall, A. Patch-based graphs of landscape connectivity: A guide to construction, analysis and application for conservation. Biol. Conserv. 2011, 144, 44–55. [Google Scholar] [CrossRef]
  79. Dale, M.R.T.; Fortin, M.J. From Graphs to Spatial Graphs. Annual Review of Ecology, Evolution, and Systematics; Futuyma, D.J., Shafer, H.B., Simberloff, D., Eds.; Annual Reviews: Palo Alto, CA, USA, 2010; Volume 41, pp. 21–38. [Google Scholar]
  80. Schumaker, N.H. Using landscape indices to predict habitat connectivity. Ecology 1996, 77, 1210–1225. [Google Scholar] [CrossRef] [Green Version]
  81. Cantwell, M.D.; Forman, R.T.T. Landscape Graphs—Ecological Modeling with Graph-Theory to Detect Configurations Common to Diverse Landscapes. Landsc. Ecol. 1993, 8, 239–255. [Google Scholar] [CrossRef]
  82. Urban, D.L.; Minor, E.S.; Treml, E.A.; Schick, R.S. Graph models of habitat mosaics. Ecol. Lett. 2009, 12, 260–273. [Google Scholar] [CrossRef]
  83. Saura, S.; Pascual-Hortal, L. A new habitat availability index to integrate connectivity in landscape conservation planning: Comparison with existing indices and application to a case study. Landsc. Urban Plan. 2007, 83, 91–103. [Google Scholar] [CrossRef]
  84. McGarigal, K.; Marks, B.J. FRAGSTATS: Spatial pattern analysis program for quantifying landscape structure. In USDA Forest Service−General Technical Report PNW; USDA Forest Service: Washington, DC, USA, 1995. [Google Scholar]
  85. Foltete, J.C.; Clauzel, C.; Vuidel, G. A software tool dedicated to the modelling of landscape networks. Environ. Model. Softw. 2012, 38, 316–327. [Google Scholar] [CrossRef]
  86. Hofman, M.P.G.; Hayward, M.W.; Kelly, M.J.; Balkenhol, N. Enhancing conservation network design with graph-theory and a measure of protected area effectiveness: Refining wildlife corridors in Belize, Central America. Landsc. Urban Plan. 2018, 178, 51–59. [Google Scholar] [CrossRef]
  87. Walker, N.J.; Schaffer-Smith, D.; Swenson, J.J.; Urban, D.L. Improved connectivity analysis using multiple low-cost paths to evaluate habitat for the endangered San Martin titi monkey (Plecturocebus oenanthe) in north-central Peru. Landsc. Ecol. 2019, 34, 1859–1875. [Google Scholar] [CrossRef]
  88. Keitt, T.; Urban, D.; Milne, B.T. Detecting critical scales in fragmented landscapes. Conserv. Ecol. 1997, 1, 17. [Google Scholar] [CrossRef] [Green Version]
  89. Rae, C.; Rothley, K.; Dragicevic, S. Implications of error and uncertainty for an environmental planning scenario: A sensitivity analysis of GIS-based variables in a reserve design exercise. Landsc. Urban Plan. 2007, 79, 210–217. [Google Scholar] [CrossRef]
  90. O’Brien, D.; Manseau, M.; Fall, A.; Fortin, M.J. Testing the importance of spatial configuration of winter habitat for woodland caribou: An application of graph theory. Biol. Conserv. 2006, 130, 70–83. [Google Scholar] [CrossRef]
  91. Lhyver, M.A. The European network of biogenetic reserves. Environ. Conserv. 1992, 19, 275–276. [Google Scholar] [CrossRef] [Green Version]
  92. Biondi, E.; Casavecchia, S.; Pesaresi, S.; Zivkovic, L. Natura 2000 and the Pan-European Ecological Network: A new methodology for data integration. Biodivers. Conserv. 2012, 21, 1741–1754. [Google Scholar] [CrossRef]
  93. Saura, S.; Bastin, L.; Battistella, L.; Mandrici, A.; Dubois, G. Protected areas in the world’s ecoregions: How well connected are they? Ecol. Indic. 2017, 76, 144–158. [Google Scholar] [CrossRef]
  94. Zeller, K.A.; McGarigal, K.; Whiteley, A.R. Estimating landscape resistance to movement: A review. Landsc. Ecol. 2012, 27, 777–797. [Google Scholar] [CrossRef]
  95. Yu, K.J. Security patterns and surface model in landscape ecological planning. Landsc. Urban Plan. 1996, 36, 1–17. [Google Scholar] [CrossRef]
  96. Carlier, J.; Moran, J. Landscape typology and ecological connectivity assessment to inform Greenway design. Sci. Total Environ. 2019, 651, 3241–3252. [Google Scholar] [CrossRef]
  97. Xu, J.; Fan, F.; Liu, Y.; Dong, J.; Chen, J. Construction of Ecological Security Patterns in Nature Reserves Based on Ecosystem Services and Circuit Theory: A Case Study in Wenchuan, China. Int. J. Environ. Res. Public Health 2019, 16, 3220. [Google Scholar] [CrossRef] [Green Version]
  98. Soille, P.; Vogt, P. Morphological segmentation of binary patterns. Pattern Recog. Lett. 2009, 30, 456–459. [Google Scholar] [CrossRef]
  99. Ding, R. The Complex Network Theory-Based Urban Land-Use and Transport Interaction Studies. Complexity 2019, 2019, 4180890. [Google Scholar] [CrossRef]
  100. Gao, J.; Barzel, B.; Barabasi, A.L. Universal resilience patterns in complex networks. Nature 2016, 530, 307–312. [Google Scholar] [CrossRef] [PubMed]
  101. Liu, Y.Y.; Slotine, J.J.; Barabasi, A.L. Controllability of complex networks. Nature 2011, 473, 167–173. [Google Scholar] [CrossRef]
  102. De Montis, A.; Ganciu, A.; Cabras, M.; Bardi, A.; Peddio, V.; Caschili, S.; Massa, P.; Cocco, C.; Mulas, M. Resilient ecological networks: A comparative approach. Land Use Policy 2019, 89, 104207. [Google Scholar] [CrossRef]
  103. Nathwani, J.; Lu, X.; Wu, C.; Fu, G.; Qin, X. Quantifying security and resilience of Chinese coastal urban ecosystems. Sci. Total Environ. 2019, 672, 51–60. [Google Scholar] [CrossRef]
  104. Wang, T.; Li, H.B.; Huang, Y. The complex ecological network’s resilience of the Wuhan metropolitan area. Ecol. Indic. 2021, 130, 108101. [Google Scholar] [CrossRef]
  105. Coskun Hepcan, C. Quantifying landscape pattern and connectivity in a Mediterranean coastal settlement: The case of the Urla district, Turkey. Environ. Monit. Assess 2013, 185, 143–155. [Google Scholar] [CrossRef] [PubMed]
  106. Gonzalez, A.; Thompson, P.; Loreau, M. Spatial ecological networks: Planning for sustainability in the long-term. Curr. Opin. Environ. Sustain. 2017, 29, 187–197. [Google Scholar] [CrossRef] [PubMed] [Green Version]
  107. Qiu, J.X.; Carpenter, S.R.; Booth, E.G.; Motew, M.; Zipper, S.C.; Kucharik, C.J.; Loheide, S.P.; Turner, A.G. Understanding relationships among ecosystem services across spatial scales and over time. Environ. Res. Lett. 2018, 13, 054020. [Google Scholar] [CrossRef]
  108. Perrin, M.; Bertrand, N.; Vanpeene, S.; PACA, I. Ecological connectivity in spatial planning: From the EU framework to its territorial implementation in the French context. Environ. Sci. Policy 2022, 129, 118–125. [Google Scholar] [CrossRef]
  109. Saura, S.; Bodin, O.; Fortin, M.J. Stepping stones are crucial for species long-distance dispersal and range expansion through habitat networks. J. Appl. Ecol. 2014, 51, 171–182. [Google Scholar] [CrossRef]
  110. Haidir, I.A.; Kaszta, Z.; Sousa, L.L.; Lubis, M.I.; Macdonald, D.W.; Linkie, M. Felids, forest and farmland: Identifying high priority conservation areas in Sumatra. Landsc. Ecol. 2021, 36, 475–495. [Google Scholar] [CrossRef]
  111. Nunez, T.A.; Lawler, J.J.; McRae, B.H.; Pierce, D.J.; Krosby, M.B.; Kavanagh, D.M.; Singleton, P.H.; Tewksbury, J.J. Connectivity planning to address climate change. Conserv. Biol. 2013, 27, 407–416. [Google Scholar] [CrossRef]
  112. Prieto-Torres, D.A.; Navarro-Siguenza, A.G.; Santiago-Alarcon, D.; Rojas-Soto, O.R. Response of the endangered tropical dry forests to climate change and the role of Mexican Protected Areas for their conservation. Glob. Chang. Biol. 2016, 22, 364–379. [Google Scholar] [CrossRef]
  113. Ings, T.C.; Montoya, J.M.; Bascompte, J.; Bluthgen, N.; Brown, L.; Dormann, C.F.; Edwards, F.; Figueroa, D.; Jacob, U.; Jones, J.I.; et al. Ecological networks—Beyond food webs. J. Anim. Ecol. 2009, 78, 253–269. [Google Scholar] [CrossRef]
  114. Peng, J.; Pan, Y.J.; Liu, Y.X.; Zhao, H.J.; Wang, Y.L. Linking ecological degradation risk to identify ecological security patterns in a rapidly urbanizing landscape. Habitat Int. 2018, 71, 110–124. [Google Scholar] [CrossRef]
  115. Peng, J.; Yang, Y.; Liu, Y.; Hu, Y.; Du, Y.; Meersmans, J.; Qiu, S. Linking ecosystem services and circuit theory to identify ecological security patterns. Sci. Total Environ. 2018, 644, 781–790. [Google Scholar] [CrossRef] [PubMed] [Green Version]
  116. Strogatz, S.H. Exploring complex networks. Nature 2001, 410, 268–276. [Google Scholar] [CrossRef] [PubMed] [Green Version]
Figure 1. Characteristics of the annual output of publications.
Sustainability 14 04925 g001
Figure 2. Global geographic distribution of publications.
Sustainability 14 04925 g002
Figure 3. (a) Country cooperation network and (b) institution cooperation network.
Sustainability 14 04925 g003
Figure 4. Subject category evolution during 1990–2020.
Sustainability 14 04925 g004
Figure 5. Map of frequently co-cited publications during 1990–2020.
Sustainability 14 04925 g005
Figure 6. Co-cited reference clusters of EN research.
Sustainability 14 04925 g006
Figure 7. (a) The network map of keywords during 1990–2020; (b) connections between any two of the top 20 most frequent keywords.
Sustainability 14 04925 g007
Figure 8. Term clusters of EN research during 1990–2020.
Sustainability 14 04925 g008
Table 1. The 15 journals with the highest number of articles published on EN research.
JournalNPTCTC/NIF 2020h-Index
LandscapeEcology1269.2%477937.93.84833
Landscape and Urban Planning695.0%551780.06.14234
Biological Conservation493.6%153231.35.99023
Journal of Applied Ecology342.5%172850.86.52822
Ecological Indicators332.4%88026.74.95815
Ecological Modeling312.3%62120.02.97414
Ecological Applications292.1%127944.14.65719
Sustainability261.9%1034.03.2516
Biodiversity and Conservation231.7%66929.13.54913
Plos One231.7%33714.73.24010
Ecology221.6%2848129.55.49916
Conservation Biology211.5%162377.36.56017
Journal For Nature Conservation201.5%35517.82.83112
Ecology Letters171.2%119870.59.49211
Freshwater Biology151.1%1604106.93.8099
N = number; P = percentage; TC = total citations.
Table 2. Analysis index of landscape connectivity.
Index NameCalculation FormulaReferences
Correlation length (C) R s = 1 n s i = 1 n s x i x 2 + y i y 2 , C = s = 1 m n s R s s = 1 m n s , where Rs is the radius of gyration of component s, x and y are the mean coordinates of all the habitat cells in that component, xi and yi are the coordinates of each habitat cell in that component, ns is the number of habitat cells, and m is the number of components in the landscape. is the number of habitat cells, and m is the number of components in the landscape.[88,89]
Closeness centrality (CC) C C i = N 1 j d i , j , where d(i,j) is the number of links in the shortest path from node i to node j.[83]
Flux F l u x i j = Q A i × P i j ,   P i j = exp θ × d i j , where θ is a distance decay coefficient ( θ   <   0.0 ) ,   and   Q A i is the quality weighted area (equal to patch size multiplied by patch quality).[27]
Area-weighted flux (AWF) A W F = i = 1 n j = 1 , i j n P i j a i a j , where Pi, ai and aj are the areas of the habitat patches i and j, and P i j   is the probability of direct dispersal between patches i and j.[77,83]
Betweenness centrality (BC) B C K = i j ρ i , k , j , ρ i , j   i j k , where ρ(i,j) is the number of shortest paths from node i to node j, and ρ i , k , j is the number of these shortest paths that pass through node k in the network.[58]
Harary index (H) H = 1 2 i = 1 n j = 1 , i j n   1 n l i j , where n is the total number of habitat patches, and n l i j   is the shortest path from node i to node j.[29]
Landscape coincidence probability (LCP) L C P = i = 1 N C c i A L 2 , where NC is the number of components, c i is the total area of each component, and A L is the total landscape area.[28]
Integral index of connectivity (IIC) I I C = i = 1 n j = 1 n   a i a j 1 + n l i j A L 2 , where ai and aj are the areas of the habitat patches i and j, n l i j is the number of links in the shortest path (topological distance) between patches i and j, and A L 2 is the total landscape area.[28]
Probability of connectivity (PC) P C = i = 1 n j = 1 n a j p i j * A L 2 , where p i j * is the maximum product probability of all possible paths between patches i and j, a i   and   a j are the areas of the habitat patches i and j, and A L 2 is the total landscape area.[83]
Expected cluster size (ECS) E S C i = j = 1 m a j 2 a , where aj is the area of cluster j, and a is the total area of habitat.[90]
Table 3. Top 15 terms for three stages during 1990–2020.
1990–20042005–20142015–2020
TermCountCentralityTermCountCentralityTermCountCentrality
ecological network240.27ecological network920.11landscape connectivity1490.05
landscape ecology190.21landscape connectivity730.12ecological network1320.04
landscape structure90.03landscape ecology500.21protected area650.03
landscape connectivity90.05habitat patches400.11habitat patches560.04
agricultural landscapes70.21functional connectivity360.04habitat fragmentation540.06
conservation biology60.04protected area290.13functional connectivity490.05
fragmented landscapes60.02network analysis290.02climate change460.09
habitat patches50.04habitat fragmentation280.07biodiversity conservation450.05
biological diversity40.11habitat connectivity280.05landscape ecology420.11
biodiversity conservation40.15climate change280.14graph theory410.07
ecological stability30.02ecosystem service270.04ecosystem service400.06
natural habitats30.02landscape structure230.17habitat connectivity330.06
climate change30.06spatial pattern220.08network analysis300.01
agricultural policy20.03conservation planning220.11habitat loss300.06
aesthetic principles20.05biodiversity conservation220.07human activity290.05
Publisher’s Note: MDPI stays neutral with regard to jurisdictional claims in published maps and institutional affiliations.

