Article

Identification and Quantification of Microplastics in Effluents of Wastewater Treatment Plant by Differential Scanning Calorimetry (DSC)

by
Joaquín Hernández Fernández
1,2,*,
Heidis Cano
3,
Yoleima Guerra
2,
Esneyder Puello Polo
4,
John Fredy Ríos-Rojas
5,
Ricardo Vivas-Reyes
6,7 and
Juan Oviedo
8
1
Department of Natural and Exact Sciences, Universidad de la Costa, Barranquilla 080002, Colombia
2
Centro de Investigación en Ciencias e Ingeniería, CECOPAT&A, Cartagena 131001, Colombia
3
Department of Civil and Environmental, Universidad de la Costa, Barranquilla 080002, Colombia
4
Grupo de Investigación en Oxi/Hidrotratamiento Catalítico y Nuevos Materiales, Programa de Química-Ciencias Básicas, Universidad del Atlántico, Barranquilla 080003, Colombia
5
Department of Mechanical, Electronic and Biomedical Engineering, Antonio Nariño University, Bogotá 111821, Colombia
6
Grupo de Química Cuántica y Teórica, Facultad de Ciencias Exactas y Naturales, Universidad de Cartagena, Cartagena 130015, Colombia
7
Grupo Ciptec, Facultad de Ingeniería, Programa de Ingeniería Industrial, Fundación Universitaria Comfenalco, Cartagena 130015, Colombia
8
Grupo de Investigación en Procesos de la Industria Petroquímica, Centro para la Industria Petroquímica—SENA Regional Bolívar, Cartagena 130001, Colombia
*
Author to whom correspondence should be addressed.
Sustainability 2022, 14(9), 4920; https://doi.org/10.3390/su14094920
Submission received: 1 March 2022 / Revised: 5 April 2022 / Accepted: 6 April 2022 / Published: 20 April 2022

Abstract

:
In this research, the presence of microplastics was detected through a differential scanning calorimetry (DSC) analysis of three wastewater treatment plants. One of these plants applied only a preliminary treatment stage while the others applied up to a secondary treatment stage to evaluate their effectiveness. The results showed the presence of polyethylene (PE), polystyrene (PS), polypropylene (PP) and polyethylene terephthalate (PET), which were classified as fragments, fibers or granules. During the evaluation of the plants, it was determined that the preliminary treatment did not remove more than 58% of the microplastics, while the plants applying up to a secondary treatment with activated sludge achieved microplastic removal effectiveness between 90% and 96.9%.

1. Introduction

Plastic is a material present in many aspects of human life, and has been produced for many years to make human life much easier [1,2]. However, the poor final disposal of these materials has increased the rate of contamination of marine ecosystems, due to the formation of microplastics [1,3]. These are plastic particles with sizes between 5 mm and 1 μm, and are classified by origin as primary or secondary. Primary microplastics are produced intentionally, as in personal care products, granules for raw materials and plastic powder, among others [4,5]; secondary microplastics are those generated by the degradation of plastic by environmental effects, such as UV rays and temperature, or those generated during mechanical treatments, such as the treatment of fabrics and paint [6,7]. Such are typically found in waters and sediments due to their slow rate of deterioration. The size of these particles enables aquatic organisms to ingest them easily; this causes substantial harm, such as decreased feeding activities, oxidative stress, genotoxicity, development retardation, or even death. Consequently, microplastics can be transferred to humans through the ingestion of aquatic animals [8,9].
The most common plastics are present in daily products as personal care products and packages for soaps, scrubs, lotions, etc. [10,11]; most of these are made from polyethylene (PE) and polypropylene (PP). Polystyrene (PS) products are often used for the manufacture of disposables, such as insulators and food packaging [12,13]; polyethylene terephthalate (PET) is commonly used for the manufacture of containers and packaging in general, among others [14,15,16,17,18]. All such products can be converted into microplastics.
The presence of these materials is greater in human-generated waste, even reaching wastewater treatment plants (WWTPs)that are designed for the removal of organic material and not plastic. Even so, these WWTPs can remove up to more than 90% of plastics [19], concentrating them in the residual sludge which is used as fertilizers in agriculture and generates other environmental damage [10,20]. The identification and study of the microplastics present in wastewater makes it possible to develop methods for their effective elimination and contributes to the improvement of the processes used in water treatment. It also makes it possible to understand the relative effects of the types of microplastic present and their size [21].
Usually, some of the matter, including microplastics, entering WWTPs are removed during the treatment [14,22]. Due to the constant discharge quantities of the treated effluent, despite the high disposal efficiency, which may be higher than 90% [23] in some cases, considerable amounts of microplastics can still be discharged into the wastewater effluent [24]. WWTPs use different treatment stages for the removal of contaminants in order to discharge to water bodies. Generally, they have a pre-treatment consisting of screening, sandblaster and aerator; sedimentation as a primary treatment; a secondary treatment that can be by activated sludge or secondary sedimentation; and a tertiary treatment that can be membrane bioreactors, rapid sand filtration, disc filtration and coagulation [24,25,26], among others. According to previous studies, the percentage of removal increases with respect to the number of stages that the WWTP uses, and the types and sizes of the microplastics present, up to a large fraction of these particles [27]. These investigations aid in the adaptation of treatments to improve removal percentages, as well as the conduct of research on the efficacy and quality of microplastic removal, allowing solutions to be provided for the accurate separation of microplastics from wastewater and subsequent use.
Nowadays, sampling mechanisms and techniques have improved, but processing and measuring these compounds remains expensive. Environmental samples also remain time-consuming and challenging [28]. For the detection of microplastics, different methods are used, either visually or microscopically. These include classifying the sample only with the human eye, by means of the colors and size presented [29,30]; spectroscopic means, such as FT-IR, Raman or SEM-EDS, which allow for more precise identification and classification of microplastics, since they provide numbers and sizes of particles and, hence, information on the composition of the material [31,32,33]; using thermo-analytical products, such as DSC or Pyr-GC/MS, which enable identification through analysis of the thermal properties of the material and the decomposition gases generated; and generating data about the kind of polymer and its mass [2,5,24,34,35]. Different authors have presented methods to quantify the mass quantity of microplastics using DSC [36,37], such that the degradation of the microplastics contained in a sample is recognized, measured and determined using a single thermal study. This approach, however, is only applicable to semi-crystalline polymers and not amorphous plastics [38,39].
This paper describes the identification and quantification of microplastics present in municipal and industrial wastewater influents and effluents through the use of differential scanning calorimetry (DSC) analysis. As a result, it evaluates the efficacy of the WWTP procedures for the removal of microplastics from distinct wastewater sources. It also presents the calculation of the area under the DCS peaks as a way to determine the percentage concentration by type of plastic identified in the samples.

2. Materials and Methods

2.1. Sampling Sites

The samples were obtained from three wastewater treatment plants (WWTP-1, WWTP-2 and WWTP-3). Two of these (WWTP-2 and WWTP-3) apply up to a secondary treatment using activated sludge; the third (WWTP-1) only performs a pretreatment, because the final disposal of these waters is conducted by an underwater outfall. For WWTP-1, wastewater goes through screening and sandblasting as a pretreatment for disposal by submarine outfall; WWTP-2 and WWTP-3 perform this same pretreatment in addition to a primary sedimentation and a secondary process where they use activated sludge.
The WWTP-1 treats domestic wastewater and, to a low extent, wastewater from shops; it performs only a pretreatment and then pours the effluent 4.5 km offshore, where there is an assimilation of these waters by the sea. When high solids removal is guaranteed, this treatment is considered a viable and safe alternative for domestic wastewater treatment [40,41]. WWTP-2 and WWTP-3 treat industrial and domestic wastewater by treating up to a secondary stage. It should be noted that WWTP-3 is part of a polymer processing company that owns its own wastewater treatment plant, with discharge to the nearby body of water.

2.2. Sampling Method

Samples from the various influents were taken at random. The wastewater sampling points included the upstream raw influent of the preliminary treatment and the effluent from the secondary treatment. For WWTP-1, a sample is taken after preliminary treatment. Some WWTPs, including WWTP-2 and WWTP-3, have sampling points to verify the quality and efficiency of the process, so representative samples of 1 L were taken for the monitoring of both the influent and the effluent. Samples were collected in previously cleaned glass bottles. The volumes of samples processed are between 10 and 100 L.
For the three plants, samples of both the influent and the effluent were taken in triplicate and each a week apart. They were classified by size as small, for those particles that were between 10 and 1000 μm, or as large, for those between 1000 and 5000 μm. In addition to this, they were classified by their identified shape, categorizing them as fibers, fragments or granules. For WWTP-1, the volumes sampled in the influents were 50, 45 and 97 L; volumes of 35, 55 and 82 L were sampled in WWTP-2; and volumes of 50, 65 and 98 L were sampled in WWTP-3.

2.3. Sample Processing

To digest the organic matter, 20 mL of % H2O2 was added to the 1 L samples and agitated with a magnetic stirring bar at 60 °C for 12–24 h [24,42]. After that, samples with a size fraction of 1000–5000 µm were filtered via a 100 µm sieve (Retsch GmbH, Haan, Germany). Polycarbonate membrane filters (5 µm pore size, 1/4 47 µm) were used to filter the size fraction 10–1000 µm [28]. A bengal rose staining solution was applied to the filter surface and allowed to react for 10 minutes, to reduce the amount of non-plastic particles in the samples for microplastic characterization. Following that, the filters were rinsed with pure water and dried at 60 °C for further examination. The 5 µm polycarbonate membrane filters were used to dry and weigh the leftover particles after more filtering and washing. Finally, an aliquot of the dried particles was placed in crucibles to be analyzed for polymers.

2.4. Thermal Analysis

A DSC Standard Cell RC is used to perform DSC measurements. The sample is heated from 0 to 280 °C at a rate of 10 °C min−1 and then cooled from 280 to 0 °C at the same rate to guarantee a similar thermal history. While the sample is being heated, endothermic fusion changes are recorded and the melting temperature is calculated using the maximal peak of the second heating cycle (Tm). The melting temperatures of the polymers were used to identify them and the resulting masses were computed using the proportion of the aliquot collected from each sample [18,32,43].

3. Results

3.1. Concentration of Microplastics in the Samples

Table 1 shows the different concentrations obtained for the influents of the three water treatment plants, which change, on average, in a range from 6.8 to 10 microplastic particles per liter (MP/L) in each of the plants. In fact, the concentrations in the effluents do present different values depending on the plant. This is due to the different processes used in each of them; values between 3.62 and 4.18 were obtained for WWTP-1, which uses only one pretreatment; and values between 0.28 and 0. 82 were obtained for the other two plants, which use up to secondary treatment.
The variation in the concentrations of microplastics in the effluents is due to the process implemented; as stages are added during the treatment, the effectiveness of removing these particles increases. Previous research on the effect of the number of stages on the effectiveness of removal has shown similar results, namely that preliminary treatments can remove between 60% and 79% of the microplastics when screening or sandblasting [3,24]; when complemented with primary treatments, this percentage increases to between 78% and 96% of removal [14,26]. Secondary treatments with active sludge also contribute to removal, with percentages of up to 98% of removal [27,44]. However, these percentages depend on the treatments and adaptations that the plants have for the management of wastewater.

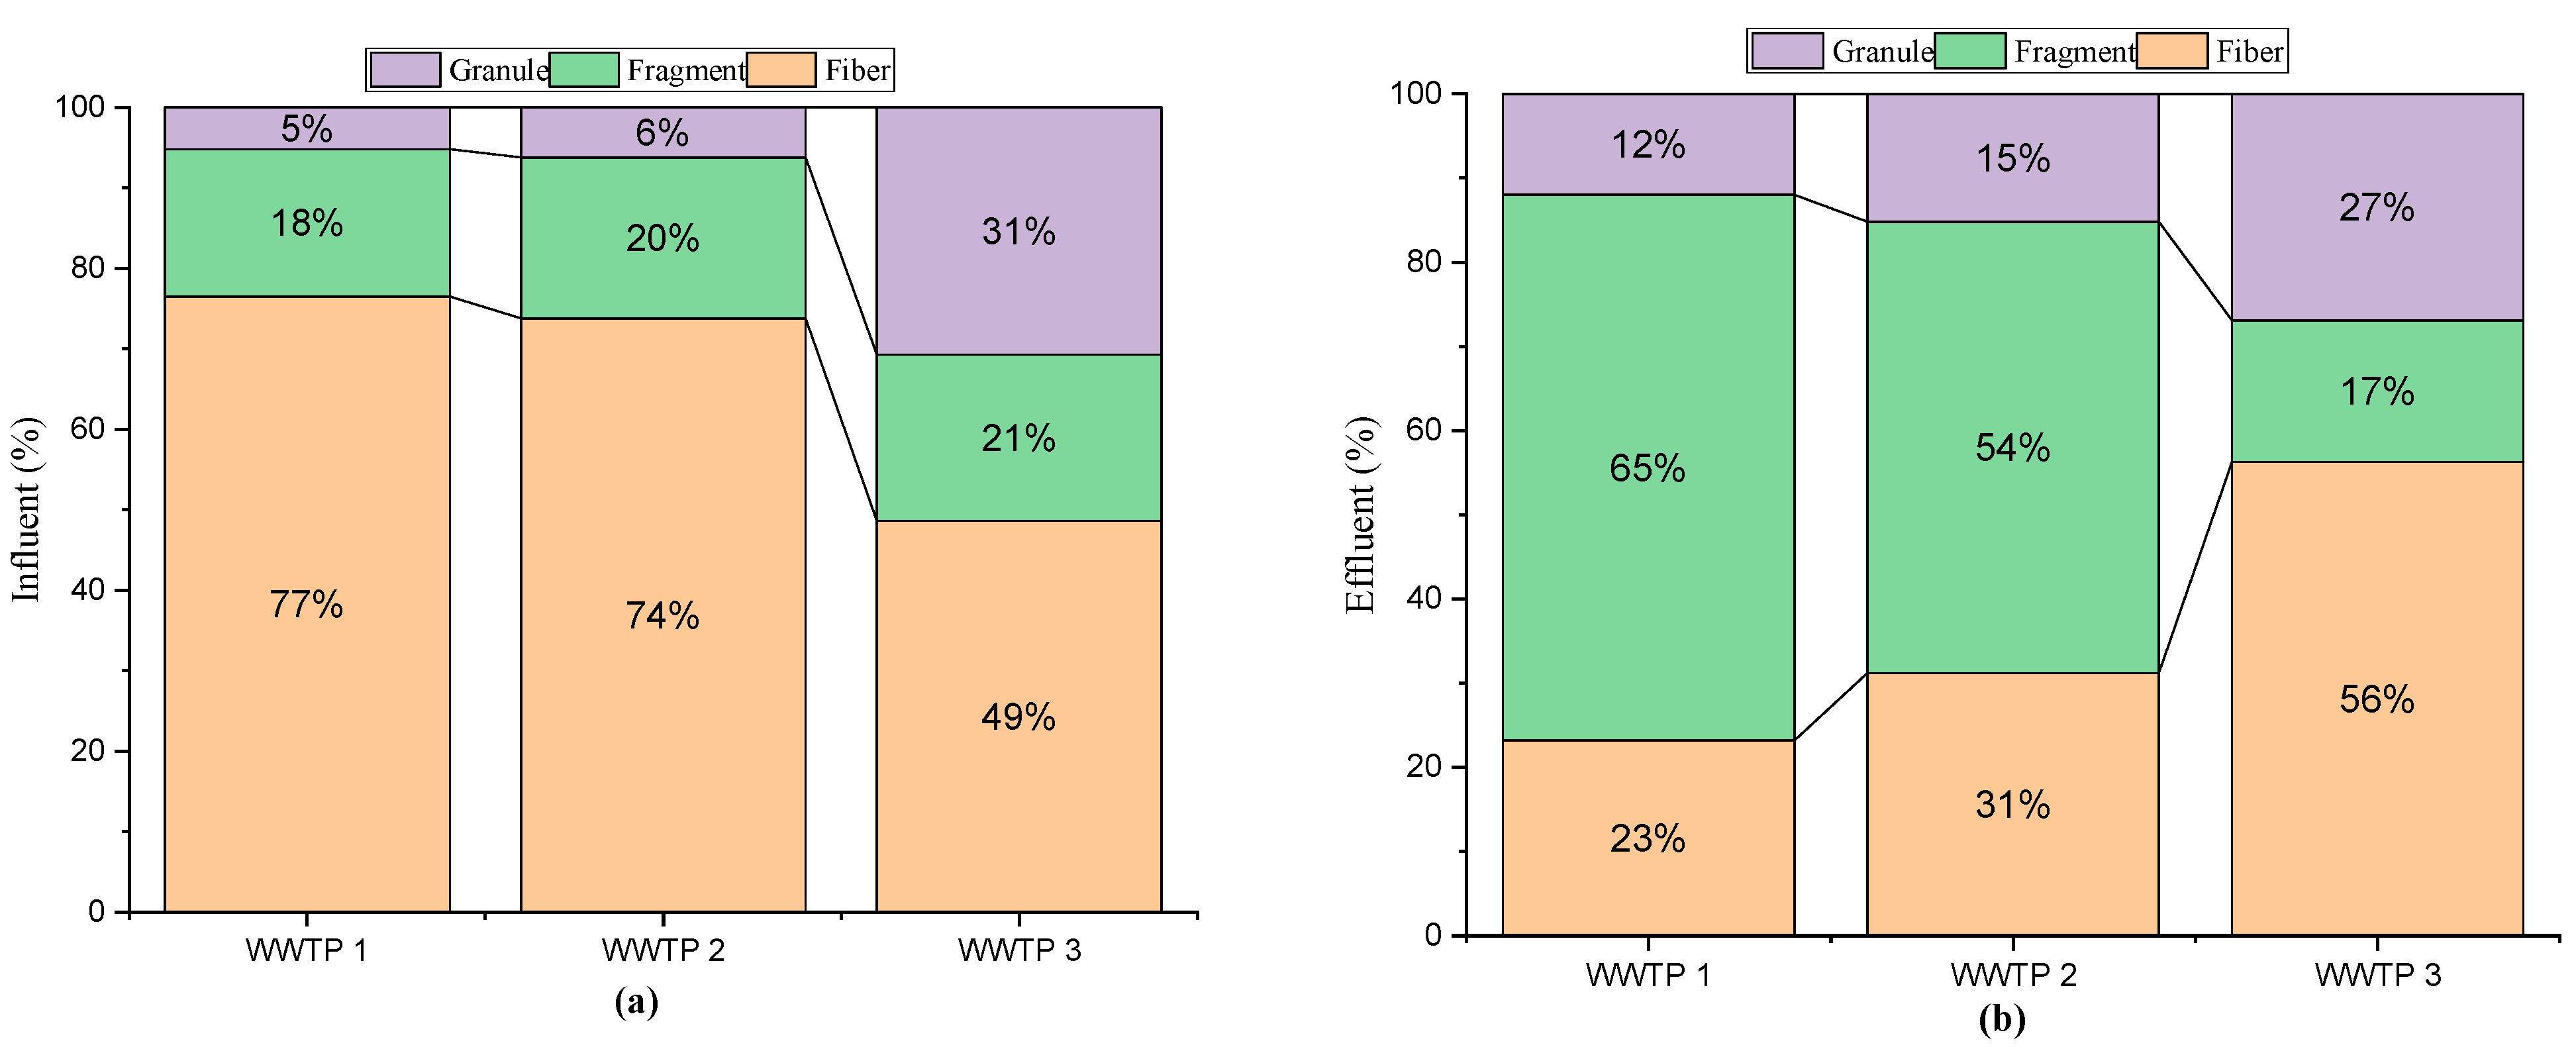
3.2. Classification of the Microplastics Presents in the Samples

The microplastics were classified by their size for each of the samples taken in the WWTPs. In the influents, microplastics were found in greatest proportion between 1000 and 5000 μm; as shown in Table 2, they were between 63% and 69% of the total concentration for WWTP-1, between 75% and 83% for WWTP-2; and between 70% and 76% for WWTP-3. In contrast, microplastics occur in effluents in greatest proportion, and in some cases exclusively, between 10 and 1000 μm. The sizes and shapes of the microplastics in the influents mainly depend on their causal origin, for instance, whether they come from a cosmetic or personal care product, which already have established sizes and shapes, or if they were generated from the degradation or fragmentation of a plastic [8,9,45].
Microplastics were also classified according to their morphology into fibers, granules and fragments. For this classification, the percentages obtained in each plant in the influents and effluents represented in Figure 1 were averaged, where, in the influent (Figure 1a), the microplastics identified are the fibers in greatest proportion, while in the effluent (Figure 1b) the fragments for WWTP-1 and WWTP-2 and the fibers for WWTP-3 are found in greatest proportion. The data obtained can be explained, since the morphology of the microplastics influences the ease of removal. The fibers, and in some cases the fragments, are the forms with the highest percentage, because these can adhere more easily to other particles; this increases their size and simplifies their removal in the different treatments. This fact has been evidenced in other investigations, which show that fibers are removed in the great majority in the preliminary treatment, while fragments are removed mainly in the treatment with active sludge [3,46]. Additionally, it has been evidenced that the type of plastic influences their removability; meaning that the plastics of low and moderate density can be removed with sedimentation [19,47,48].

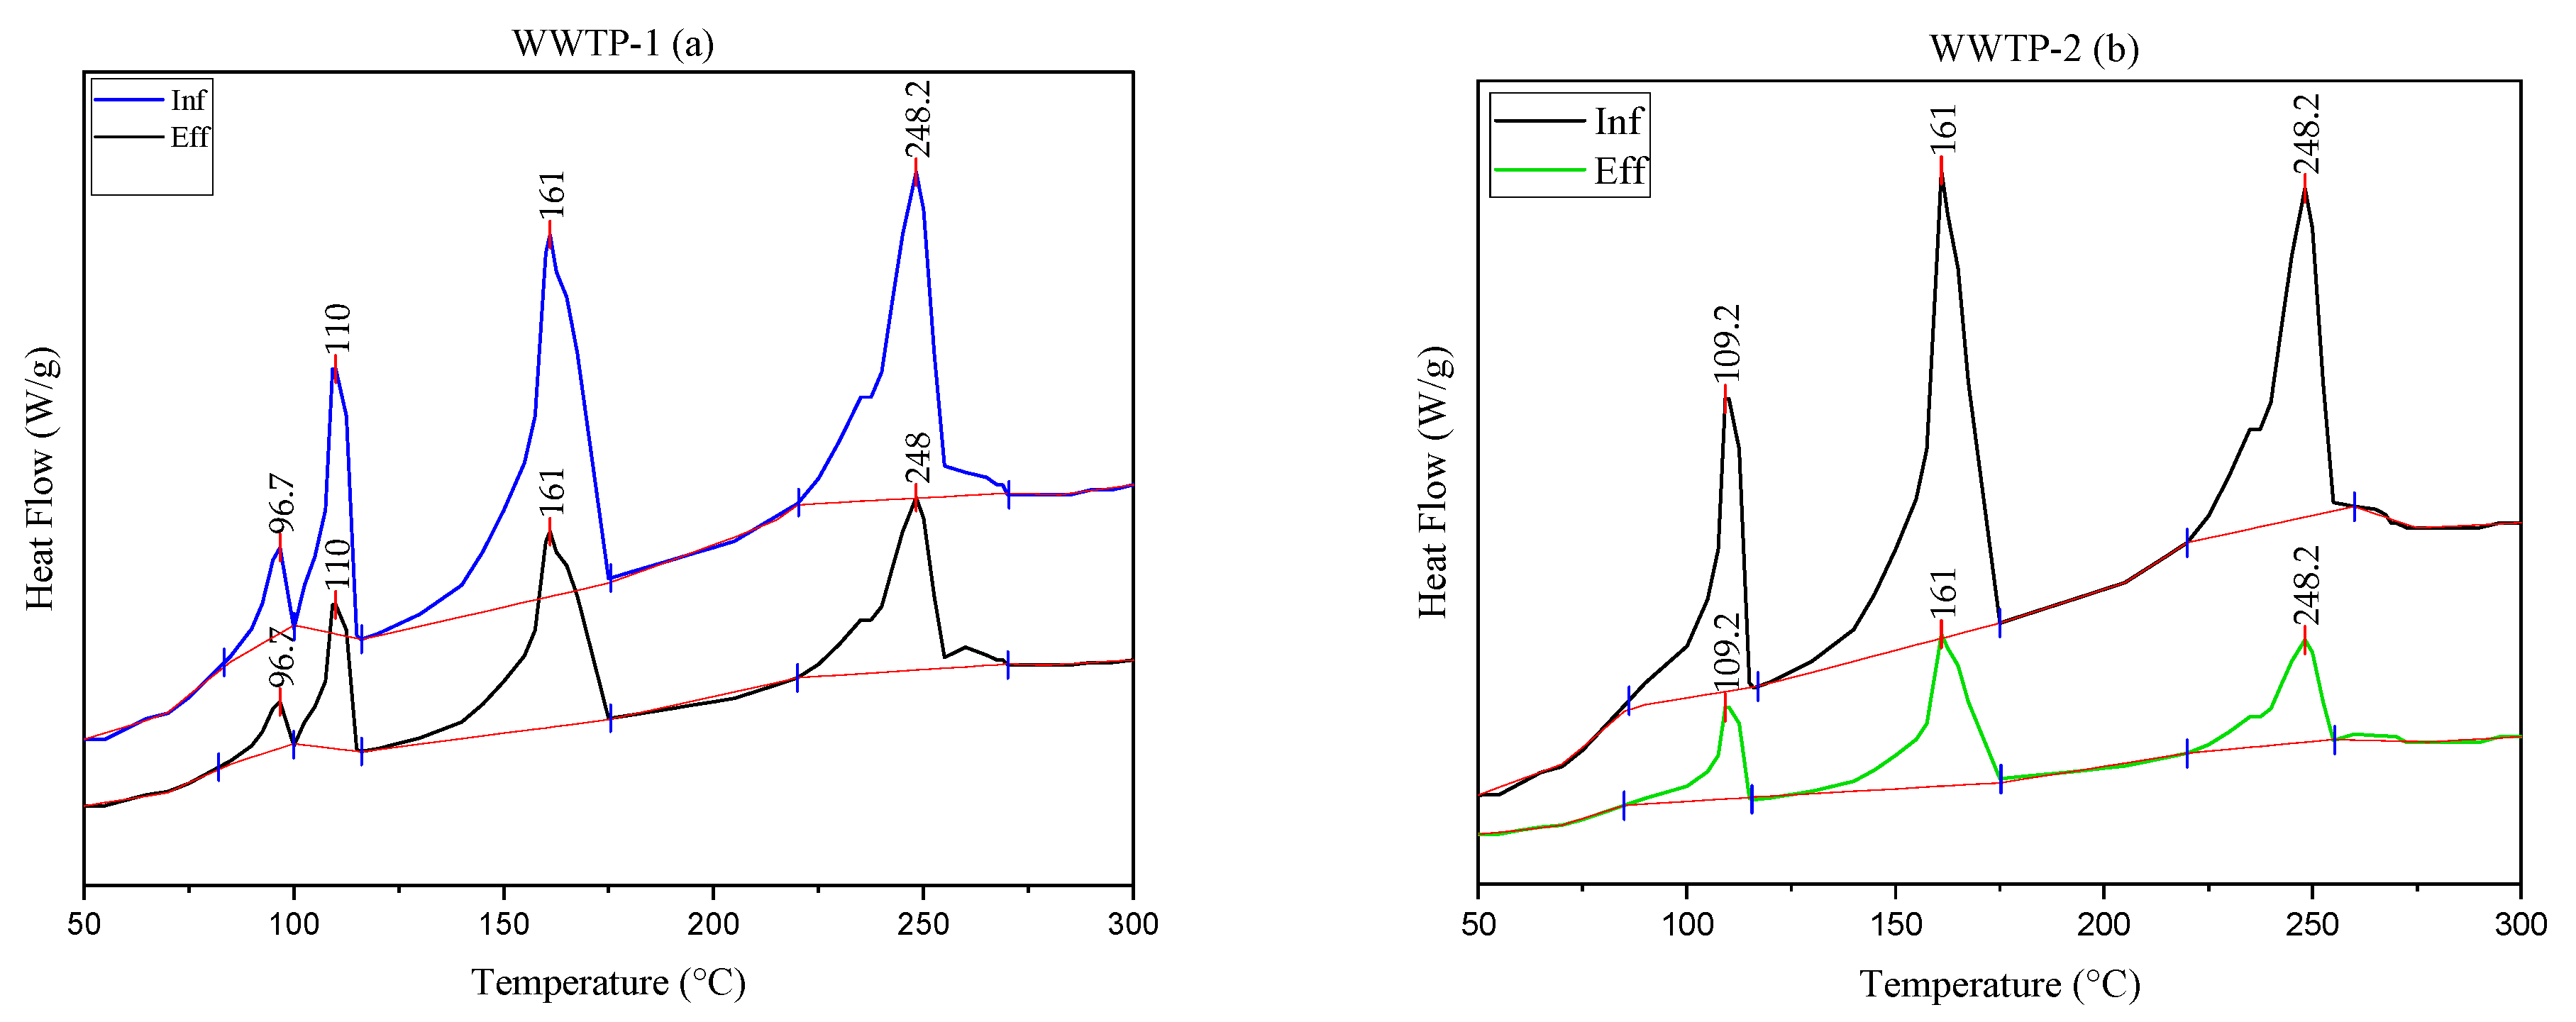
3.3. Identification of the Microplastics Present in the Samples

The identification of the plastics present in the samples was conducted by DSC, where the characteristic peaks of the melting points of the different plastics present in the samples were identified [18,32,49]. Table 3 shows the materials identified and the possible origins of these.
The DSCs for each of the plants are shown in Figure 2. It is observed that, in the WWTP-1 (Figure 2a), PS, low-density PE, PP and PET were identified. For WWTP-2 (Figure 2b), low-density PE, PP and PET were identified. For WWTP-3 (Figure 2c), PS, low-density PE, PP and PET were identified, which are the most common in wastewater [9,44,46].
The Supplementary Materials summarizes the DSC findings for each of the water samples in the influent; the analysis was performed five times to ensure the reliability of the results. It presents the identified peaks along with the values obtained in each of them, calculating the average, standard deviation and error.

3.4. Determination of the Percentage Concentration of the Identified Plastics

Previous studies have shown that the mass of the microplastics present in a sample can be quantified by means of a DSC analysis. This uses the calculation of area under the curve by means of the relationship between the heat of reaction and the plastic mass, known as the calibration constant [37,39], with the limitation that it only applies to semi-crystalline plastics with marked melting points. In case of the presence of amorphous plastics, the DSC will not identify these, however it will not affect the realization of the calculation [36,38]. This represents an advance for the quantification of microplastics by thermal analysis.
By calculating the area under the curve of each peak obtained in the DSC and the total area, determining the corresponding percentage for each plastic. The calculated value is shown in Table 4; this is a representative value of the concentration of each plastic, showing the percentage of decrease in each type of plastic identified when going through the different treatments. The material in the greatest concentration in the influents of the WWTPs is PP, with percentages between 41% and 48%, followed by PET, with percentages between 36% and 38%. Among the samples least present is PS; its presence and concentrations may vary due to the activity of the area during sampling times.
The area under the curve in the effluent with respect to the influent decreases by 53.54% for WWTP-1, 64.95% for WWTP-2 and 70.14% for WWTP-3. This decrease in area is in line with the reduction in the concentration of microplastics present in the effluents of the plants by their removal through the different processes in place, because of the directly proportional relationship they have [36].

3.5. Evaluation of the Effectiveness of WWTPs

To evaluate the effectiveness of microplastic removal at the WWTPs studied, the concentrations of microplastics in the effluent were compared with respect to the influent. Table 5 shows the percentages obtained in each sampling for the three plants. In WWTP-1 it is observed that the removal of microplastics does not exceed 58.2%, so that a large amount of these microparticles will be discharged into the sea; this can cause damage to both the submarine floor, by the partial sedimentation of these particles to the aquatic ecosystem, and to human beings, through the intake of fish from these waters. WWTP-2 and WWTP-3 show removals of more than 90%; however, the remaining percentage still poses a risk of large discharge of microplastics due to the volumes of influent and effluent managed by each plant.
According to the removal data collected, it is necessary to evaluate the optimization of these plants by implementing an additional stage that increases the percentage of total removal they achieve.
Variation in the removal efficiency of the same process is due to factors, such as the influent, the equipment used, and the time and site of sampling, among others, which explains why, although WWTP-2 and WWTP-3 followed the same treatments, they do not have the same efficiencies.

4. Conclusions

Identification of the microplastics present in the influents of the WWTPs was achieved through thermal analysis, allowing for the qualification and approximate quantification of the microplastics.
More than 90% of microplastic in wastewater is removed through preliminary, primary and secondary treatments. It was also determined that a preliminary treatment is not sufficient for the removal of microplastics, so it is recommended that it be carried out at least until a secondary treatment before dumping these waters into the sea in a way that mitigates the impact that the concentrations discharged of these materials have on the marine ecosystem. In addition, by analyzing the percentages of removal versus the discharge volumes, it can be determined that the amount of microplastic which ends up in water bodies is high. A study is required to increase the effectiveness of microplastic removal at the WWTPs studied.

Supplementary Materials

The following supporting information can be downloaded at: https://www.mdpi.com/article/10.3390/su14094920/s1, Table S1: Statistics of the peaks recorded in the DSC.

Author Contributions

Conceptualization, H.C. and J.O.; methodology, H.C., J.H.F. and J.O.; validation, Y.G.; formal analysis, H.C., J.F.R.-R. and R.V.-R.; investigation, H.C., J.H.F. and E.P.P.; resources, J.F.R.-R., J.H.F., R.V.-R. and H.C.; writing—original draft preparation, H.C. and Y.G.; writing—review and editing, J.H.F., E.P.P. and H.C.; supervision, H.C. and J.H.F.; project administration, J.H.F. All authors have read and agreed to the published version of the manuscript.

Funding

This research received no external funding.

Institutional Review Board Statement

Not applicable.

Informed Consent Statement

Not applicable.

Data Availability Statement

Not applicable.

Conflicts of Interest

The authors declare no conflict of interest.

References

  1. Picó, Y.; Soursou, V.; Alfarhan, A.H.; El-Sheikh, M.A.; Barceló, D. First evidence of microplastics occurrence in mixed surface and treated wastewater from two major Saudi Arabian cities and assessment of their ecological risk. J. Hazard. Mater. 2021, 416, 125747. [Google Scholar] [CrossRef] [PubMed]
  2. Mallow, O.; Spacek, S.; Schwarzböck, T.; Fellner, J.; Rechberger, H. A new thermoanalytical method for the quantification of microplastics in industrial wastewater. Environ. Pollut. 2019, 259, 113862. [Google Scholar] [CrossRef] [PubMed]
  3. Hamidian, A.H.; Ozumchelouei, E.J.; Feizi, F.; Wu, C.; Zhang, Y.; Yang, M. A review on the characteristics of microplastics in wastewater treatment plants: A source for toxic chemicals. J. Clean. Prod. 2021, 295, 126480. [Google Scholar] [CrossRef]
  4. Hidayaturrahman, H.; Lee, T.-G. A study on characteristics of microplastic in wastewater of South Korea: Identification, quantification, and fate of microplastics during treatment process. Mar. Pollut. Bull. 2019, 146, 696–702. [Google Scholar] [CrossRef]
  5. Expósito, N.; Rovira, J.; Sierra, J.; Folch, J.; Schuhmacher, M. Microplastics levels, size, morphology and composition in marine water, sediments and sand beaches. Case study of Tarragona coast (western Mediterranean). Sci. Total Environ. 2021, 786, 147453. [Google Scholar] [CrossRef]
  6. Bogdanowicz, A.; Zubrowska-Sudol, M.; Krasinski, A.; Sudol, M. Cross-Contamination as a Problem in Collection and Analysis of Environmental Samples Containing Microplastics—A Review. Sustainability 2021, 13, 12123. [Google Scholar] [CrossRef]
  7. Prajapati, S.; Beal, M.; Maley, J.; Brinkmann, M. Qualitative and quantitative analysis of microplastics and microfiber contamination in effluents of the City of Saskatoon wastewater treatment plant. Environ. Sci. Pollut. Res. 2021, 28, 32545–32553. [Google Scholar] [CrossRef]
  8. Yuan, F.; Zhao, H.; Sun, H.; Zhao, J.; Sun, Y. Abundance, morphology, and removal efficiency of microplastics in two wastewater treatment plants in Nanjing, China. Environ. Sci. Pollut. Res. 2020, 28, 9327–9337. [Google Scholar] [CrossRef]
  9. Cao, Y.; Wang, Q.; Ruan, Y.; Wu, R.; Chen, L.; Zhang, K.; Lam, K.S.P. Intra-day microplastic variations in wastewater: A case study of a sewage treatment plant in Hong Kong. Mar. Pollut. Bull. 2020, 160, 111535. [Google Scholar] [CrossRef]
  10. Uheida, A.; Mejía, H.G.; Abdel-Rehim, M.; Hamd, W.; Dutta, J. Visible light photocatalytic degradation of polypropylene microplastics in a continuous water flow system. J. Hazard. Mater. 2020, 406, 124299. [Google Scholar] [CrossRef]
  11. Maddah, H.A. Polypropylene as a promising plastic: A review. Am. J. Polym. Sci. 2016, 6, 1–11. [Google Scholar]
  12. Lu, Y.; Zhang, Y.; Deng, Y.; Jiang, W.; Zhao, Y.; Geng, J.; Ding, L.; Ren, H.-Q. Uptake and Accumulation of Polystyrene Microplastics in Zebrafish (Danio rerio) and Toxic Effects in Liver. Environ. Sci. Technol. 2016, 50, 4054–4060. [Google Scholar] [CrossRef] [PubMed]
  13. Schirinzi, G.F.; Llorca, M.; Seró, R.; Moyano, E.; Barceló, D.; Abad, E.; Farré, M. Trace analysis of polystyrene microplastics in natural waters. Chemosphere 2019, 236, 124321. [Google Scholar] [CrossRef] [PubMed]
  14. Xu, Z.; Bai, X.; Ye, Z. Removal and generation of microplastics in wastewater treatment plants: A review. J. Clean. Prod. 2021, 291, 125982. [Google Scholar] [CrossRef]
  15. Habib, R.Z.; Al Kendi, R.; Thiemann, T. The Effect of Wastewater Treatment Plants on Retainment of Plastic Microparticles to Enhance Water Quality—A Review. J. Environ. Prot. 2021, 12, 161–195. [Google Scholar] [CrossRef]
  16. Taurino, R.; Pozzi, P.; Zanasi, T. Facile characterization of polymer fractions from waste electrical and electronic equipment (WEEE) for mechanical recycling. Waste Manag. 2010, 30, 2601–2607. [Google Scholar] [CrossRef]
  17. Okoffo, E.D.; O’Brien, S.; O’Brien, J.W.; Tscharke, B.J.; Thomas, K.V. Wastewater treatment plants as a source of plastics in the environment: A review of occurrence, methods for identification, quantification and fate. Environ. Sci. Water Res. Technol. 2019, 5, 1908–1931. [Google Scholar] [CrossRef]
  18. Schindler, A.; Doedt, M.; Gezgin, Ş.; Menzel, J.; Schmölzer, S. Identification of polymers by means of DSC, TG, STA and computer-assisted database search. J. Therm. Anal. 2017, 129, 833–842. [Google Scholar] [CrossRef] [Green Version]
  19. Edo, C.; González-Pleiter, M.; Leganés, F.; Fernández-Piñas, F.; Rosal, R. Fate of microplastics in wastewater treatment plants and their environmental dispersion with effluent and sludge. Environ. Pollut. 2019, 259, 113837. [Google Scholar] [CrossRef]
  20. Bratovcic, A. Degradation of Micro- and Nano-Plastics by Photocatalytic Methods. J. Nanosci. Nanotechnol. Appl. 2017, 3, 1–9. [Google Scholar] [CrossRef]
  21. Franco, A.; Arellano, J.; Albendín, G.; Rodríguez-Barroso, R.; Zahedi, S.; Quiroga, J.; Coello, M. Mapping microplastics in Cadiz (Spain): Occurrence of microplastics in municipal and industrial wastewaters. J. Water Process Eng. 2020, 38, 101596. [Google Scholar] [CrossRef]
  22. Hernández-Fernández, J.; Lopez-Martinez, J.; Barceló, D. Quantification and elimination of substituted synthetic phenols and volatile organic compounds in the wastewater treatment plant during the production of industrial scale polypropylene. Chemosphere 2020, 263, 128027. [Google Scholar] [CrossRef] [PubMed]
  23. Sutton, R.; Mason, S.A.; Stanek, S.K.; Willis-Norton, E.; Wren, I.F.; Box, C. Microplastic contamination in the San Francisco Bay, California, USA. Mar. Pollut. Bull. 2016, 109, 230–235. [Google Scholar] [CrossRef] [PubMed]
  24. Ziajahromi, S.; Neale, P.A.; Silveira, I.T.; Chua, A.; Leusch, F.D. An audit of microplastic abundance throughout three Australian wastewater treatment plants. Chemosphere 2020, 263, 128294. [Google Scholar] [CrossRef]
  25. Habib, R.Z.; al Kindi, R.; Thiemann, T. The Effect of Wastewater Treatment Methods on the Retainment of Plastic Microparticles. In Wastewater Treatment; IntechOpen: London, UK, 2021. [Google Scholar] [CrossRef]
  26. Cristaldi, A.; Fiore, M.; Zuccarello, P.; Conti, G.O.; Grasso, A.; Nicolosi, I.; Copat, C.; Ferrante, M. Efficiency of Wastewater Treatment Plants (WWTPs) for Microplastic Removal: A Systematic Review. Int. J. Environ. Res. Public Health 2020, 17, 8014. [Google Scholar] [CrossRef]
  27. Alvim, C.B.; Bes-Piá, M.; Mendoza-Roca, J.-A. Separation and identification of microplastics from primary and secondary effluents and activated sludge from wastewater treatment plants. Chem. Eng. J. 2020, 402, 126293. [Google Scholar] [CrossRef]
  28. Bitter, H.; Lackner, S. First quantification of semi-crystalline microplastics in industrial wastewaters. Chemosphere 2020, 258, 127388. [Google Scholar] [CrossRef]
  29. Heo, N.W.; Hong, S.H.; Han, G.M.; Hong, S.; Lee, J.; Song, Y.K.; Jang, M.; Shim, W.J. Distribution of small plastic debris in cross-section and high strandline on Heungnam beach, South Korea. Ocean Sci. J. 2013, 48, 225–233. [Google Scholar] [CrossRef]
  30. Hidalgo-Ruz, V.; Thiel, M. Distribution and abundance of small plastic debris on beaches in the SE Pacific (Chile): A study supported by a citizen science project. Mar. Environ. Res. 2013, 87–88, 12–18. [Google Scholar] [CrossRef]
  31. Bank, M.S. Microplastic in the Environment: Pattern and Process; Springer: Berlin/Heidelberg, Germany, 2022. [Google Scholar] [CrossRef]
  32. Shim, W.J.; Hong, S.H.; Eo, S.E. Identification methods in microplastic analysis: A review. Anal. Methods 2016, 9, 1384–1391. [Google Scholar] [CrossRef]
  33. Hernández-Fernandez, J.; Rodríguez, E. Determination of phenolic antioxidants additives in industrial wastewater from polypropylene production using solid phase extraction with high-performance liquid chromatography. J. Chromatogr. A 2019, 1607, 460442. [Google Scholar] [CrossRef] [PubMed]
  34. He, S.; Jia, M.; Xiang, Y.; Song, B.; Xiong, W.; Cao, J.; Peng, H.; Yang, Y.; Wang, W.; Yang, Z.; et al. Biofilm on microplastics in aqueous environment: Physicochemical properties and environmental implications. J. Hazard. Mater. 2021, 424, 127286. [Google Scholar] [CrossRef] [PubMed]
  35. Hernández-Fernández, J.; Rayón, E.; López, J.; Arrieta, M.P. Enhancing the Thermal Stability of Polypropylene by Blending with Low Amounts of Natural Antioxidants. Macromol. Mater. Eng. 2019, 304, 1900379. [Google Scholar] [CrossRef]
  36. Bitter, H.; Lackner, S. Fast and easy quantification of semi-crystalline microplastics in exemplary environmental matrices by differential scanning calorimetry (DSC). Chem. Eng. J. 2021, 423, 129941. [Google Scholar] [CrossRef]
  37. Majewsky, M.; Bitter, H.; Eiche, E.; Horn, H. Determination of microplastic polyethylene (PE) and polypropylene (PP) in environmental samples using thermal analysis (TGA-DSC). Sci. Total Environ. 2016, 568, 507–511. [Google Scholar] [CrossRef]
  38. Mansa, R.; Zou, S. Thermogravimetric analysis of microplastics: A mini review. Environ. Adv. 2021, 5, 100117. [Google Scholar] [CrossRef]
  39. Chialanza, M.R.; Sierra, I.; Parada, A.P.; Fornaro, L. Identification and quantitation of semi-crystalline microplastics using image analysis and differential scanning calorimetry. Environ. Sci. Pollut. Res. 2018, 25, 16767–16775. [Google Scholar] [CrossRef]
  40. Werme, C.; Codiga, D.; Libby, P.; Carroll; Charlestra, L.; Keay, K. 2020 Outfall Monitoring Overview; Massachusetts Water Resources Authority: Boston, MA, USA, 2021. [Google Scholar]
  41. Birocchi, P.; Dottori, M.; Costa, C.D.G.R.; Leite, J.R.B. Study of three domestic sewage submarine outfall plumes through the use of numerical modeling in the São Sebastião channel, São Paulo state, Brazil. Reg. Stud. Mar. Sci. 2021, 42, 101647. [Google Scholar] [CrossRef]
  42. Ziajahromi, S.; Neale, P.A.; Rintoul, L.; Leusch, F.D.L. Wastewater treatment plants as a pathway for microplastics: Development of a new approach to sample wastewater-based microplastics. Water Res. 2017, 112, 93–99. [Google Scholar] [CrossRef]
  43. Shabaka, S.H.; Ghobashy, M.; Marey, R.S. Identification of marine microplastics in Eastern Harbor, Mediterranean Coast of Egypt, using differential scanning calorimetry. Mar. Pollut. Bull. 2019, 142, 494–503. [Google Scholar] [CrossRef]
  44. Turan, N.B.; Erkan, H.S.; Engin, G.O. Microplastics in wastewater treatment plants: Occurrence, fate and identification. Process Saf. Environ. Prot. 2020, 146, 77–84. [Google Scholar] [CrossRef]
  45. Choong, W.S.; Hadibarata, T.; Yuniarto, A.; Tang, K.H.D.; Abdullah, F.; Syafrudin, M.; Al Farraj, D.A.; Al-Mohaimeed, A.M. Characterization of microplastics in the water and sediment of Baram River estuary, Borneo Island. Mar. Pollut. Bull. 2021, 172, 112880. [Google Scholar] [CrossRef] [PubMed]
  46. Liu, W.; Zhang, J.; Liu, H.; Guo, X.; Zhang, X.; Yao, X.; Cao, Z.; Zhang, T. A review of the removal of microplastics in global wastewater treatment plants: Characteristics and mechanisms. Environ. Int. 2020, 146, 106277. [Google Scholar] [CrossRef] [PubMed]
  47. Mintenig, S.; Int-Veen, I.; Löder, M.; Primpke, S.; Gerdts, G. Identification of microplastic in effluents of waste water treatment plants using focal plane array-based micro-Fourier-transform infrared imaging. Water Res. 2017, 108, 365–372. [Google Scholar] [CrossRef] [PubMed]
  48. Mahon, A.M.; O’Connell, B.; Healy, M.; O’Connor, I.; Officer, R.; Nash, R.; Morrison, L. Microplastics in Sewage Sludge: Effects of Treatment. Environ. Sci. Technol. 2016, 51, 810–818. [Google Scholar] [CrossRef] [PubMed]
  49. Siddiqui, M.N.; Gondal, M.A.; Redhwi, H.H. Identification of different type of polymers in plastics waste. J. Environ. Sci. Health Part A 2008, 43, 1303–1310. [Google Scholar] [CrossRef]
Figure 1. Classification by shape of microplastics. (a) Present in the influent. (b) Present in the effluent.
Sustainability 14 04920 g001
Figure 2. DSC of the WWTP of the influent and effluent. (a) WWTP-1; (b) WWTP-2; (c) WWTP-3.
Sustainability 14 04920 g002aSustainability 14 04920 g002b
Table 1. Concentration of microplastics.
PlantSampleInfluentSampleEffluent
ConcentrationVolumeConcentrationVolume
(MP/L)L(MP/L)L
WWTP-1A1-1750A1-23.6235
A2-11045A2-24.1830
A3-18.597A3-23.6782
WWTP-2B1-17.135B1-20.4120
B2-19.1255B2-20.2840
B3-18.582B3-20.8267
WWTP-3C1-16.850C1-20.4635
C2-18.565C2-20.3750
C3-1898C3-20.5183
Table 2. Classification of the microplastics present.
PlantSampleInfluentSampleEffluent
10–1000 μm1000–5000 μmConcentration10–1000 μm1000–5000 μmConcentration
(MP/L) *(MP/L)(MP/L)(MP/L)(MP/L)(MP/L)
WWTP-1A1-12.24.87A1-23.580.0363.62
A2-13.76.310A2-24.10.0754.18
A3-12.955.558.5A3-23.640.0333.67
WWTP-2B1-11.25.97.1B1-20.4100.41
B2-12.36.829.12B2-20.2800.28
B3-11.956.568.5B3-20.8200.82
WWTP-3C1-11.65.26.8C1-20.450.0040.46
C2-12.575.98.5C2-20.370.0040.37
C3-12.295.758C3-20.5100.51
* MP/L: Microplastic particles per liter.
Table 3. Microplastics identified.
MaterialAbbreviation FormulaDensityTmOnset TemperatureSources
g/cm3°C°C
Low density polyethyleneLDPE(C2H4)n0.910–0.925118110Personal care products (such as body and facial scrubs), packaging films
food and water bottles
PolypropylenePP(C3H6)n0.83–0.92164161Synthetic textile fibers, water pipes, food and medicine containers
Polyethylene terephthalatePET(C10H8O4)n0.96–1.45248.5248.2Bottles and synthetic textile fibers
PolystyrenePS(C8H8)n1.04–1.1104.496.7Disposable plastic plates and cutlery, sound insulation material for hollow floors
Table 4. Area under the curve for each plastic identified in the influent and effluent.
MaterialPlant 1Plant 2Plant 3
InfluentEffluentInfluentEffluentInfluentEffluent
Area
mJ
%Area
mJ
%Area
mJ
%Area
mJ
%Area
mJ
%Area
mJ
%
PS2.2564%1.2284%----2.3035%1.5637%
PE-LD7.44314%4.04615%10.01120%3.00619%7.49916%4.15418%
PP23.13845%12.40845%24.18848%7.88050%19.84241%10.84346%
PET19.04137%9.98336%16.32132%4.95731%18.35838%7.15530%
Total51.878100%27.665100%50.520100%15.842100%48.001100%23.715100%
Table 5. Efficiency of WWTPs.
PlantSampleInfluentEffluentTotal Removal (%)
MP/LMP/L
WWTP-1A17.003.6248.3
A210.004.1858.2
A38.503.6756.8
WWTP-2B17.100.4194.16
B29.120.2896.9
B38.510.8290.4
WWTP-3C16.800.4693.3
C28.470.3795.6
C38.040.5193.67
Publisher’s Note: MDPI stays neutral with regard to jurisdictional claims in published maps and institutional affiliations.

