Article

Phenotypic and Molecular Characterization of Rice Genotypes’ Tolerance to Cold Stress at the Seedling Stage

1
Plant Breeding Division, Bangladesh Agricultural Research Institute (BARI), Gazipur 1701, Bangladesh
2
Plant Breeding Division, Bangladesh Rice Research Institute (BRRI), Gazipur 1701, Bangladesh
3
Department of Genetics and Plant Breeding, Bangabandhu Sheikh Mujibur Rahman Agricultural University (BSMRAU), Gazipur 1701, Bangladesh
4
Department of Physical Sport Science, College of Education, Princess Nourah bint Abdulrahman University, P.O. Box 84428, Riyadh 11671, Saudi Arabia
5
Department of Biology, College of Science, Taif University, P.O. Box 11099, Taif 21944, Saudi Arabia
6
Department of Agronomy, Bangladesh Wheat and Maize Research Institute, Dinajpur 5200, Bangladesh
*
Authors to whom correspondence should be addressed.
Sustainability 2022, 14(9), 4871; https://doi.org/10.3390/su14094871
Submission received: 20 March 2022 / Revised: 15 April 2022 / Accepted: 17 April 2022 / Published: 19 April 2022
(This article belongs to the Special Issue Plant Breeding Supporting the Sustainable Field Crop Production)

Abstract

:
Rice plants are affected by low-temperature stress during germination, vegetative growth, and reproductive stages. Thirty-nine rice genotypes including 36 near-isogenic lines (NILs) of BRRI dhan29 were evaluated to investigate the level of cold tolerance under artificially induced low temperature at the seedling stage. Three cold-related traits, leaf discolouration (LD), survivability, and recovery rate, were measured to determine the level of cold tolerance. Highly significant variation among the genotypes was observed for LD, survivability, and recovery rate. Three NILs, IR90688-74-1-1-1-1-1, IR90688-81-1-1-1-1-1, and IR90688-103-1-1-1-1-1, showed tolerance in all three traits, while IR90688-118-1-1-1-1-1 showed cold tolerance with LD and recovery rate. IR90688-92-1-1-1-1-1, IR90688-125-1-1-1-1-1, IR90688-104-1-1-1-1-1, IR90688-124-1-1-1-1-P2, IR90688-15-1-1-1-1-1, and IR90688-27-1-1-1-1-1 showed significantly higher yield coupled with short growth duration and good grain quality. Genetic analysis with SSRs markers revealed that the high-yielding NILs were genetically 67% similar to BRRI dhan28 and possessed cold tolerance at the seedling stage. These cold-tolerant NILs could be used as potential resources to broaden the genetic base of the breeding germplasm to develop high-yielding cold-tolerant rice varieties.

1. Introduction

Compared to other cereal crops, rice is more sensitive to low-temperature stress (LTS) as it has originated from tropical regions [1,2,3,4]. Cold stress negatively affects rice plants throughout various growth stages, from germination to maturity, and causes significant yield losses because of poor germination and seedling establishment, stunted growth pattern, non-vigorous plants, vast spikelet sterility, delay in flowering, and lower grain filling in the temperate, subtropical, and even in the tropical rice-growing regions [5,6,7,8,9,10]. Boro rice, which is grown from November to May in Bangladesh and some parts of Eastern India, is affected by LTS at both the seedling and reproductive stage. In the northern and north-eastern districts of Bangladesh, LTS at the seedling stage is a major problem for rice cultivation that seriously affects crop establishment. Seedling mortality occurs 10–90% of the time due to severe cold injury during transplanting in late December to early January [11]. Farmers are bound to replant the seedlings and, as a result, the cost of cultivation is increased. Sometimes, farmers delay the planting of the boro rice crops until the ambient temperature increases. Thus, they delay the next crop, which in turn results in the low total productivity of the farm. Moreover, it increases the risk of crop loss due to flash floods during the ripening stage in some low-lying areas of the north-eastern haors [4]. On the other hand, 100% spikelet sterility is observed in the short-duration rice varieties due to LTS at the booting stage of the rice crop during early to mid-February [12]. This problem could be resolved easily by developing cold-tolerant rice varieties. The success of a rice-breeding program depends on the presence of genetic variability among the parental lines used in it.
Genetic similarity/diversity can be assessed by using plant morphology, physiology, isozymes, storage protein profiles, DNA markers, etc. [13]. Among the different DNA markers, SSR markers have been extensively used as a powerful tool in variety protection [14], molecular diversity studies [15], quantitative trait loci (QTL) analysis, pedigree analysis, and marker-assisted breeding [16]. Morphological differences among near-isogenic lines (NILs) are very narrow [17]. The characterization of such a population is unrealistic if only based on morphological traits. Genetic analysis using molecular markers could reveal the difference between them at the DNA level. The molecular analysis of genes or QTLs underlying cold tolerance is the best approach, along with phenotypic cold tolerance screening. There are many reports available on QTL’s underlying cold tolerance in the literature [18,19,20,21,22,23,24,25,26]; however, most of these QTL were detected from japonica cultivars.
A wide range of variations in cold tolerance exists among rice germplasms [19,27] and, overall, Japonica rice germplasms are more tolerant to cold stress than the indica rice germplasm [28,29,30]. To enhance cold tolerance in the indica rice, the commonly grown rice varieties in south and southeast Asian countries, it is imperative to use germplasms from temperate rice-growing countries as donor parents in the breeding program [18]. Crosses between indica and japonica rice usually show spikelet sterility due to cross incompatibility. However, marker-assisted backcrossing can recover recurrent parental genomes successfully. NILs, thus developed, could be used directly as a cold-tolerant variety after necessary evaluation or as the cold-tolerant parent as a donor to introgress into an elite indica background. In this study, we evaluated a set of NILs derived from a cross between a cold-tolerant japonica rice variety, Jinbubyeo and BRRI dhan29, a mega rice variety [31] of the boro ecosystem, to select potential lines for direct varietal release or use in the breeding program as the donor parents for cold tolerance.

2. Materials and Methods

2.1. Sources of Materials Used

Thirty-six BC3F5 near-isogenic lines (NILs) derived from a cross between a Korean japonica variety (Jinbubyeo) and a Bangladeshi indica-type high-yielding rice variety (BRRI dhan29), along with four check varieties (BR1, BR18, BRRI dhan28, and BRRI dhan29), were evaluated for seedling stage cold tolerance and agronomic performance. The same set of NILs, along with their parents and cold-tolerant and susceptible check varieties, were used in genotyping to explore the genetic variability/similarity that exists among them. The seeds of the NILs and the check varieties (BR1, BR18, BRRI dhan28, and BRRI dhan29) were collected from the International Rice Research Institute (IRRI) and the Bangladesh Rice Research Institute (BRRI), respectively.

2.2. Evaluation of Near Isogenic Lines (NILs) for Cold Tolerance at Seedling Stage

The cold screening was performed using a cold water tank in the cold screening laboratory of the Bangladesh Rice Research Institute (BRRI) following the protocol described in Khatun et al. [32] (Figure 1). Briefly, 10 pre-germinated seeds of each genotype were sown in one-row plots spaced at 3.0 cm in plastic trays of 60 cm × 30 cm × 2.5 cm in size. The trays were filled with gravel and crop residue-free granular and fertilized soil. BR18 and BR1 were used as tolerant and susceptible check varieties, respectively, in each tray (Figure 1).
After seeding, a thin layer of fine granular soil was used to cover the germinating seeds. The seedlings were allowed to grow at ambient temperature. At the three-leaf stage (approximately 12–15 days after seeding depending on the ambient temperature), the plastic trays were placed in a cold water tank pre-set at 13 °C. Sensitivity to cold stress was recorded using arbitrary leaf discolouration (LD) scores (1 to 9), survivability, and recovery rate as described in Biswas et al. [4]. The LD score and survivability were recorded at seven days of cold treatment or when the susceptible check variety (BR1) died. After LD and survivability recording, the trays were placed at ambient temperature in a sunny place. The recovery rate was recorded 7 days after the removal of cold stress. The survivability and recovery rate were calculated as the percentage of the green plants to the total number of plants used in the screening activity following the formula given below:
Survivability   rate   ( % ) = No .   of   Green   plants × 100 No .   of   plants   treated ˙
Recovery   rate   ( % ) = No .   of   recovered   plants × 100 No .   of   plants   treated
The analysis of variance (ANOVA) and mean comparison of the LD scores, survivability, and recovery rate were performed using the analytical software Statistix version 10. Spearman correlation coefficients between the traits were calculated using the Corplot 0.92 package in R 3.6.2.

2.3. Evaluation of Near Isogenic Lines (NILs) for Agronomic Performance

All 36 NILs along with four check varieties were grown in the field following augmented RCB design [33]. At 35 days old, seedlings were transplanted with a single seedling per hill at a spacing of 20 cm × 20 cm in 5.4 m2 plots. The standard crop management protocol described in BRRI [34] was followed throughout the crop growth period. Observations on different morphological characters viz. plant height (PH), number of effective tillers per hill (ETPH), panicle length, number of fertile grains per panicle (FGPP), spikelet fertility (%), thousand-grain weight (g), growth duration (days), and grain yield per hill (g) were recorded at the appropriate growth stage of the rice plant following the descriptor for rice [35]. The data collected for all eight quantitative characteristics were subjected to analysis of variance for augmented block design according to the method suggested by Federer and Raghavarao [36]. The major descriptive statistics such as mean, range, and coefficient of variation were estimated following Panse and Sukhatme [37]. The plot means were analysed using standard statistical analysis suggested by Federer [33] and elaborated by Sharma [38]. The means of the genotypes were adjusted with the block effects, which were measured from the replicated check plots following the formula:
Rj = BjM
where, Rj = effect of jth block, Bj = mean of all check-in the jth block, and M = grand mean of the check.
Principal component analysis (PCA) was performed using the R package FactoMineR and visualized in biplot using the ggplot2 package.

2.4. Genetic Analysis of Near-Isogenic Lines (NILs) of BRRI dhan29 Using SSR Markers

A total of 58 simple sequence repeat (SSR) markers (Table S1) randomly distributed over 12 chromosomes of rice were used in the genotyping of 42 genotypes, including 36 NILs and their parents (BRRI dhan29 and Jinbubyeo), one susceptible check variety (BR1), and two tolerant check varieties (BR18 and Hbj. B. VI). Genomic DNA was isolated from young leaf tissues following the modified mini-scale method as described by Syed et al. [39]. The polymerase chain reaction (PCR) and gel electrophoresis were performed as described by Syed et al. [40]. Briefly, PCR was performed in 10 μL reactions containing 2 μL DNA template (around 50 ng), 1 μL of 10X TB buffer (containing 0.2 µL dd water; 0.5 µL of 1 M Tris-HCl, pH 8.4; 0.2 µL of 5 M KCl; 0.1 µL of 15 mM MgCl2; 0.00000001 g gelatin), 0.5 μL of 1 mMdNTPs, 0.5 μL each of 10 μM forward and reverse primers, 5.3 µL nano pure ddH2O, and 0.2 μLTaq DNA polymerase (5 U/μL) using a thermal cycler. After initial denaturation for 2 min at 94 °C, each cycle comprised 30 s of denaturation at 94 °C, 30 s of annealing at 55 °C, and 30 s of extension at 72 °C with a final extension for 5 min at 72 °C at the end of 32 cycles. After completion of the reaction, the PCR product was preserved at a temperature of 4 °C. The amplified PCR products were separated in 6% polyacrylamide gel at 100 V for 1.5 to 2.5 h against 1Kb DNA marker. DNA bands were visualized with the exposure to ultraviolet light in a gel documentation system and saved in jpeg format. Allele scoring was performed considering the relative position of the bands in the gel images compared to the position of parental bands. Summary statistics, including the number of alleles per locus, major allele frequency, and polymorphic information content (PIC) values, were determined using Power Marker version 3.25 [41] following the formula proposed by Anderson et al. [42].
PICi = j = 1 n ( P i j ) 2
where n is the number of marker alleles for marker i and Pij is the frequency of the jth allele for marker i.
Spearman’s correlation coefficient was analyzed using the cor.test() function in R studio. The formula for calculating the Spearman correlation is as follows:
r s = 1 6 d i 2 n ( n 2 1 )
where rs = Spearman correlation coefficient; di = the difference in the ranks given to the two variables values for each item of the data; n = total number of observations.
The genetic distance was calculated using Nei distance [43]. The similarity matrix was calculated with the Simqual sub-program using the Shannon coefficient [44] and subjected to cluster analysis by the unweighted pair group method for the arithmetic mean (UPGMA), and a dendrogram was generated using the program NTSYS-pc [45].

3. Results

3.1. Evaluation of NILs for Cold Tolerance at Seedling Stage

The analysis of variance for LD score, survivability, and recovery rate showed highly significant variation (p ≤ 0.01) among the genotypes (Table 1).

3.1.1. LD Score

LD scores among the genotypes varied from 2.2 to 8.2, with an average of 3.49 and CV of 15.17 (Table 1). The highest LD value was observed with the cold-susceptible check variety BR1 (8.2), which was statistically similar to those of IR90688-120-1-1-1-1-1, IR90688-124-1-1-1-1-P2, and BRRI dhan28 at the 5% level of significance. On the other hand, IR90688-103-1-1-1-1-1, IR90688-105-1-1-1-1-1, IR90688-5-1-1-1-1-1, IR90688-105-1-1-1-1-1, IR90688-118-1-1-1-1-1, IR90688-81-1-1-1-1-1, IR90688-20-1-1-1-1-1, and IR90688-74-1-1-1-1-1 showed significantly lower LD values than that of BR18, which showed a moderate level of cold tolerance (LD score of 5.0). In addition, IR90688-62-1-1-1-1-1, IR90688-42-1-1-1-1-p2, IR90688-96-1-1-1-1-1, IR90688-54-1-1-1-1-1, and BRRI dhan29 showed LD values ranging from 3.9 to 4.5, indicating a moderate level of cold tolerance at the seedling stage.

3.1.2. Survivability Rate

The survivability rate varied widely among the genotypes, ranging from 38.70% to 100% with 19.20% CV. Out of 39 genotypes, 31 showed more than 60% survivability, while susceptible variety BR1 showed only 38.7% survivability (Table 1). IR90688-81-1-1-1-1-1 showed the highest level of survivability (100%), followed by IR90688-103-1-1-1-1-1 (98.3%), IR90688-74-1-1-1-1-1 (95.0%), and IR90688-94-1-1-1-1-1 (90.9%), which were, in fact, not significantly different from the cold-tolerant check variety BR18 (76.9%), but were significantly different from the susceptible check variety BR1.

3.1.3. Recovery Rate

The recovery rate also showed a wide range of variations among the genotypes, starting from 31.5% to 92.6% with an average value of 69.07 (Table 1). Although the tolerant and susceptible check varieties showed no significant difference in recovery rate, 23 NILs showed significantly higher recovery than BR1, and 4 (IR90688-74-1-1-1-1-1, IR90688-103-1-1-1-1-1, IR90688-118-1-1-1-1-1, and IR90688-81-1-1-1-1-1) showed significantly higher recovery than even the cold-tolerant check variety BR18.

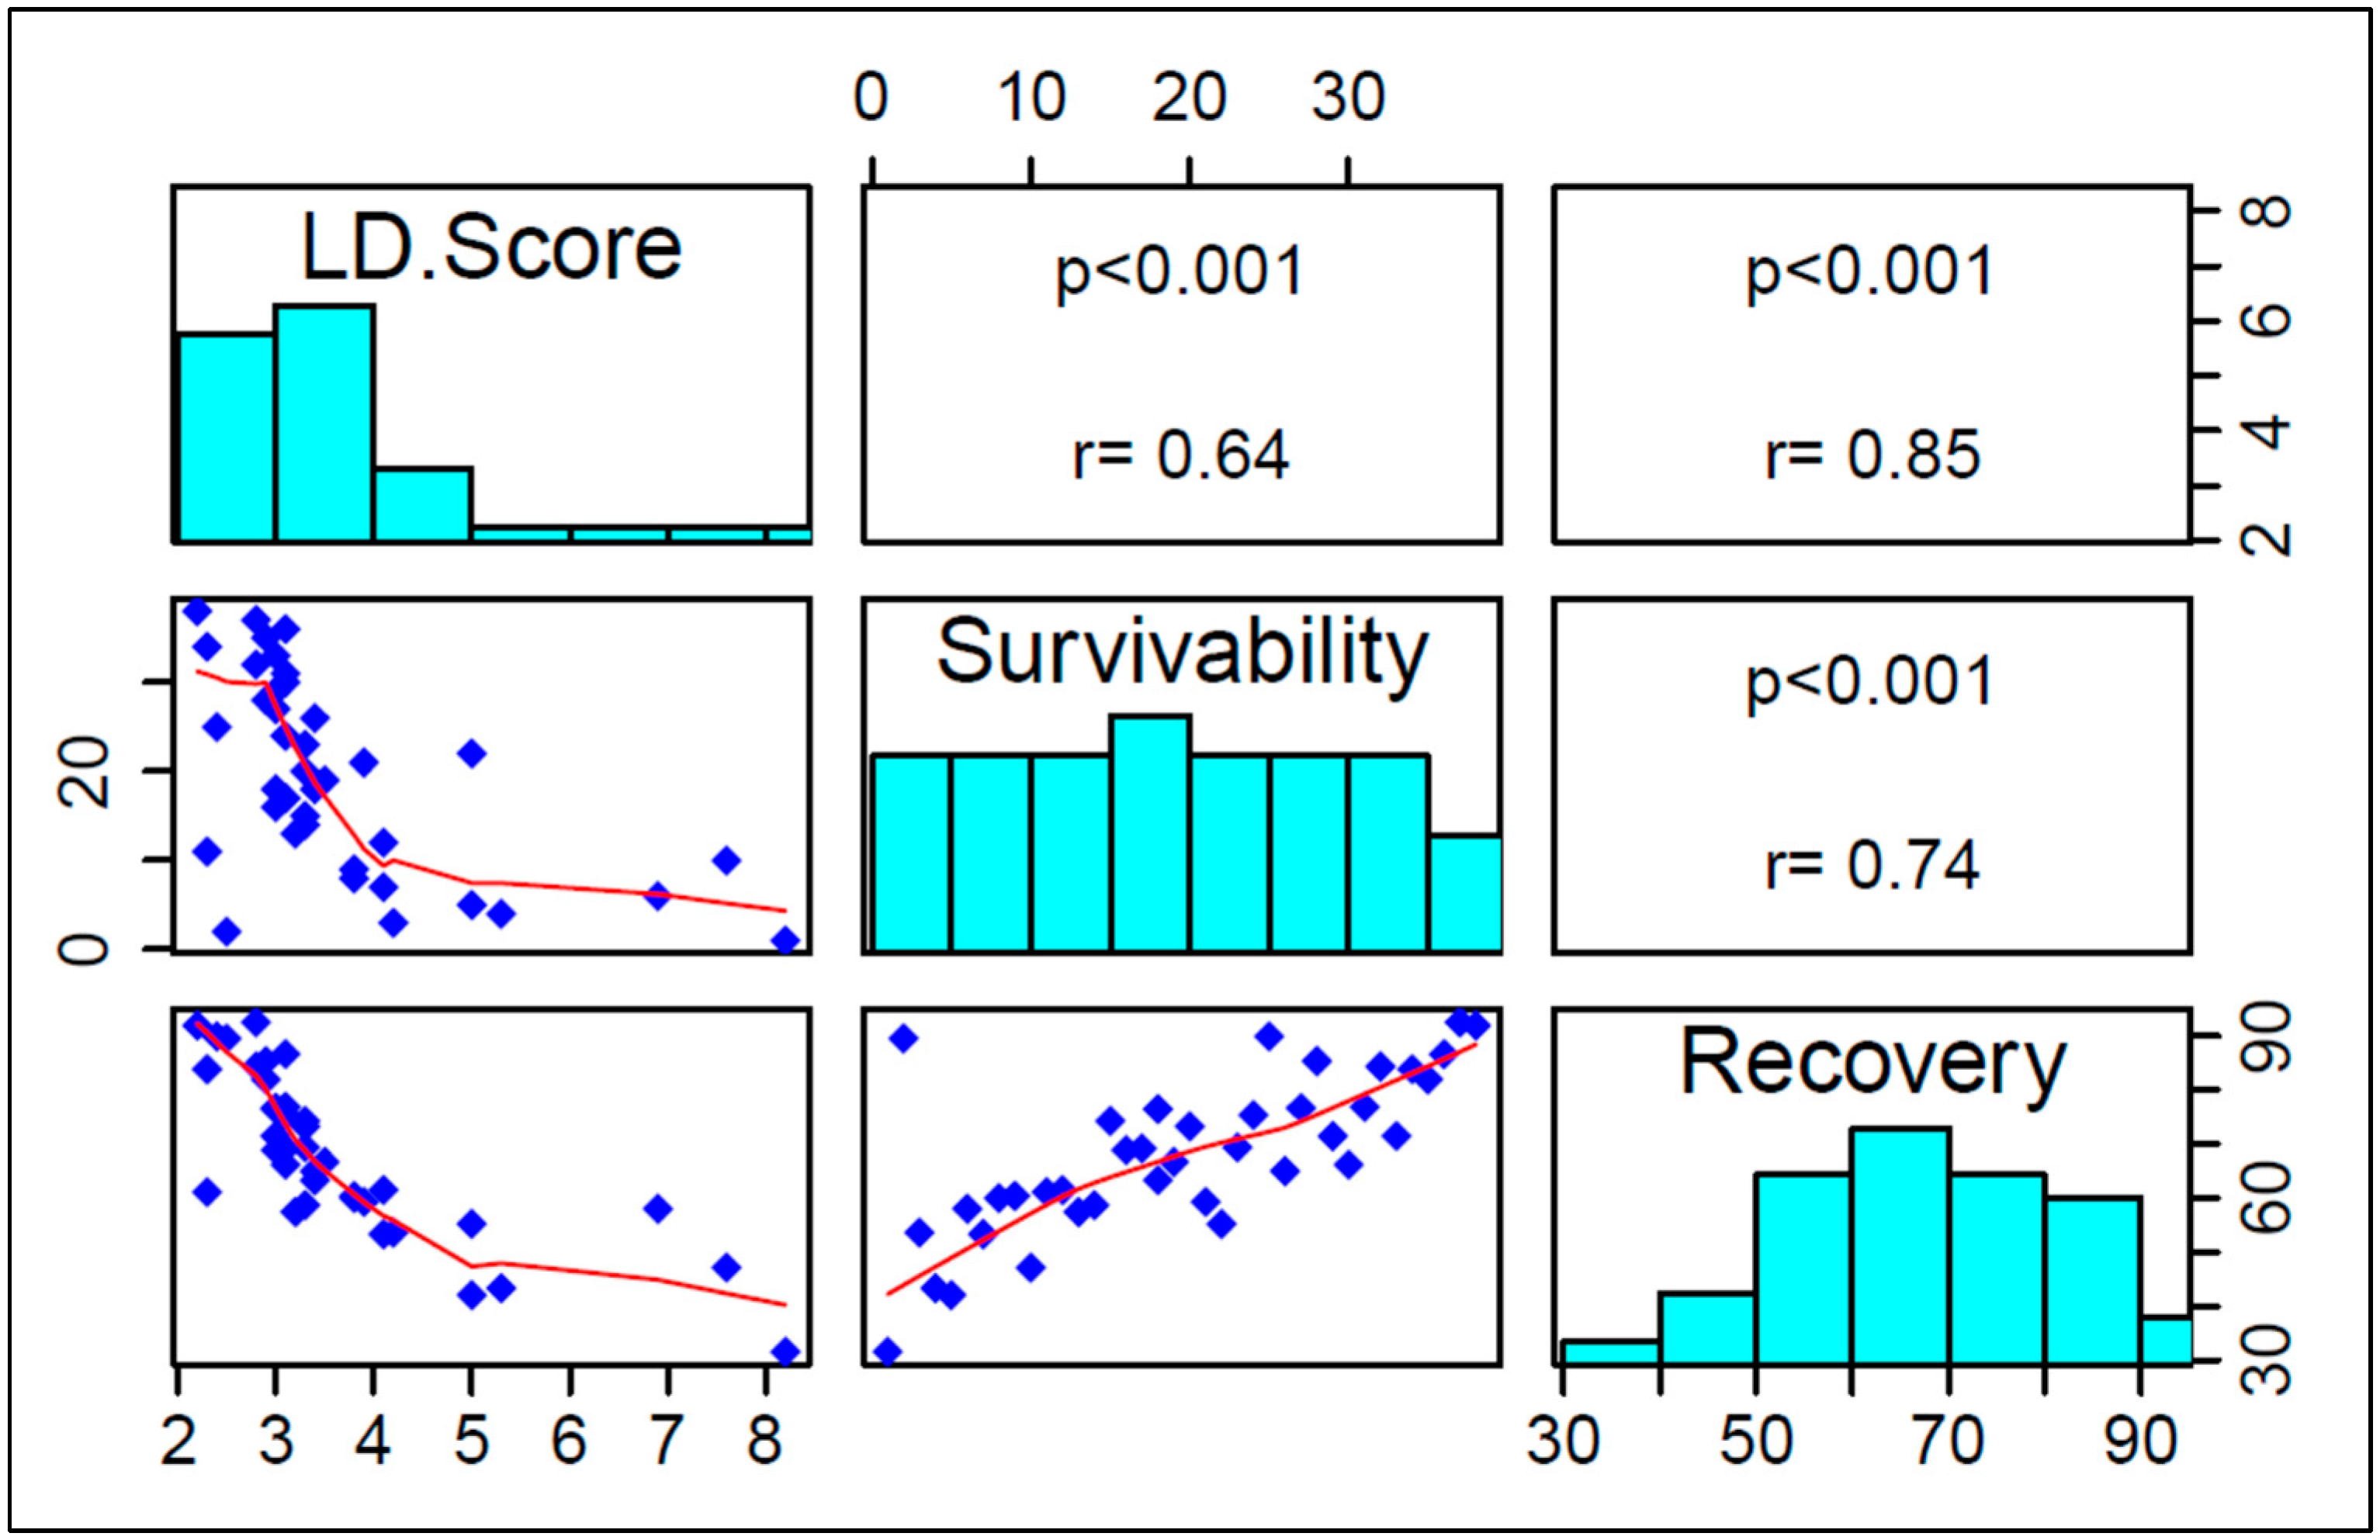
3.1.4. Correlation among LD Score, Survivability, and Recovery Rate

The Spearman correlation among the cold-responsive traits measured in this study showed that the LD score, survivability, and recovery rate were significantly correlated to each other (Figure 2).
The highest correlation coefficient was observed between LD score and recovery rate, and the lowest correlation was between LD score and survival rate. However, both were in a negative or reverse direction. The survival rate and recovery rate were positively correlated. The principal component analysis also showed that LD score was negatively associated with survivability and recovery rate (Figure 3).

3.2. Evaluation of NILs for Agronomic Performance

The NILs and the check varieties showed distinct genetic variation, particularly in grain yield per plant, the number of fertile grains per panicle, and % spikelet fertility. Days to flowering, plant height, and panicle length were also variable. Fertile grain per panicle had the widest range, followed by spikelet fertility. IR90688-92-1-1-1-1-1 had the highest value and IR90688-52-1-1-1-1-1 had the lowest value of FGPP. The ranges of panicle length, spikelet fertility, and thousand-grain weight were smaller compared to other characteristics. The maximum coefficient of variation was found in the case of fertile grain (12.7%) followed by grain yield per plant (11.43%).
The mean values of the NILs varied significantly from the check varieties for the characters measured in this study (Table 2). The check varieties also differed from each other. There were many NILs that exceeded the mean values of the four high-yielding check varieties. Eleven NILs showed a significantly higher yield than the susceptible check varieties BR1 and BRRI dhan28. Out of these 11 NILs, IR90688-92-1-1-1-1-1, IR90688-125-1-1-1-1-1, IR90688-104-1-1-1-1-1, IR90688-124-1-1-1-1-P2, IR90688-15-1-1-1-1-1, and IR90688-27-1-1-1-1-1 had a significantly shorter growth duration than BR1, while only IR90688-92-1-1-1-1-1 and IR90688-125-1-1-1-1-1 were on par with BRRI dhan28 in terms of days to maturity.
The NILs in this study were at an acceptable range in plant height except for one line (Table 1). The genotypes showing significantly higher yield than BR18 and BRRI dhan28 had an intermediate type plant height. Not only that, these lines had an acceptable range of ineffective tillers per hill and filled grain per panicle (82–160), but also had a good seed setting rate under natural field conditions. In addition, they had almost a similar amount of thousand-grain weight to that of BRRI dhan28 and BRRI dhan29, which are the most widely grown varieties in Bangladesh. Principal component analysis of the agronomic traits with the cold-related seedling traits showed that grain yield was highly associated with PH and FG than other traits measured in this study.

3.3. Genetic Analysis of NILs of BRRI dhan29 Using Microsatellite Markers

Out of 88 SSRs used in this study, 58 markers were found polymorphic, with an average polymorphism rate of 36.97%. Among the 58 SSRs, 11 markers were present on chromosome 1, 6 markers on each of chromosomes 2 and 3, 4 markers on each of chromosomes 4, 9, and 12, 2 markers on each of chromosomes 5 and 6, 5 markers on chromosome 7, 3 markers on each of chromosome 8 and 10, and 8 markers on chromosome 11. A total of 186 alleles of the polymorphic SSRs were detected in the 42 genotypes, including 36 NILs (Table 3).
The number of alleles generated by each marker varied from 2 to 5 alleles and with an average of 3.21 alleles per locus. The highest number of alleles (5) was detected with RM12769 and the lowest number (2) was detected in RM10800, RM16686, RM24087, RM26063, RM26501, RM512, and RM7558. The overall size of the PCR products of the tested markers ranged from 72 bp (RM413) to 551 bp (RM13155). The molecular size difference between the smallest and the largest allele for a given locus varied widely from 3 to 112 bp (Table 3). There was a considerable range in allele frequency (42.86–83.33%). On average, 57.31% of the genotypes shared a common allele.
The PIC value, which indicates the degrees of allelic diversity [46] and frequency among the varieties, was calculated for all of the markers. The PIC values for the microsatellite loci varied from 0.27 to 0.54 with a mean of 0.42. Among the markers used in the study, RM553 on chromosome 9 had the highest PIC value (0.54). RM581 and RM11570 on chromosome 1, RM3703 on chromosome 2, RM14795 on chromosome 3, and RM264 on chromosome 8 showed PIC values greater than 0.50.
The dendrogram constructed based on Shannon’s similarity index following the UPGMA method (Figure 4) showed that all of the genotypes were constellated into two distinct groups at a similarity index of 0.60. The first group housed 40 genotypes, while the second contained only 2 genotypes including an NIL and a cold-tolerant check variety, Hbj.B.VI. However, at the 0.67 similarity index, the genotypes were grouped into four major clusters, although the genotypes within the clusters were further subdivided into many subclusters based on the genetic similarity between them.
The genetic similarity within the individual cluster/group ranges from 0.60 to 0.96. Cluster 1, Cluster 2, Cluster 3, and Cluster 4 housed 25, 11, 4, and 2 genotypes, respectively. Housing the maximum number of genotypes, Cluster 1 was the most diverged cluster. The genotypes within Cluster 1 were further divided into many subgroups until 95% genetic similarity was reached. At 95% genetic similarity, IR90688-54-1-1-1-1-1 (G12) and IR90688-56-1-1-1-1-1 (G13) were grouped together. Cluster 1 was subdivided into 2, 3, 4, 5, 6, 7, 8, 9, 10, 12, 14, 16, 17, 18, 20, 23, 24, and 25 subgroups at a genetic similarity of 67.5, 68, 70, 71, 71.5, 72.75, 73, 73.5, 74.5, 75, 76, 77, 78, 78.5, 79.5, 85, 91, and 95%, respectively. Contrarily, Cluster 2 contained 11 genotypes. The genetic similarity within Cluster 2 varied from 68 to 92%. IR90688-42-1-1-1-1-P1 (G8), IR90688-42-1-1-1-1-P2 (G9), IR90688-73-1-1-1-P1 (G16), and IR90688-82-1-1-1-1-1 (G20) were housed in Cluster 3. In Cluster 4, two genotypes were grouped at 67.5% genetic similarity.

4. Discussion

Cold tolerance at the seedling and reproductive stage is very important for growing rice in the winter season or in cold stress conditions. The early vegetative stages, particularly at the germination and crop establishment stage and also the booting stages of rice, are very sensitive to LTS (Figure 1). An ambient temperature below 10–12 °C significantly increases seedling mortality in rice [47], resulting in poor crop establishment, which eventually turns into low yield. By assigning LD scores [48] upon exposure to LTS for seven days in artificially induced low temperature [32] and measuring the survivability and recovery rate, the genotypes with seedling-stage cold tolerance can easily be identified. In this study, we evaluated 36 NILs with cold tolerance and susceptible check varieties for seedling-stage cold tolerance. The genotypes showed a wide variation in LD scores, ranging from 2.2 to 8.2 with an average of 3.49 (Table 1). Suh et al. [49] also reported varying LD scores (3 to 8 with a mean value of 5) among 23 elite rice cultivars grown in a cold water-irrigated plot. In this study, the highest LD value was found with the cold-susceptible check variety BR1 (8.2). IR90688-120-1-1-1-1-1, IR90688-124-1-1-1-1-P2, and BRRI dhan28 showed no significant difference from BR1 in LD score at p < 0.05, indicating them to be cold-susceptible. Contrarily, IR90688-103-1-1-1-1-1, IR90688-105-1-1-1-1-1, IR90688-5-1-1-1-1-1, IR90688-105-1-1-1-1-1, IR90688-118-1-1-1-1-1, IR90688-81-1-1-1-1-1, IR90688-20-1-1-1-1-1, and IR90688-74-1-1-1-1-1 showed significantly lower LD values than the cold-tolerant check variety BR18. These results clearly revealed the capability of tolerance of the NILs to LTS. Additionally, IR90688-62-1-1-1-1-1, IR90688-42-1-1-1-1-p2, IR90688-96-1-1-1-1-1, IR90688-54-1-1-1-1-1, and BRRI dhan29 showed LD values ranging from 3.9 to 4.5, indicating a moderate level of cold tolerance at the seedling stage. Khatun et al. [32] reported a higher average LD score for BR1, moderate for BRRI dhan29, and the lowest LD score for BR18. Kundu [50] also reported similar findings from a cold-screening trial of a set of cold-tolerant japonica and indica donors, along with cold-susceptible cultivars.
The seedling survivability and recovery rate are very important for better crop establishment under LTS. In this study, the survivability and recovery rate varied widely among the genotypes, ranging from 38.70% to 100% and 31.5% to 92.6%, respectively. The susceptible variety BR1 showed only 38.7% survivability and 31.5% recovery rate (Table 1). IR90688-81-1-1-1-1-1 showed the highest level of survivability (100%), followed by IR90688-103-1-1-1-1-1 (98.3%), IR90688-74-1-1-1-1-1 (95.0%), and IR90688-94-1-1-1-1-1 (90.9%), which were, in fact, not significantly different from the cold-tolerant check variety BR18 (76.9%), but were significantly different from the susceptible check variety BR1. A total of 23 NILs showed a significantly higher recovery rate than BR1, with 4 of them (IR90688-74-1-1-1-1-1, IR90688-103-1-1-1-1-1, IR90688-118-1-1-1-1-1, and IR90688-81-1-1-1-1-1) showing significantly higher recovery than even the cold-tolerant check variety BR18. In a similar study with 10 landraces and 5 modern varieties as check genotypes, Shoroardi et al. [51] showed a higher reduction in seedling survival rate in BRRI dhan28, LR 212- NariaBochi, and LR 25-KathiGoccha and a lower reduction in BRRI dhan36, BRRI dhan29, LR 54- Tor Balam, and LR 114-Badiabona. The magnitude of the recovery rate was a little lower than the survivability rate, but they were positively correlated. The recovery rate, in fact, pronounced the real tolerance to LTS at the seedling stage.
For direct use in variety release or as a parental line in the breeding program, a breeding line should have higher yield potential in addition to its particular trait of interest. Therefore, we evaluated the NILs for yield and other agronomic performances under natural field conditions. Although the NILs were developed in the background of BRRI dhan29, they possessed distinct genetic variations, particularly in grain yield per plant, number of fertile grains per panicle, and % spikelet fertility [52]. Days to flowering, plant height, and panicle length were also variable among the NILs. The mean values of the NILs varied significantly from the check varieties for all of the characteristics measured in this study (Table 2). Eleven NILs showed significantly higher yields than the susceptible check varieties BR1 and BRRI dhan28. Out of these NILs, IR90688-92-1-1-1-1-1, IR90688-125-1-1-1-1-1, IR90688-104-1-1-1-1-1, IR90688-124-1-1-1-1-P2, IR90688-15-1-1-1-1-1, and IR90688-27-1-1-1-1-1 had a significantly shorter growth duration than BR1, while only IR90688-92-1-1-1-1-1 and IR90688-125-1-1-1-1-1 were on par with BRRI dhan28 in terms of days to maturity.
Plant height in rice is an important trait for the better adoption of a variety. Earlier study revealed that the taller plants usually produce a low yield [53]; through another study reported that short-statured plants also give a low yield some extends due to the production of low biomass [54]. The NILs in this study were at an acceptable range of plant height, except for one line (Table 1). The genotypes showing significantly higher yield than BR18 and BRRI dhan28 had intermediate type plant height. Not only did these lines have an acceptable range of effective tillers per hill and filled grain per panicle (82–160), but they also had a good seed setting rate under natural field conditions. In addition, they had an almost similar amount of thousand-grain weight to that of BRRI dhan28 and BRRI dhan29, which are the most widely grown varieties in Bangladesh. The principal component analysis of the agronomic traits with the cold-related seedling traits showed that grain yield was more highly associated with PH and FG than other traits measured in this study.
In addition to measuring yield potential, genetic diversity in the parental lines is very important for the genetic improvement of rice through breeding. Strong genetic diversity means diverse morphological traits and potentially valuable genetic information. Rice varieties/lines with high levels of genetic variation are essential resources for broadening the genetic base of the breeding germplasm, and therefore laying a good foundation for rice breeding [55]. Hence, the assessment of genetic diversity becomes important in establishing relationships among different cultivars. SSR markers are widely used in the analysis of genetic diversity among the germplasms [56].
Usually, NILs are developed through multiple backcrossing, meaning they are very close to each other as they share the majority of the recipient parental genome. In this study, we used BC3F5 NILs developed from a cross between a Korean japonica variety Jinbubyeo and a Bangladeshi high-yielding rice variety BRRI dhan29, but they showed considerable variations in different agronomic traits. We analysed the NILs along with their parents, cold-tolerant and susceptible varieties, using 58 polymorphic SSR markers randomly distributed over 12 chromosomes to estimate the genetic similarity/dissimilarity between them. A total of 186 alleles of the polymorphic SSRs were detected in the genetic analysis of the 42 genotypes, including 36 NILs (Table 3). The number of alleles generated by each marker varied from 2 to 5 alleles and with an average of 3.21 alleles per locus. The highest number of alleles (five) was detected in the locus RM12769 and the lowest number of alleles (two) was detected in seven SSR loci, namely RM10800, RM16686, RM24087, RM26063, RM26501, RM512, and RM7558. The overall size of the PCR products of the tested markers ranged from 72 bp (RM413) to 551 bp (RM13155). The molecular size difference between the smallest and the largest allele for a given locus varied widely, from 3 to 112 bp (Table 3).
The PIC value, which indicates the degrees of allelic diversity [46], varied from 0.27 to 0.54 with a mean of 0.42. The higher the PIC value, the greater the diversity within the germplasm; contrarily, a lower PIC value indicates that less divergence between the genotypes and they are closely related [40,57] in terms of the specific marker loci. Among the markers used in this study, RM553 on chromosome 9 had the highest PIC value (0.54). Two SSRs (RM581, RM11570) on chromosome 1, one SSR (RM3703) on chromosome 2, one SSR (RM14795) on chromosome 3, and one SSR (RM264) on chromosome 8 showed PIC values greater than 0.50, indicating that these are highly informative markers. An informative marker can easily and clearly discriminate the germplasm based on its band intensity and position relative to others [58]. Thus, highly informative markers are considered to be the best markers for diversity analysis. The six informative SSR markers identified from this study could be useful for future genetic studies of rice, particularly for marker-assisted breeding and QTL identification.
The UPGMA dendrogram constructed based on Shannon’s similarity index (Figure 4) grouped all of the genotypes into two distinct clusters at a similarity index of 0.60. However, at the 0.67 similarity index, the genotypes were grouped into four major clusters, although the genotypes within the clusters were further subdivided into many subclusters based on the genetic similarity between them. Cluster 1, Cluster 2, Cluster 3, and Cluster 4 housed 25, 11, 4, and 2 genotypes, respectively. Housing the maximum number of genotypes, Cluster 1 was the most diverged cluster. The genotypes within Cluster 1 were further divided into many subgroups until 95% genetic similarity was reached. At 95% genetic similarity, IR90688-54-1-1-1-1-1 (G12) and IR90688-56-1-1-1-1-1 (G13) were grouped together. The genetic similarity among the genotypes in Cluster 1 ranged from 67.5% to 95%. The majority of the cold-tolerant and high-yielding NILs were grouped into Cluster 1. Contrary, Cluster 2 contained 11 genotypes, which were mostly poor yielders except for BR1 (G37), BR18 (G38), and BRRI dhan29 (G40). In this cluster, both cold-tolerant and susceptible varieties remained together, but they entered into different subgroups at a 0.77 similarity index. The most interesting thing is that Hbj. B.VI (G42), a cold-tolerant local variety for both seedling and reproductive stage [26], and IR90688-124-1-1-1-1-P2 (G35), which showed moderate tolerance to cold stress at the seedling stage (Table 1) and high yield (Table 2), were grouped into Cluster 4 with approximately 68% genetic similarity. Therefore, the crosses between IR90688-124-1-1-1-1-P2 and Hbj.B.VI could produce high yielding and cold-tolerant progenies. Not only these combinations, but also the cross combination between the lines of Cluster 4 with the high-yielding and cold-tolerant lines in Cluster 1, would produce cold-tolerant and high-yielding progeny.

5. Conclusions

Highly significant variation among the genotypes was observed for three cold-related traits at the seedling stage, namely, leaf discolouration score, survivability, and recovery rate. Nine NILs showed strong cold tolerance in at least one of three cold-related traits. Three NILs, IR90688-74-1-1-1-1-1, IR90688-81-1-1-1-1-1, and IR90688-103-1-1-1-1-1, showed tolerance to cold stress with all three traits, while IR90688-118-1-1-1-1-1 showed cold tolerance with LD score and recovery rate. In a field experiment, 11 NILs showed significantly higher yields than the susceptible check varieties BR1 and BRRI dhan28. Out of these 11 NILs, IR90688-92-1-1-1-1-1, IR90688-125-1-1-1-1-1, IR90688-104-1-1-1-1-1, IR90688-124-1-1-1-1-P2, IR90688-15-1-1-1-1-1, and IR90688-27-1-1-1-1-1 had significantly shorter growth duration than BR1, while only IR90688-92-1-1-1-1-1 and IR90688-125-1-1-1-1-1 were on par with BRRI dhan28 in terms of days to maturity. In addition, these lines had grain quality similar to BRRI dhan28 and BBRI dhan29. In the genetic analysis with 58 polymorphic SSRs, a total of 186 alleles were detected and the number of alleles per marker varied from 2 to 5, with an average of 3.21 alleles per locus. Six SSRs showed PIC values greater than 0.50, indicating that these are the best markers in discriminating the NILs derived from the cross between Jinbubyeo and BRRI dhan29. The Shannon similarity index-based dendrogram grouped the NILs at 67% genetic similarity into four major distinct clusters, in which 25 genotypes, including the high-yielding NILs and high-yielding variety BRRI dhan28, constellated together. One high-yielding NIL, IR90688-124-1-1-1-1-P2, with a moderate level of cold tolerance was grouped; however, genotype Hbj. Boro VI has been found to be a cold-tolerant local variety for both the seedling and reproductive stages, as it is a member of the two-genotype cluster. Therefore, the cold-tolerant and high-yielding NILs identified in this study could be a potential genetic resource to develop high-yielding, cold-tolerant rice varieties. The QTL mapping from the local variety Hbj. Boro VI may be considered to generate marker information, aiming to introgress into the locally adapted existing rice varieties for the sustainability of rice production during extremely cold stress conditions.

Supplementary Materials

The following supporting information can be downloaded at: https://www.mdpi.com/article/10.3390/su14094871/s1, Table S1: List of 88 SSR markers used for diversity analysis of rice cultivars.

Author Contributions

Conceptualization: N.A., N.A.I., M.A.S. and P.S.B.; methodology: N.A., N.A.I., M.A.S. and P.S.B.; formal analysis: N.A., N.A.I., M.A.S. and P.S.B.; data curation: N.A., M.A.S. and A.H.; statistical expertise: N.A., M.A.S. and A.H.; writing—original draft preparation: N.A., N.A.I., M.A.S. and P.S.B.; writing—review and editing: A.G., A.M.A. and A.H.; visualization: N.A., N.A.I., M.A.S. and P.S.B.; supervision: P.S.B.; funding acquisition: A.M.A., A.G. and A.H. All authors have read and agreed to the published version of the manuscript.

Funding

The work was financially supported by three institutes, namely, the Bangladesh Agricultural Research Institute, Bangabandhu Sheikh Mujibur Rahman Agricultural University, and the Bangladesh Rice Research Institute, Gazipur, Bangladesh. The research program also partially supported Princess Nourah bint Abdulrahman University Researchers Supporting Project number (PNURSP2022R65), Princess Nourah bint Abdulrahman University, Riyadh, Saudi Arabia.

Institutional Review Board Statement

Not applicable.

Informed Consent Statement

Not applicable.

Data Availability Statement

Data are available upon request.

Acknowledgments

The authors wish to acknowledge the financial support provided by Bangladesh Agricultural Research Institute, Bangabandhu Sheikh Mujibur Rahman Agricultural University, and the Bangladesh Rice Research Institute, Gazipur, Bangladesh. The authors appreciated Princess Nourah bint Abdulrahman University Researchers Supporting Project number (PNURSP2022R65), Princess Nourah bint Abdulrahman University, Riyadh, Saudi Arabia, for providing financial support for the publication of this research.

Conflicts of Interest

The authors declare no conflict of interest.

References

  1. Saito, K.; Miura, K.; Nagano, K.; Saito, Y.H.; Araki, H.; Kato, A. Identification of two closely linked quantitative trait loci for cold tolerance on chromosome 4 of rice and their association with anther length. Theor. Appl. Genet. 2001, 103, 862–868. [Google Scholar] [CrossRef]
  2. Nahar, K.; Biswas, J.K.; Shamsuzzaman, A.M.M.; Hasanuzzaman, M.; Barman, H.N. Screening of Indica Rice (Oryza sativa L.) genotypes against low temperature stress. Bot. Res. Int. 2009, 2, 295–303. [Google Scholar]
  3. Zeng, Y.; Zhang, Y.; Xiang, J.; Uphoff, N.T.; Pan, X.; Zhu, D. Effects of low temperature stress on spikelet-related parameters during anthesis in indica–japonica hybrid rice. Front. Plant Sci. 2017, 8, 1350. [Google Scholar] [CrossRef] [PubMed] [Green Version]
  4. Biswas, P.S.; Rashid, M.A.; Khatun, H.; Yasmeen, R.; Biswas, J.K. Scope and progress of rice research harnessing cold tolerance. In Advances in Rice Research for Abiotic Stress Tolerance; Hasanuzzaman, M., Fujita, M., Nahar, K., Biswas, J.K., Eds.; Elsevier Inc. & Woodland Publishing: Cambridge, UK, 2019; pp. 225–280. [Google Scholar]
  5. Ranawake, A.L.; Manangkil, O.E.; Yoshida, S.; Ishii, T.; Mori, N.; Nakamura, C. Mapping QTLs for cold tolerance at germination and the early seedling stage in rice (Oryza sativa L.). Biotechnol. Biotechnol. Equip. 2014, 28, 989–998. [Google Scholar] [CrossRef] [PubMed]
  6. Martínez-Eixarch, M.; Ellis, R.H. Temporal sensitivities of rice seed development from spikelet fertility to viable mature seed to extreme-temperature. Crop Sci. 2015, 55, 354–364. [Google Scholar] [CrossRef] [Green Version]
  7. Schläppi, M.R.; Jackson, A.K.; Eizenga, G.C.; Wang, A.; Chu, C.; Shi, Y.; Shimoyama, N.; Boykin, D.L. Assessment of five chilling tolerance traits and GWAS mapping in rice using the USDA mini-core collection. Front. Plant Sci. 2017, 8, 957. [Google Scholar] [CrossRef] [PubMed] [Green Version]
  8. Shakiba, E.; Edwards, J.D.; Jodari, F.; Duke, S.E.; Baldo, A.M.; Korniliev, P.; McCouch, S.; Eizenga, G.C. Genetic architecture of cold tolerance in rice (Oryza sativa) determined through high resolution genome-wide analysis. PLoS ONE 2017, 12, e0172133. [Google Scholar] [CrossRef] [PubMed]
  9. Liang, Y.; Meng, L.; Lin, X.; Cui, Y.; Pang, Y.; Xu, J.; Li, Z. QTL and QTL networks for cold tolerance at the reproductive stage detected using selective introgression in rice. PLoS ONE 2018, 13, e0200846. [Google Scholar] [CrossRef] [Green Version]
  10. Xiao, N.; Gao, Y.; Qian, H.; Gao, Q.; Wu, Y.; Zhang, D.; Li, A. Identification of genes related to cold tolerance and a functional allele that confers cold tolerance. Plant Physiol. 2018, 177, 1108–1123. [Google Scholar] [CrossRef] [Green Version]
  11. Rashid, M.M.; Yasmeen, R. Cold Injury and Flash Flood Damage in Boro Rice Cultivation in Bangladesh, A Review. Bangladesh Rice J. 2017, 21, 13–25. [Google Scholar] [CrossRef]
  12. Biswas, J.K.; Mahbub, M.A.A.; Kabir, M.S. Critical temperatures and their probabilities on important growth stages of rice. In Annual Report of Bangladesh Rice Research Institute, 2008–2009; Bashar, M.K., Biswas, J.C., Kashem, M.A., Eds.; Bangladesh Rice Research Institute (BRRI): Gazipur, Bangladesh, 2011; pp. 127–129. [Google Scholar]
  13. Fuentes, J.L.; Escobar, F.; Alvarez, A.; Gallego, G.; Duque, M.C.; Ferrer, M.; Deus, J.E.; Tohme, J. Analyses of genetic diversity in Cuban rice varieties using isozyme, RAPD and AFLP markers. Euphytica 1999, 109, 107–115. [Google Scholar] [CrossRef]
  14. Rongwen, J.; Akakya, M.S.; Bhagwat, A.A.; Lavi, U.; Cregan, P.B. The use of microsatellite DNA markers for soybean genotype identification. Theor. Appl. Genet. 1995, 90, 43–48. [Google Scholar] [CrossRef]
  15. Sebastian, L.S.; Hipolito, L.R.; Tabanao, D.A.; Maramara, G.V.; Caldo, R.A. Molecular diversity of Philippines-based rice cultivars. SABRAO J. Breed. Genet. 1998, 30, 83–90. [Google Scholar]
  16. Chen, X.; Temnykh, S.; Xu, Y.; Choand, Y.G.; McCouch, S.R. Development of a microsatellite framework map providing genome wide coverage in rice (Oryza sativa L.). Theor. Appl. Genet. 1997, 95, 553–567. [Google Scholar] [CrossRef]
  17. Keurentjes, J.J.; Bentsink, L.; Alonso-Blanco, C.; Hanhart, C.J.; Blankestijn-De Vries, H.; Effgen, S.; Vreugdenhil, D.; Koornneef, M. Development of a Near-Isogenic Line Population of Arabidopsis Thaliana and Comparison of Mapping Power with a Recombinant Inbred Line Population. Genetics 2007, 175, 891–905. [Google Scholar] [CrossRef] [PubMed] [Green Version]
  18. Andaya, V.C.; Mackill, D.J. Mapping of QTLs associated with cold tolerance during the vegetative stage in rice. J. Exp. Bot. 2003, 54, 2579–2585. [Google Scholar] [CrossRef] [PubMed]
  19. Lou, Q.; Chen, L.; Sun, Z.; Xing, Y.; Li, J.; Xu, X.; Mei, H.; Luo, L. A major QTL associated with cold tolerance at seedling stage in rice (Oryza sativa L.). Euphytica 2007, 158, 87–94. [Google Scholar] [CrossRef]
  20. Zhi, J.I.; Zeng, Y.X.; Zeng, D.I.; Ma, L.Y.; Li, X.M.; Liu, B.X.; Yang, C.D. Identification of QTLs for rice cold tolerance at plumule and 3-leaf-seedling stages by using QTL Network software. Rice Sci. 2010, 17, 282–287. [Google Scholar]
  21. Suh, J.; Lee, C.; Lee, J.; Kim, J.; Kim, S.; Cho, Y.; Park, S.; Shin, J.; Kim, Y.; Jena, K.K. Identification of quantitative trait loci for seedling cold tolerance using RILs derived from a cross between Japonica and tropical Japonica rice cultivars. Euphytica 2012, 184, 101–108. [Google Scholar] [CrossRef]
  22. Su, C.F.; Wang, Y.C.; Hsieh, T.H.; Lu, C.A.; Tseng, T.H.; Yu, S.M. A novel MYBS3-dependent pathway confers cold tolerance in rice. Plant Physiol. 2010, 153, 145–158. [Google Scholar] [CrossRef] [Green Version]
  23. Yang, Z.; Huang, D.; Tang, W.; Zheng, Y.; Liang, K. Mapping of quantitative trait loci underlying cold tolerance in rice seedlings via high-throughput sequencing of pooled extremes. PLoS ONE 2013, 8, e68433. [Google Scholar] [CrossRef] [Green Version]
  24. Park, I.K.; Oh, C.S.; Kim, D.M.; Yeo, S.M.; Ahn, S.N. QTL mapping for cold tolerance at the seedling stage using introgression lines derived from an inter sub-specific cross in rice. Plant Breed. Biotech. 2013, 1, 18. [Google Scholar] [CrossRef] [Green Version]
  25. Zhang, S.; Zheng, J.; Liu, B.; Peng, S.; Leung, H.; Zhao, J.; Huang, Z. Identification of QTLs for cold tolerance at seedling stage in rice (Oryza sativa L.) using two distinct methods of cold treatment. Euphytica 2014, 195, 95–104. [Google Scholar] [CrossRef]
  26. Biswas, P.S.; Khatun, H.; Das, N.; Sarker, M.M.; Anisuzzaman, M. Mapping and validation of QTLs for cold tolerance at seedling stage in rice from an indica cultivar Habiganj Boro VI (Hbj. B. VI). 3 Biotech. 2017, 7, 359. [Google Scholar] [CrossRef]
  27. Andaya, V.; Tai, T. Fine mapping of the qCTS12 locus, a major QTL for seedling cold tolerance in rice. Theor. Appl. Genet. 2003, 113, 467–475. [Google Scholar] [CrossRef] [PubMed]
  28. Glaszmann, J.C.; Kaw, R.N.; Khush, G.S. Genetic divergence among cold tolerant rices (Oryza sativa L.). Euphytica 1990, 5, 95–104. [Google Scholar] [CrossRef]
  29. Pan, Y.; Zhang, H.; Zhang, D.; Li, J.; Xiong, H.; Yu, J.; Li, J.; Rashid, M.A.R.; Li, G.; Ma, X.; et al. Genetic analysis of cold tolerance at the germination and booting stages in rice by association mapping. PLoS ONE 2015, 10, e0120590. [Google Scholar] [CrossRef] [PubMed] [Green Version]
  30. Lv, Y.; Guo, Z.; Li, X.; Ye, H.; Xiong, L. New insights into the genetic basis of natural chilling and cold shock tolerance in rice by genome-wide association analysis. Plant Cell Environ. 2016, 39, 556–570. [Google Scholar] [CrossRef] [Green Version]
  31. Kabir, M.S.; Salam, M.U.; Chowdhury, A.; Rahman, N.M.F.; Iftekharuddaula, K.M.; Rahman, M.S.; Rashid, M.H.; Dipti, S.S.; Islam, A.; Latif, M.A.; et al. Rice Vision for Bangladesh, 2050 and Beyond. Bangladesh Rice J. 2015, 19, 1–18. [Google Scholar] [CrossRef]
  32. Khatun, H.; Biswas, P.S.; Hwang, H.G.; Kim, K.M. A Quick and Simple In-house Screening Protocol forCold-Tolerance at Seedling Stage in Rice. Plant Breed. Biotech. 2016, 4, 373–378. [Google Scholar] [CrossRef]
  33. Federer, W.T. Augmented Design. Hawaiin Plant. Rec. 1956, 40, 191–207. [Google Scholar] [CrossRef] [Green Version]
  34. BRRI (Bangladesh Rice Research Institute). Annual Research Review; Bangladesh Rice Research Institute: Gazipur, Bangladesh, 2013. [Google Scholar]
  35. IRRI (International Rice Research Institute). Minimum List of Descriptors and Descriptor-States for Rice (Oryza sativa L.); IRRI: Los Baños, Philippines, 1980; p. 20. [Google Scholar]
  36. Federer, W.T.; Raghavarao, D. An augmented designs. Biometrics 1975, 31, 29–35. [Google Scholar] [CrossRef] [Green Version]
  37. Panse, V.G.; Sukhatme, P.V. Statistical Methods for Agricultural Workers, 2nd ed.; ICAR: New Delhi, India, 1964. [Google Scholar]
  38. Sharma, J.R. Augmented Design Model-II in Statistical and Biometrical Techniques in Plant Breeding; New Age International Publications: New Delhi, India, 1998. [Google Scholar]
  39. Syed, M.A.; Iftekharuddaula, K.M.; Mian, M.A.K.; Rasul, M.G.; Rahmam, G.K.M.M.; Panaullah, G.M.; Biswas, P.S. Main effect QTLs associated with arsenic phyto-toxicity tolerance at seedling stage in rice (Oryza sativa L.). Euphytica 2016, 209, 805–814. [Google Scholar] [CrossRef]
  40. Syed, M.A.; Iftekharuddaula, K.M.; Biswas, P.S.; Akter, N.; Hossain, M. Assessment of genetic diversity in arsenic contaminated rice using SSR markers. Trends Appl. Sci. Res. 2019, 14, 178–185. [Google Scholar]
  41. Liu, K.; Muse, S.V. Power Marker, an integrated analysis environment for genetic marker analysis. Bioin 2005, 21, 2128–2129. [Google Scholar] [CrossRef] [Green Version]
  42. Anderson, J.A.; Churchill, G.A.; Autique, J.E.; Tanksley, S.D.; Sorreils, M.E. Optimizing parental selection for genetic-linkage maps. Genome 1993, 36, 181–186. [Google Scholar] [CrossRef]
  43. Nei, M. The theory and estimation of genetic distance. In Genetic Structure of Populations; Morton, N.E., Ed.; University of Hawaii Press: Honolulu, HI, USA, 1973; pp. 45–54. [Google Scholar]
  44. Shannon, C.E. A mathematical theory of communication. Bell Syst. Tech. J. 1948, 27, 379–423. [Google Scholar] [CrossRef] [Green Version]
  45. Rohlf, F.J. NTSYS-pc. In Numerical Taxonomy and Multivariate Analysis System; Exeter Software: Setauket, NY, USA, 2002. [Google Scholar]
  46. Botstein, D.; White, R.L.; Skalnick, M.H.; Davies, R.W. Construction of a genetic linkage map in man using restriction fragment length polymorphism. Am. J. Hum. Genet. 1980, 32, 314–331. [Google Scholar]
  47. Ye, C.; Fukai, S.; Godwin, D.I.; Reinke, R.; Snell, P.; Schiller, J.; Basnayake, J. Cold tolerance in rice varieties at different growth stages. Crop Pasture Sci. 2009, 60, 328–338. [Google Scholar] [CrossRef]
  48. International Rice Research Institute (IRRI). Standard Evaluation System (SES) for Rice, 5th ed.; IRRI: Manila, Philippines, 2013; p. 35. [Google Scholar]
  49. Suh, J.-P.; Cho, Y.-C.; Lee, J.-H.; Lee, S.-B.; Jung, J.-Y.; Choi, I.-S.; Kim, M.-K.; Kim, C.-K.; Jena, K.-K. SSR Analysis of Genetic Diversity and Cold Tolerance in Temperate Rice Germplasm. Plant Breed. Biotech. 2013, 106, 103–110. [Google Scholar] [CrossRef] [Green Version]
  50. Kundu, A. Haplotype Diversity Analysis in Cold Tolerant Rice (Oryza sativa L.). Master’s Thesis, Department of Biotechnology, Bangabandhu Sheikh MujiburRahman Agricultural University, Gazipur, Bangladesh, 2015. [Google Scholar]
  51. Shoroardi, M.; Mortuza, M.G.; Islam, M.M.; Samih, T. Phenotypic Screening and Molecular Characterization of 10 Rice (Oryza sativa) Landraces for Cold Tolerance. J. Environ. Sci. Nat. Resour. 2017, 10, 85–91. [Google Scholar] [CrossRef] [Green Version]
  52. Kim, S.M.; Suh, J.P.; Lee, C.K.; Lee, J.H.; Kim, Y.G.; Jena, K.K. QTL mapping and development of candidate gene-derived DNA markers associated with seedling cold tolerance in rice (Oryza sativa L.). Mol. Genet. Genom. 2014, 289, 333–343. [Google Scholar] [CrossRef] [PubMed]
  53. Setter, T.L.; Laureles, E.V.; Mazaredo, A.M. Lodging reduces yield of rice by self-shading and reductions in canopy photosynthesis. Field Crops Res. 1997, 49, 95–106. [Google Scholar] [CrossRef]
  54. Zhang, Y.; Yu, C.; Lin, J.; Liu, J.; Liu, B.; Wang, J.; Zhao, T. OsMPH1 regulates plant height and improves grain yield in rice. PLoS ONE 2017, 12, e0180825. [Google Scholar] [CrossRef] [Green Version]
  55. Upadhyay, P.; Neeraja, C.N.; Kole, C.; Singh, V.K. Population structure and genetic diversity in popular rice varieties of India as evidenced from SSR analysis. Biochem. Genet. 2012, 50, 770–783. [Google Scholar] [CrossRef]
  56. Kostova, A.; Todorovska, E.; Christov, N.; Hristov, K.; Atanassov, A. Assessment of genetic variability induced by chemical mutagenesis in elite maize germplasm via SSR markers. J. Crop Improv. 2006, 16, 37–48. [Google Scholar] [CrossRef]
  57. Pachauri, V.; Taneja, N.; Vikram, P.; Singh, N.K.; Singh, S. Molecular and morphological characterization of Indian farmers rice varieties (Oryza sativa L.). Aust. J. Crop Sci. 2013, 7, 923–932. [Google Scholar]
  58. Syed, M.A.; Iftekharuddaula, K.M.; Akter, N.; Biswas, P.S. Molecular diversity analysis of some selected BBRI released rice varieties using SSR markers. Int. Res. J. Biol. Sci. 2019, 1, 51–58. [Google Scholar]
Figure 1. A pictorial view of the cold-screening nursery by using a cold water tank in the cold-screening laboratory of the Bangladesh Rice Research Institute (BRRI).
Sustainability 14 04871 g001
Figure 2. Spearman correlation between LD score, survivability, and recovery rate. The upper pan describes the correction coefficients and their significance level, the lower pan shows the directions of correlation, and the diagonal pan shows the distributions of the trait value across the genotypes.
Sustainability 14 04871 g002
Figure 3. PCA plot showing an association between agronomic and cold-related seedling traits. The traits representing the same quadrant and in the same direction are positively associated, and the traits in the opposite direction are negatively associated. The angular distance between traits denotes the strength of association.
Sustainability 14 04871 g003
Figure 4. Dendrogram showing the genetic relationships among 42 rice cultivars using UPGMA cluster analysis of Shanondice genetic similarity coefficients generated from 58 SSR markers. G01 = IR90688-5-1-1-1-1-1; G02 = IR90688-13-1-1-1-1-P1; G03 = IR90688-15-1-1-1-1-1; G04 = IR90688-19-1-1-1-1-1; G05 = IR90688-20-1-1-1-1-1; G06 = IR90688-27-1-1-1-1-1; G07 = IR90688-30-1-1-1-1-1; G08 = IR90688-42-1-1-1-1-P1; G09 = IR90688-42-1-1-1-1-P2; G10 = IR90688-43-1-1-1-1-P1; G11 = IR90688-52-1-1-1-1-1; G12 = IR90688-54-1-1-1-1-1; G13 = IR90688-56-1-1-1-1-1; G14 = IR90688-62-1-1-1-1-1; G15 = IR90688-64-1-1-1-1-1; G16 = IR90688-73-1-1-1-1-P1; G17 = IR90688-74-1-1-1-1-1; G18 = IR90688-77-1-1-1-1-1; G19 = IR90688-81-1-1-1-1-1; G20 = IR90688-82-1-1-1-1-1; G21 = IR90688-91-1-1-1-1-1; G22 = IR90688-92-1-1-1-1-1; G23 = IR90688-94-1-1-1-1-1; G24 = IR90688-95-1-1-1-1-1; G25 = IR90688-96-1-1-1-1-1; G26 = IR90688-103-1-1-1-1-1; G27 = IR90688-104-1-1-1-1-1; G28 = IR90688-105-1-1-1-1-1; G29 = IR90688-106-1-1-1-1-1; G30 = IR90688-108-1-1-1-1-1; G31 = IR90688-109-1-1-1-1-1; G32 = IR90688-114-1-1-1-1-1; G33 = IR90688-118-1-1-1-1-1; G34 = IR90688-120-1-1-1-1-1; G35 = IR90688-124-1-1-1-1-P2; G36 = IR90688-125-1-1-1-1-1; G37 = BR1; G38 = BR18; G39 = BRRI dhan28; G40 = BRRI dhan29; G41 = Jinbubyeo; G42 = Hbj.B.VI.
Sustainability 14 04871 g004
Table 1. Variance and mean performance of 39 genotypes in LD score, % survivability, and % recovery under artificial cold stress.
SLDesignationLD Score% Survivability% Recovery
MeanDiff. from BR1Diff. from BR18MeanDiff. from BR1Diff. from BR18MeanDiff. from BR1Diff. from BR18
1IR90688-5-1-1-1-1-12.3−5.9 *−2.7 *67.6028.9−9.361.1029.65.9
2IR90688-13-1-1-1-1-p13.2−5 *−1.8 *70.0031.3−6.957.4025.92.2
3IR90688-15-1-1-1-1-13.1−5.1 *−1.9 *71.9033.2−569.2037.7 *14
4IR90688-19-1-1-1-1-13.1−5.1 *−1.9 *79.2040.5 *2.375.4043.9 *20.2
5IR90688-20-1-1-1-1-12.8−5.4 *−2.2 *86.3047.6 *9.484.4052.9 *29.2
6IR90688-27-1-1-1-1-13.8−4.4 *−1.262.2023.5−14.760.0028.54.8
7IR90688-30-1-1-1-1-13.4−4.8 *−1.6 *73.3034.6−3.663.3031.88.1
8IR90688-42-1-1-1-1-p13.3−4.9 *−1.7 *78.3039.6 *1.469.4037.9 *14.2
9IR90688-42-1-1-1-1-p24.1−4.1 *−0.968.1029.4−8.861.50306.3
10IR90688-43-1-1-1-1-P13.5−4.7 *−1.5 *74.3035.6−2.666.7035.2 *11.5
11IR90688-52-1-1-1-1-12.9−5.3 *−2.1 *82.4043.7 *5.585.4053.9 *30.2
12IR90688-54-1-1-1-1-13.9−4.3 *−1.176.7038−0.259.3027.84.1
13IR90688-56-1-1-1-1-13.8−4.4 *−1.263.1024.4−13.860.4028.95.2
14IR90688-62-1-1-1-1-14.2−4 *−0.852.7014−24.253.6022.1-1.6
15IR90688-64-1-1-1-1-13.3−4.9 *−1.7 *71.5032.8−5.474.3042.8 *19.1
16IR90688-73-1-1-1-1-P13.0−5.2 *−271.7033−5.268.9037.4 *13.7
17IR90688-74-1-1-1-1-12.8−5.4 *−2.295.0056.3 *18.192.6061.1 *37.4 *
18IR90688-77-1-1-1-1-13.3−4.9 *−1.7 *71.1032.4−5.858.7027.23.5
19IR90688-81-1-1-1-1-12.5−5.7 *−2.5 *100.0061.3 *23.189.6058.1 *34.4 *
20IR90688-82-1-1-1-1-13.0−5.2 *−2 *86.8048.1 *9.971.5040 *16.3
21IR90688-82-1-1-1-1-13.1−5.1 *−1.9 *84.3045.6 *7.466.2034.7 *11
22IR90688-92-1-1-1-1-13.4−4.8 *−1.6 *80.6041.9 *3.765.0033.5 *9.8
23IR90688-94-1-1-1-1-13.1−5.1 *−1.9 *90.9052.2 *1486.7055.2 *31.5
24IR90688-95-1-1-1-1-13.0−5.2 *−2 *81.9043.2 *576.7045.2 *21.5
25IR90688-96-1-1-1-1-14.1−4.1 *−0.959.0020.3−17.953.3021.8−1.9
26IR90688-103-1-1-1-1-12.2−6 *−2.8 *98.3059.6 *21.492.0060.5 *36.8 *
27IR90688-105-1-1-1-1-12.3−5.9 *−2.7 *90.0051.3 *13.183.9052.4 *28.7
28IR90688-106-1-1-1-1-13.0−5.2 *−2 *83.3044.6 *6.471.5040 *16.3
29IR90688-108-1-1-1-1-13.3−4.9 *−1.7 *75.0036.3 *−1.973.3041.8 *18.1
30IR90688-109-1-1-1-1-13.1−5.1 *−1.9 *85.0046.3 *8.176.9045.4 *21.7
31IR90688-114-1-1-1-1-13.0−5.2 *−2 *73.3034.6−3.676.5045 *21.3
32IR90688-118-1-1-1-1-12.4−5.8 *−2.6 *80.0041.3 *3.190.0058.5 *34.8 *
33IR90688-120-1-1-1-1-15.3−2.9 *0.353.3014.6−23.643.3011.8−11.9
34IR90688-124-1-1-1-1-P25.0−3.2 *054.5015.8−22.442.0010.5−13.2
35IR90688-125-1-1-1-1-12.9−5.3 *−2.1 *90.3051.6 *13.482.0050.5 *26.8
36BR18.203.2 *38.700−38.231.500−23.7
37BR185.0−3.2 *076.9038.2 *055.2023.70
38BRRI dhan287.6−0.62.6 *64.7026−12.247.1015.6−8.1
39BRRI dhan296.9−1.31.9 *58.7020−18.258.0026.52.8
Variance3.43 **526.69 **604.45 *
Mean3.4976.1869.07
CV15.1719.2023.72
Mean3.4976.1869.07
LSD (0.05)1.437.7032.20
* and ** indicate significant difference from BR18 at 5% and 1% level of probability, respectively.
Table 2. Adjusted mean of yield and yield-contributing traits of Jinbubyeo-BRRI dhan29 NILs.
SNGenotypeGD
(Days)
PH
(cm)
PL
(cm)
ETFG% SFTGWYield
(g/plant)
1IR90688-5-1-1-1-1-1143.794.122.717.761.638.322.711.5
2IR90688-13-1-1-1-1-P1150.798.222.414.771.497.418.527.7
3IR90688-15-1-1-1-1-1146.795.222.414.682.473.628.230.5
4IR90688-19-1-1-1-1-1146.794.119.914.556.856.119.011.9
5IR90688-20-1-1-1-1-1158.797.323.015.154.147.118.514.0
6IR90688-27-1-1-1-1-1146.797.224.717.191.541.319.224.4
7IR90688-30-1-1-1-1-1163.791.520.717.349.363.217.018.1
8IR90688-42-1-1-1-1-P1154.788.219.615.849.949.720.119.3
9IR90688-42-1-1-1-1-P2157.790.921.816.948.971.419.312.5
10IR90688-43-1-1-1-1-P1147.274.622.123.245.139.017.416.9
11IR90688-52-1-1-1-1-1161.284.822.213.565.288.318.723.2
12IR90688-54-1-1-1-1-1151.2102.424.613.254.033.415.417.6
13IR90688-56-1-1-1-1-1154.299.924.029.846.937.519.615.7
14IR90688-62-1-1-1-1-1147.292.523.217.171.765.120.627.6
15IR90688-64-1-1-1-1-1149.281.723.215.5118.737.816.522.2
16IR90688-73-1-1-1-1-P1153.286.623.515.744.049.218.611.8
17IR90688-74-1-1-1-1-1151.284.723.619.096.073.220.227.6
18IR90688-77-1-1-1-1-1155.282.923.322.344.342.125.020.7
19IR90688-81-1-1-1-1-1155.4107.023.615.965.665.223.912.8
20IR90688-82-1-1-1-1-1144.498.225.419.387.950.915.613.0
21IR90688-91-1-1-1-1-1143.4105.722.315.3107.153.517.417.3
22IR90688-92-1-1-1-1-1138.493.514.215.7160.260.216.123.8
23IR90688-94-1-1-1-1-1149.499.325.819.480.430.325.818.1
24IR90688-95-1-1-1-1-1152.479.721.018.880.833.518.312.4
25IR90688-96-1-1-1-1-1146.4104.024.421.768.349.720.720.5
26IR90688-103-1-1-1-1-1149.490.220.821.973.116.022.114.1
27IR90688-104-1-1-1-1-1145.4100.122.318.182.068.919.123.0
28IR90688-105-1-1-1-1-1151.783.319.018.251.029.516.49.8
29IR90688-106-1-1-1-1-1148.784.020.919.657.222.017.319.6
30IR90688-108-1-1-1-1-1144.784.719.717.465.033.521.417.4
31IR90688-109-1-1-1-1-1139.782.316.919.664.014.817.97.7
32IR90688-114-1-1-1-1-1148.788.921.919.735.723.116.48.1
33IR90688-118-1-1-1-1-1146.790.318.117.368.928.523.413.4
34IR90688-120-1-1-1-1-1153.772.318.918.750.853.318.112.0
35IR90688-124-1-1-1-1-P2146.791.322.517.695.681.217.030.6
36IR90688-125-1-1-1-1-1143.789.222.420.386.763.817.922.6
37BR1 (Ck)148.877.923.124.157.359.818.618.1
38BR18 (Ck)160.889.024.923.173.367.819.520.3
39BRRI dhan28 (Ck)139.899.224.812.2143.777.018.418.2
40BRRI dhan29 (Ck)157.593.822.819.192.965.017.732.6
LSD (Ck Mean)1.192.690.360.748.244.101.271.80
LSD (Ck Mean vs. NIL)2.114.750.641.3014.577.252.243.19
Range of NILs138.4–163.772.3–10714.2–25.813.2–29.845.1–160.214.8–97.415.4–28.27.7–30.6
CV (%)1.114.222.135.3112.78.619.6711.43
GD = growth duration, PH = plant height, PL = panicle length, ET = effective tiller, FG = fertile grain, SF = spikelet fertility, TGW = thousand-grain weight, Ck = check variety, CV = coefficient of variation.
Table 3. Allelic variation and polymorphism information content values of different rice cultivars for 58 SSR polymorphic markers.
Marker IDChr. No.Position (Mb)Allele No.Allele Size (bp)Highest Frequency AllelePIC Value
RangeDifferenceSize (bp)Frequency %
RM727811.793173–2406720157.140.45
RM22014.424110–1261612071.430.40
RM25917.453158–1741615852.380.44
RM58119.113134–141714145.240.51
RM57219.873165–1872216561.900.44
RM10649110.283449–4984947761.900.39
RM10800112.732130–1441414457.140.37
RM5638120.934190–2354520752.380.44
RM115701-4351–4247335161.900.52
RM297132.14147–1874014750.000.47
RM118741-3181–1951419566.670.37
RM370323.864100–1181810057.140.51
RM1276927.355151–1641315152.380.47
RM424211.393235–2784323550.000.46
RM13155215.263450–55110145057.140.40
RM3421229.913142–147514254.760.41
RM266235.434112–1251312550.000.49
RM320230.814194–2111719457.140.48
RM54636.163156–1671115661.900.39
RM14795310.364126–1391313945.240.51
RM1164314.863192–200819283.330.27
RM7134322.014177–28911220166.670.40
RM7097326.873168–176817669.050.38
RM16686414.72287–9038776.190.30
RM273423.863195–204919564.290.41
RM317429.063154–160615450.000.49
RM127434.533208–217921761.900.39
RM41352.21472–100287552.380.44
RM39165-3233–2895628947.620.47
RM58861.614115–1281311550.000.44
RM6811629.233165–1872216554.760.41
RM29570.413186–193718647.620.47
RM6427717.454156–1701416050.000.47
RM336721.874145–2025714552.380.44
RM234725.473131–1532215366.670.37
RM172729.563158–164616450.000.41
RM54785.593197–2535619754.760.46
RM331812.293150–1712115057.140.45
RM264827.923165–1791416550.000.51
RM551597.153115–1261111559.520.42
RM240879-2246–2591324664.290.35
RM566914.744239–2713224950.000.47
RM553919.324160–1731316042.860.54
RM216105.353133–1491614954.760.43
RM61421012.8382–97159466.670.40
RM37731019.93137–1622515050.000.44
RM26063112.262129–137813752.380.37
RM26243115.563150–1601016064.290.38
RM7283119.123149–1823314966.670.37
RM265011111.12137–146913771.430.32
RM34281113.483140–1571714064.290.38
RM2291118.413114–1291511459.520.40
RM2241121.854123–1603716059.520.43
RM2061122.014132–1713916554.760.44
RM20120.973111–1352411154.760.43
RM512125.12221–226522652.380.37
RM285021223.413124–131712450.000.46
RM75581227.022134–139513457.140.37
Mean 3.21 57.310.42
Max 5.00 83.330.54
Min 2.00 42.860.27
Publisher’s Note: MDPI stays neutral with regard to jurisdictional claims in published maps and institutional affiliations.

