Article

Evaluation of Optimal Policy on Environmental Change through Green Consumption

1
School of International Trade and Economics, Central University of Finance and Economics, Beijing 102206, China
2
School of Economics, Hangzhou Normal University, Hangzhou 311121, China
*
Author to whom correspondence should be addressed.
Sustainability 2022, 14(9), 4869; https://doi.org/10.3390/su14094869
Submission received: 8 March 2022 / Revised: 8 April 2022 / Accepted: 16 April 2022 / Published: 19 April 2022
(This article belongs to the Special Issue Environmental Planning and Modeling)

Abstract

:
This paper explores the relationship between green consumption and the environment from a new perspective of green consumption on the demand side. This paper further investigates how to design an environmental policy package to achieve optimal social allocation. The results show that: first, green consumption can still improve the environment without supply-driven policy; second, demand-driven environmental change is better than supply-driven change in improving the environment and increasing social welfare; and third, a policy package which includes green consumption is more efficient.

1. Introduction

The relationship between economic growth and environmental change has always been an important issue in environmental economics. The environment provides exhaustible natural resources which are input into the production of nearly all goods, and thereby makes excellent contributions to sustainable economic growth [1,2]. Widespread industrialization and rapid economic development have seen the emergence of environmental problems—e.g., air pollution, global warming, and deforestation—which have influenced people’s lives. In order to cope with these challenges, international organizations and many countries started to enact environmental policies to enhance environmental efficiency, increasing the sustainability of economic development [3]. An increasing number of people have shifted their purchase behavior towards being more environment-friendly and sustainable in the last few years. This paper categorizes environmental policies into demand-side policies (i.e., green consumption) and supply-side policies (i.e., green production), investigating how these two types of policies affect environmental change.
This paper develops a two-sector endogenous growth general equilibrium model (e.g., clean goods and non-clean goods) by incorporating environment evolvement. Following prior work, we study the relationship between economic growth and environmental change based on the heterogeneity of production, which can be clean or non-clean [4,5]. On the basis of market clearing conditions in the equilibrium, we conduct numerical analysis to quantitatively estimate the effects of green consumption and green production on environmental and social welfare. Furthermore, we show the path of optimal allocation by comparing impulse response between the decentralized equilibrium and social planner equilibrium. Finally, we analyze the mechanism of demand-side and supply-side environmental policies impacting the equilibrium, and illustrate the optimal policy package.
This paper relates to the literature on environmental regulation, green production, and green consumption. Economic growth will inevitably lead to environmental disasters without the government’s environmental policies [4,6]. On the one hand, some studies argue that the government can mainly achieve environmental improvement by implementing supply-side environmental policies, such as environmental taxes, emission reduction subsidies, emission charges [4,6,7]. These policies are able to secure a transition to green production, thereby slowing down the potential increases in pollution. On the other hand, the resource-intensive lifestyle of human beings has been regarded as one of the leading causes of environmental degradation [8]. Environmental policies aim to tackle environmental problems through encouraging consumers to adopt environmentally friendly behaviors, including using renewable energy and clean products [9]. Additionally, there is also some research studying the social welfare effects of environmental policies. These papers indicate that social welfare can be improved by implementing environmental subsidies or tax policies [10,11].
This paper also relates to the literature on green consumption and environmental change. The promotion of clean goods consumption can help to reduce some types of pollutants significantly [12]. For example, the utilization of renewable energy sources has a significant impact on environmental sustainability by decreasing air pollution [13]. Many studies find that green consumption improves the quality of the environment [14,15,16,17,18]. In addition, some research estimates the transformation path of consumption structure in different countries, and finds that the upward trend of transformation toward green consumption patterns significantly reduces pollution [19,20].
Compared with most existing macroeconomic literature which focuses on supply-side environmental regulation, this paper pays particular attention to demand-side environmental policies by profoundly studying the effect of green consumption on the environment, as well as the optimal package of governmental environmental policy to maximize social welfare. This paper shows that green consumption on the demand side can lead to environmental improvement. Furthermore, rather than enforcing supply-side environmental regulation alone, a policy package which includes green consumption is more efficient. This paper enriches the research on economic growth and environmental change, and provides meaningful policy implications for realizing sustainable economic development.
The rest of the paper is organized as follows. Section 2 constructs a two-sector endogenous growth general equilibrium model to study the decentralized equilibrium with green consumption. Section 3 is the numerical simulation. Section 4 is the extension, in which we further study the social planer equilibrium and the environmental policy package that can achieve the optimal social allocation. Section 5 concludes the paper.

2. Model: Decentralized Equilibrium

This section constructs a two-sector general equilibrium model. In the model, the representative household provides labor to obtain income and consumes clean and non-clean goods. The representative firms are completely competitive and can be divided into clean (c) and non-clean (d) parts where c is short for clean firm and d is short for dirty (non-clean) firm. They input capital and labor for production. Non-clean production has a negative impact on the environment. See Appendix A for detailed model construction and calculation process.

3. Quantitative Analysis

3.1. Calibration

There are three sets of calibrated parameters in Table 1. The first set is { α , β , η , δ , ξ , ε }. Based on previous studies [21], set capital share α = 0.5 which means that the output elasticity of capital is 1/2, subjective discount factor β = 0.995 implying that the yearly interest rate is about 3%, inverse Frisch elasticity η = 2 which implies a Frisch elasticity of labor supply of 0.5, and depreciation rate δ = 0.025 corresponds to an average 10% annual capital depreciation rate. Parameters ξ and ε are calibrated strictly following [4]’s method, which yields ξ = 2.46 and ε = 0.001. This means that the initial temperature of simulation is defined as 1.31 °C, and when the temperature rises to 6 degrees centigrade, there will be an environmental disaster (for more details, please see [4]). The standard deviation (S.D.) of shocks, { ρ a t j , ε a t j , ρ ϕ , ε ϕ t } are calibrated in the conventional sense. Persistence is equal to 0.9, and the standard deviation is set to 0.1, which means that the shock is moderate in this model, and the main results are not brought on by a strong exogenous shock. The third set is the steady-state of c d / y d . Among the eight categories of consumption expenditures published by the Chinese National Bureau of Statistics, four (food, clothing, household equipment supplies and maintenance services, and housing) belong to non-clean consumption, and their direct carbon emission indexes are higher than the overall average [20,22]. Therefore, based on the data on GDP per capita and per capita consumption expenditure of urban residents from the first quarter of 2005 to the fourth quarter of 2018, the ratio equals 36.45%. With the steady-state of c d / y d , this model can be better fitted into data in the following quantitative analysis.

3.2. Impulse Responses and Welfare Analysis

This part shows the impulse responses in Figure 1. According to Equations (A4) and (A5), when facing a positive clean-consumption demand shock, the household’s demand for clean consumption increases rapidly, while the demand for non-clean consumption decreases relatively. Therefore, the former presents the positive impulse response, while the latter shows the negative. When the consumption structure transforms gradually to the clean side, both input and output of the non-clean (clean) firm decrease (increase). It is worth noting that according to Equation (A14), the impulse response of environment is positive, which means that the rising demand for clean products leads to environmental changes. In other words, even without the government’s environmental policies, green consumption can still promote environmental improvement.
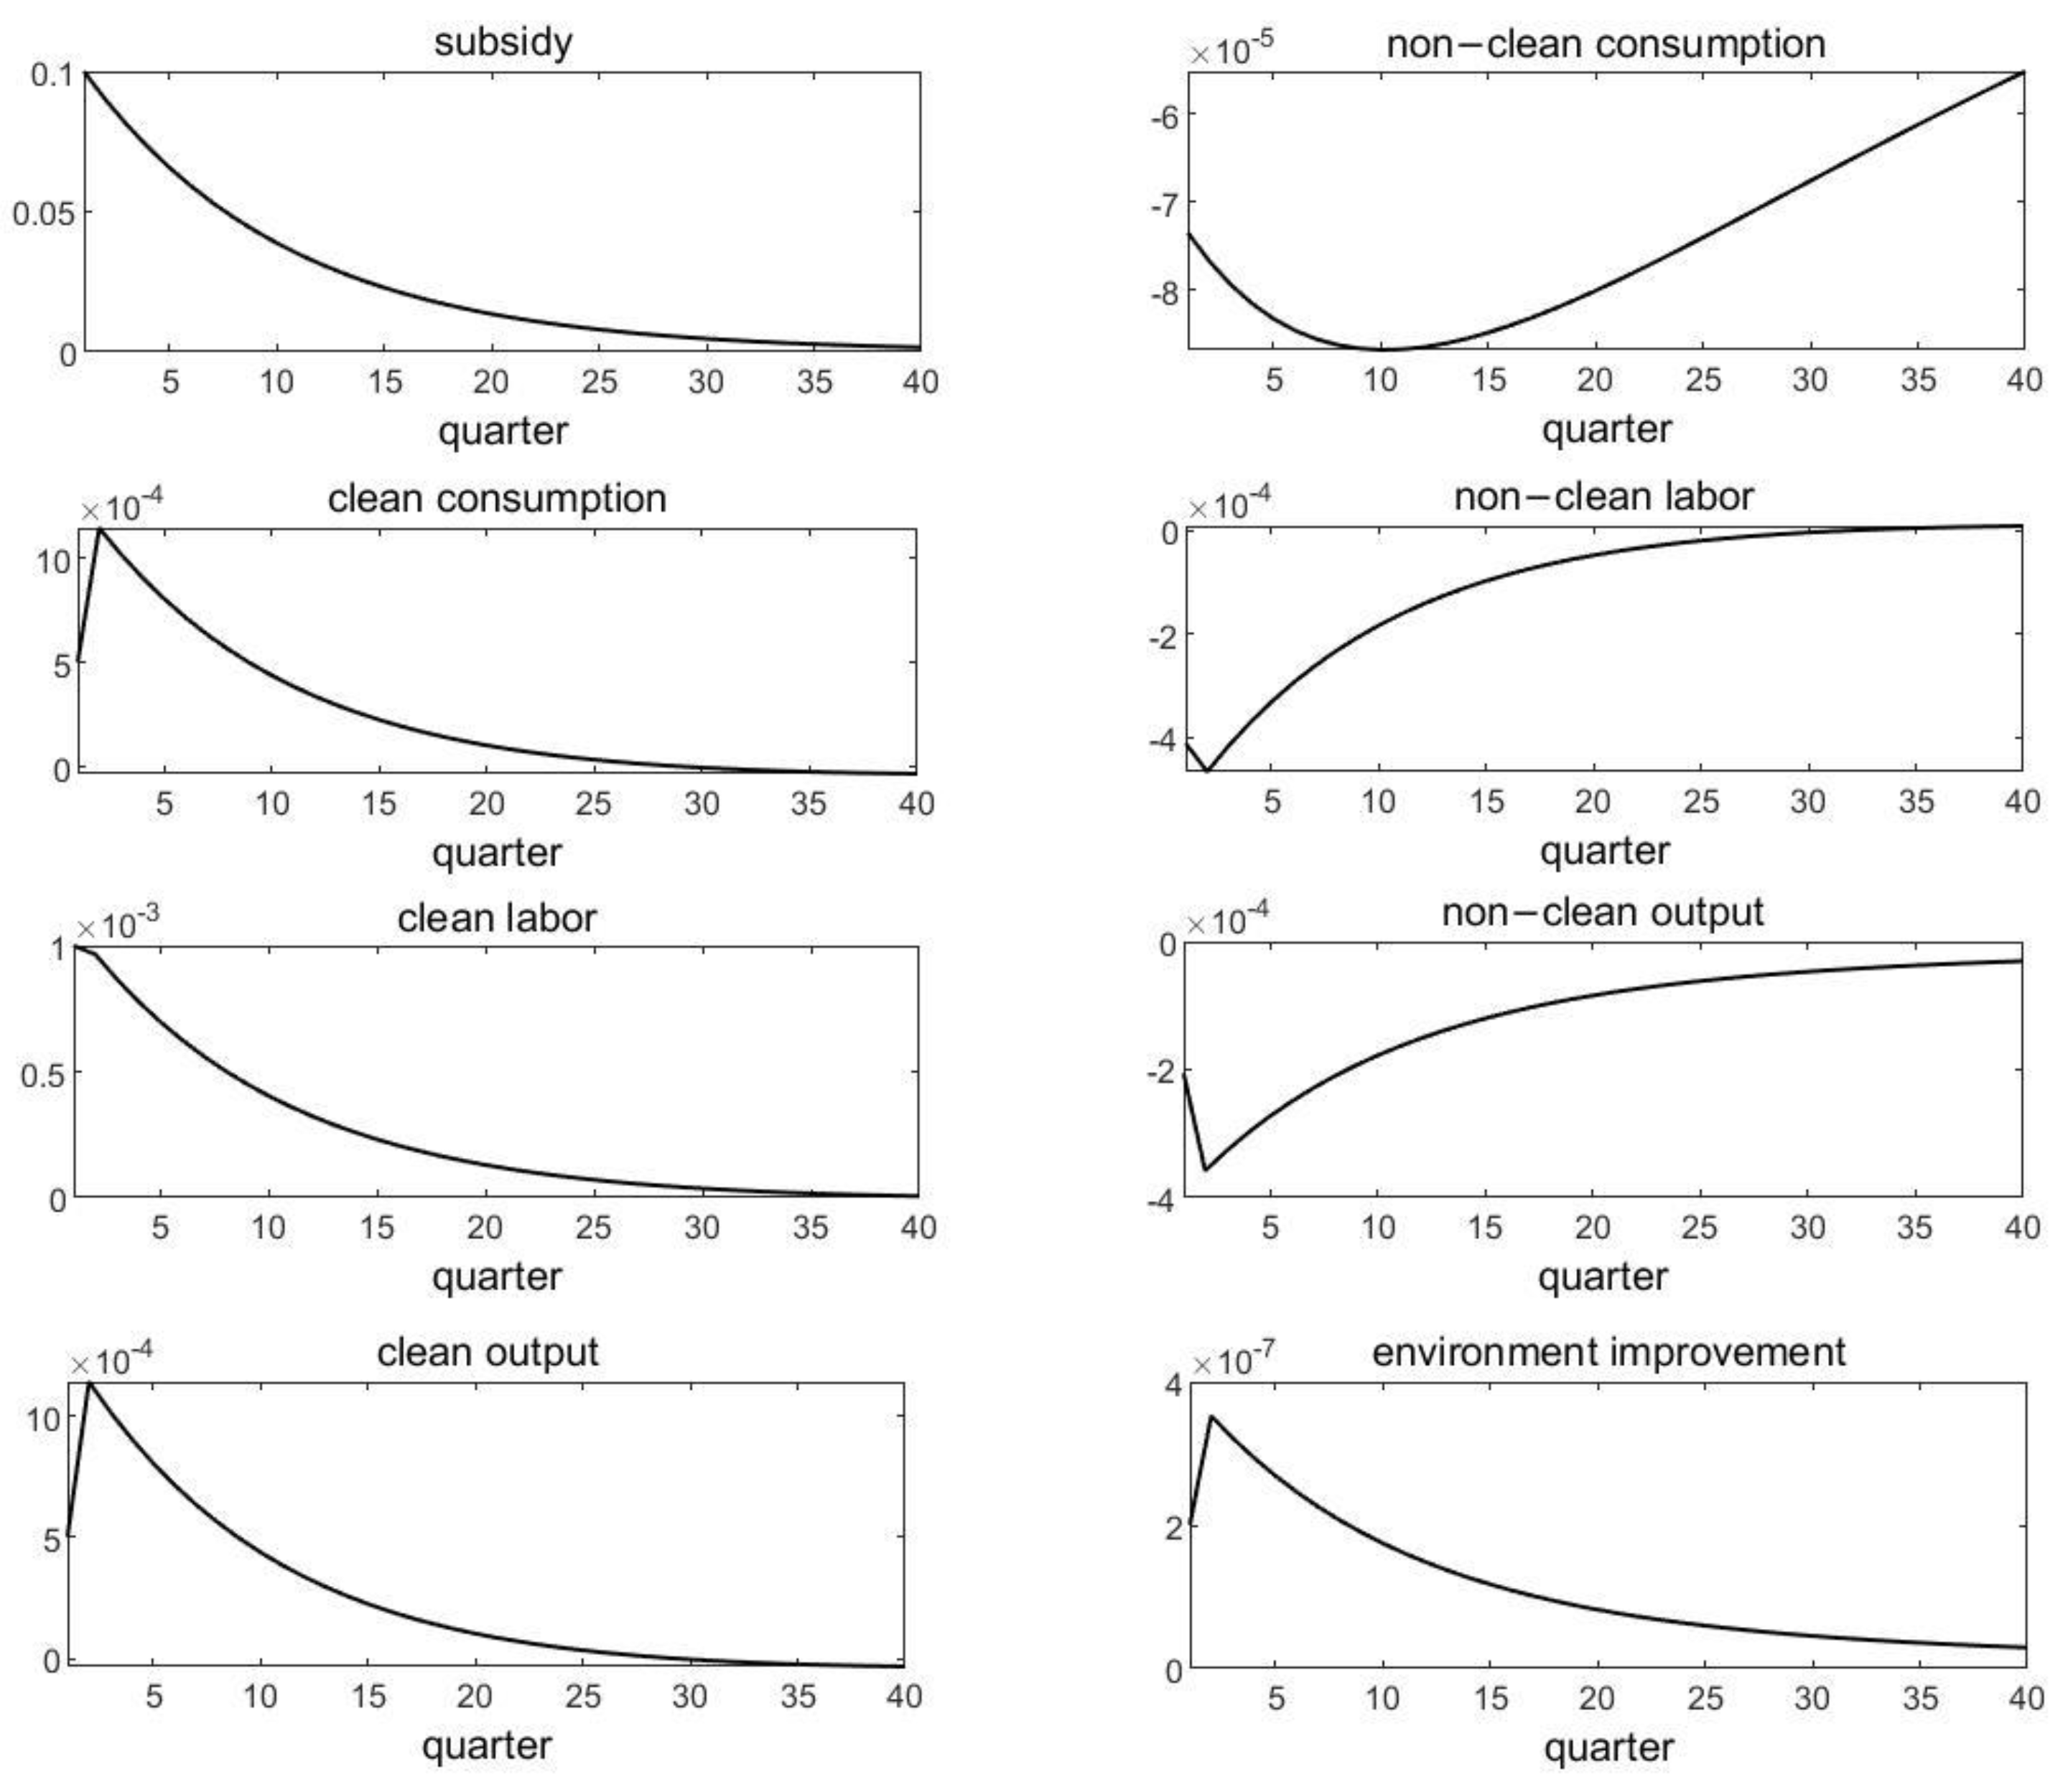
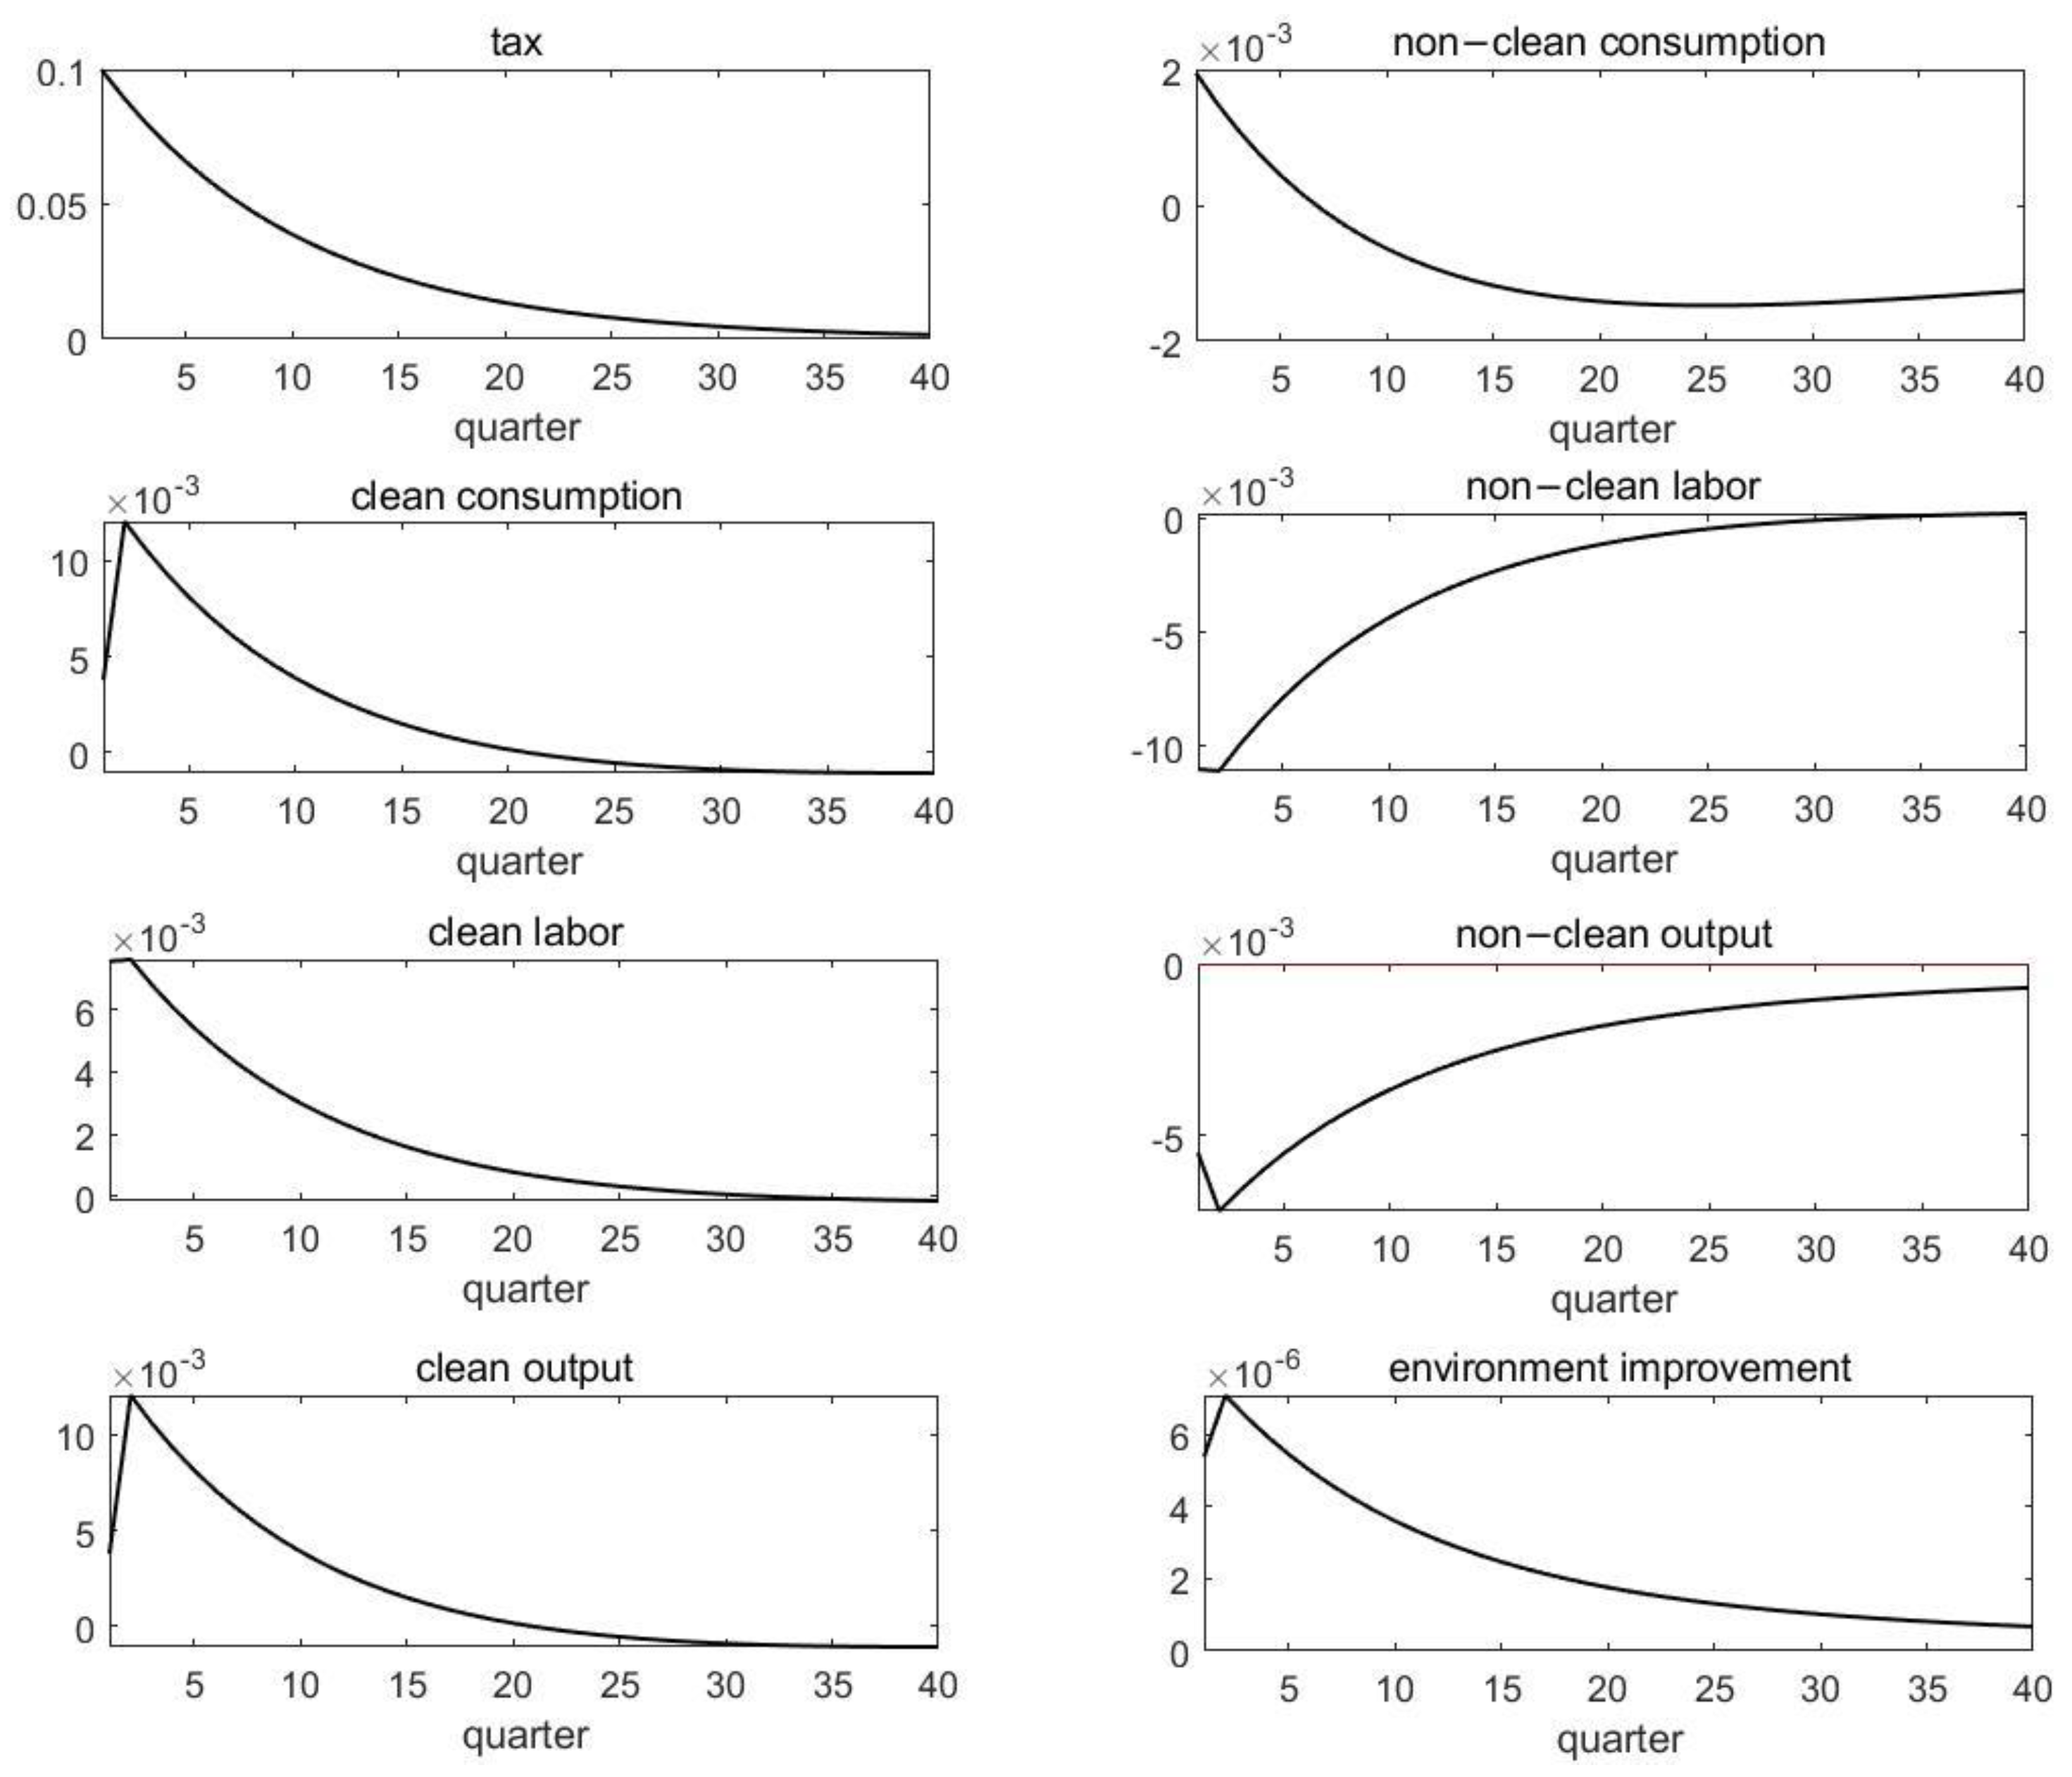
This paper compares “demand-driven” and “supply-driven” environmental changes, and shows the economic implications. Figure 2 and Figure 3 show the respective impulse responses when the government executes a subsidy (tax) from supply side.
Figure 2 and Figure 3 show that the subsidy (tax) to the clean (non-clean) firm increases labor input and output of the clean sector, while the non-clean sector decreases correspondingly. This result is caused by the government’s environmental policies. Due to the production change, the household’s demand for non-clean consumption decreases, while the demand for clean consumption increases. The environment improves. However, it is different from the demand-driven environmental change in Figure 1. First, when facing the same-size shock, the impulse responses of two types of consumption in Figure 1 is significantly larger than those in Figure 2 and Figure 3. It means that the demand-driven force can directly influence the consumption goods market; in particular, the demand-driven force increases more clean demand and has a greater impact on the macroeconomy. Second, when facing the same-size shock, the impulse responses of the two types of outputs in Figure 1 are significantly larger than those in Figure 2 and Figure 3. As proportional subsidy or tax distorts the relative price of two types of consumption, it correspondingly affects (distorts) outputs in supply-driven cases. Third, the environmental improvement in Figure 1 is significantly greater than those in Figure 2 and Figure 3. Therefore, the result shows that demand-driven green consumption has a greater impact on economic fluctuations and environmental change; that is, the demand-driven environmental improvement performs better than the supply-driven.
Furthermore, this paper studies the welfare effects of both demand-driven and supply-driven environmental change. The welfare under the benchmark policy regime is denoted by V b ; C d t i , C c t i and N h t i are the endogenous variables under different supply-driven cases. Welfare gains are calculated as the percentage decrease in consumption in perpetuity under each regime, such that the representative agent is indifferent between living under each regime [21]. The welfare gains are measured by and satisfy   log ( 1 ) = ( V b V a ) / ( 1 β ) , where V a is the social welfare under any other case. Thus,
  E t = 0 β t [ log C d t i ( 1 ) + ϕ t log C c t i φ ( N h t i ) 1 + η 1 + η ] = V b
Table 2 shows that under both supply-driven cases, most variables fluctuate more, and social welfare decreases. When the government provides subsidy or tax to the firms, there is a distortion in the relative price of two types of consumption, which affects the firms’ decisions on outputs and the household’s consumption decisions. The distortion causes welfare losses. Therefore, combining the impulse responses and Table 2, this paper finds that demand-driven green consumption will lead to better environmental improvement (change) in both environmental change and social welfare. Even if there is no government policy intervention, economic growth will not lead to environmental disasters.

4. Extension

4.1. Comparison of Two Equilibria

A natural question is whether the above decentralized equilibrium is the first best, and if not, what kind of environmental policy the government should adopt. Therefore, this paper solves the social planner problem where j { c , d } in Appendix B.
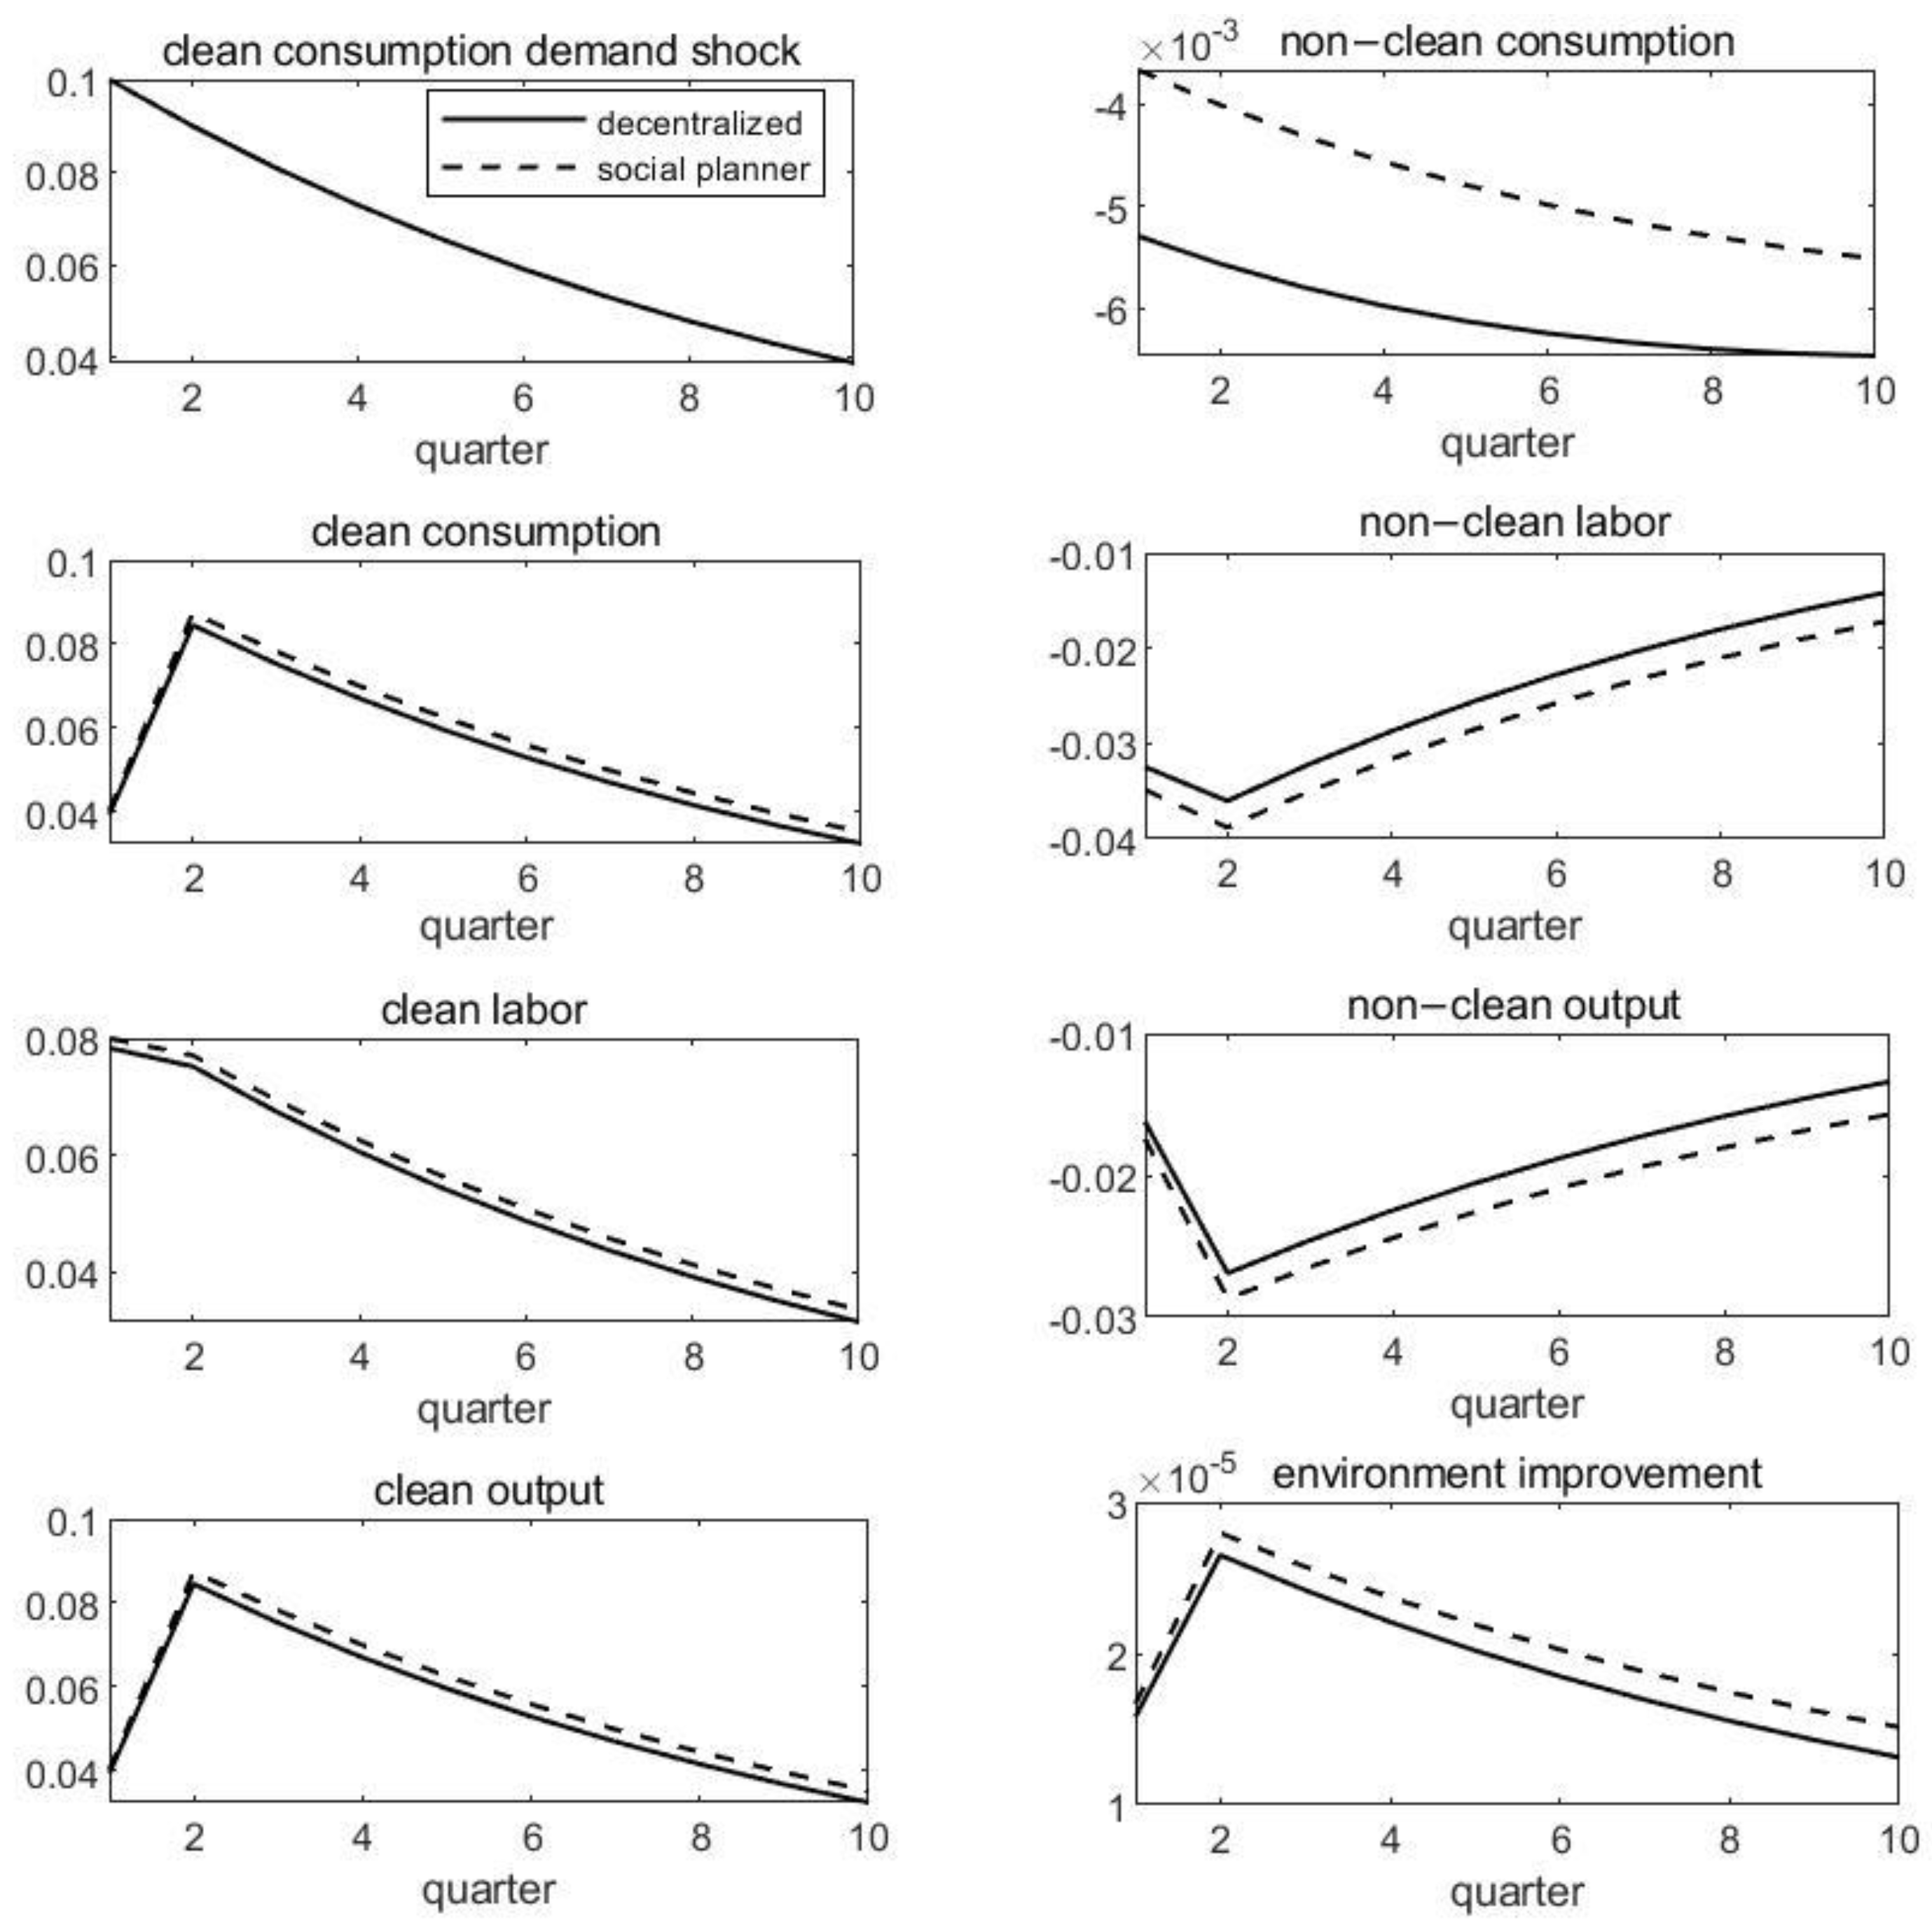
This section reports the impulse response comparison between the decentralized and social planner equilibrium in Figure 4. First, when facing the same demand shock ϕ t , clean consumption in social planner equilibrium increases more. Second, during the transformation of consumption structure, both the input and output of non-clean (clean) firm decrease (increase). Considering the negative impact of non-clean output on the environment from Equation (A21), non-clean output decreases more in the social planner equilibrium. Third, the impulse response of environment improvement is larger in the social planner equilibrium. It is consistent with the theoretical analysis above because social planners will take the negative environmental effects of non-clean output into account when allocating resources. Hence, Figure 1, Figure 2, Figure 3 and Figure 4 show that the government can achieve the optimal allocation and accelerate environment improvement at the same time by environmental policy of green consumption. This paper uses log-linearization and only imposes a small standard deviation. Thus, the impulse response value is small, but this does not affect the main mechanism.
Table 3 further justifies that welfare in social planner equilibrium is higher. This result verifies the conclusion of the theory. This is because, according to the equation λ d t ξ ω t = μ d t = p ^ d t , the price ratio of both types of consumption goods expands from p c t / p d t to p c t / ( p d t ξ ω t ) in social planner equilibrium. Meanwhile, the relative value of non-clean products becomes lower, which will inhibit the production of non-clean firm and contribute to the expansion of clean sector in the general equilibrium. Therefore, this paper argues that decentralized equilibrium is not the optimal social allocation. The government needs to regulate the economy in decentralized equilibrium, optimize the allocation of social resources, and improve the environment to the first best.

4.2. Discussion on the Optimal Policy

The above social planner equilibrium depicts the optimal distribution. Corresponding with this reality, this paper will ask how the government can achieve the first best in the decentralized equilibrium through environmental policies. In order to answer this question, this paper must again clarify that the fundamental reason for the difference between decentralized equilibrium and social planner equilibrium lies in the different price ratio of clean and non-clean consumption goods. That is, the decentralized equilibrium can be equivalent to social planner equilibrium as long as p c t / p d t is expanded to p c t / ( p d t ξ ω t ) . This means that considering the wedge of output to environment is the key to optimizing resource allocation in the decentralized equilibrium.
This section summarizes the environmental policy packages in Table 4, which can make the relative price p c t / p d t p c t / ( p d t ξ ω t ) . It can be seen from Table 4 that environmental policy packages can be divided into two categories according to “whether it includes green consumption (demand side) or not”. In case I-1, assume the government only subsidizes clean consumption by s c c to achieve the optimal allocation by moving the demand curve of clean goods outward to increase clean consumption, which yields s c c = ξ ω t 1 ξ ω t . In case I-2, if the government subsidizes clean consumption and clean output by s c c and s c respectively by moving the demand curve and supply curve of clean goods outward at the same time, then the two rate s c c and s c satisfy the equation ( 1 + s c c ) ( 1 s c ) = 1 1 ξ ω t . In case I-3, if the government subsidizes clean consumption by s c c and levies environmental tax on non-clean output by τ I , the demand curve of clean goods is moved outward and the supply curve of non-clean output is moved inward as tax τ I decreases non-clean firm’s production. In this case, we find that the two rates must follow 1 + s c c 1 τ I = 1 1 ξ ω t . Similarly, in case II-1, when the government only levies environmental tax on non-clean output by τ I I , the supply curve of non-clean output is pushed inward as τ I I suppresses non-clean output. By simple algebra, we get τ I I = ξ ω t . In addition, if the government levies environmental tax on non-clean output by τ I I and subsidizes clean output by s c , the two rates are in the relationship of 1 s c 1 τ I I = 1 1 ξ ω t . The non-clean output supply curve moves inward to decrease output by tax τ I I , and at the same time, the clean output supply curve moves outward to increase production by subsidy s c . If s c = 0 , it shows that “II-1” is a special case of “II-2“.
In Table 4, the main result shows that the regulation efficiency of environmental policy containing green consumption is higher. Because “II-1” is a special case of “II-2 (when s c = 0 )”, this paper can analyze the regulation efficiency of two types of policies by comparing “I-3” and “II-2” directly. Facing the same social optimal target, it is clear to see in Table 4 that 1 τ I > 1 τ I I τ I < τ I I . It means the tax rate with green consumption policy is lower, and the distortion of proportional tax on resource allocation is also smaller. Therefore, the policy regulation containing green consumption is more efficient, and the government should strengthen its support for green consumption. This result complements the literature which argues that government can mainly achieve environmental improvement by implementing supply-side environmental policies, such as environmental taxes, emission reduction subsidies, and emission charges [4,6,7]. This paper suggests demand-side policy which emphasizes green consumption can achieve higher efficiency and welfare gains.
We also find that as the environmental wedge ξ ω t rises, subsidies for green consumption should also increase. In the case of “I-1”, s c c = ξ ω t / ( 1 ξ ω t ) is a monotonic increasing function of ξ ω t . That is, when the cost of environmental damage ξ ω t increases, the subsidy for green consumption should also be strengthened to achieve optimal social distribution. In addition, in the cases of “I-2” ( s c c , s c ) and “I-3” ( s c c , τ I ), there is a scientific trade-off between policies of demand-side and supply-side. Specifically, there is a significant positive correlation between subsidizing clean consumption s c c and subsidizing clean output s c , and there is a significant negative correlation between subsidizing green consumption s c c and levying environmental tax τ I on non-clean output. This is because the greater the subsidy for clean consumption s c c , the higher the household demand for clean consumption goods and output in the general equilibrium. Therefore, the subsidy for clean output s c will also increase. While the subsidy for clean consumption s c c is greater, the environmental regulation on the demand side can well raise the relative price p c t / p d t . At this time, the punishment of the supply side for non-clean output τ I can be appropriately relaxed, and the social distribution can still be optimal. These results extend the supply-side literature on environmental change, and enrich the policy implication of environmental regulation. The government has many options to regulate environment when considering the trade-off between green consumption (demand-side) and environmental taxes (supply-side) instead of being limited to only supply-side policies as most macroeconomic papers did.

4.3. Discussion of the Results

With the improvement of living standards, people’s awareness of environmental protection is strengthened. They are increasingly interested in green products and are keen on green consumption. Green production and developing green markets have become new trends in the 21st century.
For example, the Chinese government has been encouraging green consumption, subsidizing green production and levying taxes on non-clean output. The government attaches great importance to promoting new energy vehicles and has successively issued a series of policies, including financial subsidies, exemption from vehicle purchase tax, and increasing loans, which have promoted the consumption of new energy vehicles. Moreover, the government imposes punitive taxes on air pollutants, water pollutants, solid waste emissions, and noise [23]. With the reform of China’s urban heating system, the development and utilization of new energy, the adjustment of industrial structure, and the return of farmland to forests, China’s carbon emissions have decreased significantly [24,25,26]. As China’s regional development is unbalanced, policies should be adjusted to local conditions [27,28].
On the demand side, the term “green consumers” refers to those consumers who care about the ecological environment and have purchase intention for green products. They have green consciousness and have or may transform green consciousness into green consumption behavior. The Chinese government subsidizes green consumption directly as promotion. On the supply side, there were 50 categories of 200 million green basket commodities on Alibaba’s online retail platform in 2015 (the term “green basket commodities” refers to the collection of commodities with three green attributes of “capital saving and energy saving, environment-friendly, and health quality”), most of which are subsidized by the government. The consumption of green basket accounts for 11.5% of Alibaba’s retail platform, and the compound annual growth rate over the past five years has exceeded 80%.
By analyzing the shopping behavior of 400 million consumers on the Alibaba China retail platform, the Alibaba Research Institute found that the online population in line with the characteristics of green consumers reached 65 million, accounting for 16% of the active users of Taobao, an increase of 14 times in the last four years. The release of green consumer demand is bound to better guide green supply and promote supply side reform. Besides, according to the analysis of the consumption frequency of green basket commodities, in the past five years, heavy green consumers (with an average annual consumption of more than 20 times) have significantly expanded, increasing from 19.4% in 2011 to 28.4% in 2015.
In 2015, the Alibaba online retail platform reduced the emission of about 30 million tons of carbon dioxide by saving energy and material consumption, which is equivalent to adding forests the size of Poyang Lake in China. The water-saving products sold on the platform can save water for 13 days in Beijing every year. The annual power saving of energy-saving products can be used for 25 days in Beijing. The environmentally friendly packaging products sold on the platform can reduce the consumption of plastic bags and convert them into oil, which can be used by Beijing taxis for 62 days. In 2016, the comprehensive utilization of waste textiles in China was 3.6 million tons, which could save 4.6 million tons of crude oil and 270,000 hectares of cultivated land. The energy-efficient air conditioners, refrigerators, washing machines, and water heaters sold in China in 2017 can save about 10 billion kwh of electricity annually, which is equivalent to reducing 6.5 million tons of carbon dioxide, 14,000 tons of sulfur dioxide, 14,000 tons of nitrogen oxides, and 11,000 tons of particulate matter. All of these actions promote the environment.

5. Conclusions

The relationship between the environment and the macroeconomy is always a heated issue. The literature mainly focuses on supply-side environmental regulation, and argues that economic growth will not cause environmental disasters only if the government implements supply-side environmental policies. However, this paper constructs a two-sector endogenous growth general equilibrium model to study the relationship between green consumption and the environment from a new demand-driven perspective. We find that green consumption can promote environmental improvement without the government’s intervention. Besides, demand-driven environmental change is better than the supply-driven in improving environmental change and social welfare.
Then this paper studies the relationship between environmental regulation and the environment in a social planer model. The results show that the welfare of decentralized equilibrium is about 0.0006% lower at the Taylor first order approximation. Moreover, policymakers need to optimize the allocation of social resources and improve the environment to the first best. We show that the policy package which includes green consumption is more efficient. Specifically, the demand-side policy emphasizing green consumption can achieve higher efficiency and welfare gains. Moreover, the government has many options to regulate environment when considering the trade-off between green consumption (demand-side) and environmental taxes (supply-side). For example, the government can subsidize green consumption increasing with environmental disruption and clean output, or decreasing with environmental tax of non-clean output.
To promote sustainable economic development, policymakers should not only pay attention to the punishment of environmental damage, but also strengthen the support for green consumption. Overall, this paper argues for a multi-level environmental regulation system of “green consumption and green production”, especially the support for green consumption to promote sustainable economic development.
As this paper is most related to the theoretical framework of macroeconomy, we follow the approach of this strand of literature [4,6,7] and assume that the representative household is homothetic. They need to consume both clean goods that are environmental-friendly (e.g., electric vehicles) and non-clean goods that are contaminative (e.g., paper or coal). Because the household’s utility is an increasing function of clean goods, all the homothetic households in this model will agree to protect the environment by consuming more clean goods. As a result, social welfare gains due to less resource misallocation between clean and non-clean sectors and increasing utility, besides the decreasing distortion of proportional tax. It is verified by many empirical papers [19,20] that the upward trend of transformation toward green consumption patterns significantly reduces pollution, and the trend is more pronounced especially in developing countries. In this model, any awareness program being considered for citizens to understand the green consumption concept is included in the demand shock of clean consumption. It implies that if a program proposes a green consumption concept, the household will be more willing to increase clean consumption with a positive clean-consumption demand shock. We think that considering the heterogeneous household preferences for green consumption in the model will be very meaningful in the future. If we introduce heterogeneous household preferences, people at all levels of society may prefer green consumption, as it reduces resource misallocation and raises utility and social welfare at the same time. Interestingly, the government may need to provide higher subsidy for the low-income group to encourage their green consumption.
This paper does not incorporate the associated energy use of green manufacturing and consumption. In the model, this phenomenon is described by the pollution parameter of non-clean firm ξ . Because different industries have different production habits and impacts on the environment, the relative policy, such as subsidy and tax, can be differentiated. Therefore, research discussing heterogeneous industries is also a feasible direction in the future. This paper does not consider the impact of an open economy on green consumption and environmental change. As the carbon emission rights can be traded across borders, the exchange rate and capital flow can affect domestic green consumption and environmental change through the cross-border transaction of carbon emission rights in an open economy; this is worth carefully studying in the future.

Author Contributions

Writing—original draft, Y.H.; Writing—review & editing, H.J. All authors have read and agreed to the published version of the manuscript.

Funding

This research was funded by the National Natural Science Foundation of China (grant number 71904169) and the Scientific Research Foundation for Scholars of HZNU (grant number 4015C50221204101).

Institutional Review Board Statement

Not applicable.

Informed Consent Statement

Not applicable.

Data Availability Statement

Not applicable.

Conflicts of Interest

The authors declare no conflict of interest.

Appendix A. Decentralized Equilibrium

A.1. The Representative Household

The household has the utility function
E t t = 0 β t [ log ( C d t ) + ϕ t l o g ( C c t ) φ N h t 1 + η 1 + η ]
where the utility weight parameter φ > 0 and the subjective discount factor β ( 0 , 1 ) , C c t and C d t denote the clean and non-clean consumption at t respectively, N h t denotes labor supply. Assume ϕ t as the demand shock of clean consumption which follows the AR(1) process [29]
log ϕ t = ρ ϕ log ϕ t 1 + ε ϕ t
The parameter ρ ϕ ( 1 , 1 ) , and ε ϕ t is i.i.d. standard normal processes.
Normalize the price of non-clean consumption to 1, denote W t is the household income, π t is the dividend, then the household’s budget constraint is given by
C d t + P c t C c t = W t N h t + π t
The household chooses { C c t , C d t , N h t } to maximize Equation (A1) subject to Equations (A2) and (A3). The first order conditions are
1 / C d t = λ t
ϕ t / C c t = λ t P c t
φ N h t η = λ t W t
where λ t is the Lagrange multiplier of Equation (A3). Equation (A6) shows that wage is equal to the marginal substitution rate of consumption and leisure, and household purchases more clean and non-clean goods with increasing income.

A.2. The Representative Firms

Clean and non-clean firms are perfectly competitive. Firms input labor N j t and capital K j t to produce ( j { c , d } ), and denote A j t is the total factor productivity (TFP). The production function is
Y j t = A j t K j t α N j t 1 α
where α is the capital share and A j t follows the AR(1) stochastic process
log A j t = ρ a j log A j , t 1 + ε a t j
The parameter ρ a j ( 1 , 1 ) , and ε a t j is i.i.d. standard normal processes. The capital accumulation satisfies
K j , t + 1 = ( 1 δ ) K j t + I j t
where δ is the capital depreciation rate. The firm chooses the optimal { K j , t + 1 , N j t }( j { c , d } ) to maximize profit subject to Equations (A7)–(A9)
max { K j , t + 1 , N j t }   E t t = 0 β t λ t λ 0 { P j t A j t K j t α N j t 1 α W t N j t I j t }
and the first order conditions are
1 = β E t λ t + 1 / λ t ( α P j , t + 1 Y j , t + 1 / K j , t + 1 + 1 δ )
( 1 α ) P j t Y j t = W t N j t
Equation (A10) is the Euler equation of capital, which means that the price of capital is equal to the discounted present value of its future marginal products plus the undepreciated capital. Equation (A11) is the labor demand function, which implies that the real wage is equal to the marginal product of labor. Both equations mean that in the absence of environmental policies, non-clean firm will not consider the negative output externality to the environment.

A.3. Market Clearing Conditions and Equilibrium

In a competitive equilibrium, the goods market clearing conditions imply that
C c t = Y c t
C d t + I t = Y d t
Environment S t + 1 evolves as
S t + 1 = ξ Y d t + ( 1 + ε ) S t
where ξ > 0 is the pollution parameter of non-clean firm, ε is the recovery parameter of environment, S t ( 0 , S ¯ ) . The labor market clearing condition implies that
N c t + N d t = N h t
A competitive equilibrium consists of sequences of endogenous variables { C c t , C d t , N h t , N c t , N d t , I c t , I d t , K c t , K d t , Y c t , Y d t , S t + 1 } t = 0 , such that (i) taking the prices { P c t , W t } as given, the allocations solve the optimizing problems for the household and the firms, and (ii) all markets clear.

Appendix B. Social Planner Equilibrium

This paper also solves the social planner problem where j { c , d } .
E t t = 0 β t [ log ( C d t ) + ϕ t l o g ( C c t ) φ N h t 1 + η 1 + η ] ,
s . t . C c t = Y c t
C d t + [ K d , t + 1 ( 1 δ ) K d t + K c , t + 1 ( 1 δ ) K c t ] = Y d t
Y c t = A c t K c t α N c t 1 α
Y d t = A d t K d t α N d t 1 α
S t + 1 = ξ Y d t + ( 1 + ε ) S t
where N c t + N d t = N h t , log A j t = ρ a j log A j , t 1 + ε a t j   log A j t = ρ a j log A j , t 1 + ε a t j and log ϕ t = ρ ϕ log ϕ t 1 + ε ϕ t .
Denote λ c t , λ d t , μ c t , μ d t and ω t are the Lagrange multipliers of Equations (A16)–(A20) respectively, it is easy to get the optimal distributions are
FOC   of   Y c t   and   Y d t :   λ c t = μ c t = p ^ c t ,   λ d t ξ ω t = μ d t = p ^ d t ,  
FOC   of   C c t   and   C d t :   ϕ t / C c t = λ c t ,   1 / C d t = λ d t ,  
FOC   of   N c t   and   N d t :   φ N h t η = ( 1 α ) μ j t Y j t / N j t ,  
FOC   of   K c , t + 1   and   K d , t + 1 :   λ d t = β E t [ λ d , t + 1 ( 1 δ ) + α μ j , t + 1 Y j , t + 1 / K j , t + 1 ] ,  
FOC   of   S t :   ω t = β E t ω t + 1 ( 1 + ε ) .  
Equation (A21) is the most important equation in this paper, where μ c t = p ^ c t and μ d t = p ^ d t respectively represent the shadow price of two sectors in the first best equilibrium. Because clean production has no destructive effect on the environment, the marginal price of clean product is equal to its marginal utility. However, in social planner equilibrium, there is one more ξ ω t in the first order condition of Y d t , which means the marginal damage cost to environment for each additional unit of non-clean output (every one more unit Y d t will damage ξ environment in the next period). This implies that by introducing a wedge ξ ω t , the government makes the marginal price of non-clean product equal to its marginal utility minus environmental cost. Equation (A21) shows that the environmental wedge decreases p ^ d t , thus reducing the non-clean output. This is a different result from the decentralized equilibrium in which λ d t = μ d t = P d t . Because the non-clean sector only cares about the profit maximization within the enterprise and does not consider the damage of its output to environment, the marginal price of non-clean product is higher than the social optimal; that is, the non-clean sector will not impose environmental regulation on itself. Equation (A22) is the Euler equation of consumption, which means that increasing environmental wedge will promote the increase of the relative demand for clean product at a given price. Equations (A23) and (A24) are the standard Euler equations of production factors. The marginal outputs of labor and capital are equal to their respective shadow prices. Equation (A25) indicates that the shadow price of environmental quality in the period t is equal to its discounted present value of the shadow price in the period t + 1 after recovering ( 1 + ε ) . From Equations (A21)–(A25), it can be seen that the decentralized equilibrium obviously does not reach social optimization. The fundamental reason is that in the decentralized equilibrium, the production of non-clean firm does not consider its environmental pollution cost, while the social planner cares about this cost in the equilibrium. Therefore, in the two kinds of equilibria, the relative prices of clean and non-clean product are different, and the relative price p c t / p d t in decentralized equilibrium is distorted. This paper will use numerical simulation in the next section to further demonstrate this theoretical conclusion.

References

  1. Grossman, G.M.; Krueger, A.B. Economic growth and the environment. Q. J. Econ. 1995, 110, 353–377. [Google Scholar] [CrossRef] [Green Version]
  2. Wu, H.; Hao, Y.; Ren, S. How do environmental regulation and environmental decentralization affect green total factor energy efficiency: Evidence from China. Energy Econ. 2020, 91, 104880. [Google Scholar] [CrossRef]
  3. Cardenas, L.M.; Franco, C.J.; Dyner, I. Assessing emissions–mitigation energy policy under integrated supply and demand analysis: The Colombian case. J. Clean. Prod. 2016, 112, 3759–3773. [Google Scholar] [CrossRef]
  4. Acemoglu, D.; Aghion, P.; Bursztyn, L.; Hemous, D. The environment and directed technical change. Am. Econ. Rev. 2012, 102, 131–166. [Google Scholar] [CrossRef] [Green Version]
  5. Grimaud, A.; Rouge, L. Environment, directed technical change and economic policy. Environ. Resour. Econ. 2008, 41, 439–463. [Google Scholar] [CrossRef]
  6. Acemoglu, D.; Akcigit, U.; Hanley, D.; Kerr, W. Transition to clean technology. J. Political Econ. 2016, 124, 52–104. [Google Scholar] [CrossRef] [Green Version]
  7. Acemoglu, D.; Rafey, W. Mirage on the Horizon: Geo-Engineering and Carbon Taxation without Commitment; Working Paper No.24411; National Bureau of Economic Research: Cambridge, MA, USA, 2018. [Google Scholar]
  8. Tripathi, A.; Singh, M.P. Determinants of sustainable/green consumption: A review. Int. J. Environ. Technol. Manag. 2016, 19, 316–358. [Google Scholar] [CrossRef]
  9. Testa, F.; Pretner, G.; Iovino, R.; Bianchi, G.; Tessitore, S.; Iraldo, F. Drivers to green consumption: A systematic review. Environ. Dev. Sustain. 2021, 23, 4826–4880. [Google Scholar] [CrossRef]
  10. Wang, L.; Lu, J. Analysis of the social welfare effect of environmental regulation policy based on a market structure perspective and consumer. Sustainability 2019, 12, 104. [Google Scholar] [CrossRef] [Green Version]
  11. Kotani, K.; Kakinaka, M. Some implications of environmental regulation on social welfare under learning-by-doing of eco-products. Environ. Econ. Policy Stud. 2017, 19, 121–149. [Google Scholar] [CrossRef]
  12. Kahia, M.; Aïssa, M.S.B.; Lanouar, C. Renewable and nonrenewable energy use-economic growth nexus: The case of MENA net oil importing countries. Renew. Sustain. Energy Rev. 2017, 71, 127–140. [Google Scholar] [CrossRef]
  13. Bhattacharya, M.; Churchill, S.A.; Paramati, S.R. The dynamic impact of renewable energy and institutions on economic output and CO2 emissions across regions. Renew. Energy 2017, 111, 157–167. [Google Scholar] [CrossRef]
  14. Jaforullah, M.; King, A. Does the use of renewable energy sources mitigate CO2 emissions? A reassessment of the US evidence. Energy Econ. 2015, 49, 711–717. [Google Scholar] [CrossRef]
  15. Salahuddin, M.; Gow, J.; Ozturk, I. Is the long-run relationship between economic growth, electricity consumption, carbon dioxide emissions and financial development in Gulf Cooperation Council Countries robust? Renew. Sustain. Energy Rev. 2015, 51, 317–326. [Google Scholar] [CrossRef] [Green Version]
  16. Saidi, K.; Omri, A. Reducing CO2 emissions in OECD countries: Do renewable and nuclear energy matter? Prog. Nucl. Energy 2020, 126, 103425. [Google Scholar] [CrossRef]
  17. Jebli, M.B.; Farhani, S.; Guesmi, K. Renewable energy, CO2 emissions and value added: Empirical evidence from countries with different income levels. Structural Change Econ. Dyn. 2020, 53, 402–410. [Google Scholar] [CrossRef]
  18. Kirikkaleli, D.; Adebayo, T.S. Do renewable energy consumption and financial development matter for environmental sustainability? New global evidence. Sustain. Dev. 2021, 29, 583–594. [Google Scholar] [CrossRef]
  19. Feng, T.; Sun, L.; Zhang, Y. The relationship between energy consumption structure, economic structure and energy intensity in China. Energy Policy 2009, 37, 5475–5483. [Google Scholar] [CrossRef]
  20. Yuan, B.; Ren, S.; Chen, X. The effects of urbanization, consumption ratio and consumption structure on residential indirect CO2 emissions in China: A regional comparative analysis. Appl. Energy 2015, 140, 94–106. [Google Scholar] [CrossRef]
  21. Chang, C.; Liu, Z.; Spiegel, M.M. Capital controls and optimal Chinese monetary policy. J. Monet. Econ. 2015, 74, 1–15. [Google Scholar] [CrossRef]
  22. Wei, Y.; Liu, L.; Fan, Y.; Wu, G. The impact of lifestyle on energy use and CO2 emission: An empirical analysis of China’s residents. Energy Policy 2007, 35, 247–257. [Google Scholar] [CrossRef]
  23. John, A.; Pecchenino, R. An overlapping generations model of growth and the environment. Econ. J. 1994, 104, 1393–1410. [Google Scholar] [CrossRef]
  24. Dasgupta, S.; Laplante, B.; Wang, H.; Wheeler, D. Confronting the Environmental Kuznets Curve. J. Econ. Perspect. 2002, 16, 147–168. [Google Scholar] [CrossRef] [Green Version]
  25. Song, T.; Zheng, T.; Tong, L. An empirical test of the Environmental Kuznets Curve in China: A panel cointegration approach. China Econ. Rev. 2008, 19, 381–392. [Google Scholar] [CrossRef]
  26. Gui, S.; Zhao, L.; Zhang, Z. Does municipal solid waste generation in China support the Environmental Kuznets Curve? New evidence from spatial linkage analysis. Waste Manag. 2019, 84, 310–319. [Google Scholar] [CrossRef]
  27. Shen, J. A simultaneous estimation of Environmental Kuznets Curve: Evidence from China. China Econ. Rev. 2006, 17, 383–394. [Google Scholar] [CrossRef]
  28. Song, M.; Zhang, W.; Wang, S. Inflection point of Environmental Kuznets Curve in mainland China. Energy Policy 2013, 57, 14–20. [Google Scholar] [CrossRef]
  29. Liu, Z.; Wang, P.; Zha, T. Land-price dynamics and macroeconomic fluctuation. Econometrica 2013, 8, 1147–1184. [Google Scholar]
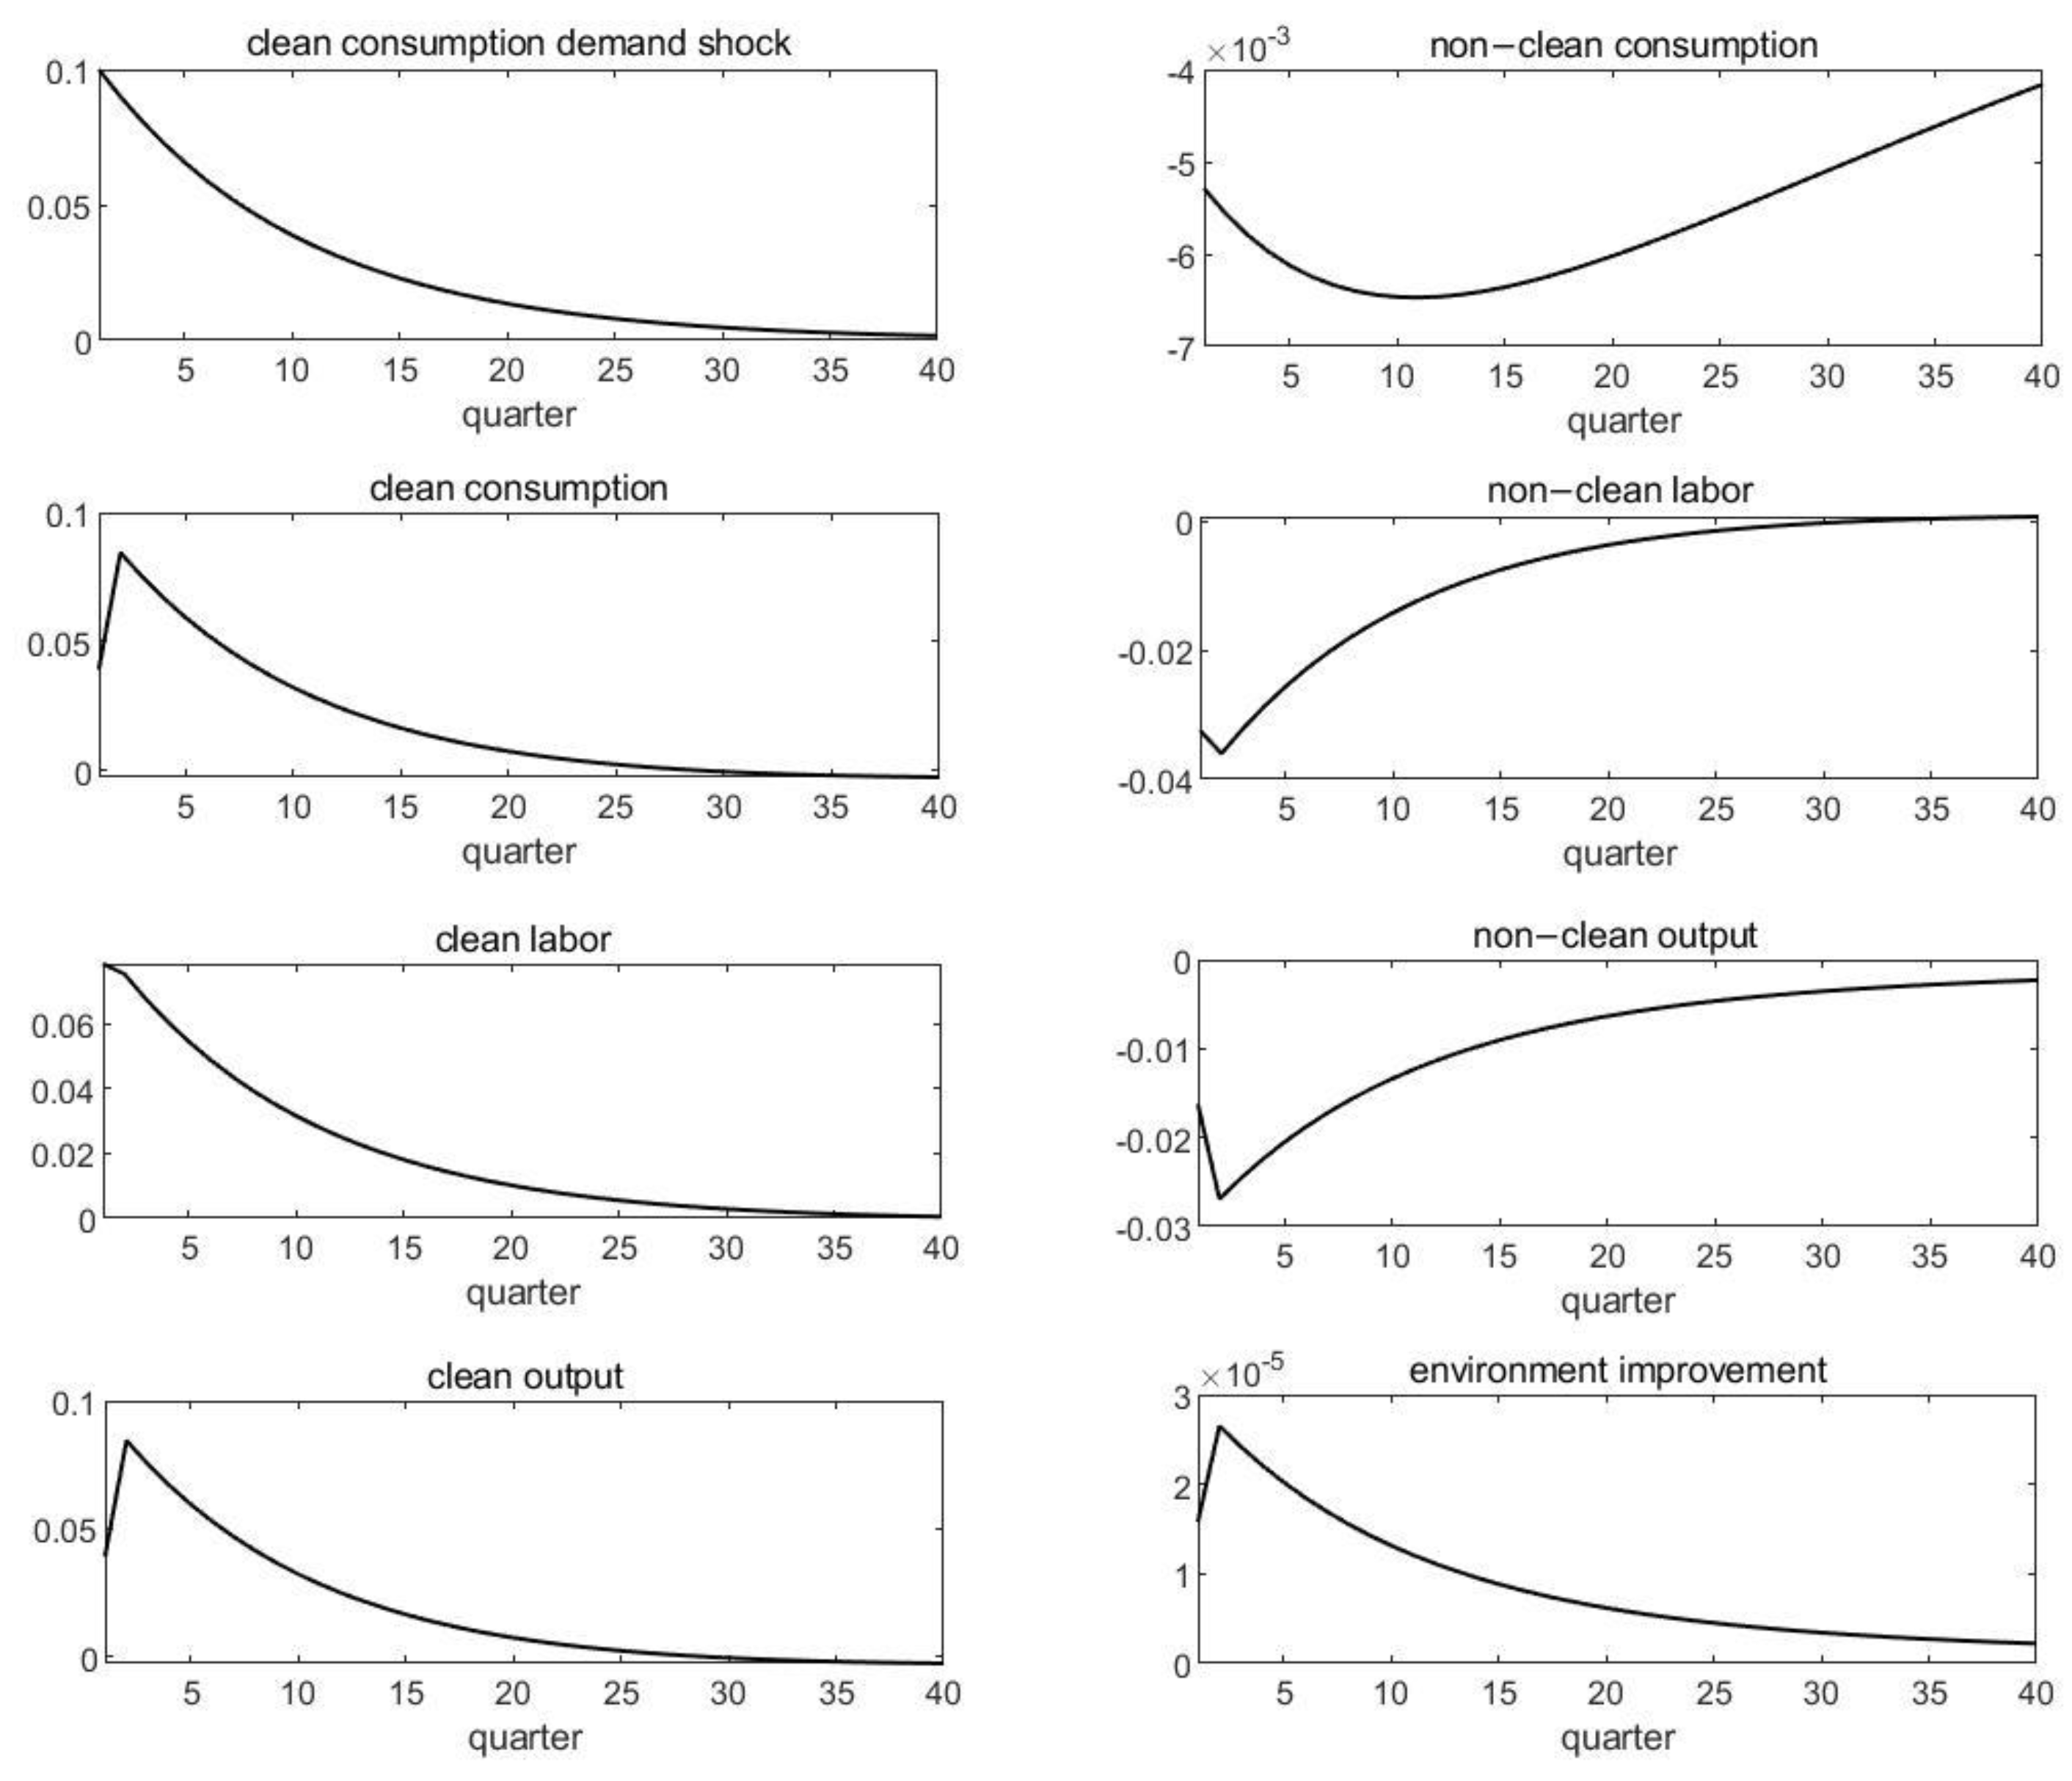
Figure 1. Impulse response (demand-driven).
Sustainability 14 04869 g001
Figure 2. Impulse response (supply-driven, subsidy).
Sustainability 14 04869 g002
Figure 3. Impulse response (supply-driven, tax).
Sustainability 14 04869 g003
Figure 4. Impulse response (comparison).
Sustainability 14 04869 g004
Table 1. Parameter calibration.
ParametersValueDescription
α 0.5Capital share
β 0.995Subjective discount factor
η 2Inverse Frisch elasticity
δ 0.025Depreciation rate
ξ 2.46Environment disruption parameter
ε 0.001Environment self-healing parameters
ρ a t j 0.9Persistence of TFP shock
ε a t j 0.1S.D. of TFP shock
ρ ϕ 0.9Persistence of clean consumption demand shock
ε ϕ t 0.1S.D. of clean consumption demand shock
c d / y d 0.3645Steady-state of non-clean consumption to non-clean output
Data source: Chinese National Bureau of Statistics.
Table 2. Macroeconomic stability and welfare analysis.
Demand-DrivenSupply-Driven (Subsidy) Supply-Driven (Tax)
S.D. of non-clean consumption0.03800.04290.0470
S.D. of clean consumption0.18660.18070.1873
S.D. of labor supply0.02120.02130.0210
S.D. of non-clean capital0.06530.07030.0782
S.D. of clean capital0.19780.19170.2009
Welfare gains (%)-−0.31 × 10³−0.14 × 10³
Note: Social welfare in this paper is calculated by the Taylor first-order approximation of utility function [21].
Table 3. Economic fluctuations and welfare analysis.
Decentralized EquilibriumSocial Planner Equilibrium
S.D. of non-clean consumption0.03800.0413
S.D. of clean consumption0.18660.1983
S.D. of labor supply0.02120.0173
S.D. of non-clean capital0.06530.0834
S.D. of clean capital0.19780.2145
Welfare gains (%)-6.21 × 10⁻⁴
Table 4. The optimal environmental policy package.
PolicyValueMechanism
I: with green consumptionI-1: only subsidize clean consumption by s c c s c c = ξ ω t 1 ξ ω t The demand curve of clean goods moves outward to increase its consumption.
I-2: subsidize clean consumption by s c c + subsidize clean output by s c ( 1 + s c c ) ( 1 s c ) = 1 1 ξ ω t The demand curve and supply curve of clean goods move outward at the same time.
I-3: subsidize clean consumption by s c c + environmental tax on non-clean output by τ I 1 + s c c 1 τ I = 1 1 ξ ω t The demand curve of clean goods moves outward and the supply curve of non-clean output moves inward.
II: no green consumptionII-1: only environmental tax on non-clean output by τ I I τ I I = ξ ω t The supply curve of non-clean output moves inward to suppress its output incentive.
II-2: environmental tax on non-clean output by τ I I + subsidize clean output by s c 1 s c 1 τ I I = 1 1 ξ ω t The non-clean output supply curve moves inward to reduce the output, and at the same time moves the clean output supply curve outward to stimulate production.
Note: If only the clean output is subsidized, the relative price p c t / p d t will decrease by moving the clean output supply curve outward with other conditions unchanged. Although this policy can increase clean output and improve environmental quality, the result is not the first best.
Publisher’s Note: MDPI stays neutral with regard to jurisdictional claims in published maps and institutional affiliations.