Article

Does Business Group’s Conscious of Social Responsibility Enhance its Investment Efficiency? Evidence from ESG Disclosure of China’s Listed Companies

School of Economics, Hua Zhong University of Science and Technology, Wuhan 430074, China
*
Author to whom correspondence should be addressed.
Sustainability 2022, 14(8), 4817; https://doi.org/10.3390/su14084817
Submission received: 12 March 2022 / Revised: 15 April 2022 / Accepted: 15 April 2022 / Published: 17 April 2022
(This article belongs to the Topic Climate Change and Environmental Sustainability)

Abstract

:
Business groups are industry exemplars whose investment decisions and social responsibility commitments are important for future sustainable development. We use data from China’s listed firms from 2012 to 2018 to investigate the effects of ESG-related disclosure on corporate investment efficiency by comparing the heterogeneity in ESG-related disclosure between group-affiliated firms and standalone firms, as well as between member firms within groups at different pyramid levels. We find that (1) group-affiliated firms are more willing to disclose ESG information than independent ones, and compared with lower-level pyramid member firms, higher-level pyramid member firms have a higher propensity of ESG disclosure; (2) over-investment for group-affiliated firms and under-investment for higher-level pyramid member firms are all moderated by their higher propensity for ESG disclosure. That is, corporate disclosure of ESG information significantly promotes investment efficiency; (3) by grouping the sample firms according to analyst attention and industry external financing dependence, respectively, we find that the promotion effect of ESG disclosure on corporate investment efficiency is more significant when the firms are followed by fewer analysts, or when firms belong to industries with higher external financing dependence. Our findings suggest that ESG disclosure plays an important role in driving a firm’s investment toward desirable levels.

1. Introduction

In the context of carbon peaking and carbon neutrality targets, a firm’s sustainable practices are of increasing interest to investors than its operational and financial gains [1]. In order to attract investors’ attention, firms are increasingly concerned about their performance in environmental protection, social responsibility and corporate governance (ESG) [2]. ESG consists of three major components: environmental protection (E), social responsibility (S) and corporate governance (G), covering various aspects such as pollutant emissions, energy waste or low utilization, social welfare donations, product responsibility and board independence and diversity. Corporate disclosure of ESG-related information is an important signal of corporate efforts on sustainable development [3] and may convey to stakeholders about firms’ risk information to some extent [1,4]. Substantial studies document that good ESG performance helps to alleviate financial constrain [5,6] and to add corporate value [7,8,9,10,11]; however, little deals with the effects of ESG disclosure on corporate investment efficiency.
The efficiency of corporate investments is a fundamental issue concerning the long-term quality development of companies. In a perfect capital market, all positive net present value investment projects should be financed until their marginal return on investment equals the marginal cost [12]. However, real-world financial frictions, such as information asymmetry and agency problems, often cause firms to invest away from optimal investment levels [13]. Previous studies have shown that corporate disclosure on social responsibility helps to reduce information asymmetry between external investors and firms [14,15] and reduce corporate financing costs [6,16], which can be helpful in alleviating corporate under-investment and improving investment efficiency [17,18,19]. However, since corporate social responsibility often incurs higher costs [20,21], there is still a majority of firms that are reluctant to disclose CSR.
According to a survey by KPMG, 78% of China’s top 100 companies, usually large business groups, disclose CSR information, and 81% of these CSR reports made relevant disclosures with reference to the Global Reporting Initiative’s (GRI) G3 Guidelines (Sustainability Reporting Guidelines, Third Edition). This implies that business groups may have a higher propensity to disclose CSR than standalone firms. As business groups have a more significant social impact, they may have a greater incentive to disclose CSR due to factors such as corporate branding, public pressure, group image and the cost of violation [22,23,24]. Given this, we first explore the willingness of business groups on ESG-related disclosure, a field under-explored. Then, we examined the effects of ESG-related information disclosure for group affiliates on corporate investment efficiency.
There are two reasons for using China’s business groups as the study sample. First, business groups are popular in China and contribute more than 60% of China’s industrial production [25,26]. Second, the organizational structure of China’s business groups is mostly in the form of pyramids, and there is a relatively serious agency problem in pyramidal organizational structures [27,28]. The inherent complexity makes it heterogeneous in ESG disclosure and investment efficiency issues within business groups, which adds interest to our question.
We contribute to the existing literature in four important aspects. First, we manually collected the data of business groups based on annual reports of listed companies and organized them to get more complete data on the pyramid hierarchy. Second, this paper is the first one to study the relationship between ESG disclosure and business groups, filling the gap in the literature related to ESG disclosure and business groups. Third, we examine the differences in ESG disclosure and investment efficiency between standalone firms and group affiliates and between group affiliates as well. Fourth, we provide empirical evidence on the role of ESG disclosure in mitigating group agency problems and promoting corporate investment efficiency.
The remainder of the paper is organized as follows. Section 2 states hypothesis development. Section 3 provides a description of variables and data used in this study and sets up a model for regression. Section 4 reports regression results. Section 5 concludes this paper and gives policy recommendations.

2. Hypothesis Developments

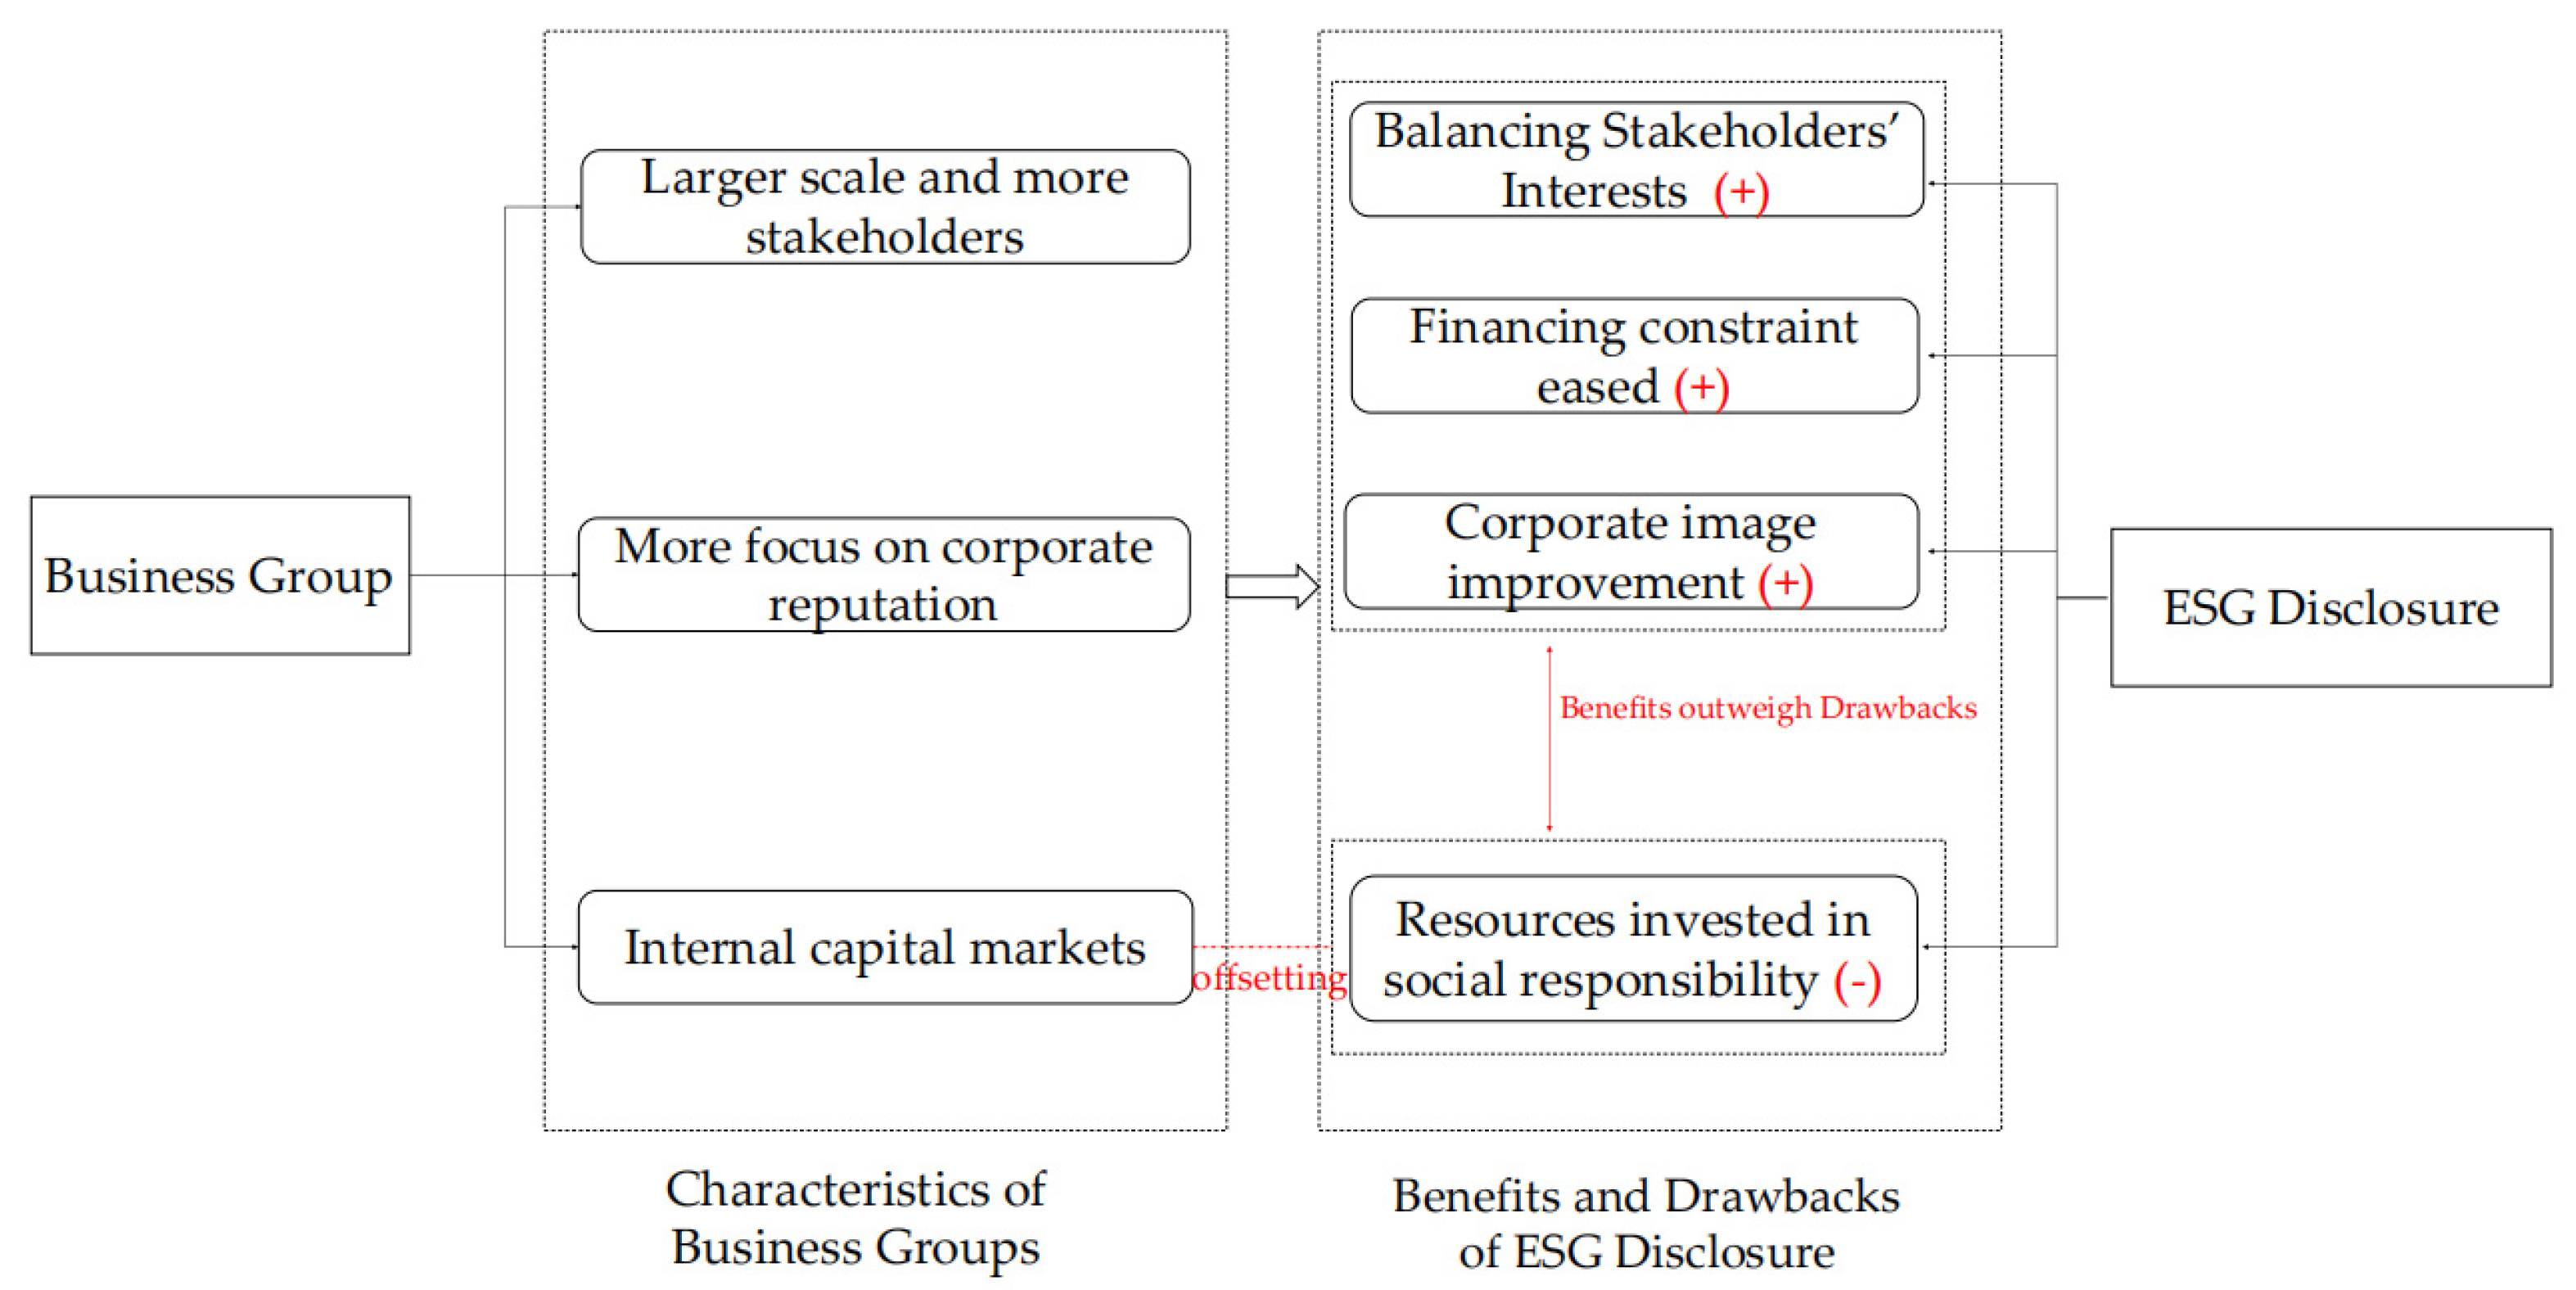
2.1. Business Group and ESG Disclosure

With the promotion of green and sustainability concepts, firms are forced to sacrifice part of their revenue or pay extra costs to make environmental improvements [7,29]. However, if firms take on too much environmental and social responsibility, it can lead to less investment in other projects due to resources being tied up and thus impair firm value [20,21]. The unfavorable factor makes some firms reluctant to waste excessive resources on undertaking social responsibility and, therefore, reluctant to disclose ESG-related information, especially for standalone firms, with more limited or even lacking resources.
Unlike standalone firms, group affiliates may have a higher propensity for ESG disclosure. On the one hand, in contrast to “singular” firms, business groups formed through formal and informal ties can work as an entity, pooling internal resources and gaining access to scarce resources in the external market [22,30]. In this sense, the internal capital market within a business group acts as a financing channel to help affiliates overcome external financial constraints and provide internal funding [25,30]. Adequate capital flow makes it possible for group-affiliated firms to have fewer problems with resources tied up in social responsibility. Thus, group-affiliated firms are willing to invest more funds in social responsibility. On the other hand, a majority of the literature has confirmed that better ESG performance or corporate socially responsible behavior has a positive impact on corporate reputation [31], risk reduction [1,32], information asymmetry lessening and others [14,15] and that CSR can be a source of innovation and competitive advantage [33]. Therefore, in terms of the benefits of ESG-related disclosure for business groups, group affiliates also have an incentive to take an active role in social responsibility. Firstly, reputation and brand awareness are important issues concerning the value of business groups [34]. Since reputation is highly exclusive and inimitable, it is often considered as the intangible capital of a firm with strategic value. A good reputation can bring long-term benefits to a firm by giving the public a positive signal of the firm’s high quality [35,36]. Under the consideration of the public expectations and corporate image, business groups may have a higher propensity to disclose ESG information as the improvement of corporate reputation resulting from ESG disclosure can attract more external investors. Secondly, some studies have shown that larger firms usually have a higher propensity to disclose CSR information [37] due to a large number of stakeholders exerting pressure on firms to take an active role in social responsibility [38]. For business groups, the larger business scale of them brings more stakeholders (e.g., employees, suppliers, consumers and governments). As active involvement in CSR can better balance the interests of multiple parties [39,40] and lead to more effective contracting [41], group affiliates may be more willing to disclose ESG information when the interests of stakeholders are taken into account. Therefore, the positive effects of ESG disclosure for business groups may outweigh the negative effects. We present the main mechanisms based on the above analysis in Figure 1. Given this, we propose the following hypothesis:
Hypothesis 1 (H1a).
Compared with standalone firms, group-affiliated firms have a higher propensity for ESG-related disclosure.
Although business groups may be more willing to disclose ESG-related information, there are differences in the propensity of disclosure among member firms. Substantial studies on the internal capital markets of business groups have documented that business groups can provide support to members firms through internal capital allocation [30,34]. However, quite a lot of the literature has also shown that internal capital markets for business groups can be inefficient [42,43,44], especially in some emerging market countries with poor protection of minority shareholders [45]. According to agency theory, the incentive to maximize self-interests induces large shareholders to use their control rights to infringe on the interests of minority shareholders [46]. The conflict between major and minor shareholders may lead to heterogeneity in the ESG disclosure propensity among group member firms.
From the perspective of organizational structure, China’s business groups are mostly organized in a pyramidal structure [27]. However, pyramidally controlled groups usually have more serious agency problems (Type II agency problems) since the pyramid structure increases the degree of separation between control and cash flow rights [47,48]. This separation of control and cash flow rights exacerbates the self-interest motive of the majority shareholders and generates the tunneling effect [43,49]. The tunneling effect in pyramidally controlled groups refers to the controlling shareholder at the top of the pyramid (lower pyramid level according to the length of the control chain) using the firms at the bottom of the pyramid (higher pyramid level according to the length of the control chain) as a financing platform and performing “hollowing out” on it [43,44]. The wealth transfer behavior by the majority shareholders (shareholders at the top of the pyramid) at the expense of minority shareholders (shareholders at the bottom of the pyramid) may impair the interests of the minority shareholders [50] and amplify their financing restrictions. As a result, the member firms at the bottom of tge pyramid may be more willing to disclose ESG-related information than the firms at the top of the pyramid because they need to attract external investors and obtain external financial support. Conversely, member firms at the top of the pyramid will be less sensitive to positive market reactions to ESG disclosure because they can obtain funding through wealth transfer behaviors. Figure 2 shows the corresponding mechanisms of the above analysis. Given this, we propose the following hypothesis:
Hypothesis 1 (H1b).
Compared with the top pyramid group-affiliated firms, the bottom pyramid member firms have a higher propensity for ESG-related disclosure.

2.2. Business Group, ESG Disclosure and Investment Efficiency

Inefficient investment is usually associated with information asymmetry and agency problems [12,13], while under-funding caused by information asymmetry leads to under-investment and agency problems caused by conflicts of interest between management and shareholders (Type I agency problems) often leads to over-investment. Extensive studies suggest that information disclosure has a positive impact on corporate investment efficiency [17,18,19]. In terms of information asymmetry mitigation, truthful disclosure of a firm’s financial information can reduce the information asymmetry between firms and external investors and thus reduce adverse selection problems [51,52]. At the same time, information disclosure may increase the knowledge of external investors about the firm, making financially constrained firms sufficiently exposed to new investment opportunities [53]. On the other hand, from an agency problem perspective, information disclosure can reduce managers’ empire-building incentives and align interests between managers and shareholders by exerting a monitoring effect [19]. Due to the fact that information disclosure can convey the risk-taking preferences of managers to shareholders, some managers’ risky actions can be stopped in time [51]. According to stakeholder theory, the mechanism linking investment efficiency and CSR disclosure quality is the improvement of information transparency [16]. It makes managers’ decision-making interests consistent with stakeholders and avoids suboptimal investment choices.
For group affiliates, the existence of internal capital markets allows group affiliates to get free cash flow, and sufficient capital makes it easy for managers to expand investments blindly, resulting in over-investment without effective supervision [54]. This is supported by the study of Biddle et al. (2009), who found that cash-rich firms are more prone to over-investment due to the empire-building motivation for managers [55]. In this case, stronger external supervision can be introduced to inhibit managers’ agency behavior, thus alleviating over-investment and improving corporate investment efficiency. Some studies show that firms that actively participate in environmental and social activities can strengthen their interaction with stakeholders and value stakeholders’ interests more [7,56]. Therefore, when business groups make ESG disclosures, they are subject to greater stakeholder scrutiny while mitigating agency problems and reducing over-investment. That is, a higher propensity of ESG disclosure for group affiliates may play an external monitoring role and mitigate the agency problem caused by the self-interest motivation of managers due to sufficient funds among the business group, thus reducing the over-investment of group affiliates. We show the possible mechanisms in Figure 3. Given this, we propose the following hypothesis:
Hypothesis 2 (H2a).
A higher propensity for ESG-related disclosure of group affiliates helps mitigate agency issues, thereby reducing over-investment and promoting investment efficiency.
The tunneling problem of the pyramid structure makes the investment efficiency of member firms different. Fan et al. (2008) argued that the pyramid structure allows internal capital markets of the business groups, which were originally intended to improve the efficiency of capital allocation, to be partially alienated as a channel for the transfer of benefits to controlling shareholders [57]. When intra-group resources are transferred from bottom firms to top ones, the degree of financing constraints of bottom firms will increase, leading to their under-investment. ESG disclosure is helpful for the improvement of investment efficiency. First, ESG-related disclosure can compensate for company-related information that financial reports cannot reveal and reduce the level of information asymmetry between firms and external investors [58,59]. By disclosing ESG-related information, affiliates at the bottom of the pyramid can obtain support from external investors, thus alleviating corporate under-investment due to financial constraints. Second, the tunneling problem is an agency problem, which is usually caused by the misalignment of interests between the controlling shareholders and the minority shareholders [44,49]. Since corporate governance information (G) is one of the elements of ESG disclosure, effective monitoring by group stakeholders for the overall interest of the group will curb the agency problem within the group, thus reducing the occurrence of tunneling behavior and improving the investment efficiency. The above mechanism analysis is clearly illustrated in Figure 4. Given this, we propose the following hypothesis:
Hypothesis 2 (H2b).
A higher propensity for ESG-related disclosure of group affiliates at the bottom of the pyramid helps mitigate information asymmetry and intra-group agency problems, thereby alleviating under-investment and promoting investment efficiency.
To more clearly illustrate the development of the hypothesis, we present the overall research framework of this paper in Figure 5. The purpose of this paper is to investigate the ESG disclosure propensity of business groups and how their propensity for ESG disclosure affects corporate investment efficiency. We examine it in two steps: First, we examine whether the organizational structure of a business group has an impact on ESG disclosure. From simple group affiliations, significant benefits of ESG disclosure may attract group affiliates to tend to disclose ESG-related information in order to gain reputation and obtain the support of external investors and multiple stakeholders. From a deeper perspective of the pyramid hierarchy of group member firms, the tunneling behavior of lower-level pyramid affiliates at the expense of higher-level pyramid affiliates may lead to differences in ESG disclosure propensity among business group member firms. Since lower-level pyramid affiliates may infringe on the interests of higher-level pyramid affiliates, higher-level pyramid affiliates are more willing to disclose ESG-related information to attract capital support from external investors. Second, based on the first question, the moderating role of ESG disclosure between groups and corporate investment efficiency is further examined. ESG disclosure may not only reduce agency problems by playing a supervisory role, mitigating over-investment of group affiliates; it may also alleviate financing constraints by reducing information asymmetry between higher-level pyramid affiliates and external investors, mitigating under-investment of the higher-level pyramid affiliates. Thus, ESG information disclosure may have the effect of improving the efficiency of corporate investment.

3. Data and Method

3.1. Sample Selection and Data Source

We manually collected data of business groups and pyramids based on annual reports of listed companies and obtained data of environmental, social and governance (ESG) disclosure scores from the Bloomberg database. The financial data used in this paper are obtained from the China Stock Market and Accounting Research (CSMAR) database. We selected China A-share listed companies from 2012 to 2018 as our samples and treated the data as follows: (1) the data of the ultimate controller is unknown are excluded; (2) firms in financial industries and firms missing key financial data are excluded; (3) all continuous variables in the model are Winsorized at the 1% level. Finally, we obtained 5540 observations.

3.2. Variable Definitions

3.2.1. Investment Efficiency

Drawing on Richardson (2006) [60], we measure investment efficiency as the difference between actual and expected investment. The specific equation is as follows:
I n v t i , t = β 0 + β 1 T o b i n Q i , t 1 + β 2 L e v i , t 1 + β 3 C a s h i , t 1 + β 4 A g e i , t 1 + β 5 S i z e i , t 1 + β 6 R e t s i , t 1 + β 7 I n v t i , t 1 + ξ i , t
where I n v t i , t is the firm’s new investment in period t, measured by the ratio of the firm’s new investment to total assets; T o b i n Q i , t 1 is Tobin’s Q value; L e v i , t 1 is a proxy variable for the book value of the debt; C a s h i , t 1 represents the firm’s cash holdings in period t − 1; A g e i , t 1 denotes the age of firms listing; S i z e i , t 1 measured by the natural logarithm of the book value of total assets at the end of the fiscal year; and R e t s i , t 1 is a proxy variable of annual stock return. After controlling for year and industry fixed effects, we obtain the estimated residuals of model (1) and take the absolute value of them. The larger the residuals, the larger the corporate investment deviation and the lower the investment efficiency. We select the observations with residual terms less than 0 as the sub-sample of corporate under-investment and take the absolute value of their residuals, denoted as U n d e r i n v , and select the observations with residual terms greater than 0 as the sub-sample of corporate over-investment and take the absolute value of their residuals, denoted as O v e r i n v .

3.2.2. ESG Disclosure

The data from Bloomberg not only provides disclosure scores of firms on the environment (E), social responsibility (S) and corporate governance (G) but also shows overall ESG disclosure scores of firms, ranging in [0, 100], with higher scores indicating better ESG-related disclosure.

3.2.3. Business Group

It is generally believed that a business group is an organizational structure formed by many member firms with independent legal personalities through formal or informal associations [61]. From the perspective of the group formation and development process, business groups are large cross-regional and cross-industry economic consortia formed through asset restructuring or mergers and acquisitions, marked by capital association and cross-shareholdings. In this paper, referring to He et al. (2013) [25], we determine that the affiliates belong to the same group according to the following steps: (1) manually identify the ultimate controllers of listed firms based on the ownership structure disclosed in their annual reports; (2) treat listed firms that can be traced to the same ultimate final controller as belonging to the same business group, and define the group dummy variable equal to one. An example of the ownership structure of a business group is shown in Figure 6.

3.2.4. Pyramid Hierarchy

Business groups in China are formed by typical pyramid organizational structures [27], where the ultimate controller is usually at the top of the pyramid and indirectly controls the subsidiaries through several intermediate firms at each level. The pyramid structure allows the controller to gain control of the subsidiary with a small amount of cash flow rights [44]. The longer the intermediate chain of the pyramid, the larger the size of the assets controlled by the controlling shareholder with the same wealth, and the controlling shareholder located at the top of the pyramid has greater power to deploy resources. According to Fan et al. (2005) [27], we calculate the hierarchy of member firms based on the length of the control chain up to the ultimate controller, and Layer is a proxy variable of the pyramid hierarchy of member firms. For example, when the ultimate controller directly controls the enterprise, Layer is equal to 1; and when there is only one intermediate controller between the ultimate controller and the enterprise, Layer is equal to 2, and so on. The smaller the Layer, the closer the firm is located to the top of the pyramid, with more resources to deploy and enjoy a greater wealth effect. The pyramid hierarchy of Huatian Industrial Holdings Group, as an example, is shown in Figure 7.

3.2.5. Control Variables

To minimize the possible impact of potential factors on the ESG disclosure propensity of business groups and the efficiency of corporate investment, drawing on Eng and Mark (2003) [37] as well as Zhang and Gao (2017) [17], we include a series of control variables. First, the variables related to firm characteristics, such as size, leverage and firm age, where firm size (Size), calculated as the natural logarithm of the book value of total assets at the end of the fiscal year, and firm leverage (Lev), measured as the ratio of the book value of debt to the book value of total assets, followed by firm age (Age), which is the number of years since the company was established, and the firm nature (Soe), which is an indicator variable equal to one when a firm is state-owned, and zero otherwise. It has been documented in the literature that firm characteristics have an important impact on CSR information disclosure and corporate investment efficiency [37]. Second, variables related to corporate operations. Such as, the return on total assets (ROA), measured as the ratio of net income to the book value of total assets, capital intensity (Tang), which is measured as the ratio of the net value of fixed assets to the book value of total assets, cash flow (OCF), measured as the ratio of cash flow to the book value of total assets, and the TobinQ value (TobinQ), which is the ratio of the market value to the book value of the firm’s assets. Finally, corporate governance-related variables, including the shareholding of the largest shareholder (Top1) and the proportion of independent directors (Indep). Poorer corporate governance may be associated with lower disclosure propensity and lower corporate investment efficiency.

3.3. Method

To examine the propensity of ESG-related disclosure of group-affiliated firms and the member firms located at different pyramid hierarchies, referring to Huang et al. (2021) [22], we set up the model as follows:
ESG i , t = λ 0 + λ 1 Group i , t + λ n * Controls i , t + η i + η ind + ε i , t
ESG i , t = γ 0 + γ 1 Group i , t + γ 2 Layer i , t + γ 3 Group i , t * Layer i . t + γ n * Controls i , t + ζ i + ζ ind + μ i , t
To examine the effect of the ESG’s disclosure willingness of group affiliations and member firms at different pyramid hierarchies on corporate efficiency, we conducted the test in two steps. Referring to the practice of the existing literature [17,51], in the first step, we examine the relationship between group affiliation and investment efficiency, as well as the relationship between the pyramid hierarchy of member firms and investment efficiency, and the equations are as follows:
Absinv i , t = θ 0 + θ 1 Group i , t + θ n * Controls i , t + φ i + φ ind + υ i , t
Absinv i , t = ϑ 0 + ϑ 1 Group i , t + ϑ 2 Layer i , t + ϑ 3 Group i , t * Layer i . t + ϑ n * Controls i , t + λ i + λ ind + ω i , t
In the second step, we examine the effect of ESG disclosure of group-affiliated firms and member firms at different pyramid hierarchies on corporate investment efficiency, and the models are specified as follows:
Absinv i , t = ρ 0 + ρ 1 Group i , t + ρ 2 ESG i , t + ρ 3 Group i , t * ESG i , t + ρ n * Controls i , t + σ i + σ ind + τ i , t
Absinv i , t = σ 0 + σ 1 Group i , t + σ 2 Layer i , t + σ 3 ESG i , t + σ 4 Group i , t * Layer i . t + σ 5 Group i , t * ESG i , t + σ 6 Layer i , t * ESG i , t + σ 7 Group i , t * ESG i , t * Layer i , t + σ n * Controls i , t + ϕ i + ϕ ind + δ i , t

4. Results

In this section, we estimate the above model by using OLS regression and testing the previous research hypotheses. In all models, the year and industry-fixed effects are controlled in order to obtain relatively reliable results.

4.1. Descriptive Statistics

Table 1 shows the results of descriptive statistics of the main variables. It can be seen that the proportion of sample enterprises belonging to business groups is about 39.91%, which indicates that business groups are common in China. The minimum and the maximum values of the pyramid hierarchy is 1 and 11, respectively, suggesting that there is a significant difference in the number of pyramid levels of member firms. In addition, the average value of under-investment and over-investment is 0.0245 and 0.0500, respectively. According to Table 1, the score of environmental disclosure is the lowest, with an average value of 10.4477, while the highest score is corporate governance disclosure, with an average value of 45.6670. Therefore, encouraging companies to disclose environmental and social-related information will be the focus of the future development of ESG disclosure guidelines, which is important for promoting sustainable corporate development.

4.2. Propensity of Business Groups on ESG Disclosure

Table 2 presents the correlation between corporate groups and corporate ESG disclosure, where column (1) is based on the regression results of model (2), i.e., the propensity of group-affiliated firms to disclose ESG-related information. The effects of business groups disclosing information on the three sub-dimensions of environmental, social and governance are shown in columns (2) to (4), respectively. In column (1), the estimated coefficients of business groups are significantly positive, which indicates that group-affiliated firms are more willing to disclose ESG-related information compared to standalone firms, thus supporting the hypothesis H1(a). We further examine the willingness of group-affiliated firms to disclose information in the three sub-dimensions of environmental, social and governance, respectively. We found a significantly positive effect of group affiliations on environmental and social disclosure according to columns (2) and (3), but for business groups, they are relatively reluctant to disclose governance-related information, which may be related to the more serious agency problems within business groups.

4.3. Different Propensity of Pyramid Member Firms on ESG Disclosure

Based on model (3), we examine the ESG information disclosure intention of group member firms located at different pyramid levels and present the results in column (1) of Table 3. The remaining three columns show the willingness of member firms located at different pyramid levels to disclose information on the three sub-dimensions of environmental, social and governance. In column (1), the estimated coefficient of the interaction term Group*Layer is significantly positive, indicating that the higher the pyramid level of group member firms, the more willing they are to disclose ESG-related information. That is, due to the intra-group agency problem, the resources of the bottom firms are deployed to the top-level controllers, resulting in the member firms at the bottom of the pyramid being more willing to disclose ESG information and thus obtain resources through external investor support, validating the hypothesis of H1(b). The regression results of the last three columns of sub-indicators also validate this finding well.

4.4. The Moderating Effect of ESG Disclosure on the Investment Efficiency

To examine how the stronger willingness of business groups to disclose ESG information affects corporate investment efficiency, we examine it in two steps. We first examine the investment efficiency of group-affiliated firms and member firms at different pyramid levels, further followed by an examination of the moderating effect of corporate ESG disclosure.

4.4.1. Business Group and Investment Efficiency

Table 4 reports the relationship between business groups and corporate investment efficiency, where column (1) shows the regression results for the total sample, and columns (2) and (3) show the regression results for the under-invested and over-invested sub-samples, respectively. From Table 4, we can see that group affiliation has a positive effect on over-investment. The problem of inefficient investment for group-affiliated firms is due to the fact that the internal capital market of business groups gives more financial support to its member firms and relaxes the financing constraints in their investment process [30,62], which leads to deviation from the optimal investment level.

4.4.2. Pyramid Levels and Investment Efficiency

The existence of the agency problem leads to the fact that the financing constraints faced by group member firms located at different pyramid levels are different, and, therefore, the investment efficiency is also different. In Table 5, we can see that firms at the bottom of the pyramid structure are more likely to under-invest than those at the top of the pyramid, with the interaction term Group*Layer being significantly positive. The tunneling behavior shifts resources from the bottom firms to the top controller tightens the financing constraints of the bottom firms [28] and leads to under-investment problems.

4.4.3. The Effect of ESG Disclosure on Group-Affiliated Firm’s Investment Efficiency

Table 6 presents the regression results of the effect of a higher propensity of group affiliates to disclose ESG information on their investment efficiency. Since business groups have many stakeholders, balancing the interests of stakeholders through ESG disclosure can be subject to stronger social supervision, thus preventing managers from blindly expanding the investment scale for their own interests and alleviating the problem of over-investment. In Table 6, we can see that the estimated coefficient of the interaction term Group*ESG is significantly negative in the sample group of corporate over-investment, which indicates that group affiliates can indeed mitigate the problem of corporate over-investment by disclosing ESG-related information, which leads to a decrease in corporate investment deviation and an increase in investment efficiency, thus verifying the hypothesis H2(a).

4.4.4. Pyramid Levels, ESG Disclosure and Investment Efficiency

From the previous analysis, it is clear that the group member firms with higher pyramid levels (the member firms at the bottom of the pyramid) are usually the financing platform of the business group, and their resources are easily appropriated by the major shareholders; therefore, the member firms with higher pyramid levels are more prone to under-investment. Table 7 presents the corresponding regression results. In Table 7, the estimated coefficient of the interaction term ESG*Group*Layer is significantly negative for both the total sample of investment efficiency and the sub-sample of under-investment. The under-investment problem of pyramid member firms at higher levels is moderated by their higher propensity for ESG disclosure, supporting hypothesis H2(b). ESG disclosure alleviates the agency problem within the group by amplifying the external monitoring effect and gains the support of external investors, easing the financing constraints of member firms at the bottom of the pyramid, resulting in less corporate under-investment and more efficient corporate investment.

4.5. Mechanism Testing

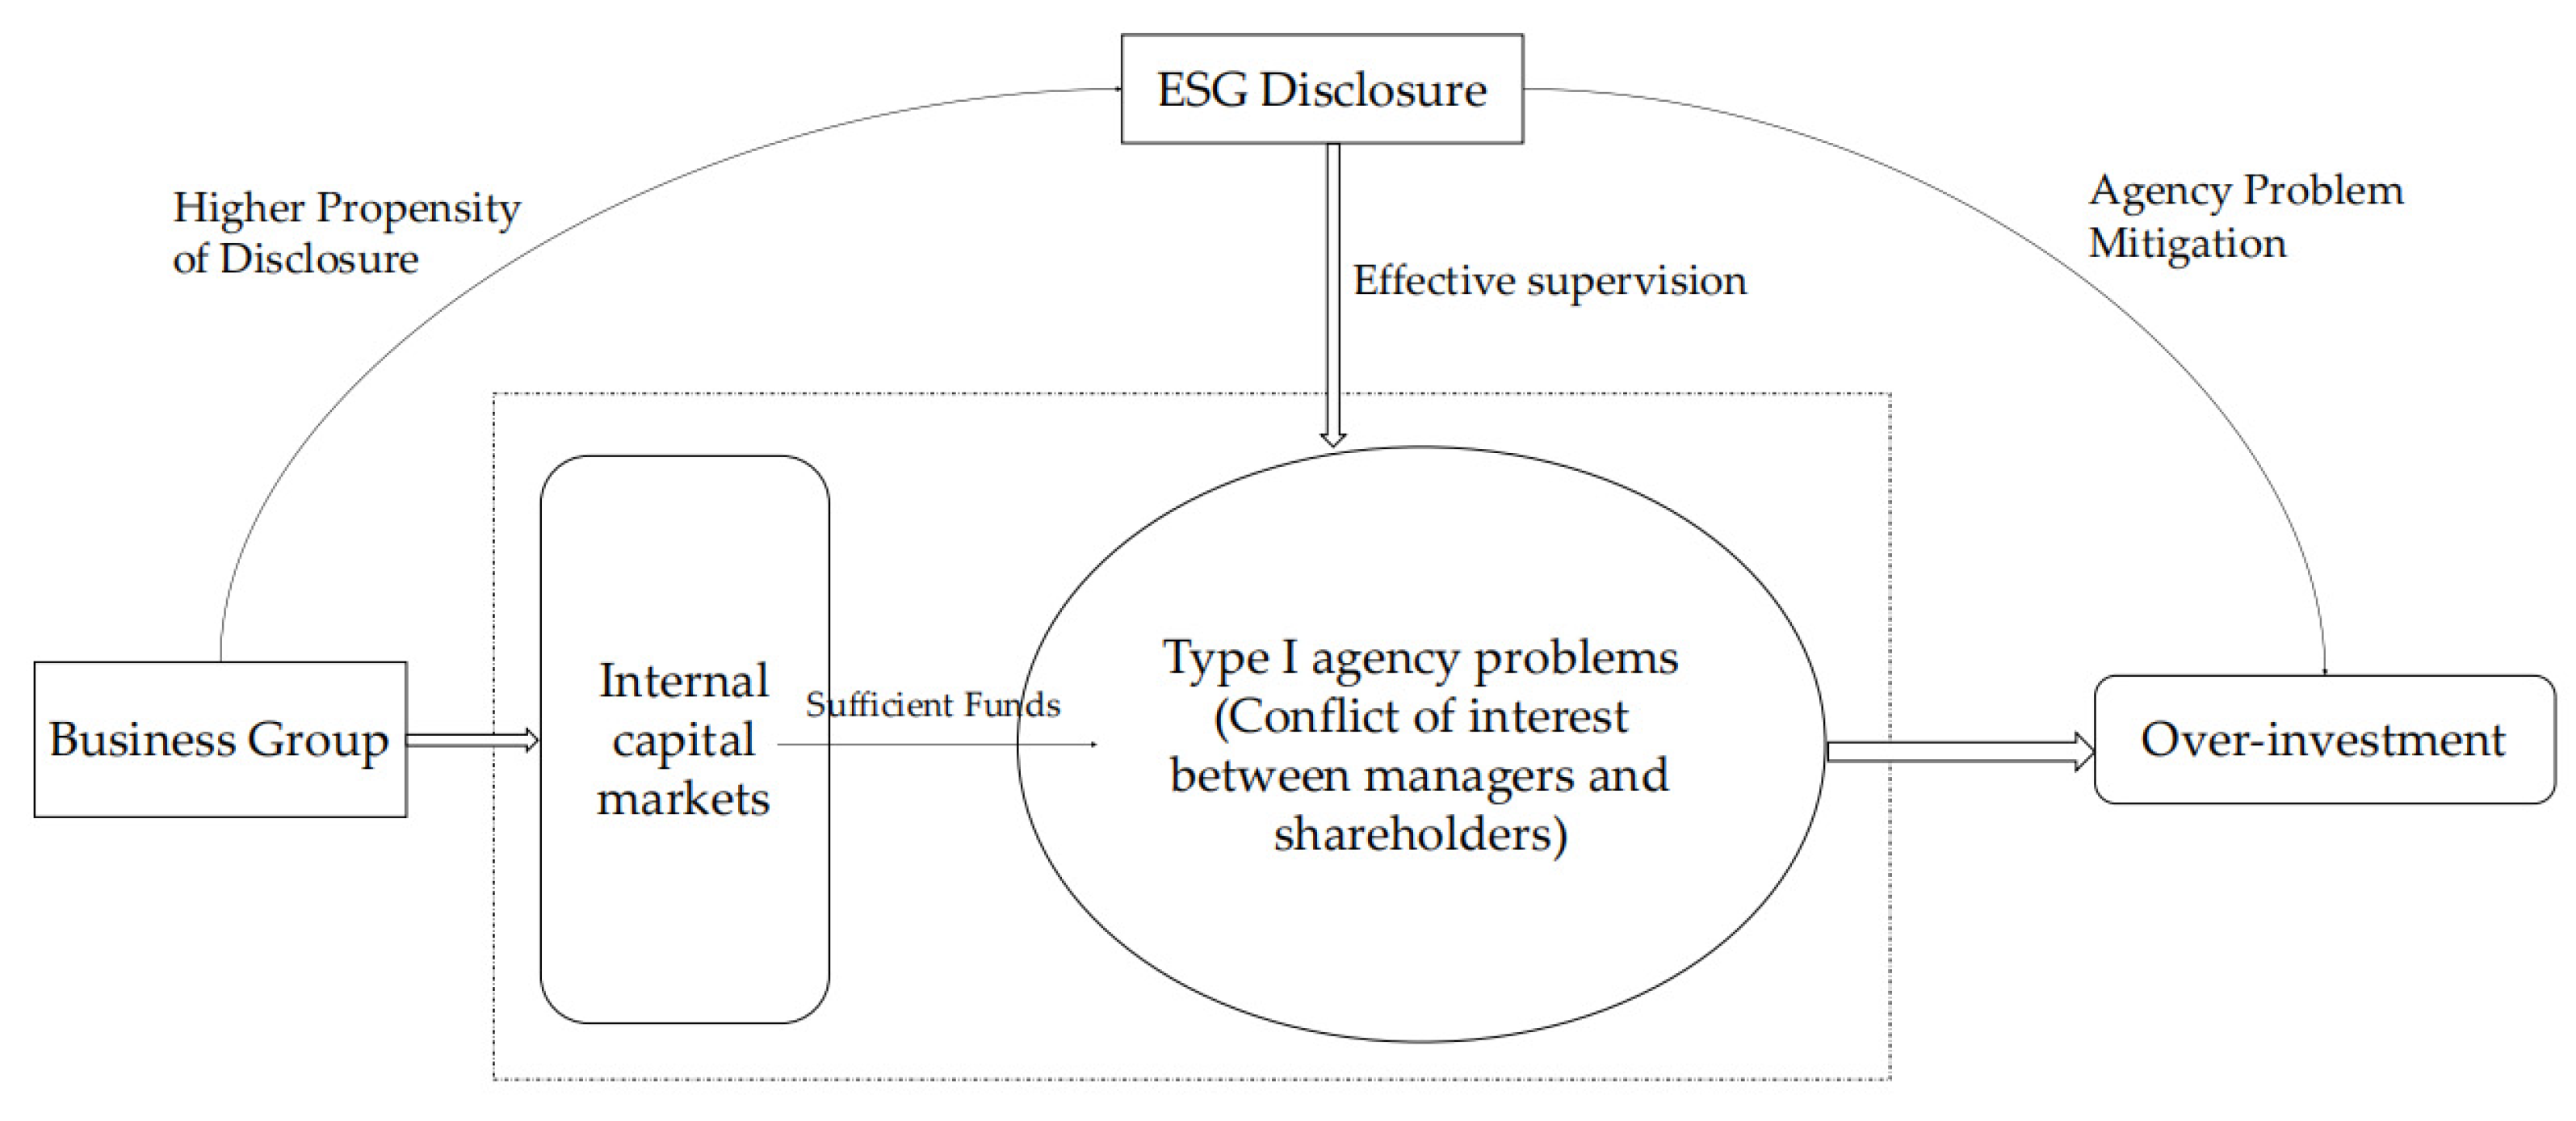
4.5.1. Mitigating Effects of ESG Disclosures on Agency Problems

The previous analysis found that group affiliates have more capital flow than standalone firms, which leads to a tendency for management to over-invest for self-interest motives. The higher ESG disclosure willingness of group-affiliated firms can reduce the over-investment problem by eliciting effective stakeholder monitoring and reducing management agency motives. Then, the external monitoring effect of ESG disclosure will be weakened if the firm itself is subject to stronger external monitoring. For this reason, we use analyst attention (Analyst) to measure the extent to which group affiliates are subject to external monitoring. Typically, being followed by more analysts indicates more analyst attention a firm receives, and the stronger the external monitoring a firm is subjected to [63]. We counted the number of analysts of group affiliates and grouped them according to their annual median, and if the above inference holds, then the group with lower analyst attention has a stronger negative moderating effect of ESG disclosure on over-investment and more efficient corporate investment because of the weaker external monitoring it receives. Table 8 presents the regression results of the above analysis. We can see that the estimated coefficient of the interaction term ESG*Group is significantly negative in the group with lower analyst attention (Analyst = 0) and insignificant in the group with higher analyst attention, indicating that the moderating effect of ESG disclosure on corporate over-investment is more pronounced when firms are subject to weaker external monitoring and the agency problem mitigating effect of ESG information disclosure holds.

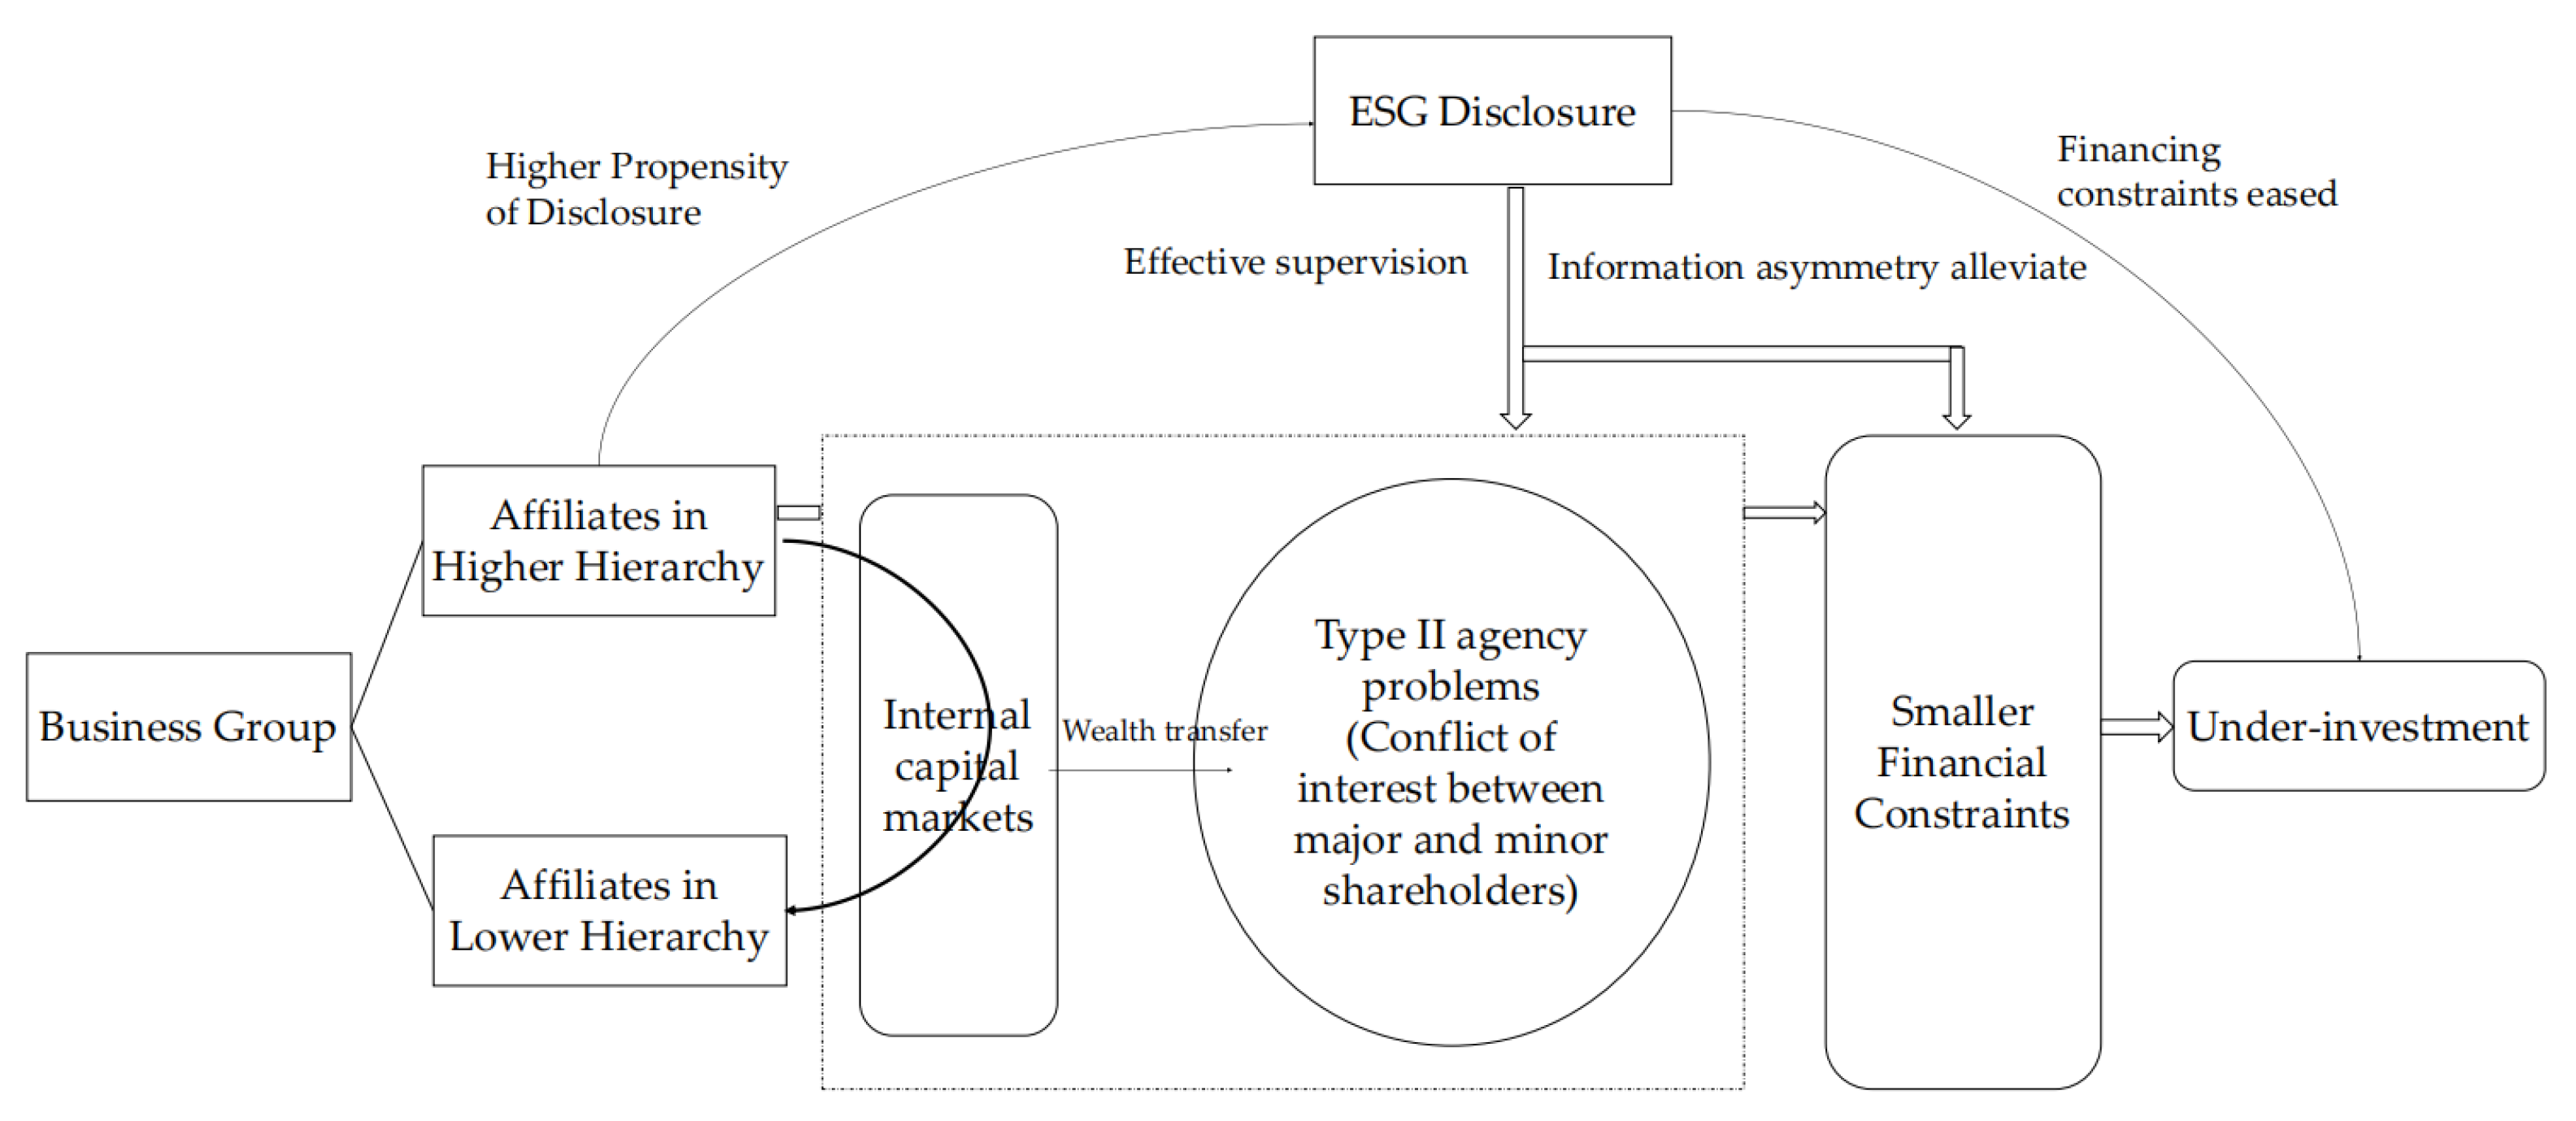
4.5.2. Mitigating Effects of ESG Disclosures on Financial Constrains

As mentioned above, ESG disclosure promotes corporate investment and improves corporate investment efficiency by alleviating the financing constraints of group member firms. Then, when group affiliates are located in industries with higher external financing dependence, the under-investment problem faced by member firms at higher levels of the pyramid should be more serious, and thus the promotion effect of ESG disclosure should be more obvious. We calculate firms’ industry external financing dependence (EFD) drawing on Rajan and Zingales (1998) [64] and then group them according to the annual median. Table 9 presents the relevant regression results. According to Table 9, we can see that the estimated coefficients of the interaction term ESG*Group*Layer are significantly negative for both the total sample of investment efficiency and the sub-sample of under-investment when the group affiliates are located in industries with higher external financing dependence (EFD = 1), which indicates that when the group enterprises with higher pyramid levels face more severe financing constraints, they mitigate the corporate under-investment by disclosing ESG-related information.

5. Conclusions and Policy Implications

5.1. Conclusions

Our findings indicate that group affiliation has a positive effect on ESG-related disclosure, and within pyramidal controlled groups, the propensity of ESG disclosure is heterogeneous, with group affiliates at the bottom of the pyramid structure having a higher propensity to disclose ESG-related information. In addition, we find that group-affiliated firms reduce over-investment and improve their investment efficiency through disclosing ESG-related information, while the under-investment problem is mitigated by the higher propensity of the bottom pyramid member firms. Further, mechanism analysis reveals that ESG disclosure promotes corporate investment efficiency by addressing the occurrence of two types of problems: one is that ESG disclosure can introduce effective external supervision and reduce agency problems; the other is that ESG disclosure can reduce the information asymmetry between firms and external investors, thus obtaining resource support from external investors and alleviating the financing constraints faced by firms, which ultimately enables a group’s over-investment and under-investment to be mitigated. We provide good insights into the positive effects of ESG information disclosure.

5.2. Policy Implications

In recent years, the dramatic changes in the climate have led to a deepening of people’s awareness of environmental protection and sustainable development, which not only provides a new direction for business decisions but also places new demands on policy-makers.
For firms, they should correctly recognize the positive impact of ESG disclosure and change the previous one-sided idea that investing in environmental, social and corporate governance is simply a matter of increasing costs. Especially when society as a whole is paying more and more attention to environmental protection and sustainable development, incorporating ESG performance into the consideration of corporate business decisions is an effective means to reduce corporate financing costs and improve corporate governance. Large business groups, on the other hand, should be good role models in the industry, leading and helping companies to pay attention to sustainable management issues and improve the quality of their ESG disclosure.
For the government and relevant regulatory authorities, accelerating the institutional construction of ESG information disclosure in China and promoting the improvement of ESG rating system standards should become a key task for the development of ecological civilization and green finance in China in the next stage. The government should encourage and guide firms to voluntarily disclose environmental, social and corporate governance-related responsibility information, give policy support to firms with good quality ESG disclosure, and motivate them to continuously improve their environmental performance and information disclosure in their production and operation so as to attract more funds favoring green themes and achieve a virtuous cycle. Environmental protection departments and relevant functional departments should strengthen the sharing and application of data related to corporate environmental information, encourage third-party organizations to actively participate in the collection and release of green environmental information and steadily promote the improvement of regulatory policies and the market environment.

Author Contributions

Conceptualization, M.H.; methodology, M.H. and Z.F.; formal analysis, M.H. and Z.F.; investigation, M.H.; data curation, M.H.; writing—original draft preparation, M.H.; writing—review and editing, M.H. and Z.F.; visualization, M.H.; supervision, Z.F. and Z.L. All authors have read and agreed to the published version of the manuscript.

Funding

This research received no external funding.

Institutional Review Board Statement

Not applicable.

Informed Consent Statement

Not applicable.

Data Availability Statement

The study will not report the data.

Acknowledgments

We are grateful to the editors and the anonymous reviewers for valuable comments and suggestions.

Conflicts of Interest

The authors declare no conflict of interest.

References

  1. Shakil, M.H. Environmental, social and governance performance and financial risk: Moderating role of ESG controversies and board gender diversity. Resour. Policy 2021, 72, 102144. [Google Scholar] [CrossRef]
  2. Eccles, R.G.; Ioannou, I.; Serafeim, G. The impact of corporate sustainability on organizational processes and performance. Manag. Sci. 2014, 60, 2835–2857. [Google Scholar] [CrossRef] [Green Version]
  3. Zhang, F.; Qin, X.; Liu, L. The interaction effect between ESG and green innovation and its impact on firm value from the perspective of information disclosure. Sustainability 2020, 12, 1866. [Google Scholar] [CrossRef] [Green Version]
  4. Nguyen, P.; Nguyen, A. The effect of corporate social responsibility on firm risk. Soc. Responsib. J. 2015, 11, 324–339. [Google Scholar] [CrossRef]
  5. Zhao, C.; Guo, Y.; Yuan, J.; Wu, D.; Zhou, Y.; Kang, J. ESG and corporate financial performance: Empirical evidence from China’s listed power generation companies. Sustainability 2018, 10, 2607. [Google Scholar] [CrossRef] [Green Version]
  6. Dimson, E.; Karakas, O.; Li, X. Active ownership. Rev. Financ. Stud. 2015, 28, 3225–3268. [Google Scholar] [CrossRef] [Green Version]
  7. Fatemi, A.; Glaum, M.; Kaiser, S. ESG performance and firm value: The moderating role of disclosure. Glob. Financ. J. 2018, 38, 45–64. [Google Scholar] [CrossRef]
  8. Fatemi, A.M.; Fooladi, I.J.; Tehranian, H. Valuation effects of corporate social responsibility. J. Bank. Financ. 2015, 59, 182–192. [Google Scholar] [CrossRef]
  9. Malik, M. Value-enhancing capabilities of CSR: A brief review of contemporary literature. J. Bus. Ethics 2015, 127, 419–438. [Google Scholar] [CrossRef]
  10. Porter, M.E.; Kramer, M.R. Creating shared value. Harv. Bus. Rev. 2011, 89, 62–77. [Google Scholar]
  11. Porter, M.E.; Van der Linde, C. Toward a new conception of the environment-competitiveness relationship. J. Econ. Perspect. 1995, 9, 97–118. [Google Scholar] [CrossRef] [Green Version]
  12. Chen, S.; Zheng, S.; Song, T.; Wu, D. Government intervention and investment efficiency: Evidence from China. J. Corp. Financ. 2011, 17, 259–271. [Google Scholar] [CrossRef]
  13. Stein, J.C. Agency, information and corporate investment. Handb. Econ. Financ. 2003, 1, 111–165. [Google Scholar]
  14. Lueg, K.; Krastev, B.; Lueg, R. Bidirectional effects between organizational sustainability disclosure and risk. J. Clean. Prod. 2019, 229, 268–277. [Google Scholar] [CrossRef]
  15. Jia, Y.; Gao, X.; Julian, S. Do firms use corporate social responsibility to insure against stock price risk? Evidence from a natural experiment. Strat. Manag. J. 2020, 41, 290–307. [Google Scholar] [CrossRef]
  16. Cheng, B.; Ioannou, I.; Serafeim, G. Corporate social responsibility and access to finance. Strateg. Manag. J. 2014, 35, 1–23. [Google Scholar] [CrossRef]
  17. Zhong, M.; Gao, L. Does corporate social responsibility disclosure improve firm investment efficiency? Evidence from China. Rev. Financ. Stud. 2017, 16, 348–365. [Google Scholar]
  18. Lin, Y.E.; Li, Y.W.; Cheng, T.Y.; Lam, K. Corporate social responsibility and investment efficiency: Does business strategy matter? Int. Rev. Econ. Financ. 2021, 73, 101585. [Google Scholar] [CrossRef]
  19. Anwar, R.; Malik, J.A. When does corporate social responsibility disclosure affect investment efficiency? A new answer to an old question. SAGE Open 2020, 10, 21582440209. [Google Scholar] [CrossRef]
  20. Friedman, M. The social responsibility of business is to increase its profits. New York Times Magazine, 13 September 1970; 32–33. [Google Scholar]
  21. Sen, S.; Bhattacharya, C.B.; Korschun, D. The role of corporate social responsibility in strengthening multiple stakeholder relationships: A field experiment. J. Acad. Mark. Sci. 2006, 34, 158–166. [Google Scholar] [CrossRef]
  22. Huang, X.; Jiang, X.; Liu, W.; Chen, Q. Business group-affiliation and corporate social responsibility: Evidence from listed companies in China. Sustainability 2021, 13, 2110. [Google Scholar] [CrossRef]
  23. Choi, Y.K.; Han, S.H.; Kwon, Y. CSR activities and internal capital markets: Evidence from Korean business groups. Pac. Basin Financ. J. 2019, 55, 283–298. [Google Scholar] [CrossRef]
  24. Zeng, T. Corporate social responsibility (CSR) in Canadian family firms. Soc. Resp. J. 2021, 17, 703–718. [Google Scholar] [CrossRef]
  25. He, J.; Mao, X.; Rui, O.M.; Zha, X. Business groups in China. J. Corp. Financ. 2013, 22, 166–192. [Google Scholar] [CrossRef] [Green Version]
  26. Yiu, D.; Bruton, G.D.; Lu, Y. Understanding business group performance in an emerging economy: Acquiring resources and capabilities in order to prosper. J. Manag. Stud. 2005, 42, 183–206. [Google Scholar] [CrossRef]
  27. Fan, J.P.H.; Wong, T.J.; Zhang, T. The emergence of corporate pyramids in China. 2005. Available online: https://papers.ssrn.com/sol3/papers.cfm?abstract_id=686582 (accessed on 14 April 2022).
  28. Johnson, S.; La Porta, R.; Lopez-de-Silanes, F.; Shleifer, A. Tunneling. Am. Econ. Rev. 2000, 90, 22–27. [Google Scholar] [CrossRef]
  29. Kim, E.H.; Lyon, T.P. Greenwash vs. brownwash: Exaggeration and undue modesty in corporate sustainability disclosure. Organ. Sci. 2015, 26, 705–723. [Google Scholar] [CrossRef]
  30. Khanna, T.; Palepu, K. Is group affiliation profitable in emerging markets? An analysis of diversified Indian business groups. J. Financ. 2000, 55, 867–891. [Google Scholar] [CrossRef]
  31. Aguilera-Caracuel, J.; Guerrero-Villegas, J.; García-Sánchez, E. Reputation of multinational companies: Corporate social responsibility and internationalization. Eur. J. Manag. Bus. Econ. 2017, 26, 329–346. [Google Scholar] [CrossRef]
  32. Fatemi, A.M.; Fooladi, I.J. Sustainable finance: A new paradigm. Glob. Financ. J. 2013, 24, 101–113. [Google Scholar] [CrossRef]
  33. Porter, M.E.; Kramer, M.R. Strategy and society: The link between competitive advantage and corporate social responsibility. Harv. Bus. Rev. 2006, 84, 78–92. [Google Scholar] [PubMed]
  34. Almeida, H.V.; Wolfenzon, D. A theory of pyramidal ownership and family business groups. J. Financ. 2006, 61, 2637–2680. [Google Scholar] [CrossRef] [Green Version]
  35. Brammer, S.; Brooks, C.; Pavelin, S. Corporate social performance and stock returns: UK evidence from disaggregate measures. Financ. Manag. 2006, 35, 97–116. [Google Scholar] [CrossRef] [Green Version]
  36. Sroufe, R.; Gopalakrishna-Remani, V. Management, social sustainability, reputation, and financial performance relationships: An empirical examination of US firms. Organ. Environ. 2019, 32, 331–362. [Google Scholar] [CrossRef] [Green Version]
  37. Eng, L.L.; Mak, Y.T. Corporate governance and voluntary disclosure. J. Account. Public Policy 2003, 22, 325–345. [Google Scholar] [CrossRef]
  38. Khan, A.; Muttakin, M.B.; Siddiqui, J. Corporate governance and corporate social responsibility disclosures: Evidence from an emerging economy. J. Bus. Ethics 2013, 114, 207–223. [Google Scholar] [CrossRef]
  39. Ullmann, A.A. Data in search of a theory: A critical examination of the relationships among social performance, social disclosure, and economic performance of US firms. Acad. Manag. Rev. 1985, 10, 540–557. [Google Scholar]
  40. Freeman, R.E. Strategic Management: A Stakeholder Approach; Cambridge University Press: Cambridge, UK, 2010. [Google Scholar]
  41. Jones, T.M. Instrumental stakeholder theory: A synthesis of ethics and economics. Acad. Manag. Rev. 1995, 20, 404–437. [Google Scholar] [CrossRef]
  42. Baek, J.S.; Kang, J.K.; Lee, I. Business groups and tunneling: Evidence from private securities offerings by Korean chaebols. J. Financ. 2006, 61, 2415–2449. [Google Scholar] [CrossRef] [Green Version]
  43. Bertrand, M.; Mehta, P.; Mullainathan, S. Ferreting out tunneling: An application to Indian business groups. Q. J. Econ. 2002, 117, 121–148. [Google Scholar] [CrossRef]
  44. Gonenc, H.; Hermes, N. Propping: Evidence from new share issues of Turkish business group firms. J. Multinatl. Financ. Manag. 2008, 18, 261–275. [Google Scholar] [CrossRef]
  45. Ying, Q.; Wang, L. Propping by controlling shareholders, wealth transfer and firm performance: Evidence from Chinese listed companies. China J. Account. Res. 2013, 6, 133–147. [Google Scholar] [CrossRef] [Green Version]
  46. Morck, R.; Yeung, B. Agency problems in large family business groups. Entrep. Theory Pract. 2003, 27, 367–382. [Google Scholar] [CrossRef]
  47. Claessens, S.; Djankov, S.; Lang, L.H. The separation of ownership and control in East Asian corporations. J. Financ. Econ. 2000, 58, 81–112. [Google Scholar] [CrossRef]
  48. Zhong, H. Government intervention, insider control and corporate investment. Manag. World 2010, 7, 98–108. [Google Scholar]
  49. La Porta, R.; Lopez-de-Silanes, F.; Shleifer, A. Corporate ownership around the world. J. Financ. 1999, 54, 471–517. [Google Scholar] [CrossRef]
  50. Cheung, Y.; Rau, P.R.; Stouraitis, A. Tunneling, propping, and expropriation: Evidence from connected party transactions in Honk Kong. J. Financ. Econ. 2006, 82, 343–386. [Google Scholar] [CrossRef] [Green Version]
  51. Allman, E.; Won, J. The Effect of ESG Disclosure on Corporate Investment Efficiency. Available online: https://ssrn.com/abstract=3816592 (accessed on 28 November 2021).
  52. Roychowdhury, S.; Shroff, N.; Verdi, R.S. The effects of financial reporting and disclosure on corporate investment: A review. J. Account. Econ. 2019, 68, 101246. [Google Scholar] [CrossRef]
  53. Myers, S.C.; Majluf, N.S. Corporate financing and investment decisions when firms have information that investors do not have. J. Financ. Econ. 1984, 13, 187–221. [Google Scholar] [CrossRef] [Green Version]
  54. Matsusaka, J.G.; Nanda, V. Internal capital markets and corporate refocusing. J. Financ. Intermed. 2002, 11, 176–211. [Google Scholar] [CrossRef]
  55. Biddle, G.C.; Hilary, G.; Verdi, R.S. How does financial reporting quality relate to investment efficiency? J. Account. Econ. 2009, 48, 112–131. [Google Scholar] [CrossRef]
  56. Branco, M.; Rodrigues, L. Corporate social responsibility and resource-based perspectives. J. Bus. Ethics 2006, 69, 111–132. [Google Scholar] [CrossRef]
  57. Fan, J.P.H.; Wong, T.J.; Zhang, T. Organizational Structure as a Decentralization Device: Evidence from Corporate Pyramids. 2007. Available online: https://papers.ssrn.com/sol3/papers.cfm?abstract_id=963430. (accessed on 14 April 2022).
  58. Cuadrado-Ballesteros, B.; Garcia-Sanchez, I.M.; Martinez Ferrero, J. How are corporate disclosures related to the cost of capital? The fundamental role of information asymmetry. Manag. Decis. 2016, 54, 1669–1701. [Google Scholar] [CrossRef]
  59. Shakil, M.H. Environmental, social and governance performance and stock price volatility: A moderating role of firm size. J. Public. Aff. 2020, e2574. [Google Scholar] [CrossRef]
  60. Richardson, S. Over-investment of free cash flow. Rev. Acc. Stud. 2006, 11, 159–189. [Google Scholar] [CrossRef]
  61. Khanna, T.; Yafeh, Y. Business groups in emerging markets: Paragons or parasites? J. Econ. Lit. 2007, 45, 331–372. [Google Scholar] [CrossRef] [Green Version]
  62. Leff, N.H. Industrial organization and entrepreneurship in the developing countries: The economic groups. Econ. Dev. Cult. Change 1978, 26, 661–675. [Google Scholar] [CrossRef]
  63. Kim, J.B.; Li, Y.; Zhang, L. CFOs versus CEOs: Equity incentives and crashes. J. Finan. Econ. 2011, 101, 713–730. [Google Scholar] [CrossRef]
  64. Rajan, R.G.; Zingales, L. Financial dependence and growth. Am. Econ. Rev. 1998, 88, 559–586. [Google Scholar]
Figure 1. Mechanism diagram for business groups and ESG disclosure.
Sustainability 14 04817 g001
Figure 2. Mechanism diagram for pyramid hierarchy and ESG disclosure.
Sustainability 14 04817 g002
Figure 3. Mechanism diagram for business group, ESG disclosure and investment efficiency.
Sustainability 14 04817 g003
Figure 4. Mechanism diagram for pyramid hierarchy, ESG disclosure and investment efficiency.
Sustainability 14 04817 g004
Figure 5. Research Framework.
Sustainability 14 04817 g005
Figure 6. Ownership structure of Huatian Industrial Holdings Group.
Sustainability 14 04817 g006
Figure 7. Pyramid hierarchy of Huatian Industrial Holdings Group.
Sustainability 14 04817 g007
Table 1. Descriptive statistics.
VariableNMeanStd. Dev.MinMax
Absinv47740.03530.04790.00040.3127
Underinv27550.02450.02390.00040.2271
Overinv20190.05000.06540.00040.3127
ESG554020.67666.09867.440061.7200
E_dis455210.44776..83510.780060.4200
S_dis552123.38898.89683.510073.6842
G_dis554045.66705.525214.290081.2621
Group55400.39910.489801
Layer55402.82870.3778111
ROA55400.48270.5370−0.12400.2192
Size554010.03180.51938.922311.4777
Tang55400.22720.17900.00190.7396
OCF55400.05830.0693−0.12880.2555
Lev55400.48230.19890.07500.8783
Top155400.38230.16200.08480.7802
Indep55400.37430.05370.33330.5714
TobinQ55401.97121.24750.85467.6868
Age554012.72466.3256025
Soe55400.61190.487401
Table 2. Business group and ESG-related disclosure.
VariablesESG (1)E_dis (2)S_dis (3)G_dis (4)
Group0.6321 ***
(3.77)
0.4339 **
(2.06)
0.9005 ***
(3.52)
−0.3088 *
(−1.94)
Constant−23.9501 ***
(−11.45)
−33.6442 ***
(−12.64)
−27.0331 ***
(−8.46)
20.9494 ***
(10.57)
ControlsYesYesYesYes
YearYesYesYesYes
IndustryYesYesYesYes
N5540455255215540
R20.24360.19330.17300.1715
Note: *, ** and *** are the significant levels at 10%, 5% and 1%, respectively; t statistics are in parentheses.
Table 3. The layer of pyramid and ESG information disclosure.
VariablesESG (1)E_dis (2)S_dis (3)G_dis (4)
Group0.3469 *
(1.75)
0.5206 **
(2.12)
0.5837 *
(1.93)
−0.5351 ***
(−2.85)
Layer0.1634
(0.83)
1.6534 ***
(6.18)
0.0387
(0.13)
0.3421 *
(1.83)
Group*Layer0.8275 ***
(2.64)
−0.4775
(−1.19)
0.9245 *
(1.93)
0.6483 **
(2.18)
Constant−23.6442 ***
(−11.28)
−33.6671 ***
(−12.70)
−26.6488 ***
(−8.32)
21.1247 ***
(10.64)
ControlsYesYesYesYes
YearYesYesYesYes
IndustryYesYesYesYes
N5540455255215540
R20.24600.20290.17410.1748
Note: *, ** and *** are the significant levels at 10%, 5% and 1%, respectively; t statistics are in parentheses.
Table 4. Business group and investment efficiency.
VariablesAbsinv (1)Underinv (2)Overinv (3)
Group0.0111 ***
(7.03)
0.0014
(1.26)
0.0060 *
(1.79)
Constant0.0057
(0.29)
−0.0085
(−0.66)
0.1101 **
(2.54)
ControlsYesYesYes
YearYesYesYes
IndustryYesYesYes
N477427552019
R20.08390.09460.1502
Note: *, ** and *** are the significant levels at 10%, 5% and 1%, respectively; t statistics are in parentheses.
Table 5. Pyramid levels and investment efficiency.
VariablesAbsinv (1)Underinv (2)Overinv (3)
Group0.0086 ***
(4.71)
−0.0004
(−0.34)
0.0058
(1.32)
Layer0.0006
(0.29)
−0.0041 ***
(−2.91)
−0.0013
(−0.30)
Group*Layer0.0071 **
(2.41)
0.0105 ***
(4.24)
0.0005
(0.08)
Constant0.0097
(0.49)
−0.0047
(−0.37)
0.1101**
(2.53)
ControlsYesYesYes
YearYesYesYes
IndustryYesYesYes
N477427552019
R20.08640.10080.1502
Note: ** and *** are the significant levels at 5% and 1%, respectively; t statistics are in parentheses.
Table 6. Business group and ESG information disclosure on investment efficiency.
VariablesAbsinv (1)Underinv (2)Overinv (3)
ESG0.0327 ***
(1.02)
−0.0001
(−0.59)
0.0001
(0.39)
Group0.0327 ***
(6.30)
0.0072 *
(1.90)
0.0251 **
(2.42)
Group*ESG−0.0010 ***
(−4.35)
−0.0003
(−1.55)
−0.0009 *
(−1.93)
Constant−0.0158
(−0.78)
−0.0150
(−1.14)
0.0828 *
(1.84)
ControlsYesYesYes
YearYesYesYes
IndustryYesYesYes
N477427552019
R20.08850.09640.1526
Note: *, ** and *** are the significant levels at 10%, 5% and 1%, respectively; t statistics are in parentheses.
Table 7. The levels of pyramid and ESG disclosure on investment efficiency.
VariablesAbsinv (1)Underinv (2)Overinv (3)
ESG−0.0001
(−0.35)
−0.0003 ***
(−2.69)
0.0005
(1.02)
Group0.0251 ***
(3.92)
−0.0001
(−0.03)
0.0283 *
(1.89)
Layer−0.0119 *
(−1.82)
−0.0221 ***
(−5.03)
0.0132
(0.90)
ESG*Group−0.0008 ***
(−2.64)
0.0000
(0.04)
−0.0011
(−1.58)
ESG*Layer0.0006 **
(2.02)
0.0009 ***
(4.34)
−0.0007
(−1.03)
Group*Layer0.0239 **
(2.30)
0.0350 ***
(3.79)
−0.0059
(−0.29)
ESG*Group*Layer−0.0008 *
(−1.69)
−0.0012 ***
(−2.98)
0.0004
(0.41)
Constant−0.0090
(−0.44)
−0.0092
(−0.71)
0.0769 *
(1.69)
YearYesYesYes
IndustryYesYesYes
N477427552019
R20.09230.10950.1532
Note: *, ** and *** are the significant levels at 10%, 5% and 1%, respectively; t statistics are in parentheses.
Table 8. Analyst Monitoring.
VariablesAbsinvUnderinvOverinv
Analyst = 0Analyst = 1Analyst = 0Analyst = 1Analyst = 0Analyst = 1
ESG0.0002
(0.56)
0.0000
(0.25)
−0.0003 **
(−2.00)
0.0001
(0.86)
0.0006
(0.91)
−0.0003
(−0.70)
Group0.0434 ***
(5.82)
0.0012
(0.15)
0.0037
(0.67)
0.0082
(1.50)
0.0405 ***
(2.72)
−0.0168
(−0.86)
ESG*Group−0.0013 ***
(−3.85)
−0.0000
(−0.14)
−0.0001
(−0.41)
−0.0003
(−1.40)
−0.0016 **
(−2.34)
0.0009
(1.10)
Constant−0.0340
(−1.07)
0.0105
(0.39)
0.0006
(0.03)
−0.0106
(−0.59)
0.0581
(0.99)
0.1020
(1.29)
YearYesYesYesYesYesYes
IndustryYesYesYesYesYesYes
N26832091133214231351668
R20.12100.08550.14340.12010.16640.2002
Note: ** and *** are the significant levels at 5% and 1%, respectively; t statistics are in parentheses.
Table 9. External Financing Dependence.
VariablesAbsinvUnderinvOverinv
EFD = 0EFD = 1EFD = 0EFD = 1EFD = 0EFD = 1
ESG−0.0002
(−0.52)
0.0000
(0.02)
−0.0002
(−1.20)
−0.0004 **
(−2.24)
0.0002
(0.32)
0.0008
(1.04)
Group0.0365 ***
(3.71)
0.0150 *
(1.79)
0.0083
(1.39)
−0.0058
(−0.98)
0.0333
(1.63)
0.0259
(1.15)
Layer−0.0123
(−1.26)
−0.0131
(−1.51)
−0.0153 ***
(−2.62)
−0.0308 ***
(−4.44)
0.0041
(0.19)
0.0183
(0.85)
ESG*Group−0.0011 **
(−2.48)
−0.0005
(−1.29)
−0.0004
(−1.34)
0.0002
(0.93)
−0.0012
(−1.23)
−0.0011
(−1.08)
ESG*Layer0.0006
(1.27)
0.0007 *
(1.70)
0.0006*
(1.94)
0.0014 ***
(4.23)
−0.0003
(−0.33)
−0.0009
(−0.89)
Group*Layer0.0147
(0.96)
0.0342 **
(2.45)
0.0230
(1.45)
0.0462 ***
(3.70)
−0.0079
(−0.28)
0.0032
(0.10)
ESG*Group*Layer−0.0004
(−0.62)
−0.0012 *
(−1.91)
−0.0006
(−0.89)
−0.0018 ***
(−3.29)
0.0004
(0.30)
0.0000
(0.01)
Constant−0.0314
(−0.96)
0.0138
(0.53)
−0.0334*
(−1.67)
0.0090
(0.50)
0.0928
(1.45)
0.0982
(1.41)
YearYesYesYesYesYesYes
IndustryYesYesYesYesYesYes
N24882286129414611194825
R20.11860.09320.13690.12630.17810.1781
Note: *, ** and *** are the significant levels at 10%, 5% and 1%, respectively; t statistics are in parentheses.
Publisher’s Note: MDPI stays neutral with regard to jurisdictional claims in published maps and institutional affiliations.

