1. Introduction
With the development of e-commerce and inter-regional trade, the supply chain is becoming increasingly essential for the economy and society [
1,
2,
3]. However, the boom in supply chains is accompanied by the production of large amounts of carbon emissions. According to data from the International Energy Agency (IEA), the transportation sector is the second largest industrial sector in terms of carbon emissions. For instance, in 2019, the transportation sector emitted about 8222 Mts (metric tons) of CO
2, accounting for a quarter of the total carbon emissions. Reducing carbon emissions from transportation is a worldwide challenge in achieving the climate change mitigation goals [
4,
5]. Under this situation, some scholars conceptualize a sustainable supply chain (SSC) that uses more cleaner energy and causes less pollution [
6,
7,
8,
9,
10]. However, as a novel concept, the research on SSC need to be enriched from a theoretical and empirical perspective.
Green technological innovation is an important way to reduce carbon emissions and achieve sustainable development [
11,
12,
13,
14]. China, as the country with the world’s largest supply chain system and the most carbon emissions, encourages green technology innovation by transportation companies to improve the sustainability of supply chains [
4,
15]. However, existing studies lack quantitative analysis of the effects of green technological innovation on SSC in China.
Based on existing research, this paper attempts to explore the promoting effect of green technological innovation on SSC in the following two aspects: (1) Does the green technological innovation play a positive role in promoting the SSC development? And how to measure the effect? (2) What are the mechanisms by which the green technological innovation affects the SSC? To deal with these problems, we set a theoretical framework to summarize the direct and indirect mechanisms of the impact of green technology innovation on SSC. Then, we conducted an empirical study using inter-region trade data and carbon emission data from China, which can quantify the promoting effects more accurately. Our study enriches the understanding of green technological innovation and SSC, which also contributes to research on sustainable development.
The present study is organized as follows.
Section 2 is a literature review.
Section 3 is theoretical framework, where we describe two types of mechanisms in which green technology innovation promotes SSC development: direct mechanisms and indirect mechanisms.
Section 4 displays the data and empirical method we used to analyse the protective impact of green technology innovations on the SSC.
Section 5 reports the baseline results on direct mechanism.
Section 6 summarizes the main conclusions and limitations of this paper.
2. Literature Review
This paper is based on two main areas of research: The first area is the research on sustainable supply chains (SSC). The second is the effect of green technology innovation in the transport sector.
2.1. Research on Sustainable Supply Chains
In the recent years, with the increase in environmental awareness, more and more researchers, companies, and policy makers are beginning to focus on sustainable development of supply chains [
14,
15,
16]. The concept of SSC has been proposed and widely followed by supply chain management researchers. Since then, scholars have discussed the sustainable supply chain (SSC) issues from the perspectives of contract designing, decision making, pricing strategies and so on, finding that technological innovation is an important factor in the development of SSCs [
9,
17,
18,
19,
20,
21].
In the existing research, the reducing effect of technological innovation on carbon emission in the supply chain has been a concern of scholars. In the theoretical aspects, researchers have simulated the relationship between supply chain revenue and carbon emissions through a mathematical modelling approach, and suggested that technological innovation can achieve both increased supply chain revenue and reduced carbon emissions [
22,
23]. In terms of case studies, there have been some cases from several countries (e.g., Japan, China, Uganda, sub-Saharan Africa etc.) showing that technological innovation has reduced supply chains’ environmental pollution [
12,
24,
25,
26].
However, existing studies lack quantitative analysis of the effects of green technological innovation on SSC, and have paid little attention to the mechanisms. To fill this gap, we construct a theoretical framework for analysing the mechanisms of green technology innovation affecting the SSC and test these mechanisms in following sections.
2.2. Research on the Effect of Green Technology Innovation in the Transport Sector
Rhodes and Wield (1994) were the first to propose the concept of green technology, which they considered as “non-publicly harmful” or “less publicly harmful” technologies that follow eco-economic principles [
27]. More broadly, any technology, process or product innovation that reduces environmental pollution, energy or raw material consumption can be categorized as a green technology innovation [
28,
29]. The World Intellectual Property Organization (WIPO) provides a standard of green technology innovation (
https://www.wipo.int/classifications/ipc/green-inventory/home, accessed on 20 February 2022), which include innovations in seven types: alternative energy production, transportation, energy conservation, waste management, agriculture and forestry, administrative regulation and design, and nuclear energy. The WIPO’s standard is widely used in related studies [
30,
31,
32,
33]. To enhance comparability with existing studies, the definition of green technology innovation in this paper is consistent with WIPO’s standard.
Sustainable development requires a simultaneous focus on environmental protection and economic performance. Therefore, the discussion on the effects of green technology innovation revolves around these two aspects as well. On one hand, green technology innovation can protect the environment by improving the efficiency of resource use, increasing the proportion of regional renewable energy use, reducing pollution [
18,
34,
35]. Specifically, researchers found that green technology innovation in transportation companies can reduce fossil fuel use and greenhouse gas emissions [
36,
37].
On the other hand, scholars have also conducted a series of discussions on the economic performance of green technology innovation. Wang et al. (2021) pointed out that enterprises engaged in green technology innovation activities can help them establish a unique green competitive advantage and increase their sales revenue [
38]. Xu et al. (2016) studied the relationship between green technology innovation and stock prices and found that listed companies with more green technology innovations can obtain higher valuations [
39]. Lin et al. (2013) and Lee and Min (2015) argued that an enterprise’s ability to improve green technology innovation can improve its corporate image and brand influence, which can lead to an advantage in product competition and ultimately improve its economic performance [
40,
41]. However, most of the existing literature on economic performance has focused on the manufacturing sector, and there is a lack of studies on transportation or supply chain firms. Therefore, to fill these research gaps, this paper attempts to quantitatively analyse the impact of green technology innovation on SSC development by using transport company data from China.
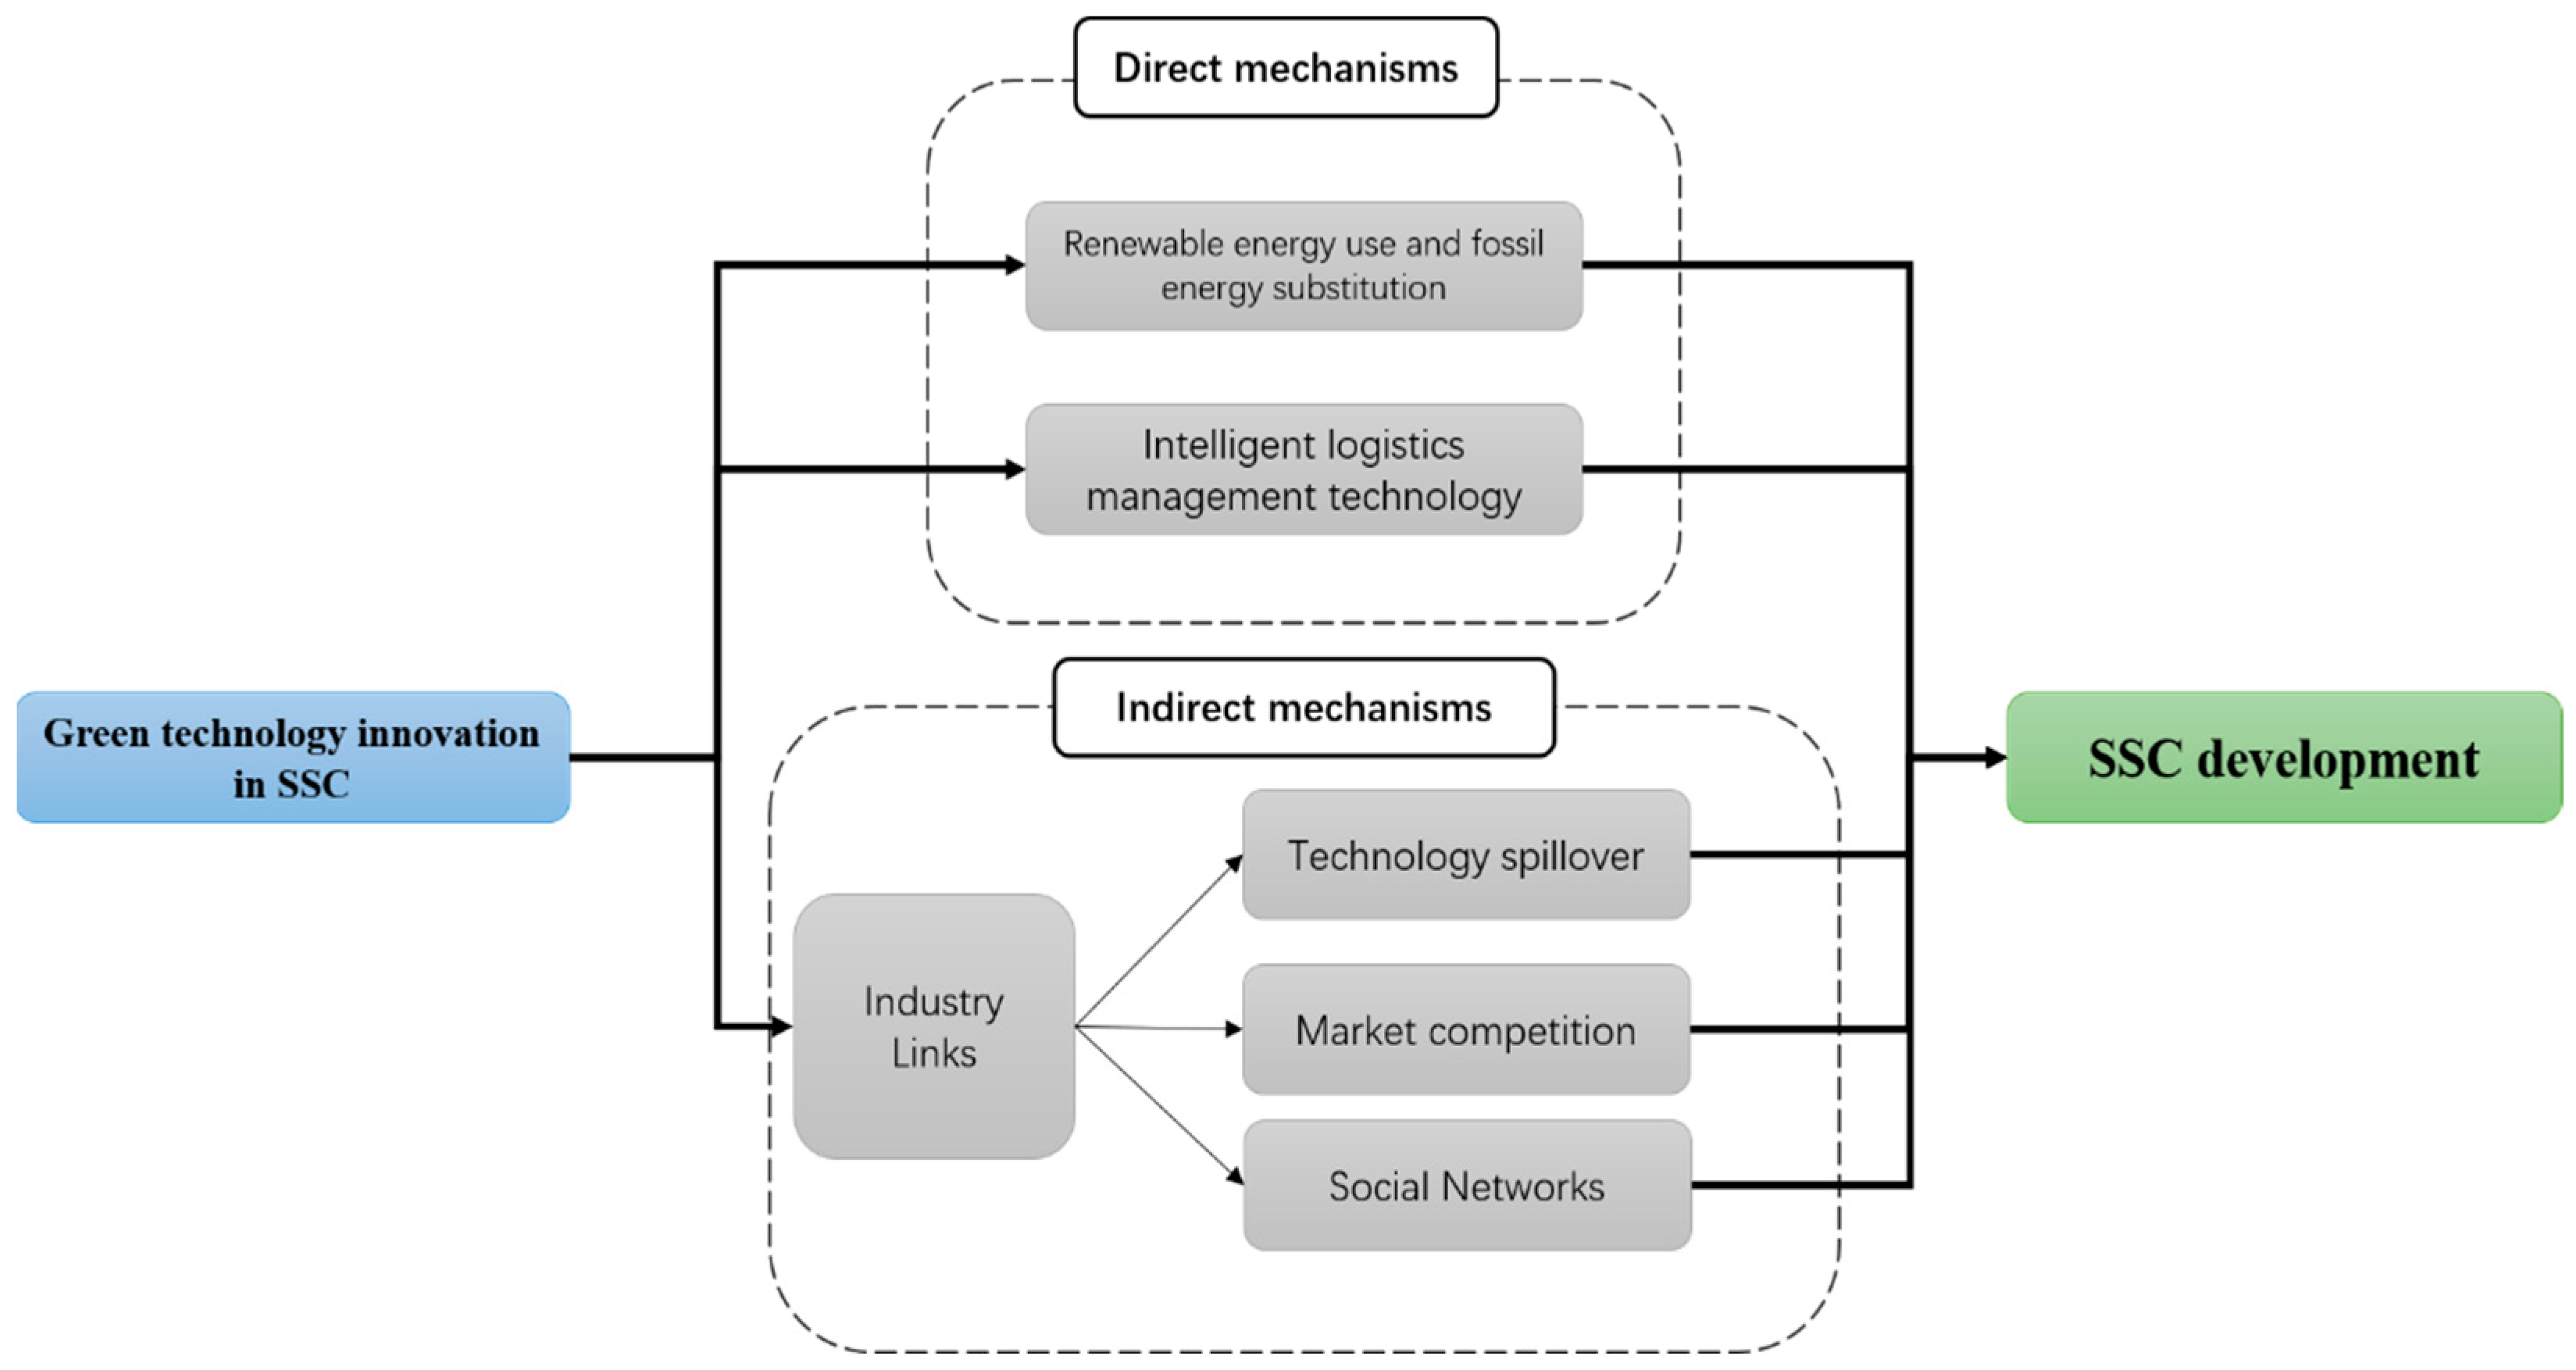
3. Theoretical Framework
This part focus on what are the mechanisms by which the green technological innovation affects the SSC? The mechanisms can be divided into two categories depending on whether the green technology innovation acts directly on the transport process: direct mechanisms and indirect mechanisms. We displayed these mechanisms in
Figure 1.
3.1. Direct Mechanisms
The direct mechanism means that green technology innovations can be applied directly to reduce carbon emissions in the transport or retail processes. There are two main types of green technology innovations to reduce supply chain carbon emissions: reducing fossil fuel use and improving supply chain efficiency. On the one hand, as a kind of “future energy” that does not produce CO
2 emissions [
42,
43], renewable energy technologies are widely use in the supply chain. Supply chain companies are incentivized by both market and policy to conduct technology innovations in renewable energy. On the market side, the instable prices of traditional energy sources (oil, coal, natural gas) are influenced by geography, international politics, and other factors. This makes transport companies consider the use of more renewable energy alternatives, which will reduce both transport costs and carbon emission [
44]. Green technological innovations of transportation, such as electric vehicles, hydrogen combustion, and fuel cells (FC), make it possible to use more renewable energy in the SC. On the policy side, as governments become more aware of sustainable development, increasing numbers of countries are implementing policies to limit carbon emissions (e.g., carbon trading or carbon taxes) [
45,
46,
47]. When the cost of carbon emissions is higher than the cost of renewable energy technologies, supply chain companies begin to introduce more green technology innovations to reduce production costs.
On the other hand, advanced technologies, such as artificial intelligence (AI), big data (BD), blockchain (BC) etc. in the logistics industry have improved supply chain efficiency and facilitated the development of SSC. It has been shown that these advanced technologies can significantly improve the efficiency of SC through accurate forecasting, availability of real-time information, increased transparency, traceability, and predictability [
48,
49,
50]. Increased supply chain efficiency means that less fuel, resources, and labour can be used in the transportation or retail process, which will reduce SC’s carbon emissions. As an example, A survey of 168 hospitals in France shows that AI and BD technology can more accurately predict the demand for emergency and medical goods, reducing greenhouse gases during the transportation of these goods [
51]. In China, there are also many similar logistics management technologies, such as unmanned delivery cabinets (Shunfeng Co., Ltd., China), real-time truck fuel consumption monitoring (G7 Co., Ltd., China), driverless trucks (Yingche Co., Ltd., China), which can promote the SSC development. Therefore, our research firstly needed to test whether the green technology innovation of transportation enterprises can directly reduce the carbon emissions on the SC.
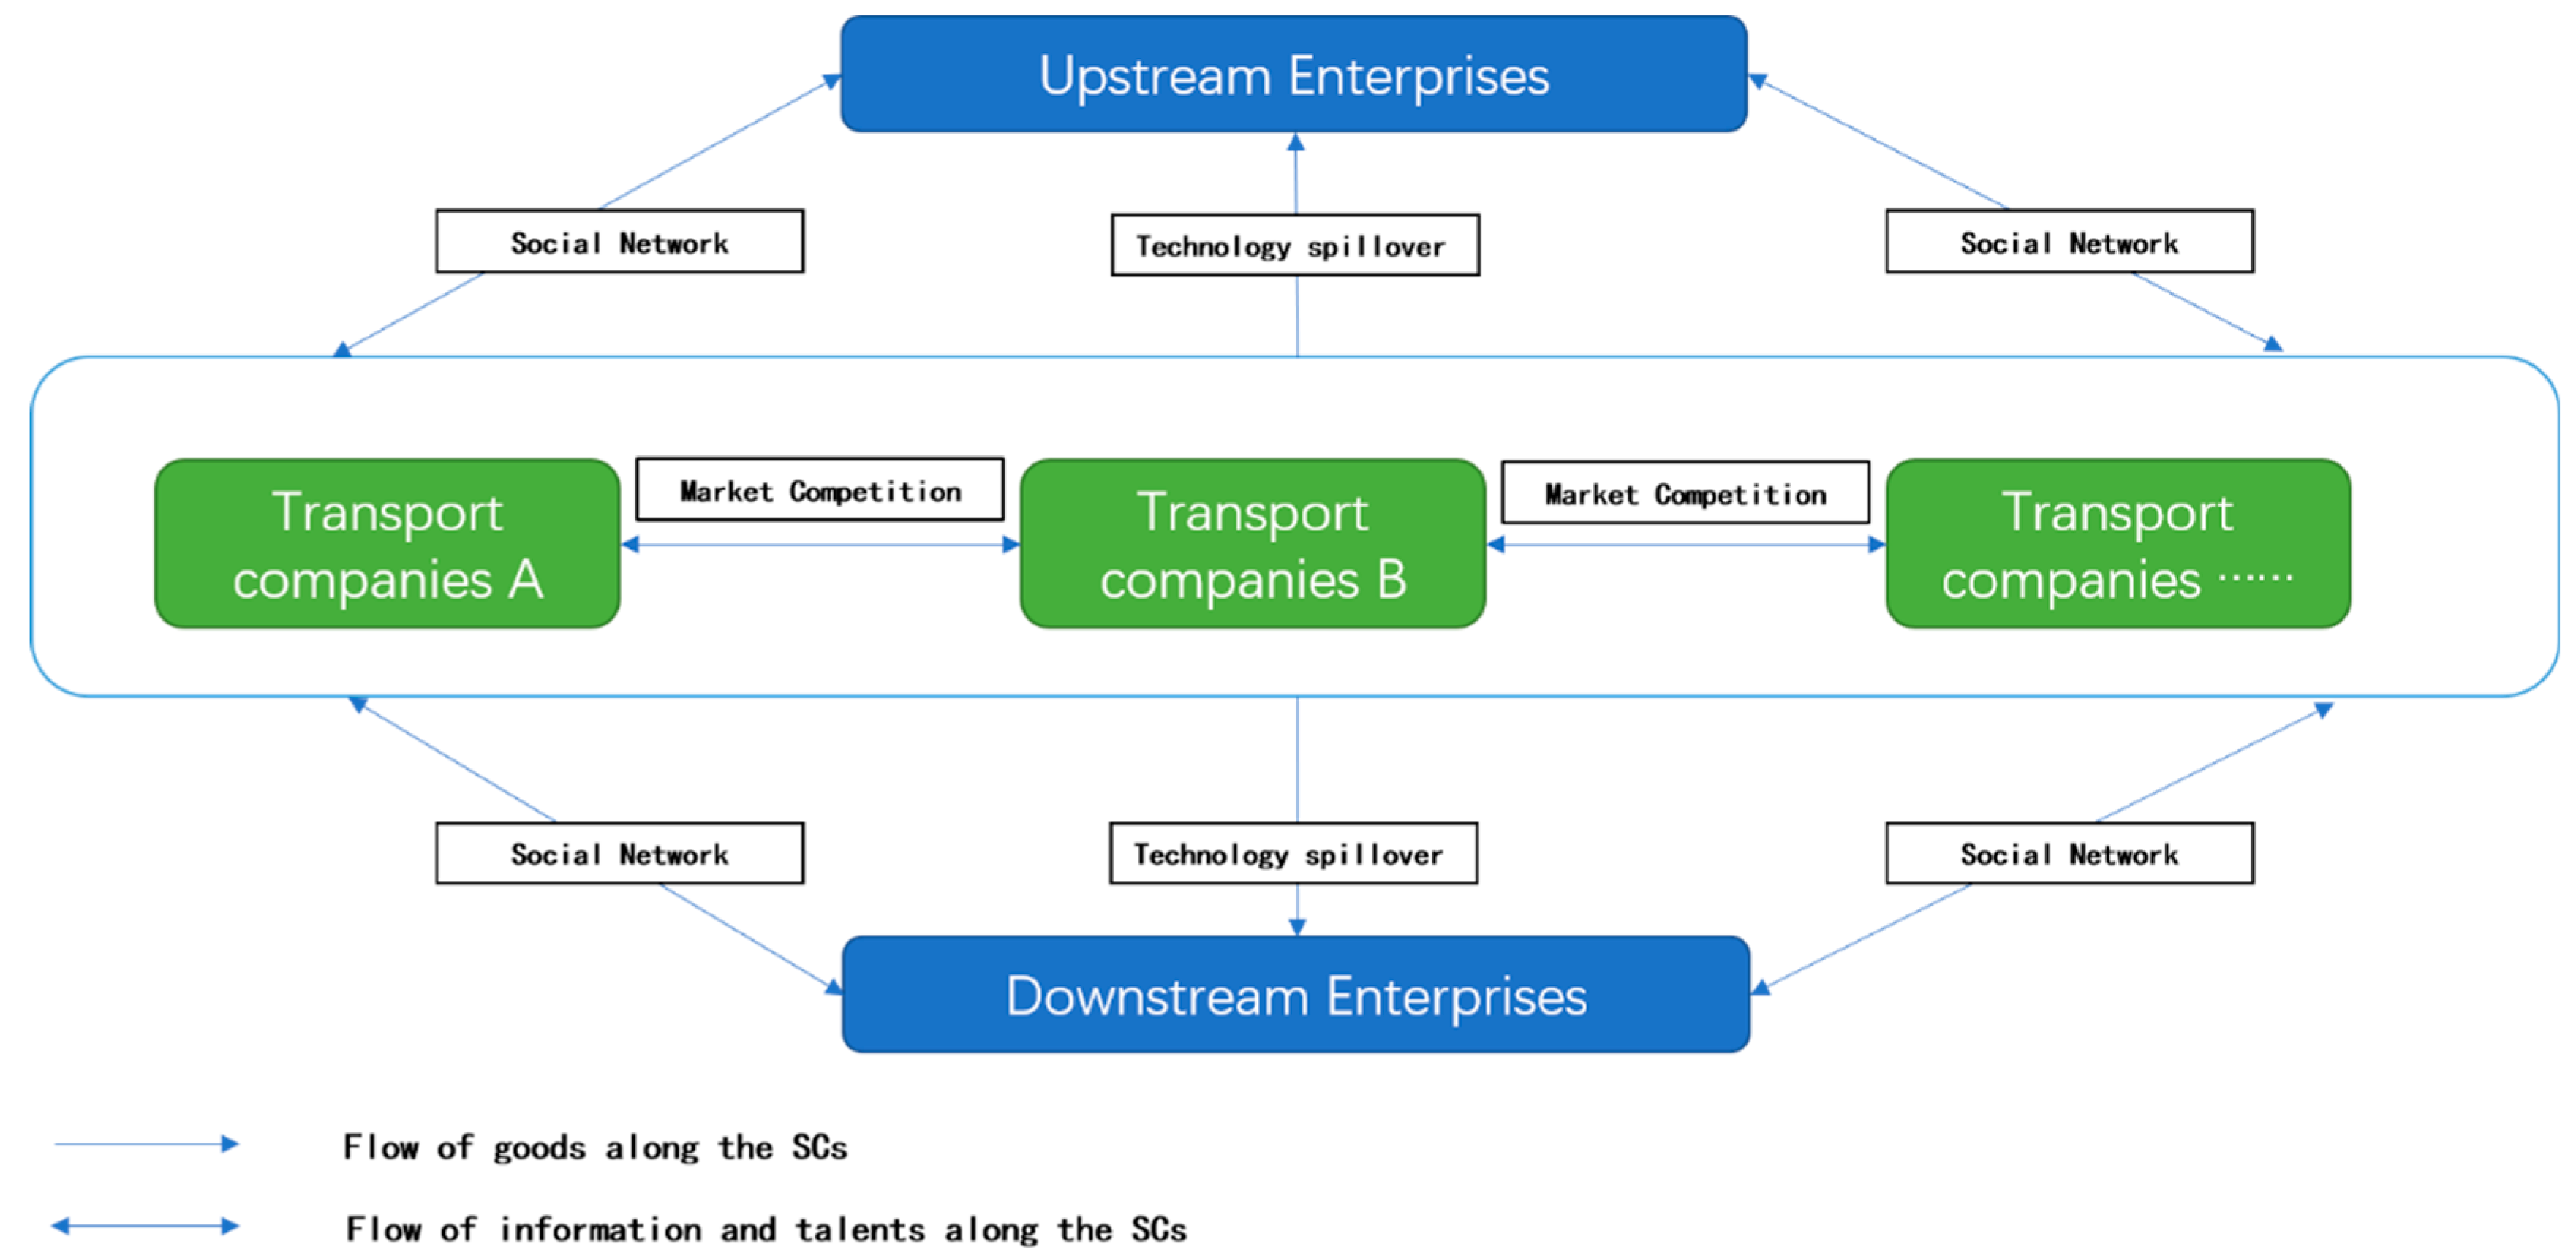
3.2. Indirect Mechanisms
A key feature of supply chains is the linkages between industry sectors. The green technology innovation of transportation enterprises will also have an impact on the upstream and downstream enterprises of the supply chain, which is the indirect mechanism of green technology innovation of transportation enterprises to promote the development of the SSC. There are three types of indirect mechanisms to promote the SSC (see
Figure 2).
First, technology spill over. Green technology innovation in transportation companies can lead to technology spill over effects along the SC vertically [
52,
53]. For upstream companies, the use of green energy will reduce the demand for fossil energy by transportation companies. In turn, this will change the behaviour of fuel producers and promote energy companies to seek green technologies. For downstream companies, green technology innovation in transportation companies can also affect the supply structure of logistics and retail services. For example, efficient logistics systems may allow more businesses to engage in online sales rather than offline, which would reduce carbon emissions from offline retail [
54,
55].
Second, market competition. According to existing studies, market structure and competitive decisions are important factors that affect firm performance [
56,
57]. Green technology innovation is an important area of market competition among transportation companies [
58,
59]. Due to environmental policies and awareness, customer companies consider environmental protection as an important factor when they select logistics providers. For example, Adidas, one of the largest sports brands worldwide, conduct a project that evaluates suppliers using some environmental index. If logistics providers cannot meet the environment standards, they will no longer be available as a provider of Adidas (
https://www.adidas-group.com/en/sustainability/compliance/supply-chain-approach/, accessed on 22 February 2022). Therefore, under the pressure of market competition, transportation companies need green technology innovations to meet environmental requirements with less costs. Furthermore, market competition may promote information and talent flow within the transport sector, which will eventually lead to the development of SSC.
Third, social network. Attitudes toward the environment between companies will be transmitted through social networks [
60,
61]. Increasing environmental awareness together with the higher frequency communication in the Internet Era, results in more enterprises reconsidering their supply chains with respect to economic, social and environmental objectives [
62]. As a bridge between production and consumption, transportation companies are important nodes in the social network between companies. Green technology innovation of transportation companies will also signal to other companies that they will pay more attention to sustainability and environmental issues.
4. Method and Materials
4.1. Measures of Variables
Before introducing the empirical model, we need to describe the method for measurement of the development level of SSC, the green technology innovation of transportation companies, and other variables used.
4.1.1. Development Level of the SSC
Studies have been conducted to measure the level of development of the green supply chain in terms of carbon emissions from the transportation sector [
17,
26]. However, SSC needs to meet both environmental and economic needs [
5,
9], and the efficiency of SC could be considered. Therefore, we calculate CO
2 emissions per unit of trade as an index reflecting the level of SSC development (SSCD) as Equation (1).
In Equation (1),
i,
j represent province
i and province
j respectively, and
t represents the year. Referring Chen et al.’s (2020) method [
26], we calculate the transportation sector’s CO
2 emissions (unit: ton) of 30 provinces in mainland China (excluding Tibet) from 2002 to 2017. These data are from the China Energy Statistical Yearbook. Transport volume is an important indicator of supply chain activities. Variable
(unit: kg) represents the amount of transport freight between province
i and province
j in year
t. So far, there has been no authoritative data reflecting the volume of domestic agricultural trade in China [
3]. The China Railway Yearbook records the volume of rail freight transported between provinces in China. According to a report by the Ministry of Transport, rail transport accounts for about 9.5% of total freight transport in China (
http://www.gov.cn/xinwen/2020-05/12/content_5510817.htm, accessed on 28 February 2022). Therefore, we estimate the inter-provincial transport volume based on the amplification of the rail freight volume.
Finally, we can calculate the carbon emissions per ton of inter-provincial freight to reflect the level of SSC development.
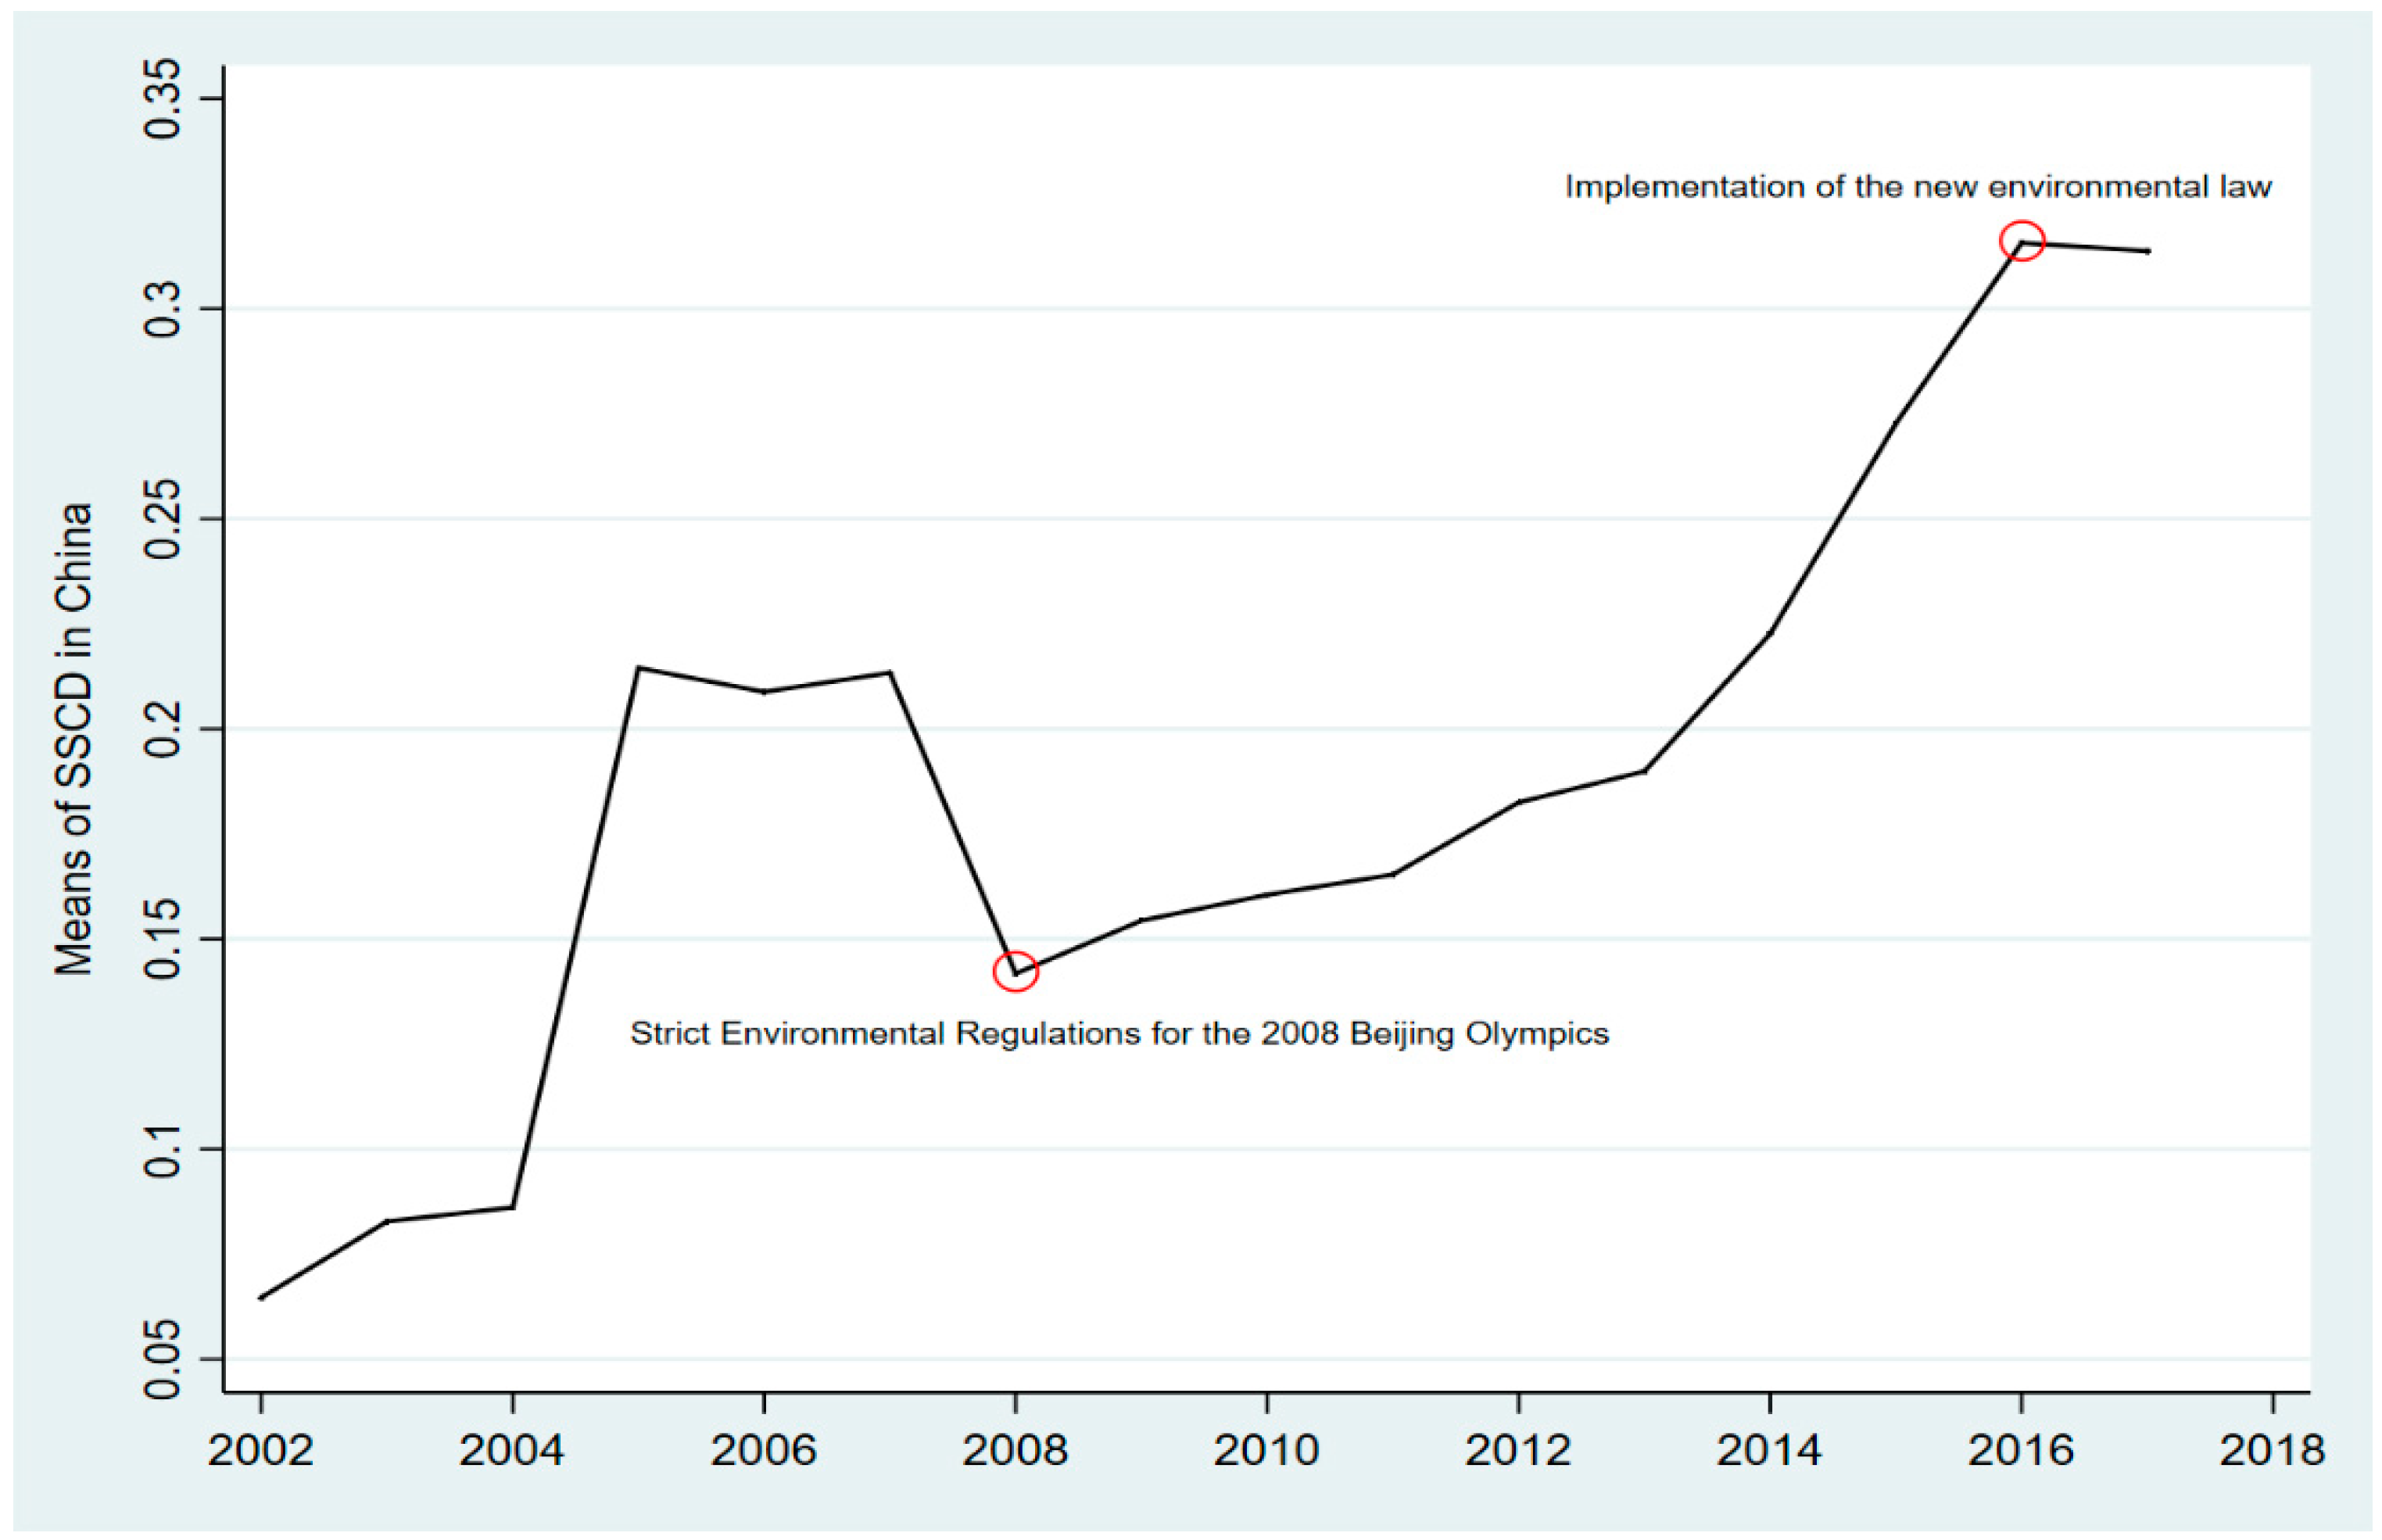
Figure 3 shows the mean of SSCD from 2002 to 2017 so that we can illustrate the SSC development in China. In 2008, China’s government began implementing strict environmental regulations for the Beijing Olympics, such as restrictions on urban vehicular traffic, mandatory reductions in the production and transportation of manufacturing products, and the shutdown of traditional fuel companies etc., which led to a decrease of the mean of SSCD. However, SSCD spiked from 2008 to 2014 due to the low level of green technology and rising demand in the transportation sector. In 2015, new environmental laws (the Environmental Law Amendment 2014) that encourage transport companies to use green technologies innovations and limit traffic emissions were implemented in China. Since then, the unit carbon emissions of freight have begun to decline, which reflected the development of SSC in China.
4.1.2. Green Technology Innovation
We use the number of green patents of listed transportation companies as a proxy variable for green technology innovation. The green technology innovations are defined in
Section 2.2. We collected data on the green patents of Chinese A-share listed transportation companies from 2002 to 2017. The information of listed companies comes from their annual reports and the data of green patents comes from the Incopat patent database (
https://www.incopat.com/, accessed on 3 March 2022). We matched them by corporate taxpayer ID, and summed up the number of green patents according to the place of business registration.
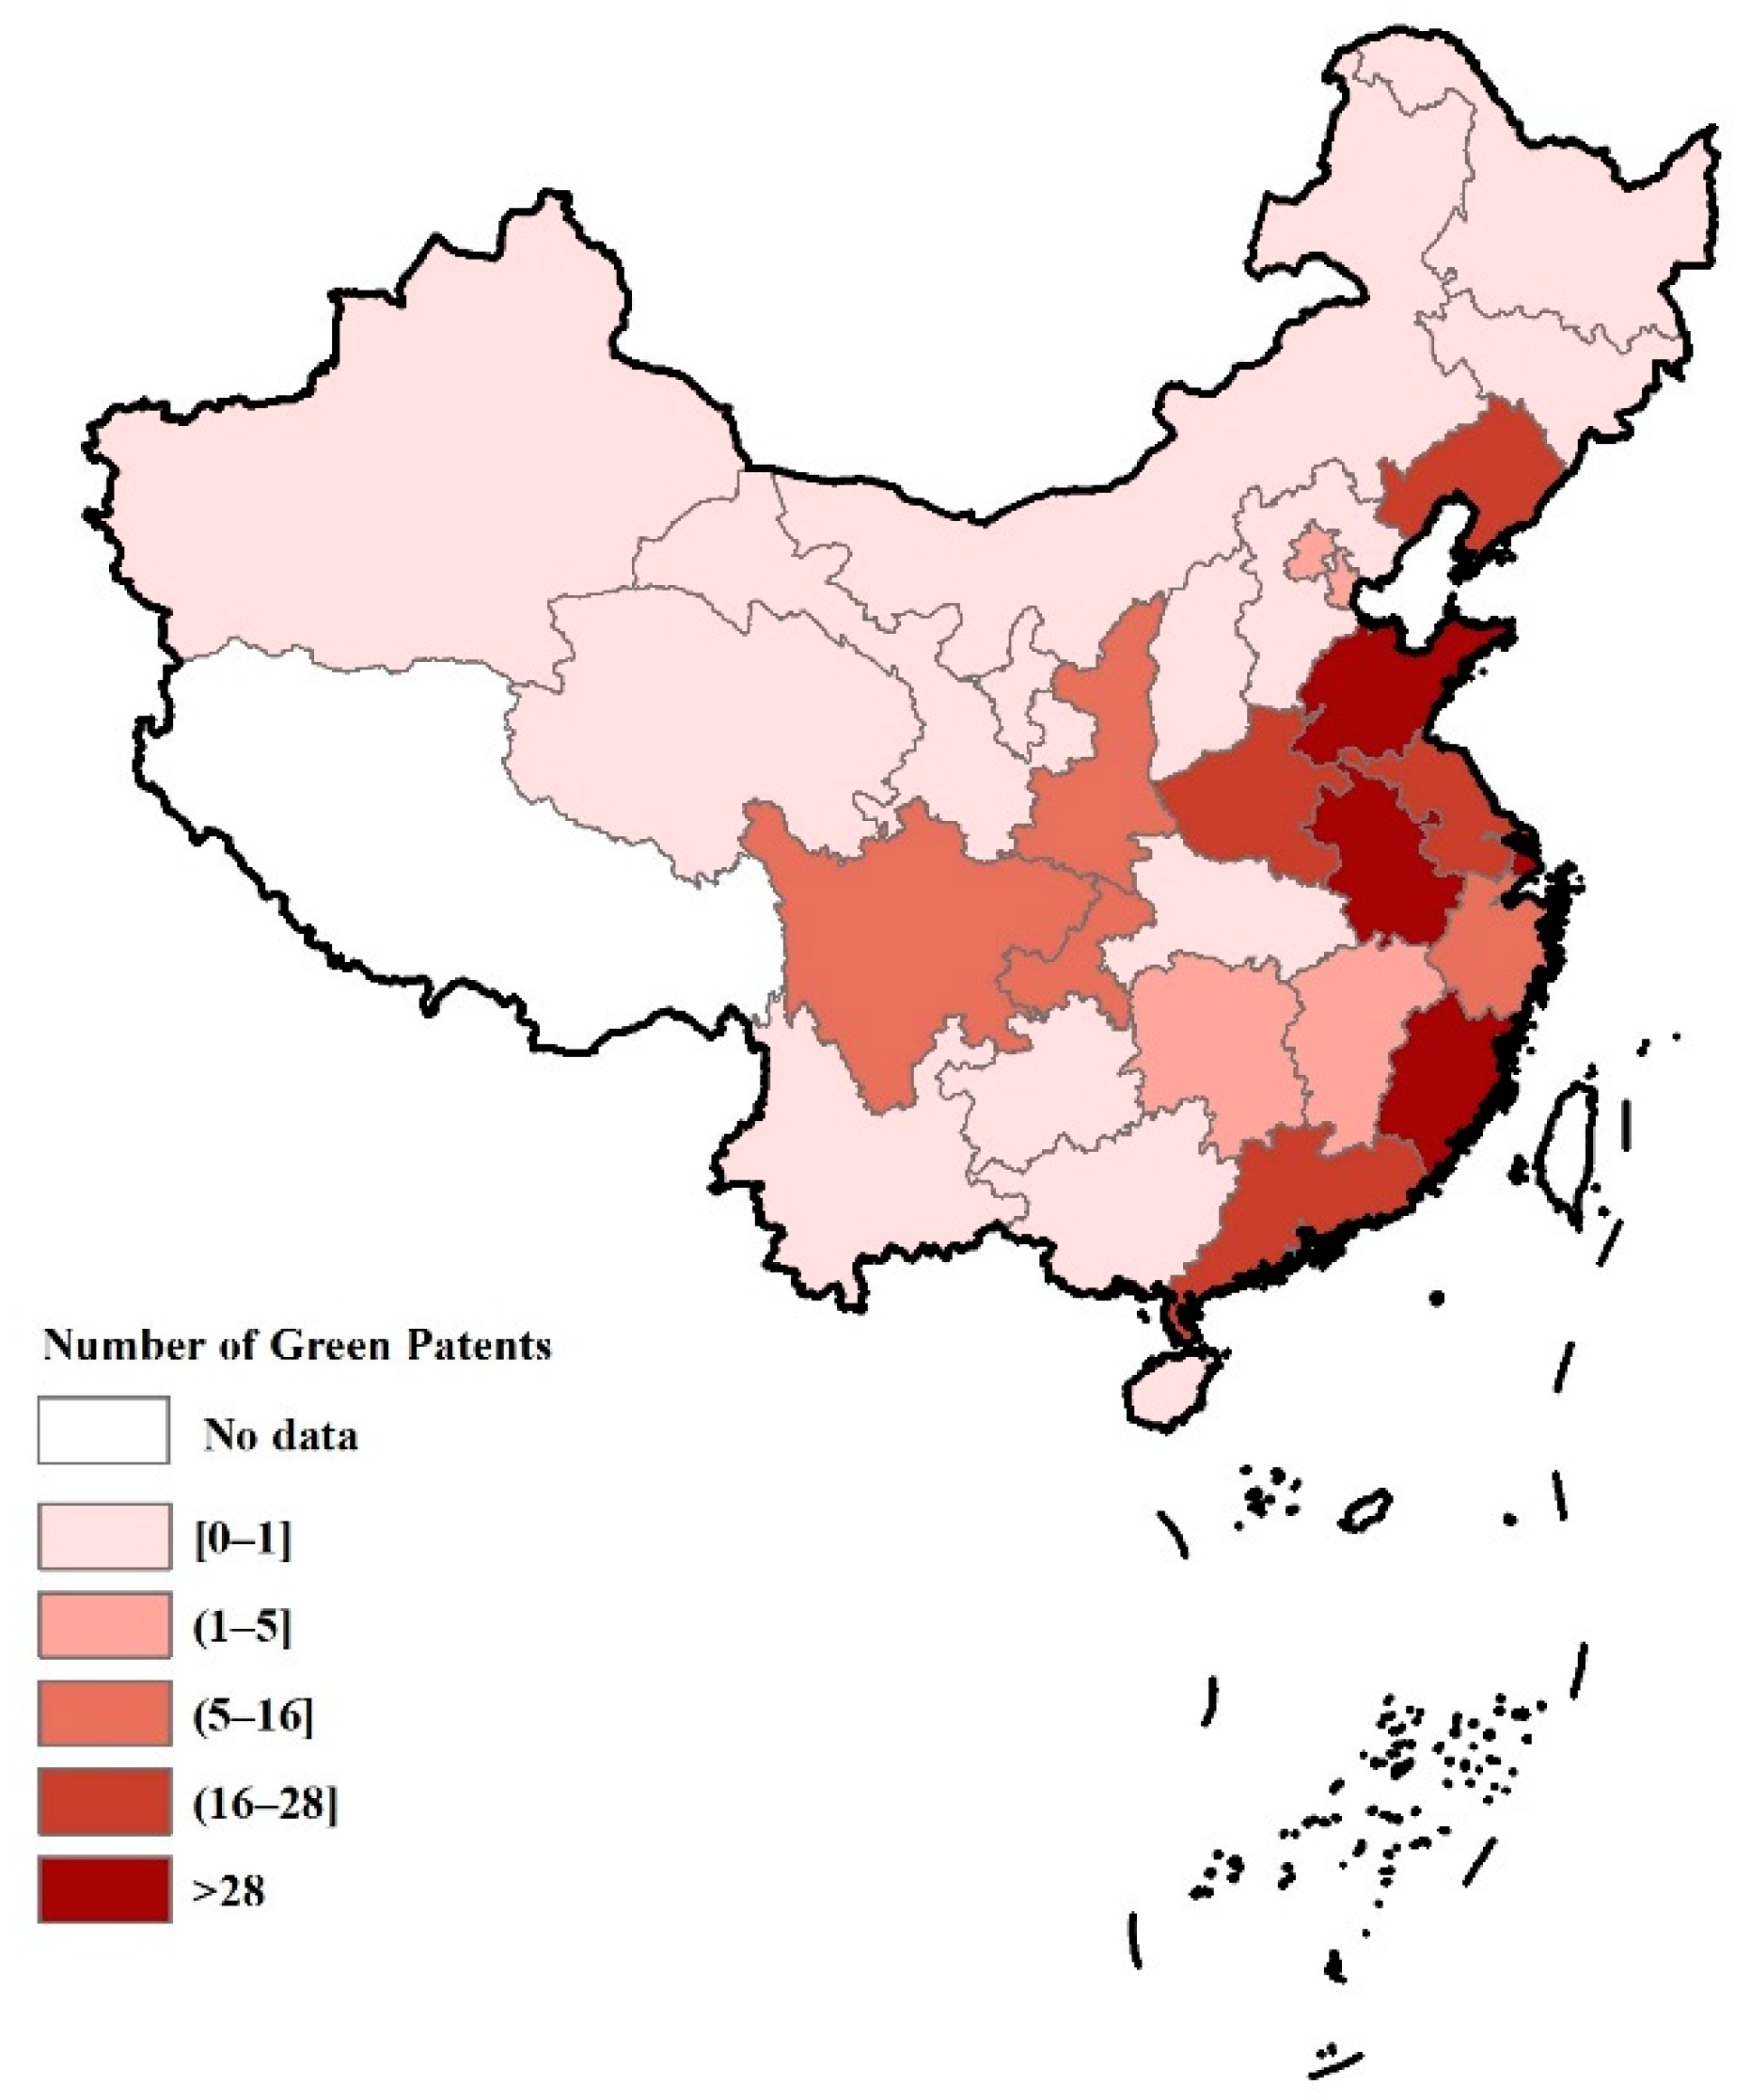
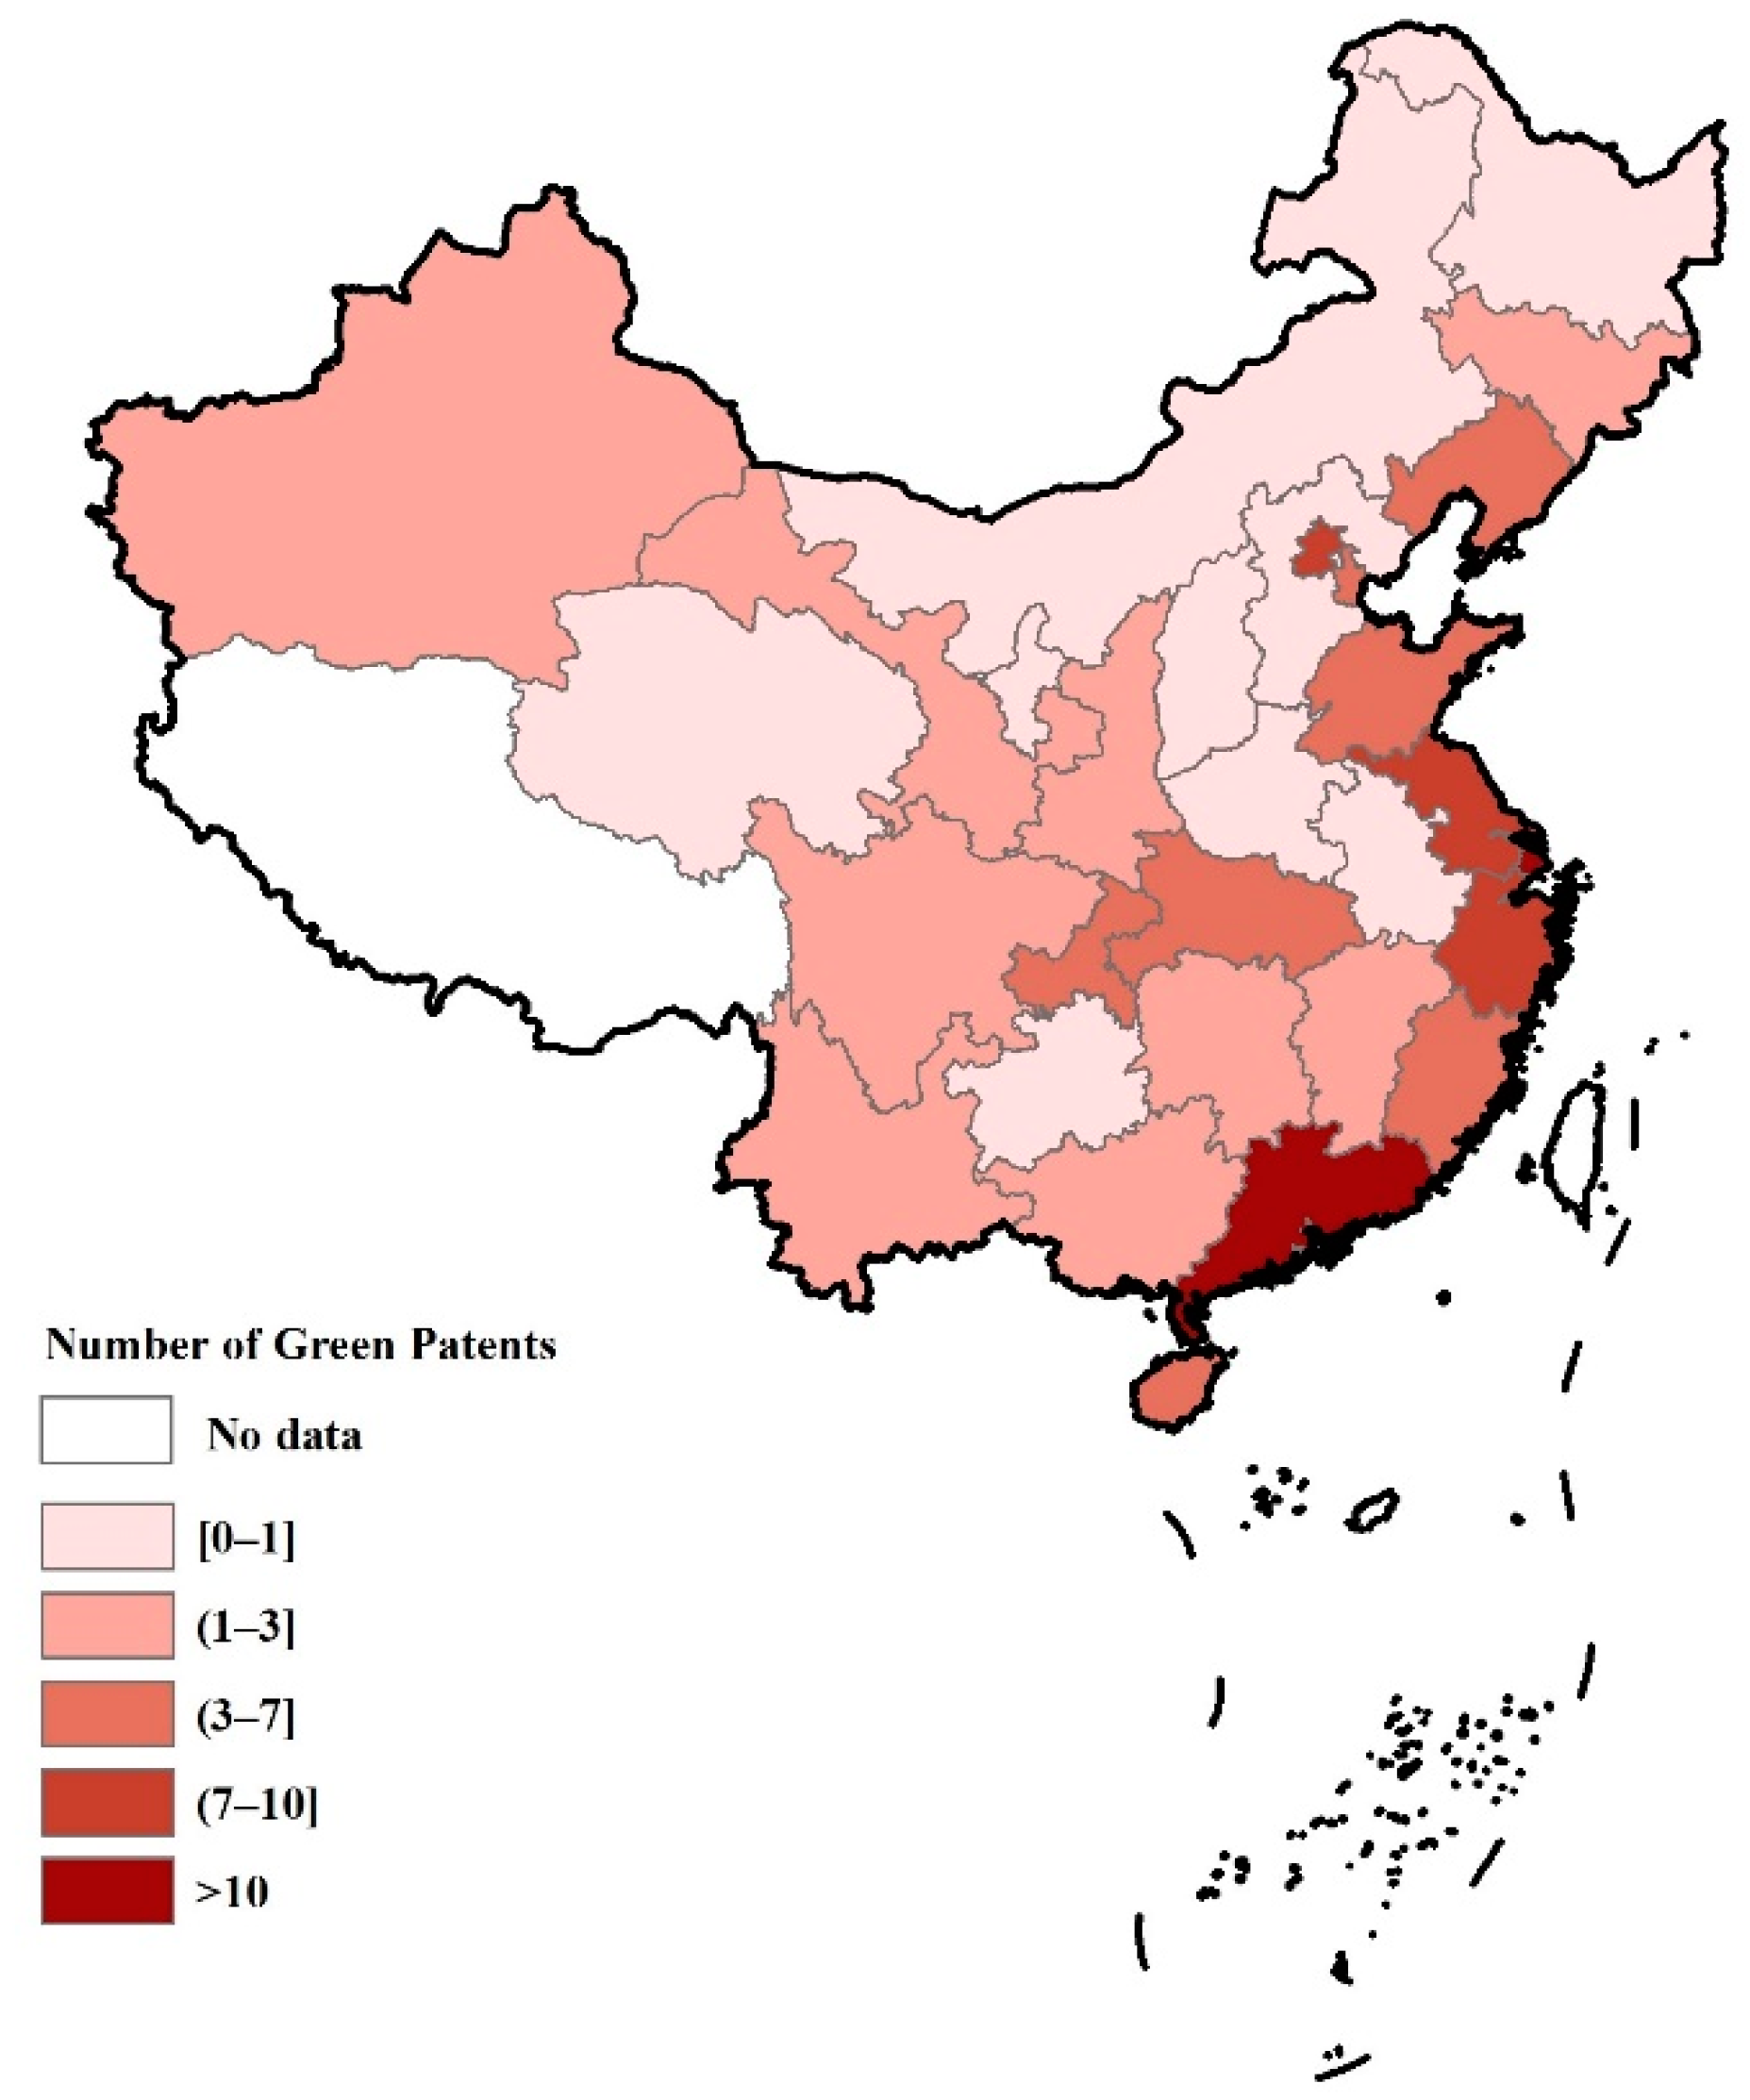
Figure 4 and
Figure 5 map the region-level green technology innovation of transportation companies in 2002 and 2017, respectively. By comparing
Figure 4 with
Figure 5, we find that the market, rather than policy, is the main factor promoting green technology innovations of transportation companies. For example, Beijing, one of the regions with the strictest environmental regulation in China, had a slower uptake of green technology innovation from 2002 to 2017. On the contrary, the provinces with more developed logistics industry in China had a faster development of green technology innovation of transportation between 2002 and 2017; Shandong (the logistics centre of northern China), Shanghai (one of the most developed regions in China for e-commerce), and Fujian (the most developed province in China in terms of maritime transport) have become the regions with the highest level of green technology innovation of transportation companies in 2017.
4.1.3. Measures on Indirect Mechanisms
We also need some variables for indirect mechanisms in the empirical model. Firstly, technology spill over. Referring to methods from existing literature [
62,
63,
64], this paper uses the amount of citations of green patents to represent the level of technology spill over. Secondly, market competition. Market potential is inversely correlated with the degree of market competition (
MC). Considering the availability of data, this paper constructs the following market potential indicator according to Harris [
65] and He et al. [
14] and uses the inverse of this as a variable reflecting market competition.
where in Equation (2),
represents the real GDP of
i province in year
t.
represents the transportation distance between two provinces, which is measured by the geography distance between two provincial capitals, and
dii represents the interior distance of province, its calculation equation is as follows:
where,
represents the area of province
i and the circumference is taken as
. Therefore, Equation (2) represents the inverse of the total domestic demand faced by province
i in year
t. The smaller the MS, the smaller the market potential of province
i, and the more competitive the market will be faced by firms in province
i.
Thirdly, social network. There is evidence from China that the political identity of corporate managers has a significant impact on a firm’s performance. Business managers have political status, such as party members, NPC deputies (Ren da dai biao), CPPCC members (Zheng xie wei yuan), etc., which means having strong social connections. This paper uses the number of party members, NPC deputies and CPPCC members among executives of listed companies as a proxy variable for the social network of transportation companies. The data comes from the annual reports of A-share listed transport companies. Some missing values are replaced by zero and summed up by according to place of business registration.
4.1.4. Other Control Variables
There are also some factors that impact the development of SSCs. Referring to research on supply chains and inter-region trading [
66,
67], this paper introduces per-capita GDP, population, geographical distance, urbanization rate as control variables. Description of all variables are summarized in
Table 1.
4.2. Empirical Research Design
Section 2 described the direct and indirect theoretical mechanisms for how green technology innovations promote the SSC development. This section builds an empirical model to test the theoretical hypothesis. Referring to Fang and Zhang’s [
3] empirical research on supply chains, we introduce the panel data Log-Log regression model. The Equation (4) is set to test the direct mechanism of green technology innovation promoting effect on SSC development.
where,
is the proxy of the SSC development defined in
Section 4.1.1.
and
are the green technology innovations of the starting province and destinations province respectively as defined in
Section 4.1.2.
are mentioned in
Section 4.1.3.
is the fixed effects of the region pair between province
I and province
j, and
is the intercepts and the error term.
β describes parameters that need to be estimated.
Furthermore, the equation to test indirect mechanisms are set as following.
In Equation (5),
and
are the variables that reflects the indirect mechanism as described in
Section 4.1.3 (TS, MC and SW). We introduce the interaction items between
and
to test the effects of indirect mechanisms.
describe parameters that need to be estimated. Other letter meanings remain the same as in Equation (4).
5. Empirical Results
5.1. Baseline Results
We deleted observations with missing values. The result of the Hausman test is 15.61 (
p = 0.0081), implying that fixed effect model (FE) is the most ideal regression method. To ensure the robustness of the results, we also show the results by using generalized least squares model (GLS), random effects model (RE).
Table 2 reports the baseline results.
According to baseline results, we had two key findings. One on hand, green technology innovations of transport companies have the positive role of promoting SSC development. When control variables are added, the coefficients of GI were all negative and significant at least at the 5% level (Mode1 2 to Model 4), indicating that green technology innovation of transport companies can reduce carbon emissions. As result in Model 4, when the level of green technological innovation of transportation enterprises increased by 1% totally (both starting and destination province), the level of transportation carbon emissions decreased by about 0.23% (. The hypothesis about the direct mechanism was supported by empirical results.
On another hand, green innovation of transportation companies in the destination provinces had a stronger contribution to SSC than the starting province. For example, in model 4, the coefficient of lnGIi,t is −0.0925, which means that for every 1% increase in the level of green innovation of transportation companies in the starting provinces, the carbon emissions per unit of trade were reduced by about 0.09%. While for every 1% increase in the level of green innovation of transportation companies in the destination provinces, the carbon emissions per unit of trade was reduced by about 0.14%. The promotion effect of GI was about 52.24% higher at the destination province than at the departure.
5.2. Robustness Tests
For improving the credibility and robustness of the conclusions, we conducted robustness tests by replacing the core explanatory variables, mitigating endogeneity and the results of robustness tests are shown in
Table 3.
Firstly, the patent data was divided into the number of grants and the number of applications. In the baseline regression, we used the number of green patent applications as the core explanatory variable. To ensure the robustness of the reserach conclusions, we made the regression using the number of patents granted (lnGI_1) instead of the number of patent applications (Model 5). It was found that the estimated coefficients of green patents in the departure and destination provinces were still significantly negative, and the regression coefficients of the destination province were greater than those of the departure province.
Second, endogeneity is an important issue in economics research. Drawing on Du et al. (2019) [
30], this research took the lagged term (
L.lnGI) of green technology innovation and re-estimated it (Model 6) to minimise the impact of endogeneity on the results. The results showed that an increase in the level of green technology innovation in both the departure and destination provinces significantly reduced carbon emissions per unit of trade, consistent with the baseline results in
Section 5.1.
5.3. Effect of Indirect Mechanisms
In keeping with
Section 4, we also removed missing values and conducted a Hausman test, and the results of Hausman support that the FE model is the most appropriate regression method. For simplicity, we only report the results for the FE model. Using Equation (5), the empirical results on the indirect mechanisms are shown in
Table 4.
Through analysing
Table 4, we can get three main findings. First, green technology innovations of transport companies will promote SSC development through technology spill over. In Model (8), the coefficients of interaction terms between GI and TS are all negative and significant at 1% level, meaning that technology spill over will enhance the effect of green technology innovation on transport carbon emission reduction. Moreover, the coefficients of TS in the destination provinces are larger than the starting provinces, both in Models (7) and (8), which is consistent with the baseline results in
Section 4. We believe that the technology spill over mechanism will have an impact on both upstream and downstream companies in
Section 3. This result indicates that the effect of technology spill over mechanism may be stronger in downstream companies.
Second, green technology innovations of transport companies can promote SSC development through market competition. Both in Models (9) and (10), the coefficients of MC are negative and significant, meaning that market competition will enhance the effect of green technology innovation on transport carbon emission reduction. However, the effect through market competition mechanism is non-linear. In Model (10), the coefficients of MC are negative but the interact terms are positive, which shows that the marginal promotion effect of green technology innovation of transport companies on SSC development will weaken with market competition level increasing. The finding about the non-linear effect is consistent with He et al.’s [
14] on market structure and green performance.
Third, the social network mechanism may be not effective. The variables reflecting social networks are insignificant in Model 11. And the core independent variables also become insignificant after the introduction of the interaction term in Model 12. A possible reason for these insignificant results is China’s special corporate ownership system. Managers of state owned enterprises (SOEs) are more likely to have a political identity, and about 60% of the sample of listed transportation companies in China are SOEs or state controlled enterprises. China’s SOEs may enforce environmental policies more strictly than private companies because SOEs have closer ties with government [
68,
69,
70]. However, research has suggested that SOEs have low efficiency in innovating and so green innovation is hardly an effective mechanism for transport SOEs to improve SSC.
Similarly, consistent with the approach in
Section 4.2, we then tested the robustness on indirect mechanism results. For the brevity, these results are shown in
Appendix A. We can draw three conclusions from the
Table A1: (1) Green technology innovation by transport firms continues to promote SSC development through technology spill overs (columns 1–2 of
Table A1). (2) The marginal effect of green technology innovation by transport firms to SSC development will diminish as the level of market competition increases (columns 3–4 of
Table A1). (3) The social network mechanism remains insignificant (columns 5–6 of
Table A1). In summary, the robustness results were consistent with the previous findings, indicating the robustness of our conclusions.
6. Conclusions and Limitations
Over the past decades, the exploration of sustainable supply chains has become an important field both in supply chain management research and in practice. Green technology innovation is one of the important tools to promote the development of SSC. However, it remains unclear whether and how green technology innovations of transport companies promote the SSC development. We analyses the theoretical mechanism that green technology innovation of transport companies impact the SSC development and conducts an empirical test using data from China. The results support the following four conclusions.
First, green technology innovations of transport companies have a positive role of promoting SSC development directly. The empirical results in
Section 5 show that green technology innovation of transport companies can reduce carbon emissions, which can support the hypothesis about the direct mechanism. When the level of green technological innovation of transportation enterprises increased by 1% totally, the level of transportation carbon emissions decreased by about 0.23%.
Second, green technology innovations of transport companies will promote SSC development through technology spill over. We find that technology spill over mechanisms will have an impact on both upstream and downstream companies. Meanwhile, the effect of technology spill over mechanisms may be stronger to downstream companies.
Third, green technology innovations of transport companies can promote SSC development through market competition but the effect through market competition mechanism is non-linear. When market competition level increases, the marginal promotion effect of green technology innovation of transport companies on SSC development will weaken.
Fourth, the social network mechanism may be not effective because of China’s special corporate ownership system. China’s SOEs have low efficiency in innovating so green innovation is hardly an effective mechanism for transport SOEs to improve SSC.
There are two main limitations of our study that can be mitigated in future studies. Lack of data in our study resulted in three limitations: the green technology innovation data only included listed companies; listed companies usually have large scale, so this paper may not accurately reflect the green innovation of small and medium-sized transportation enterprises; the effect of enterprise size could not be included in the empirical study of this paper. Second, there were policy disruptions from 2002 to 2017, such as China’s Green Credit Policy (2012) and the implementation of the New Environmental Law (2016), which might have affected the accuracy of our estimation results. Future research could use causal analysis to filter out the influence of such policy shocks.
Author Contributions
Conceptualization, W.L.; methodology, W.L. and L.L.; writing—original draft preparation, W.L. and L.L. All authors have read and agreed to the published version of the manuscript.
Funding
This research received no external funding.
Institutional Review Board Statement
Not applicable.
Informed Consent Statement
Not applicable.
Data Availability Statement
The data are contained within the article.
Conflicts of Interest
The authors declare no conflict of interest.
Appendix A
Table A1.
Results of robustness tests on indirect mechanisms.
Table A1.
Results of robustness tests on indirect mechanisms.
| Dependent Variable: lnSSCi,j,t | (1) | (2) | (3) | (4) | (5) | (6) |
|---|
| lnGI_1i,t/L.lnGIi,t/lnGIi,t | −0.0632 *** | −0.0321 *** | −0.2819 *** | −0.0783 * | −0.0332 | −0.0014 |
| | (−4.83) | (−3.04) | (−4.32) | (−2.00) | (−1.00) | (−0.16) |
| lnGI_1j,t/L.lnGIj,t/lnGIj,t | −0.1284 *** | −0.1221 ** | −0.3824 *** | −0.0932 * | −0.0833 | −0.0024 |
| | (−3.84) | (−2.51) | (−4.38) | (−1.94) | (−0.88) | (−0.88) |
| lnTSi,t | −2.1833 * | −1.3531 | | | | |
| | (−1.81) | (−0.35) | | | | |
| lnTSj,t | −2.6542 * | −1.2913 | | | | |
| | (−1.85) | (−0.46) | | | | |
| lnMCi,t | | | −5.3821 *** | −5.4624 *** | | |
| | | | (−11.33) | (−6.15) | | |
| lnMCj,t | | | −8.3274 *** | −6.1933 *** | | |
| | | | (−13.58) | (−5.32) | | |
| lnSNi,t | | | | | −0.1277 *** | −0.3823 *** |
| | | | | | (−4.18) | (−6.01) |
| lnSNj,t | | | | | −0.2411 *** | −0.2134 *** |
| | | | | | (−5.33) | (−6.81) |
| ln(GIi,t×Si,t) | −0.8773 *** | −0.7315 *** | | | | |
| | (−4.82) | (−4.59) | | | | |
| ln(GIj,t×TSj,t) | −1.3422 *** | −1.1934 *** | | | | |
| | (−5.32) | (−4.26) | | | | |
| ln(GIi,t×MCi,t) | | | 2.2844 *** | 4.3284 *** | | |
| | | | (4.28) | (4.22) | | |
| ln(GIj,t×MCj,t) | | | 3.2193 *** | 5.3284 *** | | |
| | | | (4.11) | (4.99) | | |
| ln(GIi,t×SNi,t) | | | | | 0.7742 | 0.6311 |
| | | | | | (1.09) | (1.09) |
| ln(GIj,t×SNj,t) | | | | | 0.8542 | 0.6472 |
| | | | | | (0.99) | (1.01) |
| intercept | 18.3842 *** | 10.3744 *** | 8.3723 *** | 16.3244 *** | 12.757 *** | 10.3274 *** |
| | (13.30) | (7.43) | (6.77) | (14.32) | (17.10) | (8.53) |
| Control variables | YES | YES | YES | YES | YES | YES |
| Regression method | FE | FE | FE | FE | FE | FE |
| R-squared | 0.7832 | 0.7742 | 0.8323 | 0.8791 | 0.8075 | 0.7483 |
| F-value | 88.32 *** | 98.43 *** | 128.21 *** | 121.44 *** | 88.64 *** | 88.13 *** |
| obs | 12,627 | 11,849 | 10,080 | 9302 | 8601 | 7823 |
References
- Pagès-Bernaus, A.; Ramalhinho, H.; Juan, A.A.; Calvet, L. Designing e-commerce supply chains: A stochastic facility–location approach. Int. Trans. Oper. Res. 2019, 26, 507–528. [Google Scholar] [CrossRef]
- Wang, Y.; Yu, Z.; Ji, X. Coordination of e-commerce supply chain when e-commerce platform providing sales service and extended warranty service. J. Control. Decis. 2020, 7, 241–261. [Google Scholar] [CrossRef]
- Fang, D.; Zhang, X. The protective effect of digital financial inclusion on agricultural supply chain during the COVID-19 pandemic: Evidence from china. J. Theor. Appl. Electron. Commer. Res. 2021, 16, 3202–3217. [Google Scholar] [CrossRef]
- Ma, J.; Liu, Z.; Chai, Y. The impact of urban form on CO2 emission from work and non-work trips: The case of Beijing, China. Habitat Int. 2015, 47, 1–10. [Google Scholar] [CrossRef]
- Fahimnia, B.; Sarkis, J.; Eshragh, A. A tradeoff model for green supply chain planning: A leanness-versus-greenness analysis. Omega 2015, 54, 173–190. [Google Scholar] [CrossRef]
- Golicic, S.L.; Smith, C.D. A meta-analysis of environmentally sustainable supply chain management practices and firm performance. J. Supply Chain Manag. 2013, 49, 78–95. [Google Scholar] [CrossRef]
- Guo, F.; Liu, Q.; Liu, D.; Guo, Z. On production and green transportation coordination in a sustainable global supply chain. Sustainability 2017, 9, 2071. [Google Scholar] [CrossRef] [Green Version]
- Tong, Y.; Li, Y. External intervention or internal coordination? incentives to promote sustainable development through green supply chains. Sustainability 2018, 10, 2857. [Google Scholar] [CrossRef] [Green Version]
- Hosseini-Motlagh, S.; Ebrahimi, S.; Jokar, A. Sustainable supply chain coordination under competition and green effort scheme. J. Oper. Res. Soc. 2021, 72, 304–319. [Google Scholar] [CrossRef]
- Qiao, A.; Choi, S.H.; Pan, Y. Multi-party coordination in sustainable supply chain under consumer green awareness. Sci. Total Environ. 2021, 777, 146043. [Google Scholar] [CrossRef]
- Carrión-Flores, C.E.; Innes, R. Environmental innovation and environmental performance. J. Environ. Econ. Manag. 2010, 59, 27–42. [Google Scholar] [CrossRef]
- Asongu, S.A.; Le Roux, S.; Biekpe, N. Environmental degradation, ICT and inclusive development in sub-Saharan Africa. Energy Policy 2017, 111, 353–361. [Google Scholar] [CrossRef] [Green Version]
- Khan, H.; Liu, W.; Khan, I.; Oanh, L.K. Recent advances in energy usage and environmental degradation: Does quality institutions matter? A worldwide evidence. Energy Rep. 2021, 7, 1091–1103. [Google Scholar] [CrossRef]
- He, A.; Xue, Q.; Zhao, R.; Wang, D. Renewable energy technological innovation, market forces, and carbon emission efficiency. Sci. Total Environ. 2021, 796, 148908. [Google Scholar] [CrossRef]
- Zhang, Y.; Peng, Y.; Ma, C.; Shen, B. Can environmental innovation facilitate carbon emissions reduction? Evidence from China. Energy Policy 2017, 100, 18–28. [Google Scholar] [CrossRef]
- Yang, W.; Li, T.; Cao, X. Examining the impacts of socio-economic factors, urban form and transportation development on CO2 emissions from transportation in China: A panel data analysis of China’s provinces. Habitat Int. 2015, 49, 212–220. [Google Scholar] [CrossRef]
- Zhang, L.; Kou, C.; Zheng, J.; Li, Y. Decoupling analysis of CO2 emissions in transportation sector from economic growth during 1995–2015 for six cities in Hebei, China. Sustainability 2018, 10, 4149. [Google Scholar] [CrossRef] [Green Version]
- Bai, C.; Zhou, L.; Xia, M.; Feng, C. Analysis of the spatial association network structure of China’s transportation carbon emissions and its driving factors. J. Environ. Manag. 2020, 253, 109765. [Google Scholar] [CrossRef]
- Han, Q.; Wang, Y. Decision and coordination in a low-carbon e-supply chain considering the manufacturer’s carbon emission reduction behavior. Sustainability 2018, 10, 1686. [Google Scholar] [CrossRef] [Green Version]
- Marchi, B.; Zanoni, S.; Zavanella, L.E.; Jaber, M.Y. Supply chain models with greenhouse gases emissions, energy usage, imperfect process under different coordination decisions. Int. J. Prod. Econ. 2019, 211, 145–153. [Google Scholar] [CrossRef]
- Tundys, B.; Wiśniewski, T. Simulation-based analysis of greenhouse gas emissions in sustainable supply chains—Re-design in an approach to supply chain strategy. Energies 2021, 14, 3504. [Google Scholar] [CrossRef]
- Bazan, E.; Jaber, M.Y.; Zanoni, S. Supply chain models with greenhouse gases emissions, energy usage and different coordination decisions. Appl. Math. Model. 2015, 39, 5131–5151. [Google Scholar] [CrossRef]
- Bai, Q.; Chen, M.; Xu, L. Revenue and promotional cost-sharing contract versus two-part tariff contract in coordinating sustainable supply chain systems with deteriorating items. Int. J. Prod. Econ. 2017, 187, 85–101. [Google Scholar] [CrossRef]
- Nanyunja, J.; Jacxsens, L.; Kirezieva, K.; Kaaya, A.N.; Uyttendaele, M.; Luning, P.A. Shift in performance of food safety management systems in supply chains: Case of green bean chain in kenya versus hot pepper chain in uganda. J. Sci. Food Agric. 2016, 96, 3380–3392. [Google Scholar] [CrossRef]
- Dente, S.M.R.; Aoki-Suzuki, C.; Tanaka, D.; Kayo, C.; Murakami, S.; Hashimoto, S. Effects of a new supply chain decomposition framework on the material life cycle greenhouse gas emissions—The Japanese case. Resour. Conserv. Recycl. 2019, 143, 273–281. [Google Scholar] [CrossRef]
- Chen, F.; Zhao, T.; Liao, Z. The impact of technology-environmental innovation on CO2 emissions in China’s transportation sector. Environ. Sci. Pollut. Res. Int. 2020, 27, 29485–29501. [Google Scholar] [CrossRef]
- Rhodes, W.D. Technology, Innovation Theory and the Implementation Process; NCC Blackwell: Oxford, UK, 1994. [Google Scholar]
- Guo, J.; Zhou, Y.; Ali, S.; Shahzad, U.; Cui, L. Exploring the role of green innovation and investment in energy for environmental quality: An empirical appraisal from provincial data of China. J. Environ. Manag. 2021, 292, 112779. [Google Scholar] [CrossRef]
- Guo, R.; Lv, S.; Liao, T.; Xi, F.; Zhang, J.; Zuo, X.; Cao, X.; Feng, Z.; Zhang, Y. Classifying green technologies for sustainable innovation and investment. Resour. Conserv. Recycl. 2020, 153, 104580. [Google Scholar] [CrossRef]
- Du, K.; Li, P.; Yan, Z. Do green technology innovations contribute to carbon dioxide emission reduction? Empirical evidence from patent data. Technol. Forecast. Soc. Chang. 2019, 146, 297–303. [Google Scholar] [CrossRef]
- Pei, Y.; Zhu, Y.; Liu, S.; Wang, X.; Cao, J. Environmental regulation and carbon emission: The mediation effect of technical efficiency. J. Clean. Prod. 2019, 11, 117599. [Google Scholar] [CrossRef]
- Liao, X.; Shi, X. Public appeal, environmental regulation and green investment: Evidence from China. Energy Policy 2018, 119, 554–562. [Google Scholar] [CrossRef]
- Wang, K.; Yu, S.; Zhang, W. China’s regional energy and environmental efficiency: A DEA window analysis based dynamic evaluation. Math. Comput. Model. 2013, 58, 1117–1127. [Google Scholar] [CrossRef]
- Yu, Y.; Wu, W.; Zhang, T.; Liu, Y. Environmental catching-up, eco-innovation, and technological leadership in China’s pilot ecological civilization zones. Technol. Forecast. Soc. Chang. 2016, 112, 228–236. [Google Scholar] [CrossRef]
- Alvarez-Herranz, A.; Balsalobre-Lorente, D.; Shahbaz, M.; Cantos, J.M. Energy innovation and renewable energy consumption in the correction of air pollution levels. Energy Policy 2017, 105, 386–397. [Google Scholar] [CrossRef]
- Gambhir, A.; Tse, L.K.C.; Tong, D.L.; Martinez-Botas, R. Reducing China’s road transport sector CO2 emissions to 2050: Technologies, costs and decomposition analysis. Appl. Energy 2015, 157, 905–917. [Google Scholar] [CrossRef] [Green Version]
- Lu, S.; Jiang, H.; Liu, Y.; Huang, S. Regional disparities and influencing factors of average CO2 emissions from transportation industry in Yangtze River economic belt. Transp. Res. Part D 2017, 57, 112–123. [Google Scholar] [CrossRef]
- Wang, M.; Li, Y.; Li, J.; Wang, Z. Green process innovation, green product innovation and its economic performance improvement paths: A survey and structural model. J. Environ. Manag. 2021, 297, 113282. [Google Scholar] [CrossRef]
- Xu, X.; Zeng, S.; Zou, H.; Shi, J. The impact of corporate environmental violation on shareholders’ wealth: A perspective taken from media coverage. Bus. Strategy Environ. 2016, 25, 73–91. [Google Scholar] [CrossRef]
- Lin, R.J.; Tan, K.H.; Geng, Y. Market demand, green product innovation, and firm performance: Evidence from Vietnam motorcycle industry. J. Clean. Prod. 2013, 40, 101–107. [Google Scholar] [CrossRef]
- Lee, K.H.; Min, B. Green R&D for eco-innovation and its impact on carbon emissions and firm performance. J. Clean. Prod. 2015, 108, 534–542. [Google Scholar] [CrossRef] [Green Version]
- Hua, J.; Wu, Y.; Jin, P. Prospects for renewable energy for seaborne transportation—Taiwan example. Renew. Energy 2008, 33, 1056–1063. [Google Scholar] [CrossRef]
- Sadorsky, P. The effect of urbanization on CO2 emissions in emerging economies. Energy Econ. 2014, 41, 147–153. [Google Scholar] [CrossRef]
- Sadia, S.A.; Kaur, R.; Ersöz, F.; Lotero, L.; Weber, G. Evaluation of the effectiveness of green practices in manufacturing sector using CHAID analysis. J. Remanuf. 2018, 9, 3–27. [Google Scholar] [CrossRef]
- Davis, L.W.; Kilian, L. Estimating the effect of a gasoline tax on carbon emissions. J. Appl. Econ. 2011, 26, 1187–1214. [Google Scholar] [CrossRef] [Green Version]
- Andersen, J.J.; Greaker, M. Emission trading with fiscal externalities: The case for a common carbon tax for the non-ETS emissions in the EU. Environ. Resour. Econ. 2017, 71, 803–823. [Google Scholar] [CrossRef]
- Tsai, W.H. Carbon emission reduction—Carbon tax, carbon trading, and carbon offset. Energies 2020, 13, 6128. [Google Scholar] [CrossRef]
- Reyes, P.M.; Visich, J.K.; Jaska, P. Managing the dynamics of new technologies in the global supply chain. IEEE Eng. Manag. Rev. 2020, 48, 156–162. [Google Scholar] [CrossRef]
- Ivanov, D. ‘A blessing in disguise’ or ‘as if it wasn’t hard enough already’: Reciprocal and aggravate vulnerabilities in the supply chain. Int. J. Prod. Res. 2020, 58, 3252–3262. [Google Scholar] [CrossRef]
- Nayal, K.; Raut, R.D.; Queiroz, M.M.; Yadav, V.S.; Narkhede, B.E. Are artificial intelligence and machine learning suitable to tackle the COVID-19 impacts? An agriculture supply chain perspective. Int. J. Logist. Manag. 2021. [Google Scholar] [CrossRef]
- Benzidia, S.; Makaoui, N.; Bentahar, O. The impact of big data analytics and artificial intelligence on green supply chain process integration and hospital environmental performance. Technol. Forecast. Soc. Chang. 2021, 165, 120557. [Google Scholar] [CrossRef]
- Li, X.; Bosworth, D. R&D spillovers in a supply chain and productivity performance in British firms. J. Technol. Transf. 2020, 45, 177–204. [Google Scholar] [CrossRef]
- Hsu, P.; Hui, H.; Lee, H.; Tseng, K. Supply chain technology spillover, customer concentration, and product invention. J. Econ. Manag. Strat. 2021. [Google Scholar] [CrossRef]
- Han, X.; Chen, Q. Sustainable supply chain management: Dual sales channel adoption, product portfolio and carbon emissions. J. Clean Prod. 2021, 281, 125127. [Google Scholar] [CrossRef]
- Yu, Y.; Li, X.; Xu, X. Reselling or marketplace mode for an online platform: The choice between cap-and-trade and carbon tax regulation. Ann. Oper. Res. 2022, 310, 293–329. [Google Scholar] [CrossRef]
- Avazpour, R.; Ebrahimi, E.; Fathi, M.R. Prioritizing agility enablers based on agility attributes using fuzzy prioritization method and similarity-based approach. Int. J. Econ. Manag. Soc. Sci. 2014, 3, 143–153. [Google Scholar]
- Safari, H.; Razghandi, E.; Fathi, M.R.; Cruz-Machado, V.; Cabrita, M.d.R. The effectiveness of quality awards on the company’s performance—The case of iran’s national quality awards. Benchmarking Int. J. 2020, 27, 1319–1340. [Google Scholar] [CrossRef]
- Shi, X.; Dong, C.; Zhang, C.; Zhang, X. Who should invest in clean technologies in a supply chain with competition? J. Clean. Prod. 2019, 215, 689–700. [Google Scholar] [CrossRef]
- Lin, Z.; Wang, S.; Yang, L. Motivating innovation alliance’s environmental performance through eco-innovation investment in a supply chain. J. Clean. Prod. 2020, 269, 122361. [Google Scholar] [CrossRef]
- Ghosh, D.; Shah, J. Supply chain analysis under green sensitive consumer demand and cost sharing contract. Int. J. Prod. Econ. 2015, 164, 319–329. [Google Scholar] [CrossRef]
- Heydari, J.; Govindan, K.; Basiri, Z. Balancing price and green quality in presence of consumer environmental awareness: A green supply chain coordination approach. Int. J. Prod. Res. 2021, 59, 1957–1975. [Google Scholar] [CrossRef]
- Belenzon, S.; Schankerman, M. Spreading the word: Geography, policy, and knowledge spillovers. Rev. Econ. Stat. 2013, 95, 884–903. [Google Scholar] [CrossRef]
- Jinji, N.; Zhang, X.; Haruna, S. Trade patterns and international technology spillovers: Evidence from patent citations. Rev. World Econ. 2015, 151, 635–658. [Google Scholar] [CrossRef]
- Kim, D.H.; Lee, B.K.; Sohn, S.Y. Quantifying technology—Industry spillover effects based on patent citation network analysis of unmanned aerial vehicle (UAV). Technol. Forecast. Soc. Chang. 2016, 105, 140–157. [Google Scholar] [CrossRef]
- Harris, C.D. The market as a factor in the localization of industry in the United States. Ann. Assoc. Am. Geogr. 1954, 44, 315–348. [Google Scholar] [CrossRef]
- Anderson, J.E.; Wincoop, E.V. Gravity with gravitas: A solution to the border puzzle. Am. Econ. Rev. 2003, 93, 170–192. [Google Scholar] [CrossRef] [Green Version]
- Combes, P.; Lafourcade, M.; Mayer, T. The trade-creating effects of business and social networks: Evidence from France. J. Int. Econ. 2005, 66, 1–29. [Google Scholar] [CrossRef] [Green Version]
- Zhang, D.; Rong, Z.; Ji, Q. Green innovation and firm performance: Evidence from listed companies in China. Resources. Conserv. Recycl. 2019, 144, 48–55. [Google Scholar] [CrossRef]
- Wang, K.; Jiang, W. State ownership and green innovation in china: The contingent roles of environmental and organizational factors. J. Clean. Prod. 2021, 314, 128029. [Google Scholar] [CrossRef]
- Yao, S.; Pan, Y.; Sensoy, A.; Uddin, G.S.; Cheng, F. Green credit policy and firm performance: What we learn from china. Energy Econ. 2021, 101, 105415. [Google Scholar] [CrossRef]
| Publisher’s Note: MDPI stays neutral with regard to jurisdictional claims in published maps and institutional affiliations. |
© 2022 by the authors. Licensee MDPI, Basel, Switzerland. This article is an open access article distributed under the terms and conditions of the Creative Commons Attribution (CC BY) license (https://creativecommons.org/licenses/by/4.0/).


