Abstract
The main purpose of this paper was to outline a novel approach for the use of industrial by-products generated in coal mines and coal-fired power plants as the components for artificial soils. Several coal combustion by-products, coal mine waste and organic waste materials were tested at laboratory scale for use in the reclamation of areas degraded by coal mining activity. The role of artificial soils was the land rehabilitation of the high acidic waste heap. The results revealed that the amounts of organic matter (14.87–25.01%) and nutrients in the soil substitutes were sufficient to support plant growth, i.e., N (0.37–0.51%), P (0.23–0.47%), K (1.78–3.17%), Ca (4.93–8.39%) and Mg (1.16–1.71%). A phytotoxicity test using white mustard (Sinapis alba) seeds under laboratory conditions showed good germination results (56–66%) for three soil substitutes that did not contain fly ash from biomass combustion, compared to the reference soil (84%). The relationships established for the aqueous leachate parameters of soil substitutes vs. the Sinapis alba germination revealed negative correlations with electrical conductivity (r = −0.88), SO42− (r = −0.91) and Cl− (r = −0.70) ions; the two latter ones were responsible for the salinity which hampered the germination process of the soil substitutes. Moreover, quite similar correlations were obtained between the germination of Sinapis alba and the trace elements of the soil substitutes: Fe (r = −0.69), Cd (r = −0.72), Cu (r = −0.80), Pb (r = −0.78) and Zn (r = −0.74). However, negative and significant correlations in aqueous leachates were shown only with Ni concentration (r = −0.73). The relevance of these results for the effect of salinity on germination and the early growth of S. alba was discussed in detail and was confirmed with the Principal Component Analysis (PCA). The study proved that the physicochemical characteristic of recycled wastes exhibited their potential usefulness for the reclamation of affected areas such as mine waste heaps.
1. Introduction
The Polish coal mining industry generates up to 61,364,000 tons of mineral wastes annually which accounted for 53.2% of the total rock waste in 2018 [1]. A large majority of total mining wastes, i.e., 36,900,000 tones (60.1%) were disposed by landfilling, 24,100,000 tons (39.3%) were processed and recovered by waste producers and 318 tons (0.52%) have been temporarily stored and transformed by other recipients. According to Gawor [2], in the Upper Silesian Coal Basin there are 220 coal mining waste heaps with over 760 million tons of waste, covering over 4000 ha. It is estimated that for each ton of coal exploited, there is approximately 0.4–0.5 tons of waste materials, which are deposited at waste heaps that impact and degrade the neighboring areas as well as the landscape.
Mining waste materials at waste heaps contain high concentrations of sulfur (S) and significant amounts of heavy metals such as arsenic (As), antimony (Sb), cadmium (Cd), lead (Pb), mercury (Hg) and nickel (Ni), which are environmentally and biologically toxic elements both to human health and agriculture zones when they are released [3,4]. Additionally, the low concentration of nutrients, i.e., nitrogen (N), phosphorus (P) and potassium (P) and the organic matter of the stored wastes prevents the spontaneous succession of vegetation [5]. Coupled with the toxic level of heavy metals which restrict plant growth and the salinity and acidity the reclamation of mine waste heaps presents a complex task which is also due to their salinity and acidity [6].
The environmental problems in the vicinity of coal mine spoil heaps are caused by acid rock drainage (ARD) which is responsible for the deterioration of surface and groundwater, the soil and biodiversity at mining areas [7]. The ARD is generated when iron sulfides, (mainly pyrite-Fe2S), aggregated in rock waste materials are exposed to oxygen and water [8,9,10,11]. Although the weathering of pyrite is the main factor for initiating the process, the further hydrolysis of Fe3+, Al3+ and Mn2+ ions plays the most important role of releasing H+ ions (acidity) into the environment [12,13].
The rehabilitation of coal-affected areas requires among others the use of available amendments, fertilizers and stabilization techniques. The reclamation techniques described in scientific reports are based on the application of lime [14], composted manures [15,16] and municipal biosolids, such as sewage sludge [17], fly ash [18,19,20] or their mixture [21]. Sewage sludge and livestock waste are rich in organic matter and contain high concentrations of nutrients especially nitrogen, potassium and phosphorus, as well as trace elements. Therefore, they are being considered as possible options for the reclamation of degraded areas by industry activity.
Coal-fired power plants are responsible for producing millions of tons of coal combustion by-products (CCBs) including fly and bottom ash, boiler slag, flotation waste or flue gas desulfurization material [22,23,24].
The recycling of industrial by-products and wastes considered as “non valuable” materials is posing a challenge for environmental management. Only a small fraction of wastes generated from the combustion of coal can be applied to other technologies. The CCBs can be used as components in the production of cement, grout, blocks, lightweight aggregate, bricks or asphalt filler [25]. Bottom ash and boiler slag can be used as both fine and coarse lightweight aggregates [26]. Fly ash, apart from construction materials, is also used in agriculture as an improver for degraded soil.
The scientific literature has described the application of fly ash materials for removing heavy metals from aqueous systems and improving the properties and quality of degraded soils [18,27,28,29]. Fly ash is composed of over 20% of lime and for that reason it can also neutralize soil acidity to a level suitable for agricultural crops [19]. Compared to the bottom ash, it displays better heavy metal inactivation in contaminated soil [30].
Another possible use of CCBs’ is underground mine backfilling together with rock waste to avoid mine collapse in further and deeper extraction phases [31,32,33,34]. Such applications of waste as a backfilling material limit mining damage and the subsidence of the surface [24,33,34].
The research was performed under the Recovery project funded by the Research Fund for Coal and Steel [35] focused on land reclamation and the ecological restoration of coal mining-affected areas, which aims to accelerate the revitalization of degraded and transformed ecosystems to achieve an eco-friendly status. It assesses the contribution of ecosystems to human wellbeing by means of the “ecosystem-services” concept [36], evaluating the consequences of alternative courses of action to ensure that their capacity to provide benefits to society is not diminished.
Environmental regulations are currently encouraging the conversion of by-products and substances considered as “non valuable” wastes into useful products (circular economy). The challenge still remains when dealing with recycling industrial wastes (ashes, slags, aggregates, etc.) to find usable soil substitutes for environmental reclamation.
2. Materials and Methods
2.1. By-Products and Waste Materials
2.1.1. Waste Components
Five coal combustion by-products from industrial plants located in Upper Silesia in Poland as the potential components of soil substitutes were used in the current investigation. Fly ashes from coal and biomass combustion as well as the lime from the water decarbonization process were obtained from power plants. Mining by-products such as aggregate and sealing material (sludges) were obtained from a coal mine. Additionally, two organic waste materials including sewage sludge and spent mushroom compost were generated in a sewage treatment plant and mushroom farm, respectively. The list of selected components and their expected functions for soil substitutes for the reclamation of highly acidic waste heaps are presented in Table 1.

Table 1.
Set of by-products/potential soil substitute components and expected functions.
The expected function of fly ashes (CFA and BFA) as well as lime from the decarbonization process (DL) is to buffer the high acidity of waste heaps while the aggregate (AG) is involved in pH regulation and soil substitute skeleton building. Additionally, sealing material (SL) and waste organic materials (SWS and SMC) are responsible for supplying nutrients and organic carbon as the essential parameters for plant growth and development.
Before the physicochemical analysis, the soil substitute components were dried at a stable room temperature, crushed and passed through a 4 mm sieve. The components differed in terms of moisture content, chemical composition, consistency and structure. Coal combustion by-products, mine waste and organic waste materials were analyzed in the accredited laboratories of the GIG Research Institute in Katowice according to analytical procedures. Photographs of the tested waste components are presented in Figure 1.
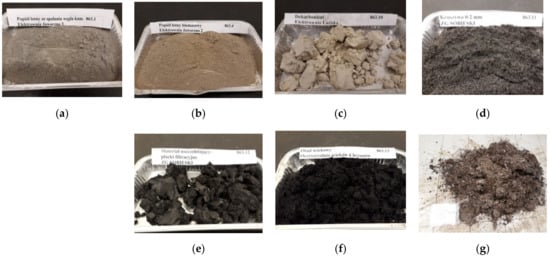
Figure 1.
Set of wastes selected for soil substitutes: (a) CFA—fly ash from coal combustion, (b) BFA—fly ash from plant biomass combustion, (c) DL—decarbonization lime, (d) AG—aggregate from mine waste processing; (e) SL—sealing material from coal processing, (f) SWS—sewage sludge, (g) SMC—spent mushroom compost.
2.1.2. Preparation of Soil Substitutes
The blending process was arranged in a manner to ensure some basic factors, i.e., the optimal structure of the soil substitutes (loose and lumpy, water-holding capacity, particle size distribution), appropriate chemical parameters (pH, electrical conductivity), macro- (Ca, K, Mg, N, P, S, Na,) and micronutrients (B, Cu, Fe, Mn, Mo, Zn) and organic matter for plant growth and development. Furthermore, the amendment of fly ashes and the decarbonization of lime increases the pH of a soil solution and may reduce the concentration of heavy metals such as Pb, Zn, Cd and Cu in water leachates.
A weight of 10.0 ± 0.10 kg of each soil substitute (n = 9) was prepared by the appropriate mixing of waste components. The soil substitutes were designated symbols S1–S9. The amount of used components corresponded to the percentage range of component waste presented in Figure 2.
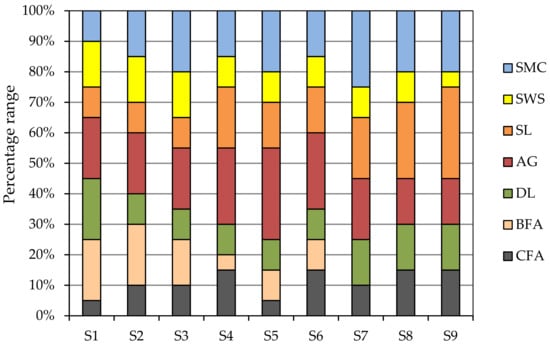
Figure 2.
List of wastes and their percentage range (%) within given soil substitutes. CFA—fly ash from coal combustion, BFA—fly ash from plant biomass combustion, DL—decarbonization lime, AG—aggregate from mine waste processing; SL—sealing material from coal processing, SWS—sewage sludge, SMC—spent mushroom compost.
The concentration ranges of wastes were 5–15% for CFA; 0–20% for BFA; 10–20 for DL; 15–30% for AG; 10–30% for SL; 5–15% for SWS and 10–25% for SMC.
Additionally, one reference soil (S0), i.e., a garden soil rich in organic matter with optimal parameters (N, P, K) was used for the control of the germination potential of Synapsis alba seeds as a plant for the phytotoxicity tests. The measured pH and electrical conductivity of the S0 soil were 5.5 and 443 µS·cm−1, respectively. The content of organic matter in S0 was 89% and the concentration of nitrogen (N), phosphorus (P) and potassium (K) amounted to 0.91, 0.11 and 0.12%, respectively.
2.2. Analytical Procedures
2.2.1. Waste Materials and Soil Substitutes
The content of dry matter (DM) was determined with the gravimetric method by drying samples to a constant weight at 105 °C (SLN 15, Pol-Eko-Aparatura Sp. J., Wodzisław Śląski, Poland). The amount of organic matter (OM) was determined by measuring the loss-on-ignition of dry matter at 550 °C (HT 16/16 with a P310 controller, Nabertherm GmbH, Lilienthal, Germany). The content of Ca, K, Mg, Na and P was determined by the wavelength dispersive X-ray fluorescence spectrometry method (Rigaku ZSX Primus, Rigaku Analytical Devices Inc., Wilmington, NC, USA). In the case of As, Cd, Cr, Cu, Fe, Ni, Mn, Pb and Zn, their content was determined by the ICP-OES method (Perkin Elmer Optima 5300 DV ICP-OES analyzer, Perkin Elmer Inc., Waltham, MA, USA) after mineralization with the solid samples in aqua regia (1:3 concentrated nitric acid and hydrochloric acid). The content of total organic carbon (TOC) and total sulfur (S) was determined with the infrared spectroscopy method (ELTRA CHS, Eltra GmbH, Haan, Germany), whereas the total nitrogen was determined according to titration by the Kjeldahl method.
2.2.2. Aqueous Leachates
Soil substitutes were mixed with deionized water in a soil-to-water ratio of 1:2.5 (w/v) using a rotary mixer (ROTAX 6.8, Velp Scientifica Srl, Usmate, Italy) at a speed of 40 rpm for a 24 h. Then the samples were centrifuged at 15,000 rpm for 10 min (Centrifuge 5810, Eppendorf, Hamburg, Germany) and filtered using Whatman 0.45 µm filters (GE Healthcare, Chicago, IL, USA).
The concentrations of Ca, K, Mg, Na, P and As, Cd, Cr, Cu, Fe, Ni, Mn, Pb and Zn were assayed with the ICP-OES method (Perkin Elmer Optima 5300, Perkin Elmer Inc., Waltham, MA, USA). The total organic carbon (TOC) of the leachates was determined with infrared spectroscopy (TOC-L CPH, Shimadzu, Japan), whereas the concentration of total nitrogen was determined with the high temperature infrared chemiluminescence detection method (TNM-L, Shimadzu, Japan). Next, Cl−, SO42− and NO3− anions were determined by ion chromatography (DIONEX ICS−5000, Thermo Fisher Scientific, Waltham, MA, USA) whereas the concentration of NH4+ ions was determined with the flow injection–spectrophotometric method (FIA, MLE Gmbh Dresden, Germany). The pH and electrical conductivity (EC) were measured by a pH meter (CPC−411, Elmetron, Zabrze, Poland) with a combination electrode (IJ44AT, Elmetron, Zabrze, Poland), respectively.
2.3. Phytotoxicity Test
The phytotoxicity of the soil substitutes was evaluated using a test plant, i.e., Sinapis alba L. (S. alba), commonly known as the white mustard plant. Seed germination tests were performed to assess the suitability of the artificial soils for vegetation development.
Seed germination assays were carried out on plastic sprouting bowls that contained 1.00 ± 0.01 kg of soil substitutes (Figure 2). Fifty seeds of Sinapis alba were sown at the depth of 1 cm in each sprouting bowl. The tests were performed in laboratory conditions under a constant temperature for the entire day (22 °C), with controlled humidity (35 ± 5%) and lighting parameters, i.e., 70 W, 4900 lm, 6000 K (Figure 3).
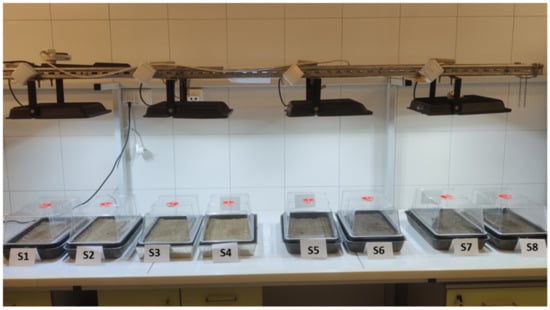
Figure 3.
Soil substitutes with Sinapis alba seeds during laboratory phytotoxicity tests.
Each sprouting bowl was watered once a day (50 mL/day) and exposed to white light for 12 h a day. After 20 days, the sprouted plants were carefully harvested, weighed and evaluated for the length of the sprout (cm). The phytotoxicity of soil substitutes was evaluated by calculating the relative sprout (root + shoot) elongation (RSE) according to Equation (1):
where LSS is the average length of the sprout on the tested soil substitute and LR is the average length of the sprout on the reference soil (S0).
2.4. Statistical Analysis
The normal distribution of the analyzed data was confirmed using the Shapiro–Wilk test. The relationship between the properties of the soil substitutes and Sinapis alba germination and early growth characteristics were analyzed using Pearson’s linear correlation coefficient with Statistica 12.0 (StatsSoft, Krakow, Poland). The differences between the groups were compared using an analysis of variance one-way ANOVA and the post-hoc Tukey’s HSD (Honestly Significant Difference) test with Statistica 12.0 (StatsSoft, Krakow, Poland). A probability level of a p-value less than 0.05 was considered statistically significant.
The Principal Component Analysis (PCA) was applied in order to determine soil substitute parameters that influenced the Sinapis alba development. The analysis was performed using the CANOCO package and the variables data were transformed using log (x + 1) prior to the analysis response [37].
3. Results and Discussion
3.1. Characteristics of the Waste Materials for Soil Substitutes
The physical and chemical parameters of the wastes used in the investigations are provided in Table 2. The wide range of data shows the heterogeneity of the wastes and their chemical composition.
Table 2.
Physicochemical characteristics of the wastes used for elaborating soil substitutes.
For moisture content, only CFA, BFA and AG showed an extremely low level as the dry matter (DM) was 90–100%, whereas the SWS and SMC components were characterized by a high moisture content and a relatively low dry matter: 16.06% and 34.75%, respectively.
Organic matter is the key parameter determining the environmental and biological sustainability of soil substitutes, particularly when they consist mostly of inorganic substrates. Among all the investigated wastes, only three could be considered rich in organic matter, i.e., SL (35.57%), SMC (60.45%) and SWS (64.33%), whereas the AG with 15.92% represented a moderate source of organic matter. The content of Ca and S in the wastes and their further occurrence in the ready-to-use soil substitutes are of prime importance for the remediation of waste heaps, where S and its compounds cause excessive acidity, contrary to calcium compounds (CaO, CaCO3), the addition of which significantly increases the pH value. The highest content of Ca i.e., 32.03%, was observed in DL as compared to SL and AG, containing 0.34 and 0.43%, respectively. The other wastes recorded a Ca level below 10%. Three of the eight investigated wastes exhibited S content of 1.87, 1.97 and 3.95% for SWS, SMC and AG, respectively, while in the remaining wastes the S content did not exceed 1.0%. The chemical forms of S in those wastes may affect their ability to be incorporated in the development of soil substitutes.
Another key feature to be expected from the wastes is adequate concentrations of plant nutrients such as N, P, K and Mg (Table 2). It has been reported that N is responsible for biomass build up [38,39], P for the good development of plant root systems [40,41] K for internal water management in plants [42] and Mg for photosynthesis activity [43,44].
Data showed that SWS and SMC contained much more N, i.e., 4.61 and 2.36%, respectively compared to other wastes, whereas their low content varied within the range 0.15 and 0.40%. It is worth mentioning that natural soil ecosystems are typically poor in nitrogen; hence, the developed soil substitutes should comply with this rule. Nevertheless, a slightly enhanced N level may be expected as a “starter” for boosting plant growth at the anthropogenic (artificial) ground.
In terms of P concentrations, only two wastes recorded values higher than 1.0%: one organic, i.e., SWS (2.73%) and one mineral BFA (1.07%). It should be observed that BFA was characterized by the highest K content (5.53%) while DL and SWS exhibited the lowest content varying from 0.04 to 0.37%, respectively. Interestingly, DL contained the highest Mg concentration, reaching up to 5.44%.
Higher contents of Fe were observed in BFA, AG and SWS, i.e., 4.55, 3.67 and 3.08%, respectively. In the case of Cr, its lowest and highest levels were detected in DL (1 mg·kg−1) and CFA (88 mg·kg−1), respectively. Copper content varied largely from 3 mg·kg−1 in DL to 269 mg·kg−1 for SWS, whereas Mn content ranged from 153 mg·kg−1 in AG to 2312 mg·kg−1 in BFA. Fly ash from coal combustion (CFA) as well as SWS exhibited the highest content of Ni (67 mg·kg−1) and Pb (300 mg·kg−1), respectively. The variations in Zn levels were significantly high among the wastes, i.e., from a low content for DL (36 mg·kg−1) to a high content for AG (1281 mg·kg−1) and an extremely high content in the case of SWS (2710 mg·kg−1).
3.2. Chemical Characteristics of Aqueous Leachates from Waste Materials
Chemical parameters of aqueous leachates recovered from the tested wastes are reported in Table 3.
Table 3.
Physicochemical characteristics of aqueous leachates from waste materials used for elaborating soil substitutes.
The chemical parameters of aqueous leachates from the waste materials varied widely. The analysis showed that the pH of SMC (pH 7.1), SWS (pH 7.5), SL (pH 7.8) and aggregate AG (pH 7.5) was neutral or slightly alkaline in comparison to other industrial wastes (pH range between 9.7 and 12.8). The electrical conductivity (EC) of BFA (39.4 mS·cm−1) was significantly higher compared to other mineral wastes, ranging between 0.5 and 3.6 mS·cm−1 and relatively higher than organic wastes, i.e., 12.2 and 7.7 mS·cm−1 for SWS and SMC, respectively. The reason for that was the very high concentrations of soluble particles and mineral elements in BFAs such as chlorides (4720 mg·L−1) and sulfates (7460 mg·L−1). The content of calcium (Ca) in mineral wastes ranged from 3.35 and 612 mg·L−1 and amounted to 642 mg·L−1 in SWS and 1110 mg·L−1 for SMC. The low concentrations of calcium in the aqueous extracts from DL were due to the presence of Ca in the forms of insoluble carbonate (CaCO3). However, the concentration of magnesium in the DL leachates was very high (347 mg·L−1) compared to the other samples.
Sodium concentrations ranged from 5.52 mg·L−1 (DL) to 223 mg·l−1 (SMC), whereas potassium concentrations ranged from 1.35 mg·L−1 (DL) to 1870 mg·L−1 (SMC). High values of total phosphorus (Pt), i.e., 36.5 mg·L−1 and 57.4 mg·L−1 were observed only for organic wastes SWS and SMC, respectively. The concentration of total nitrogen (Nt) 1540 mg·L−1 for SWS and 187 mg·L−1 for SMC was also relatively higher than in the coal by-products which ranged between 0.97 and16.50 mg·L−1.
The concentrations of trace elements such as Fe, Mn, As and Ni were higher in organic wastes (SWS and SMC) compared to industrial by-products. However, the contents of Cr in fly ashes, i.e., 0.69 and 0.45 mg·L−1 for CFA and BFA, respectively were higher than in SWS 0.007 mg·L−1 and SMC 0.019 mg·L−1.
3.3. Physicochemical Characteristics of Soil Substitutes
The physicochemical parameters of the soil substitutes are listed in Table 4.
Table 4.
Selected parameters of soil substitutes.
Soil organic matter plays a major role in terrestrial ecosystems. The concentration of organic matter in elaborated soil substitutes is within the range 14.87–25.01% (Table 4). Organic materials maintain the soil structure, improve water infiltration, increase the water holding capacity and reduce the risk of soil erosion. In addition, their decomposition provides nutrients for plants [45]. The highest amounts of OM and TOC were determined for S9, i.e., 25.01% and 16.34%, respectively.
The results show that the content of dry matter (DM) varied from 64.47 to 74.36%, implying that most of the incorporated wastes were characterized by relatively high DM (Table 2). The levels of N ranged from 0.37 to 0.51%, respectively, whereas those of other nutrients such as K (1.78–3.17%), P (0.23–0.47%) and Mg (1.08–1.71%) exhibited values indicating that these amounts may be sufficient for supporting plant growth and further green biomass production. The content of S in the soil substitutes ranged from 1.21 to 3.78% but the concentration of Ca varied from 4.93 to 8.39%. Wastes with high Ca contents are expected to counteract acidity, whereas those with notable S levels should enhance the acidification of soil at the dumping site.
The concentrations of trace elements in all soil substitutes (S1–S9) varied in the order Cd > As > Ni > Cr > Cu > Pb > Zn > Mn. According to the Polish Regulation on Soil Quality and Pollution Standards [46], the respective amounts did not exceed the permissible limits for soils classified in Groups III and IV. However, the concentration of As (11–12 mg·kg−1), Cd (3–4 mg·kg−1), Pb (123–170 mg·kg−1) and Zn (343–582 mg·kg−1) exceeded the permissible limits for Group II-1 related to agricultural areas (see Table 5).
Table 5.
Concentration of trace elements in soil substitutes.
Most of the lowest concentrations of trace elements which did not exceed the permissible limits for Group II-1 were observed for the soil substitute S9. Next, manganese levels ranging from 515 to 993 mg·kg−1 appeared as the highest among the reported trace elements. According to [46], manganese is not included in the list of harmful substances in soils for human and animal health. It is an essential micronutrient for plant growth; however, its excess in soil may also be toxic [47].
3.4. Chemical Characteristics of Aqueous Leachates from Soil Substitutes
The results of the pH and electrical conductivity (EC) of the aqueous leachates from soil substitutes (S1–S9) are presented in Figure 4a,b).
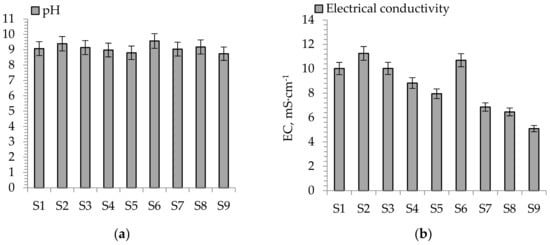
Figure 4.
Parameters in aqueous leachates from soil substitutes. (a) pH values, (b) electrical conductivity values.
Based on the general classification [48], the pH of the soil substitutes showed two basic ranges, i.e., strongly alkaline (pH from 8.7 to 9.0) and very strongly alkaline (pH from 9.1 to 9.6). The highest pH values were measured for S6 (pH 9.6) and the lowest for S9 (pH 8.7). According to [49], the optimal pH value for a variety of plants ranges from 5 to 8. However, the application of these soil substitutes for strongly acidic lands such as coal-mine affected areas seems to be justified.
The electrical conductivity (EC) data varied within two classifications [50], i.e., moderately saline (5.09–7.95 mS·cm−1) for S5 and S7–S9 and strongly saline (8.83–11.26 mS·cm−1) for S1–S4 and S6. The strong salinity of soil substitutes from 8.0 to 16.0 mS·cm−1 may reduce the sprouting and biomass yields and exhibit a series of harmful effects for plant growth and development.
The concentrations of some ions (SO42−, Cl−, NH4+, NO3−) which should exert some influence on the early growth of S. alba are presented in Figure 5a–d.
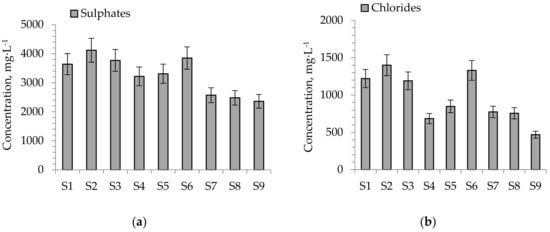
Figure 5.
Concentration of ions in aqueous leachates from soil substitutes (a) SO42−, (b) Cl−, (c) NH4+, (d) NO3−. The values with ±10% uncertainty.
The concentrations of SO42− ions for S7–S9 (2360–2570 mg·kg−1) were lower than for soils S1–S6 (3220–4120 mg·kg−1) whereas the concentration of Cl− ions for S4 (684 mg·kg−1) and S7–S9 (468–773 mg·kg−1) was lower compared to soils S1–S3 and S6 (1190–1400 mg·kg−1). Both ions in higher concentrations may exert a harmful effect on plant sprouting and growth. Excessive amounts of SO42− and Cl− ions lead to soil acidification (increasing the concentrations of H+ ions), raising the availability of trace elements and phytotoxic ones (heavy metals) [30]. The process may be reported according to Equation (2):
where Mn+ and H+ are metal and hydrogen ions, respectively.
The application of decarbonization lime (DL) increases the calcium compound content in soil substitutes. This resulted in a decrease in the concentrations of nitrogen and sulfur in aqueous leachates of soil substitutes. The lowest concentrations of ammonium ions (NH4+) were observed for S2 and S6–S9 (4.6–8.3 mg·L−1) whereas the lowest contents of NO3− were observed for S4 and S7–S9 (0.25–0.82 mg·L−1). A high NH4+ concentration can exert stress on many plants and cause a reduction in plant growth and toxicity symptoms (reduced plant growth, lesions occurring on stems and roots, and leaf margins rolling downward) [51].
The results of the macronutrient and heavy metal concentrations in water leachates from soil substitutes are presented in Table 6.
Table 6.
Physical and chemical characteristics of leachates from soil substitutes.
The average concentration of Ca (554 mg·L−1), Mg (201 mg·L−1), Na (129 mg·L−1) and P (3.01 mg·L−1) did not show significant differences between the samples except in the case of S9. Nevertheless, it was noticed that the average concentration of K in S4 and S7–S9 (1204.5 mg·L−1) was two times lower compared to the average concentration of the samples S1–S3 and S5 (2590 mg·L−1). Higher concentrations of Nt and Pt were also observed for soil S3 (13.6 and 4.47 mg·L−1, respectively) and soil S5 (22.2 and 4.60 mg·L−1, respectively).
The lowest concentration of Fe (0.03 mg·L−1), Cu (0.09 mg·L−1), Ni (0.04 mg·L−1) and Cr (<0.01 mg·L−1) were observed for S9, whereas the highest concentrations were observed for S1–S8, amounting to 0.11 mg·L−1 (Fe), 0.38 mg·L−1 (Cu), 0.10 mg·L−1 (Ni) and 0.02 mg·L−1 (Cr). On the other side, As and Pb were below the detection limits, i.e., <0.03 mg·L−1 and <0.01 mg·L−1, respectively, whereas the Zn concentration was detected only in S1–S5 and S7 ranged from 0.03 to 0.075 mg·L−1.
3.5. Phytotoxicity Tests—Response of Sinapis alba
The results of the germination and biomass weight of the S. alba and the calculated index of sprout elongation are presented in Table 7.
Table 7.
Parameters of early growth of S. alba on selected soil substitutse.
The best results of S. alba germination were observed for soil substitutes S9 (66%), S7 (62%) and S8 (58%) containing no fly ash from plant biomass combustion (BFA). Moreover, only 3% of the sprouting was observed in the soil S4 with 5% of BFAshare. The remaining soils S1–S3 and S5, S6 with a high content of BFA (10–20%) showed a lack of S. alba germination. It could be assumed that additional factors, other than pH and EC could have hampered the process of sprouting. The sprouting in the reference soil (S0) was 84% which confirms that a good seed quality was used and the tests were carried out in proper conditions for S. alba. The average weight of the S. alba fresh biomass on the tested soil substitutes (S7–S9) was in the range from 3.352 to 4.157 g per pot and corresponded to 0.483 to 0.593 g dry weight, respectively. It was observed that the differences between the measured biomasses were comparable. However, it was noticed that the weight of S. alba in the reference soil (12.804 g for fresh and 1.795 g for dry weight) was more than three times higher compared to the values in the soil substitutes. The results indicate the lower toxicity of S7–S9 in comparison to other soil substitutes (S1–S6).
It was observed that the sprout elongation index of S. alba was comparable for three tested soil substitutes. The highest value of RSE was 45.50% for S9 and the lowest was 6.83% for S4. The sprout length data are illustrated in Figure 6a,b.
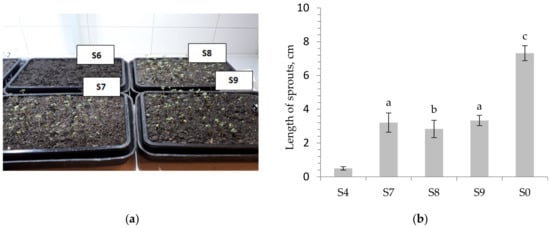
Figure 6.
Phytotest of S. alba. (a) Photos of plants after germination in soil substitutes S6–S9. (b) length of sprouts on soil substitutes. Different letters indicate significant differences at p < 0.05 (one-way-ANOVA, post-hoc Tukey HSD test); S0-reference soil.
The visual observations revealed that the length of the S. alba sprouts on the tested soil substitutes (S7–S9) ranged between 2.83 and 3.33 cm and the length of sprouts of the reference soil reached the value 7.32 cm, whereas in the case of S4 the length was only 0.5 cm. The results of the Tukey HSD multiple comparison test (for S7–S9 and S0) showed that the lengths of the sprouts were significantly different for S7 and S8 (p < 0.002), S8 and S9 (p < 0.001) and between the reference soil (S0) and other soil substitute groups (p < 0.001), whereas they were not significant for S7 and S9 (p = 0.698). The significant outcome (df = 140; F = 677.59, p < 0.0001) was obtained using an analysis of variance (ANOVA). The calculated coefficients R and R2 were 0.97 and 0.94, respectively, whereas the value of the mean square error was 0.24.
3.6. Impact of Physical and Chemical Parameters on the Early Growth of Sinapis alba
The relationships between the physical and chemical parameters of aqueous leachates from the soil substitutes on S. alba at early growth (germination, length of sprouts and weight of biomass) are reported in Table 8. The statistically significant values (p < 0.05) are marked in red.
Table 8.
Correlation coefficients between the basic physical and chemical parameters of aqueous leachates from soil substitutes and S. alba at early growth.
The results of our study showed a negative correlation between S. alba germination (G) and the parameters responsible for the salinity, i.e., EC (r = −0.88), SO42− (−0.91), Cl (r = −0.70) and K (r = −0.76). Soil salinization caused by Cl− ions and expressed by electrical conductivity is one of the major factors leading to soil degradation. The harmful effect of salt stress with chlorides on internal water activities, chlorophyll content, gas exchange or the osmotic regulations of plants as well as the morphological adaptation of plants to salinity was reported by Acosta-Motos et.al [52]. Our results also confirmed the direct negative effects of salinity (EC) on other parameters of S. alba growth, i.e., length of sprouts L (r = −0.88) and weight of biomass W (r = −0.88).
A negative correlation was also observed between the results of the phytotoxicity tests of S. alba and the total phosphorus content in aqueous leachates, i.e., G (−0.49), L (−0.51) and W (−0.49). Phosphorus is an essential nutrient, but in higher concentrations it can have an intermediate negative effect on plant growth conditions. The toxicity effects are observed when plant-available levels exceed 10 mg kg−1 of P [53]. However, based on our results, the total phosphorus concentrations in soil substitute leachates ranged from 2.33 to 4.60 mg L−1 (see Table 6). It may be claimed that this parameter did not show a significant correlation with the early growth of S. alba. It points to a lack of direct negative effects of phosphorus content on the early growth characteristics of S. alba.
The increased pH could have a potentially negative affect on S. alba germination and growth. The analysis also confirmed the lack of a significant correlation between the alkalinity of aqueous leachates (pH) and the early growth of S. alba, i.e., G (r = −0.36), L (r = −0.38), W (r = −0.37). This may be due to the fact that the pH in the aqueous leachates was mainly controlled by the Ca content (r = 0.85).
The Pearson analysis between the basic physical and chemical parameters of the soil substitutes (S1–S9) and the early growth of S. alba is listed in Table 9.
Table 9.
Correlation coefficients between the basic physical and chemical parameters of soil substitutes and S. alba in relation to the early growth characteristics.
The results confirmed that the most significant and negative correlation on the early growth of S. alba was observed for the Cl, S and K response for high salinity. The negative correlation of P was probably the result of the chemical properties of BFA and SWS that were characterized both with a high value of EC and a high P concentration in S1–S3 (Figure 1 and Table 2). The positive, but not significant, correlation with the data of phytotoxicity test was related to the content of OM and TOC r = 0.59 and r = 0.64, respectively for the germination and length of sprouts as well as r = 0.60 and r = 0.66, respectively for biomass weight.
Results reported by Asik, et al. [23] and Çelik, et al. [54] showed the positive effects of the humic substances on seed germination, seedling growth, root initiation, root growth, shoot development and the uptake of macro- and microelements. Soil humic substances may also mitigate the abiotic stress conditions caused by an unfavorable pH and a high salinity. The statistical analysis also outlined the significant negative correlation between the early growth of S. alba and the trace elements in the soil substitutes (Table 10).
Table 10.
Correlation coefficients between trace element concentrations in the soil substitutes and early growth of S. alba.
As may be observed, the results showed negative correlations between the germination of S. alba and the trace elements of the soil substitutes i.e., Fe (r = −0.69), Cd (−0.72), Cu (−0.80), Pb (r = −0.78) and Zn (−0.74). However, no significant correlations were noted between the trace element concentrations in the aqueous leachates and the data of the phytotoxicity test on S. alba (Table 11).
Table 11.
Correlation coefficients between trace element concentrations in the aqueous leachates from soil substitutes and the early growth of S. alba.
The Pearson’s analysis indicated that only nickel showed a strong negative correlation with the early growth of S. alba, i.e., G (r = −0.73), L (r = −0.76) and W (r = −0.73). According to Kabata-Pendias and Pendias [47], Ni is a very mobile element in soils and can readily transfer to aerial parts of plants, especially to seeds or grains. Potential negative effects on S. alba germination and early growth could also be explained by sensitivity to nickel contamination [55] and the synergy with increased salinity [56].
It should be mentioned that Cd, Cu, Ni, Pb and Zn exhibit a high potential for absorption in plants. Moreover Cr, Cu and Ni are the most phyto- and ecotoxicity metals, whereas Cd and Pb have been identified as the elements posing the highest risk of food-chain transfer. The results of trace elements in aqueous leachates confirmed that the use of wastes with a higher concentration of Ca such as decarbonization lime (DL) and slag from thermal power plants (SL) plays an important role in immobilizing heavy metals such as Cd, Cu, Pb and Zn in soil substitutes [57].
The Principal Component Analysis (PCA) was performed to evaluate the influence of the physical and chemical parameters of the soil substitutes on S. alba development. It involved TOC, SO42− and Cl− ions and the parameters of the early growth of S. alba. The first ordination axis of the PCA model (axis 1) accounted for 99.74% of the total variation. The illustration of the PCA analysis is presented in Figure 7. Axis 1 had a strong negative correlation with the concentration of sulfur ions (SO42–) in aqueous leachates from soil substitutes (−0.94) and a positive correlation with the content of TOC in soil substitutes (0.59). The S. alba germination (G), length of sprouts (L) and weight of biomass (W) showed a strong positive correlation with axis 1. The second ordination axis of the PCA model (axis 2) showed a weak negative correlation with the TOC content in the soil substitutes (−0.38) and a negative correlation with the concentration of Ni in aqueous leachates (−0.26). The results of the PCA analysis confirmed that salinity was the key factor affecting the results of the phytotoxicity test.
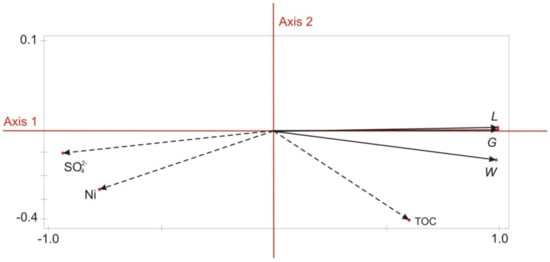
Figure 7.
Principal Component Analysis (PCA) for S. alba germination (G), length of sprouts (L) and weight of biomass (W) with relation to the total organic carbon (TOC) in the soil substitutes and sulfur (SO42−) and nickel (Ni) concentrations in the aqueous leachates from soil the substitutes.
4. Conclusions
The uses of industrial by-products from coal and biomass combustion as well as wastes from mine waste processing (fly ashes, decarbonization lime, aggregate and sealing materials) with the amendment of organic wastes (sewage sludge and spent mushroom compost) allowed the development of soil substitutes, addressing the land reclamation of waste heaps. The research showed that only three from the nine tested soil substitutes showed physical and chemical parameters that would allow their application in reclamation. The soil substitutes were different from one another in terms of the type of components and their content. The results showed that fly ash from biomass combustion (BFA) contributed to the high salinity of soil substitutes. Phytotoxicity tests with Sinapis alba at the early growth stage showed good germination (58–62%) in soil substitutes with a lack of BFA in comparison to the 0–3% and 84% germination in soils with the 5–20% content of BFA and reference soil (R), respectively. Experimental data presented in the paper showed that soil substitutes were rich in organic matter and nutrients (N, P, K, Ca, Mg), sufficient to support plant growth and further green biomass production. Moreover, the concentrations of trace elements (As, Cd, Cr, Cu, Ni, Pb and Zn) in soil substitutes did not exceed the permissible limits for soils, which are classified as wooded, shrubby and green areas.
The relationships between the chemical parameters of aqueous leachates from soil substitutes and S. alba at the early growth stage showed a negative correlation with the parameters responsible for high salinity (electrical conductivity, chloride, sulfur and potassium). Pearson’s analysis also indicated negative correlations between S. alba at the early growth stage and the content of trace elements (Fe, Cd, Cu, Pb and Zn) in soil substitutes and a strong negative correlation with nickel concentrations in the aqueous leachates. This could be explained by the sensitivity for nickel contamination and its synergy with increased salinity. Based on the results of the phytotoxicity tests and taking into consideration the permissible limits for their concentrations in soils, only three from the nine developed soils substitutes were found to be usable for the land reclamation of coal mine-affected areas.
The results of the research and experiments presented in this paper are important for assessing the possibility of the practical use of combustion and mining by-products in the production of soil substrates for the reclamation of industrial areas. The safe use of such anthropogenic materials fits well with the circular economy concept, combining an improved economic efficiency of industrial activities with environmental benefits. In this case, natural soils, as an expensive and non-renewable material for reclamation, could be replaced by a valuable substitute made from waste.
Author Contributions
Conceptualization, A.B. and J.D.; methodology, A.B.; J.D. and Ł.P.; software statistical analysis, Ł.P.; formal analysis, A.B., J.D. and Ł.P.; investigation, A.B., Ł.P. and A.W.-R.; writing—original draft preparation, A.W.-R., Ł.P. and A.B.; writing—review and editing, J.D. and A.K.; visualization; Ł.P. and A.W.-R.; supervision, A.K.; project administration, A.K.; funding acquisition, A.K. All authors have read and agreed to the published version of the manuscript.
Funding
This research was funded by the Research Fund for Coal and Steel (Grant Agreement No. 847205 from 17 April 2019) and the Polish Ministry of Science and Higher Education (Contract No. 5036/FBWiS/2019/2 from 17 December 2019) under the project RECOVERY “Recovery of degraded and transformed ecosystems in coal mining-affected areas.
Institutional Review Board Statement
Not applicable.
Informed Consent Statement
Not applicable.
Data Availability Statement
Data sharing not applicable.
Acknowledgments
The authors would like to thank the anonymous reviewers for their helpful comments.
Conflicts of Interest
The authors declare no conflict of interest.
References
- Statistic of Poland Evironment, 33rd ed.; Central Statistic Office in Poland: Warsaw, Poland, 2019. Available online: https://stat.gov.pl/obszary-tematyczne/srodowisko-energia/srodowisko/ochrona-srodowiska-2019,1,20.html (accessed on 1 April 2022).
- Gawor, Ł. Coal mining waste dumps as secondary deposits—Examples from the Upper Silesian coal basin and the Lublin coal basin. Geol. Geophys. Environ. 2014, 40, 285. [Google Scholar] [CrossRef]
- Klojzy-Kaczmarczyk, B.; Mazurek, J.; Staszczak, J. Analysis of the quality of waste from coal mining in relation to the requirements for inter mining waste. Miner. Resour. Manag. 2016, 95, 227–242. [Google Scholar]
- Szczepanska, J.; Twardowska, I. Distribution and environmental impact of coal-mining wastes in Upper Silesia, Poland. Environ. Geol. 1999, 38, 249–258. [Google Scholar] [CrossRef]
- Kirby, B.M.; Vengadajellum, C.J.; Burton, S.G.; Cowan, D.A. Coal, coal mines and spoil heaps. In Handbook of Hydrocarbon and Lipid Microbiology; Timmis, K.N., Ed.; Springer: Berlin/Heidelberg, Germany, 2010. [Google Scholar]
- Matsi, T.; Keramidas, V.Z. Fly ash application on two acid soils and its effect on soil salinity, pH, B, P and on ryegrass growth and composition. Environ. Pollut. 1999, 104, 107–112. [Google Scholar] [CrossRef]
- US Environmental Protection Agency. Acid Mine Drainage Prediction; US Environmental Protection Agency: Washington, DC, USA, 1994. Available online: https://www.epa.gov/sites/default/files/2015-09/documents/amd.pdf (accessed on 8 April 2022).
- Harries, J.R.; Ritchie, A.I.M. Pore gas composition in waste rock dumps undergoing pyritic oxidation. Soil Sci. 1985, 140, 143–152. [Google Scholar] [CrossRef]
- Rudisell, M.T.; Stuart, B.J.; Novak, G.; Payne, H.; Togni, C.S. Use of flue gas desulfurization by-product for mine sealing and abatement of acid mine drainage. Fuel 2001, 80, 837–843. [Google Scholar] [CrossRef]
- Xenidis, A.; Mylona, E.; Paspaliaris, I. Potential use of lignite fly ash for the control of acid generation from sulphidic wastes. Waste Manag. 2002, 22, 631–641. [Google Scholar] [CrossRef]
- Gitari, W.M.; Petrik, L.F.; Etchebers, O.; Key, D.L.; Iwuoha, E.; Okujeni, C. Passive neutralisation of acid mine drainage by fly ash and its derivatives: A column leaching study. Fuel 2008, 87, 1637–1650. [Google Scholar] [CrossRef]
- Bauerek, A.; Bebek, M.; Fraczek, R.; Paw, K.; Kasperkiewicz, W. Variability of chemical composition of acidic runoff waters from an active spoil heap of mining wastes representing sediments of the Cracow sandstone series of the Upper Silesian coal basin. Przegląd Geol. 2017, 65, 450–458. [Google Scholar]
- Watzlaf, G.; Schroeder, K.; Kleinmann, R.L.; Kairies, C.; Nairn, R. The Passive Treatment of Coal Mine Drainage; United States Department of Energy, National Energy Technology Laboratory Internal Publication: Pittsburgh, PA, USA, 2004. Available online: http://bobkleinmann.com/images/2004_DOEPassiveTreatment_of_Coal_Mine_Drainage_NETL-1202.pdf (accessed on 8 April 2022).
- Novak, J.M.; Ippolito, J.A.; Ducey, T.F.; Watts, D.W.; Spokas, K.A.; Trippe, K.M.; Sigua, G.C.; Johnson, M.G. Remediation of an acidic mine spoil: Miscanthus biochar and lime amendment affects metal availability, plant growth, and soil enzyme activity. Chemosphere 2018, 205, 709–718. [Google Scholar] [CrossRef]
- Dumıtru, M.; Cărăbış, D.; Pârvan, L.; Sârbu, C. Environmental rehabilitation of mining dumps. Agric. Agric. Sci. Procedia 2016, 10, 3–9. [Google Scholar] [CrossRef]
- Haering, K.C.; Lee Daniels, W.; Feagley, S.E. Reclaiming Mined Lands with Biosolids, Manures, and Papermill Sludges. In Reclamation of Drastically Disturbed Lands; American Society of Agronomy: Madison, WI, USA, 2015; pp. 615–644. [Google Scholar] [CrossRef]
- Sevilla-Perea, A.; Almendros, G.; Mingorance, M.D. Quadratic response models for N and P mineralization in domestic sewage sludge for mininig dump reclamation. Appl. Soil Ecol. 2014, 75, 106–115. [Google Scholar] [CrossRef]
- Dhindsa, H.S.; Sharma, R.D.; Kumar, R. Role of fly ash in improving soil physical properties and yield of wheat (Triticum aestivum). Agric. Sci. Dig. Res. J. 2016, 36, 97–101. [Google Scholar] [CrossRef]
- Skousen, J.; Yang, J.E.; Lee, J.S.; Ziemkiewicz, P. Review of fly ash as a soil amendment. Geosyst. Eng. 2013, 16, 249–256. [Google Scholar] [CrossRef]
- Ukwattage, N.L.; Ranjith, P.G.; Bouazza, M. The use of coal combustion fly ash as a soil amendment in agricultural lands (with comments on its potential to improve food security and sequester carbon). Fuel 2013, 109, 400–408. [Google Scholar] [CrossRef]
- Brown, S.L.; Henry, C.L.; Chaney, R.; Compton, H.; DeVolder, P.S. Using municipal biosolids in combination with other residuals to restore metal-contaminated mining areas. Plant Soil 2003, 249, 203–215. [Google Scholar] [CrossRef]
- Akcil, A.; Koldas, S. Acid mine drainage (AMD): Causes, treatment and case studies. J. Clean. Prod. 2006, 14, 1139–1145. [Google Scholar] [CrossRef]
- Asik, B.B.; Turan, M.A.; Celik, H.; Katkat, A.V. Effects of humic substances on plant growth and mineral nutrients uptake of wheat (Triticum durum cv. Salihli) under conditions of salinity. Asian J. Crop Sci. 2009, 1, 87–95. [Google Scholar] [CrossRef]
- Bian, Z.; Inyang, H.I.; Daniels, J.L.; Otto, F.; Struthers, S. Environmental issues from coal mining and their solutions. Min. Sci. Technol. 2010, 20, 215–223. [Google Scholar] [CrossRef]
- Park, J.H.; Edraki, M.; Mulligan, D.; Jang, H.S. The application of coal combustion by-products in mine site rehabilitation. J. Clean. Prod. 2014, 84, 761–772. [Google Scholar] [CrossRef]
- Siddique, R. Utilization of coal combustion by-products in sustainable construction materials. Resour. Conserv. Recycl. 2010, 54, 1060–1066. [Google Scholar] [CrossRef]
- Cheng, C.M.; Amaya, M.; Butalia, T.; Baker, R.; Walker, H.W.; Massey-Norton, J.; Wolfe, W. Short-term influence of coal mine reclamation using coal combustion residues on groundwater quality. Sci. Total Environ. 2016, 571, 834–854. [Google Scholar] [CrossRef] [PubMed]
- Park, J.Y. The evolution of waste into a resource: Examining innovation in technologies reusing coal combustion by-products using patent data. Res. Policy 2014, 43, 1816–1826. [Google Scholar] [CrossRef]
- Sajwan, K.S.; Twardowska, I.; Punshon, T.; Alva, A.K. Coal Combustion Byproducts and Environmental Issues; Springer Science + Business Media, Inc.: New York, NY, USA, 2006. [Google Scholar]
- Diatta, J.; Fojcik, E.; Drobek, L.; Spizewski, T.; Krzesiński, W. Assessment of heavy metals inactivation in contaminated soil by coal fly and bottom ashes. Mineralogia 2016, 48, 127–143. [Google Scholar] [CrossRef][Green Version]
- Sheshpari, M. A review of underground mine backfilling methods with emphasis on cemented paste backfill. Electron. J. Geotech. Eng. 2015, 20, 5183–5208. [Google Scholar]
- Jiang, N.; Zhao, J.; Sun, X.; Bai, L.; Wang, C. Use of fly-ash slurry in backfill grouting in coal mines. Heliyon 2017, 3, e00470. [Google Scholar] [CrossRef] [PubMed]
- Zhang, J.; Li, M.; Taheri, A.; Zhang, W.; Wu, Z.; Song, W. Properties and application of backfill materials in coal mines in China. Minerals 2019, 9, 53. [Google Scholar] [CrossRef]
- Skrzypkowski, K. Compressibility of materials and backfilling mixtures with addition of solid wastes from flue-gas treatment and fly ashes. In Proceedings of the E3S Web of Conferences, Szklarska Poręba, Poland, 22–25 May 2018; Volume 71, pp. 1–6. [Google Scholar] [CrossRef]
- Available online: https://recoveryproject.uniovi.es/ (accessed on 10 March 2022).
- Larondelle, N.; Haase, D. Valuing post-mining landscapes using an ecosystem services approach—An example from Germany. Ecol. Indic. 2012, 18, 567–574. [Google Scholar] [CrossRef]
- Lepš, J.; Šmilauer, P. Multivariate Analysis of Ecological Data; University of South Bohemia in Ceske Budejovice: Ceske Budejovice, Czech Republic, 2000. [Google Scholar]
- Heaton, E.; Voigt, T.; Long, S.P. A quantitative review comparing the yields of two candidate C4 perennial biomass crops in relation to nitrogen, temperature and water. Biomass Bioenergy 2004, 27, 21–30. [Google Scholar] [CrossRef]
- Lee, M.S.; Wycislo, A.; Guo, J.; Lee, D.K.; Voigt, T. Nitrogen fertilization effects on biomass production and yield components of Miscanthus × giganteus. Front. Plant Sci. 2017, 8, 544. [Google Scholar] [CrossRef]
- Wissuwa, M.; Gamat, G.; Ismail, A.M. Is root growth under phosphorus deficiency affected by source or sink limitations. J. Exp. Bot. 2005, 56, 1943–1950. [Google Scholar] [CrossRef]
- Shen, Q.; Wen, Z.; Dong, Y.; Li, H.; Miao, Y.; Shen, J. The responses of root morphology and phosphorus-mobilizing exudations in wheat to increasing shoot phosphorus concentration. AoB Plants 2018, 10, ply054. [Google Scholar] [CrossRef]
- Grzebisz, W.; Gransee, A.; Szczepaniak, W.; Diatta, J. The effects of potassium fertilization on water-use efficiency in crop plants. J. Plant Nutr. Soil Sci. 2013, 176, 355–374. [Google Scholar] [CrossRef]
- Guo, W.; Nazim, H.; Liang, Z.; Yang, D. Magnesium deficiency in plants: An urgent problem. Crop J. 2016, 4, 83–91. [Google Scholar] [CrossRef]
- Hermans, C.; Verbruggen, N. Physiological characterization of Mg deficiency in Arabidopsis thaliana. J. Exp. Bot. 2005, 56, 2153–2161. [Google Scholar] [CrossRef]
- Krull, E.S.; Skjemstad, J.O.; Baldock, J. A Functions of Soil Organic Matter and the Effect on Soil Properties; GRDC Final Report No. CSO 00029; Grains Research and Development Corporation (GRDC): Kingston, ACT, Australia, 2009; pp. 1–128. [Google Scholar]
- Regulation of the Minister of Environment on the manner of conducting assessment of pollution of the ground surface. J. Laws Repub. Pol. 2016, 1–86. Available online: https://isap.sejm.gov.pl/isap.nsf/DocDetails.xsp?id=WDU20160001395 (accessed on 8 April 2022). (In Polish).
- Kabata-Pendias, A.; Pendias, H. Biogeochemistry of Trace Elements; Wydawnictwo Naukowe PWN: Warsaw, Poland, 1999. (In Polish) [Google Scholar]
- Bruce, R.C.; Rayment, G.E. Analytical Methods and Interpretations Use by the Agricultural Chemistry Branch for Soil and Land Use Surveys; Bulletin QB82004; Queensland Department of Primary Industries: Brisbane, QLD, Australia, 1982; 13p. [Google Scholar]
- Hazelton, P.; Murphy, B. Interpreting Soil Test Results. What Do All the Numbers Mean? 3rd ed.; CSIRO Publishing: Collingwood, VIC, Australia, 2016. [Google Scholar]
- Miller, R.; Donahue, R. Soils in Our Environment: An Introduction to Soils and Plant Growth, 7th ed.; Prentice-Hall: Englewood Cliffs, NJ, USA, 1995. [Google Scholar]
- McCauley, A.; Jones, C.; Jacobsen, J. Plant nutrient functions and deficiency and toxicity symptoms. Nutr. Manag. Modul. 2011, 9, 1–16. [Google Scholar]
- Acosta-Motos, J.R.; Ortuño, M.F.; Bernal-Vicente, A.; Diaz-Vivancos, P.; Sanchez-Blanco, M.J.; Hernandez, J.A. Plant responses to salt stress: Adaptive mechanisms. Agronomy 2017, 7, 18. [Google Scholar] [CrossRef]
- Hayes, P.E.; Guilherme Pereira, C.; Clode, P.L.; Lambers, H. Calcium-enhanced phosphorus toxicity in calcifuge and soil-indifferent Proteaceae along the Jurien Bay chronosequence. New Phytol. 2019, 221, 764–777. [Google Scholar] [CrossRef]
- Çelik, H.; Katkat, A.V.; Aşik, B.B.; Turan, M.A. Effects of humus on growth and nutrient uptake of maize under saline and calcareous soil conditions. Zemdirb. Agric. 2010, 97, 15–22. [Google Scholar]
- Korzeniowska, J.; Stanisławska-Glubiak, E. Tolerance of white mustard (Sinapsis alba L.) to soil pollution with several heavy metals. Ecol. Chem. Eng. A 2011, 18, 445–450. [Google Scholar]
- Sethy, S.K.; Ghosh, S. Effect of heavy metals on germination of seeds. J. Nat. Sci. Biol. Med. 2013, 4, 272–275. [Google Scholar] [CrossRef] [PubMed]
- Wuana, R.A.; Okieimen, F.E. Heavy metals in contaminated soils: A review of sources, chemistry, risks and best available strategies for remediation. ISRN Ecol. 2011, 2011, 1–20. [Google Scholar] [CrossRef]
Publisher’s Note: MDPI stays neutral with regard to jurisdictional claims in published maps and institutional affiliations. |
© 2022 by the authors. Licensee MDPI, Basel, Switzerland. This article is an open access article distributed under the terms and conditions of the Creative Commons Attribution (CC BY) license (https://creativecommons.org/licenses/by/4.0/).