


Performance-Oriented Passive Design Strategies for Shape and Envelope Structure of Independent Residential Buildings in Yangtze River Delta Suburbs
Abstract
:1. Introduction
1.1. Background
1.2. Research Status
1.2.1. Passive Design Strategies
1.2.2. Energy-Efficient Building Shape Design
1.2.3. Influence of the Shape on Performance
1.3. Focus
2. Materials and Methods
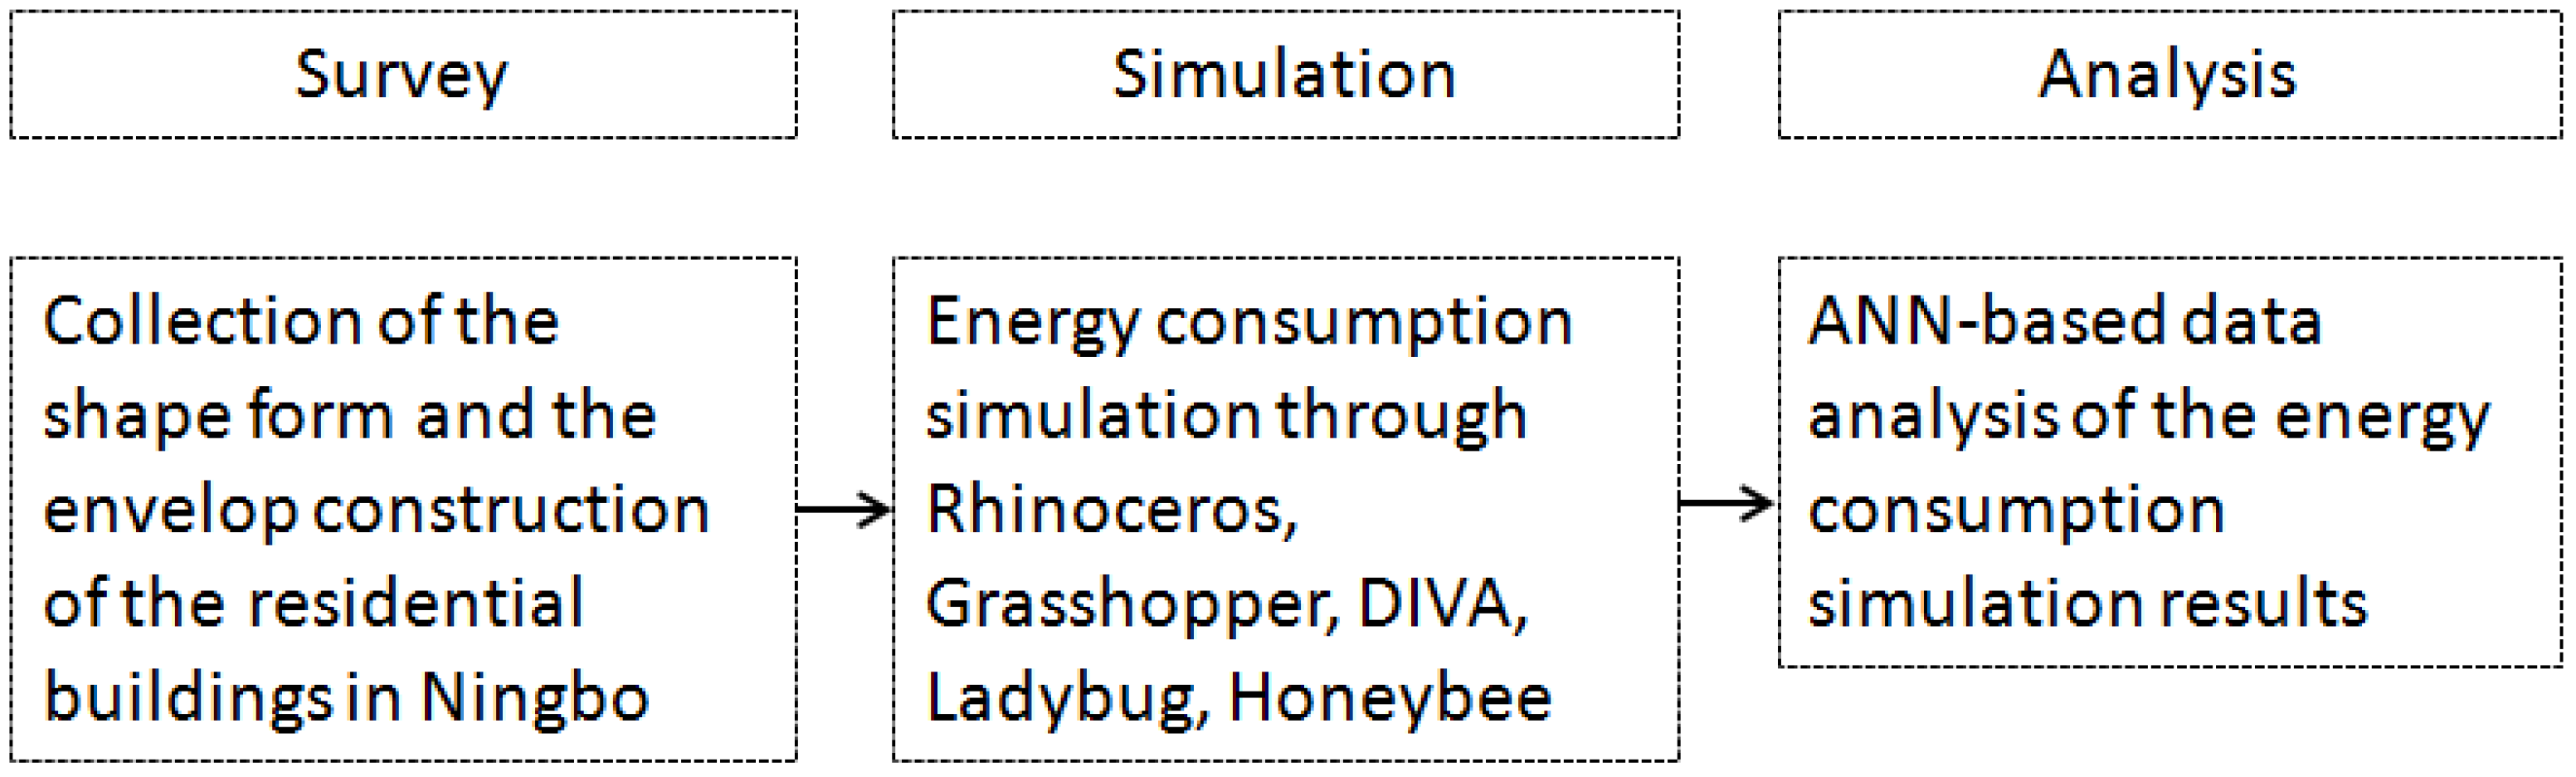
2.1. Performance Simulation and Sample Generation
2.2. ANN-Based Data Analysis
3. Experiments
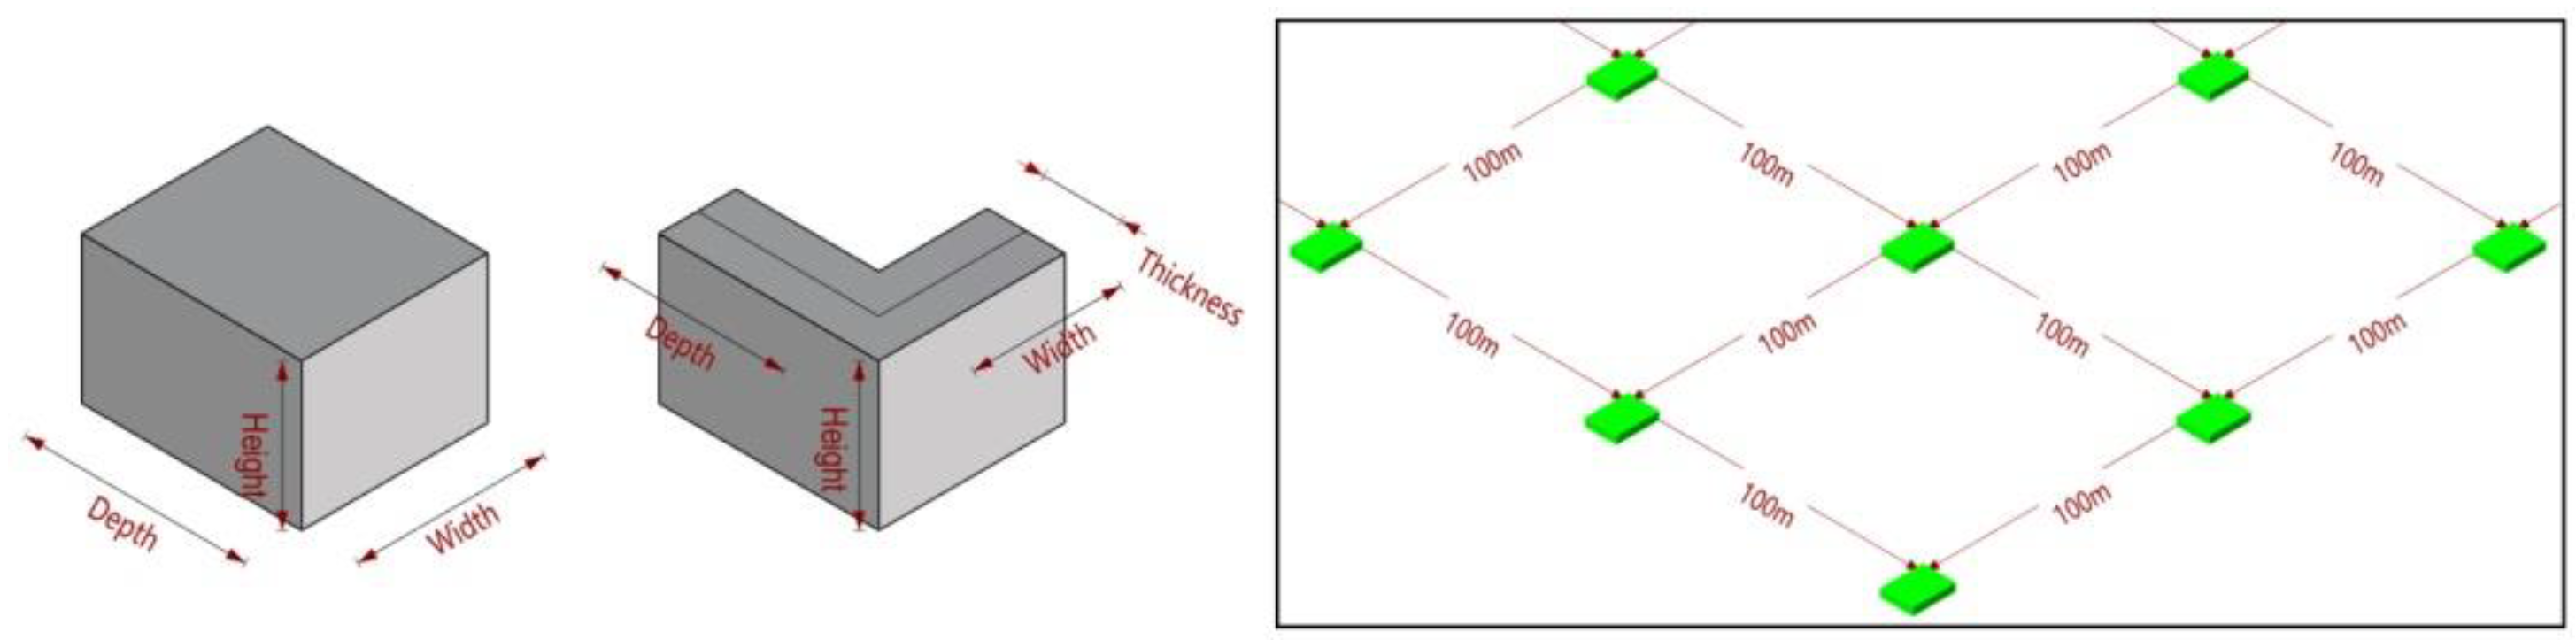
3.1. Building Form
3.1.1. Sample Generation
3.1.2. Performance Simulation
3.2. Thermal Performance of the Envelope
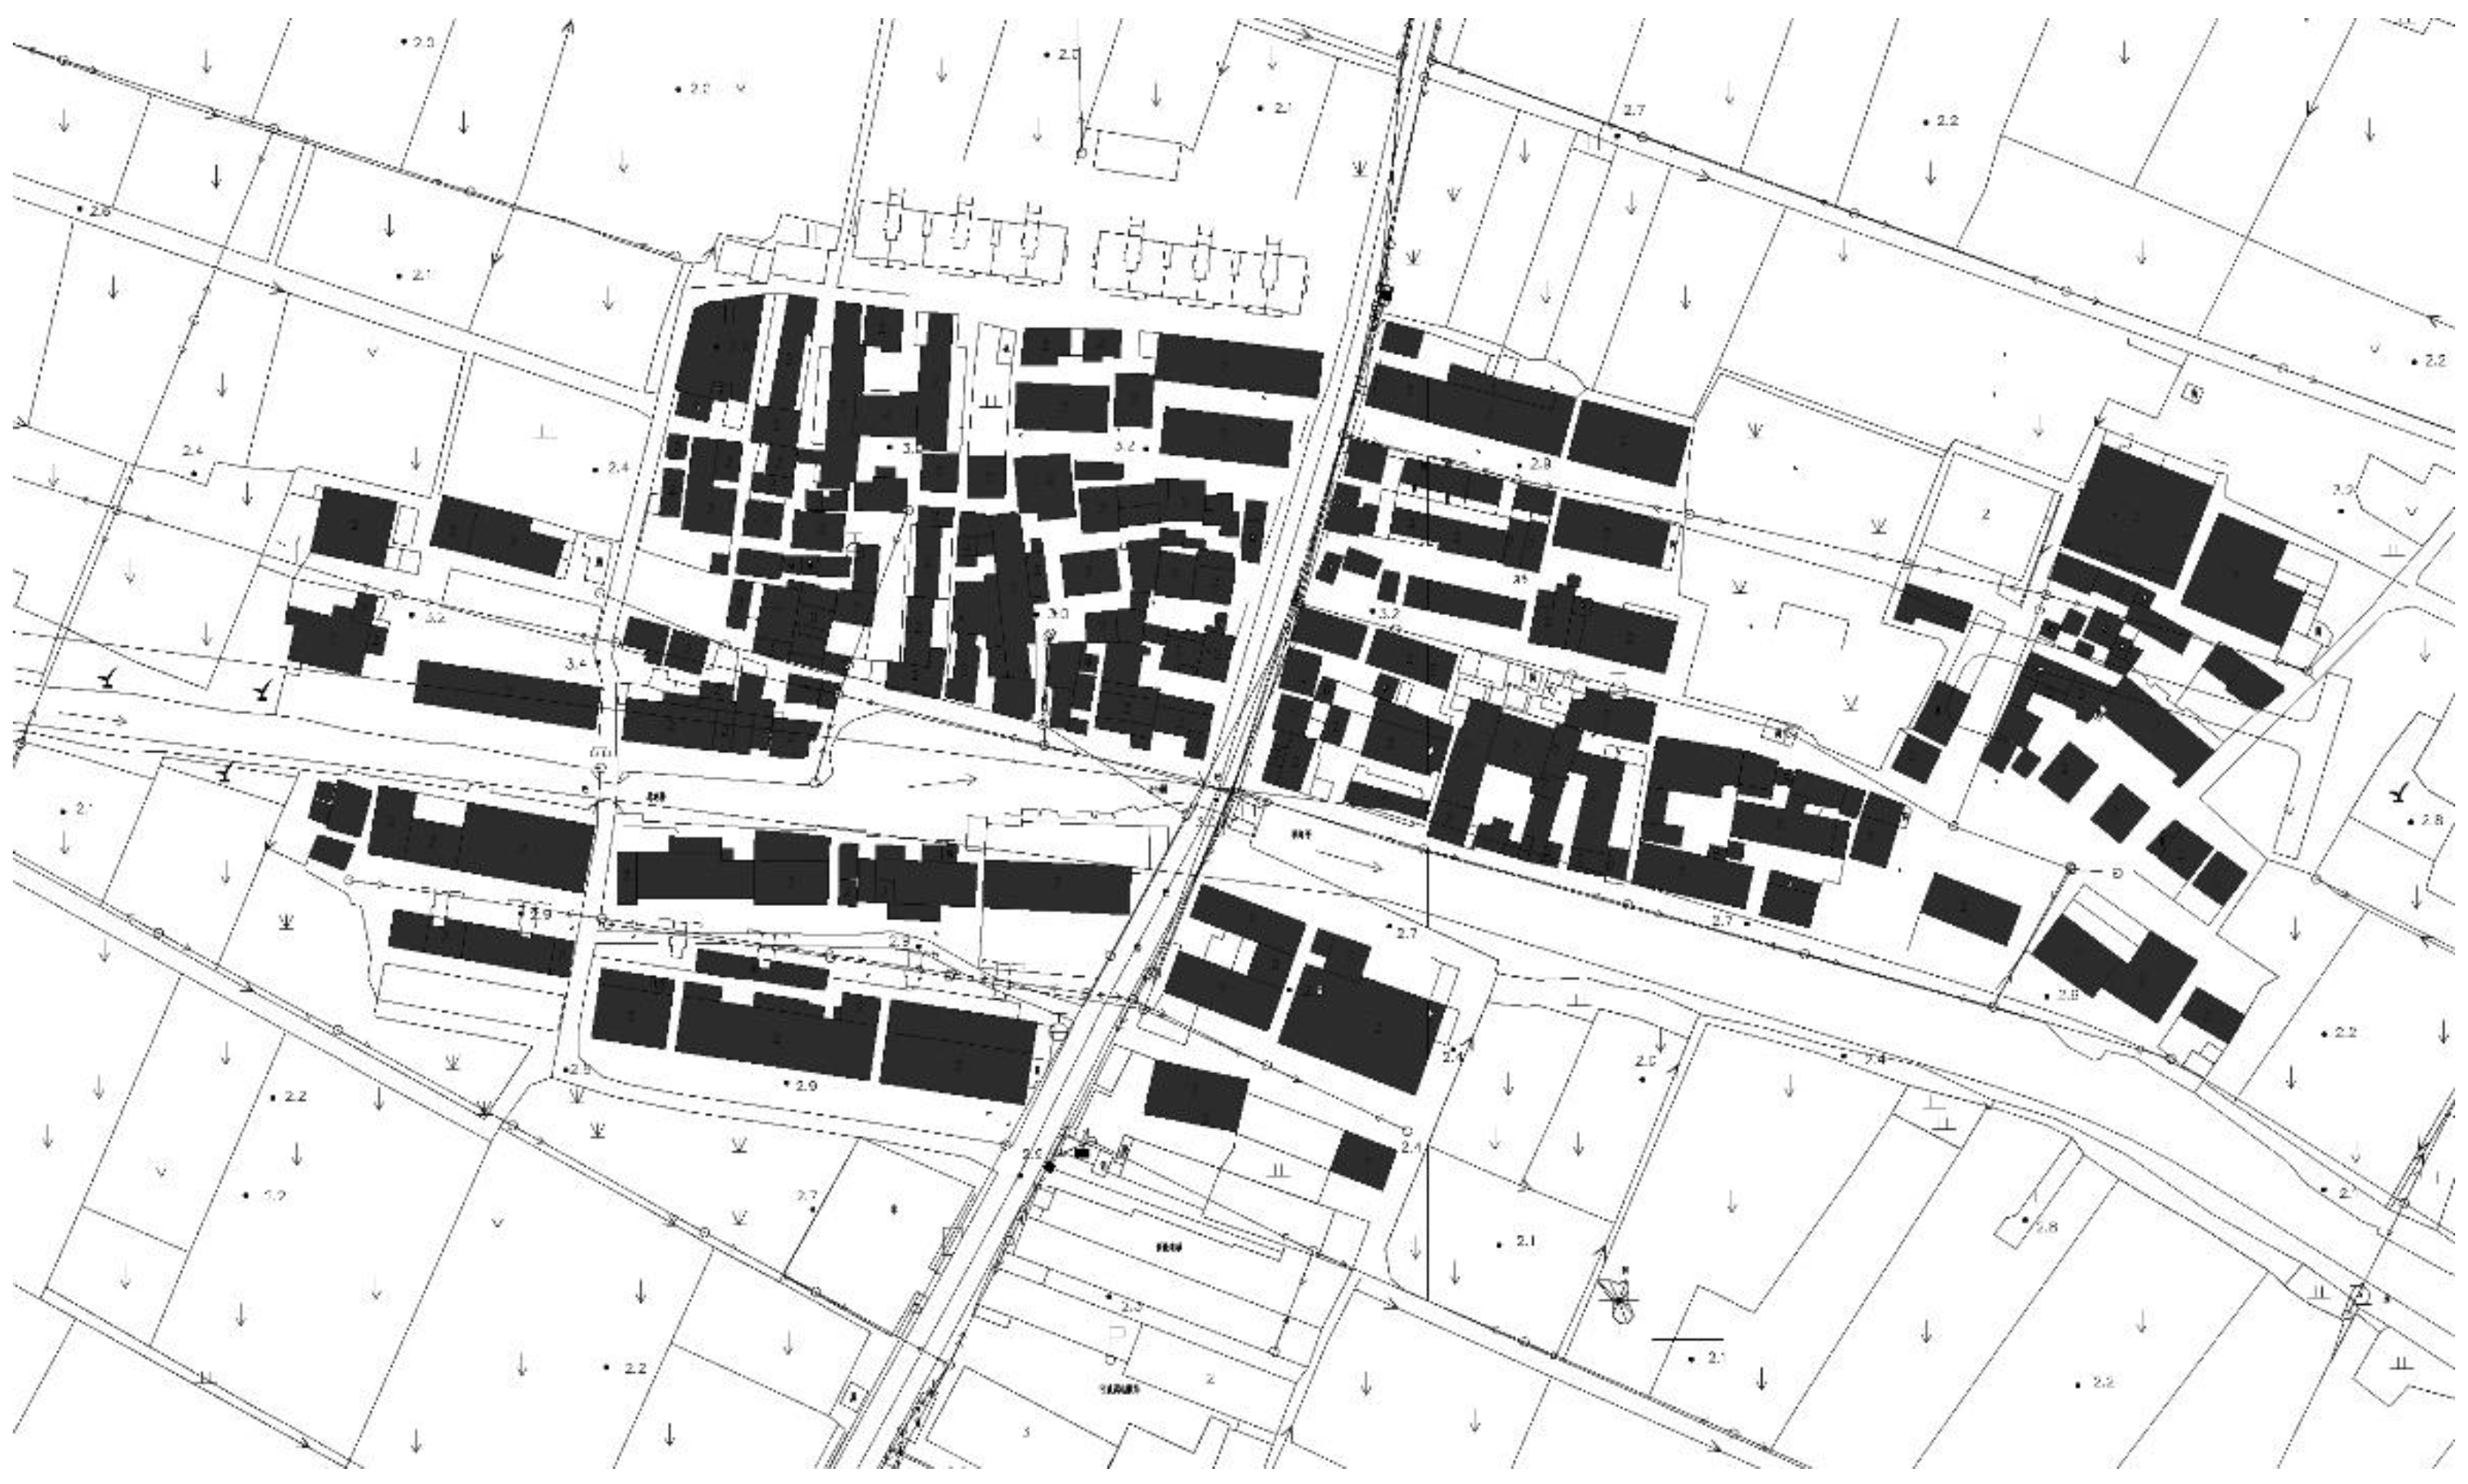
3.2.1. Survey
3.2.2. Performance Simulation
4. Results
4.1. Building Form
4.2. Thermal Performance of the Envelope
5. Discussion
5.1. Building Form
- (1)
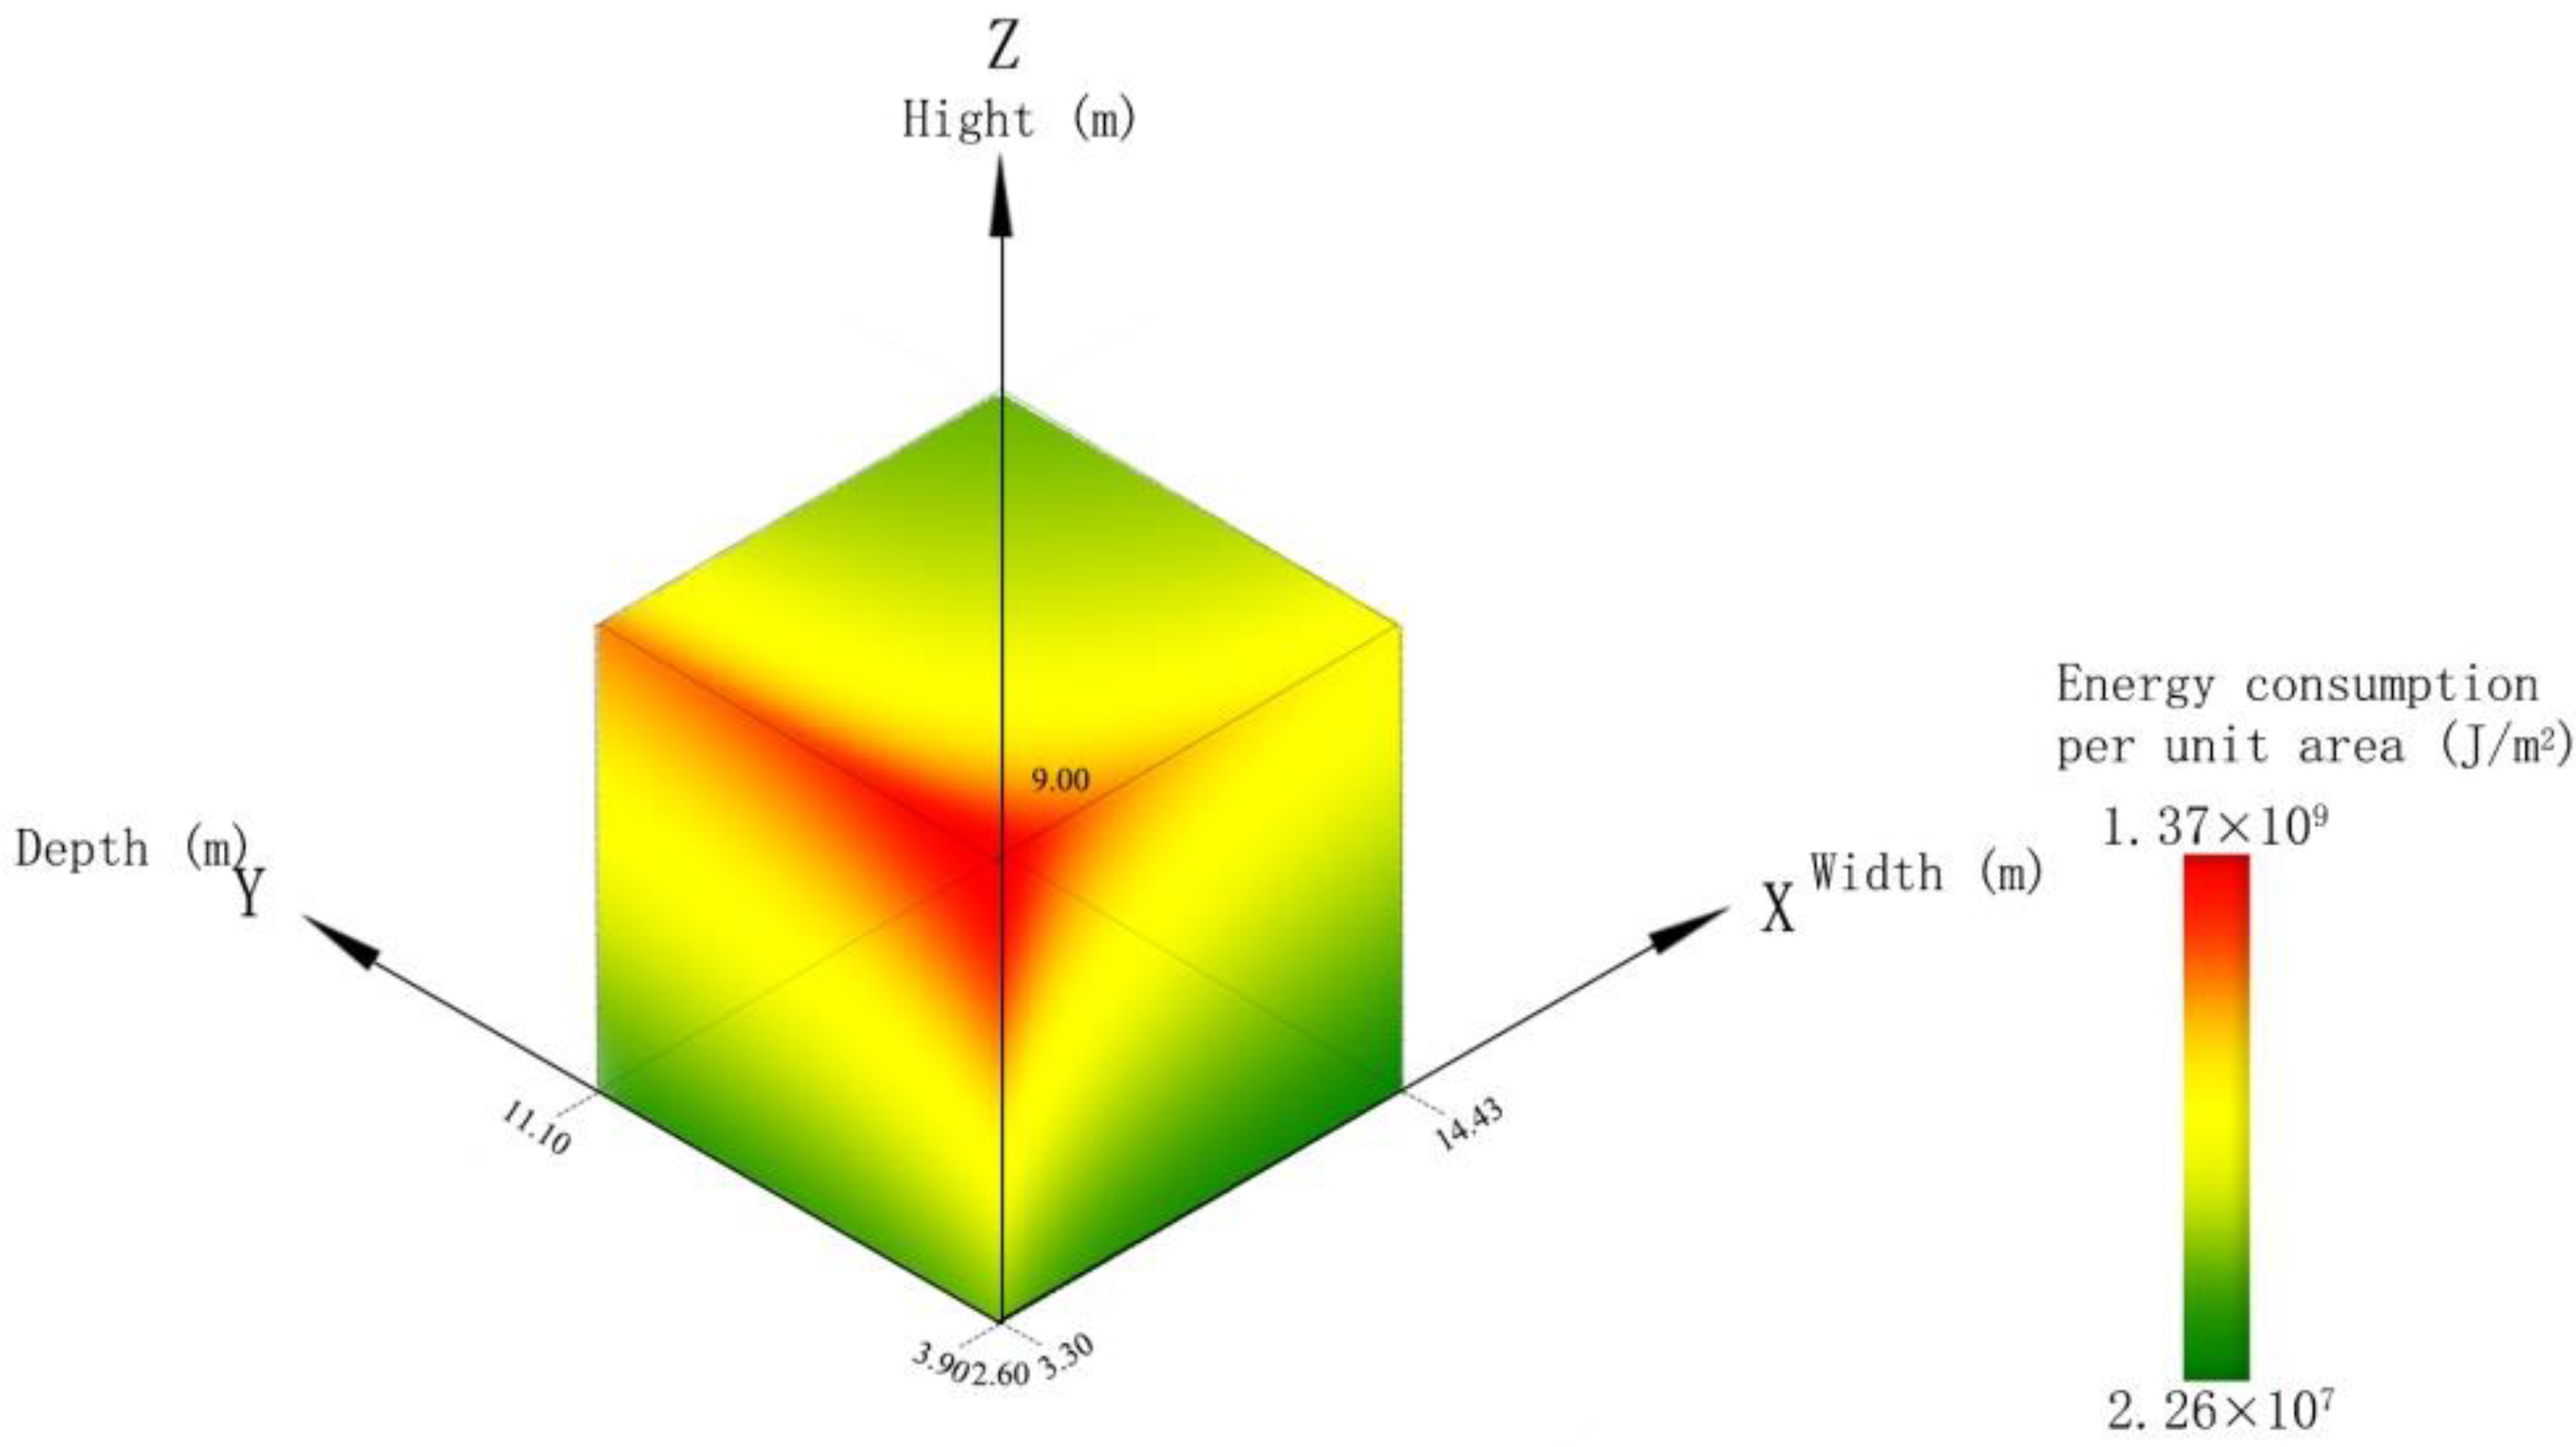
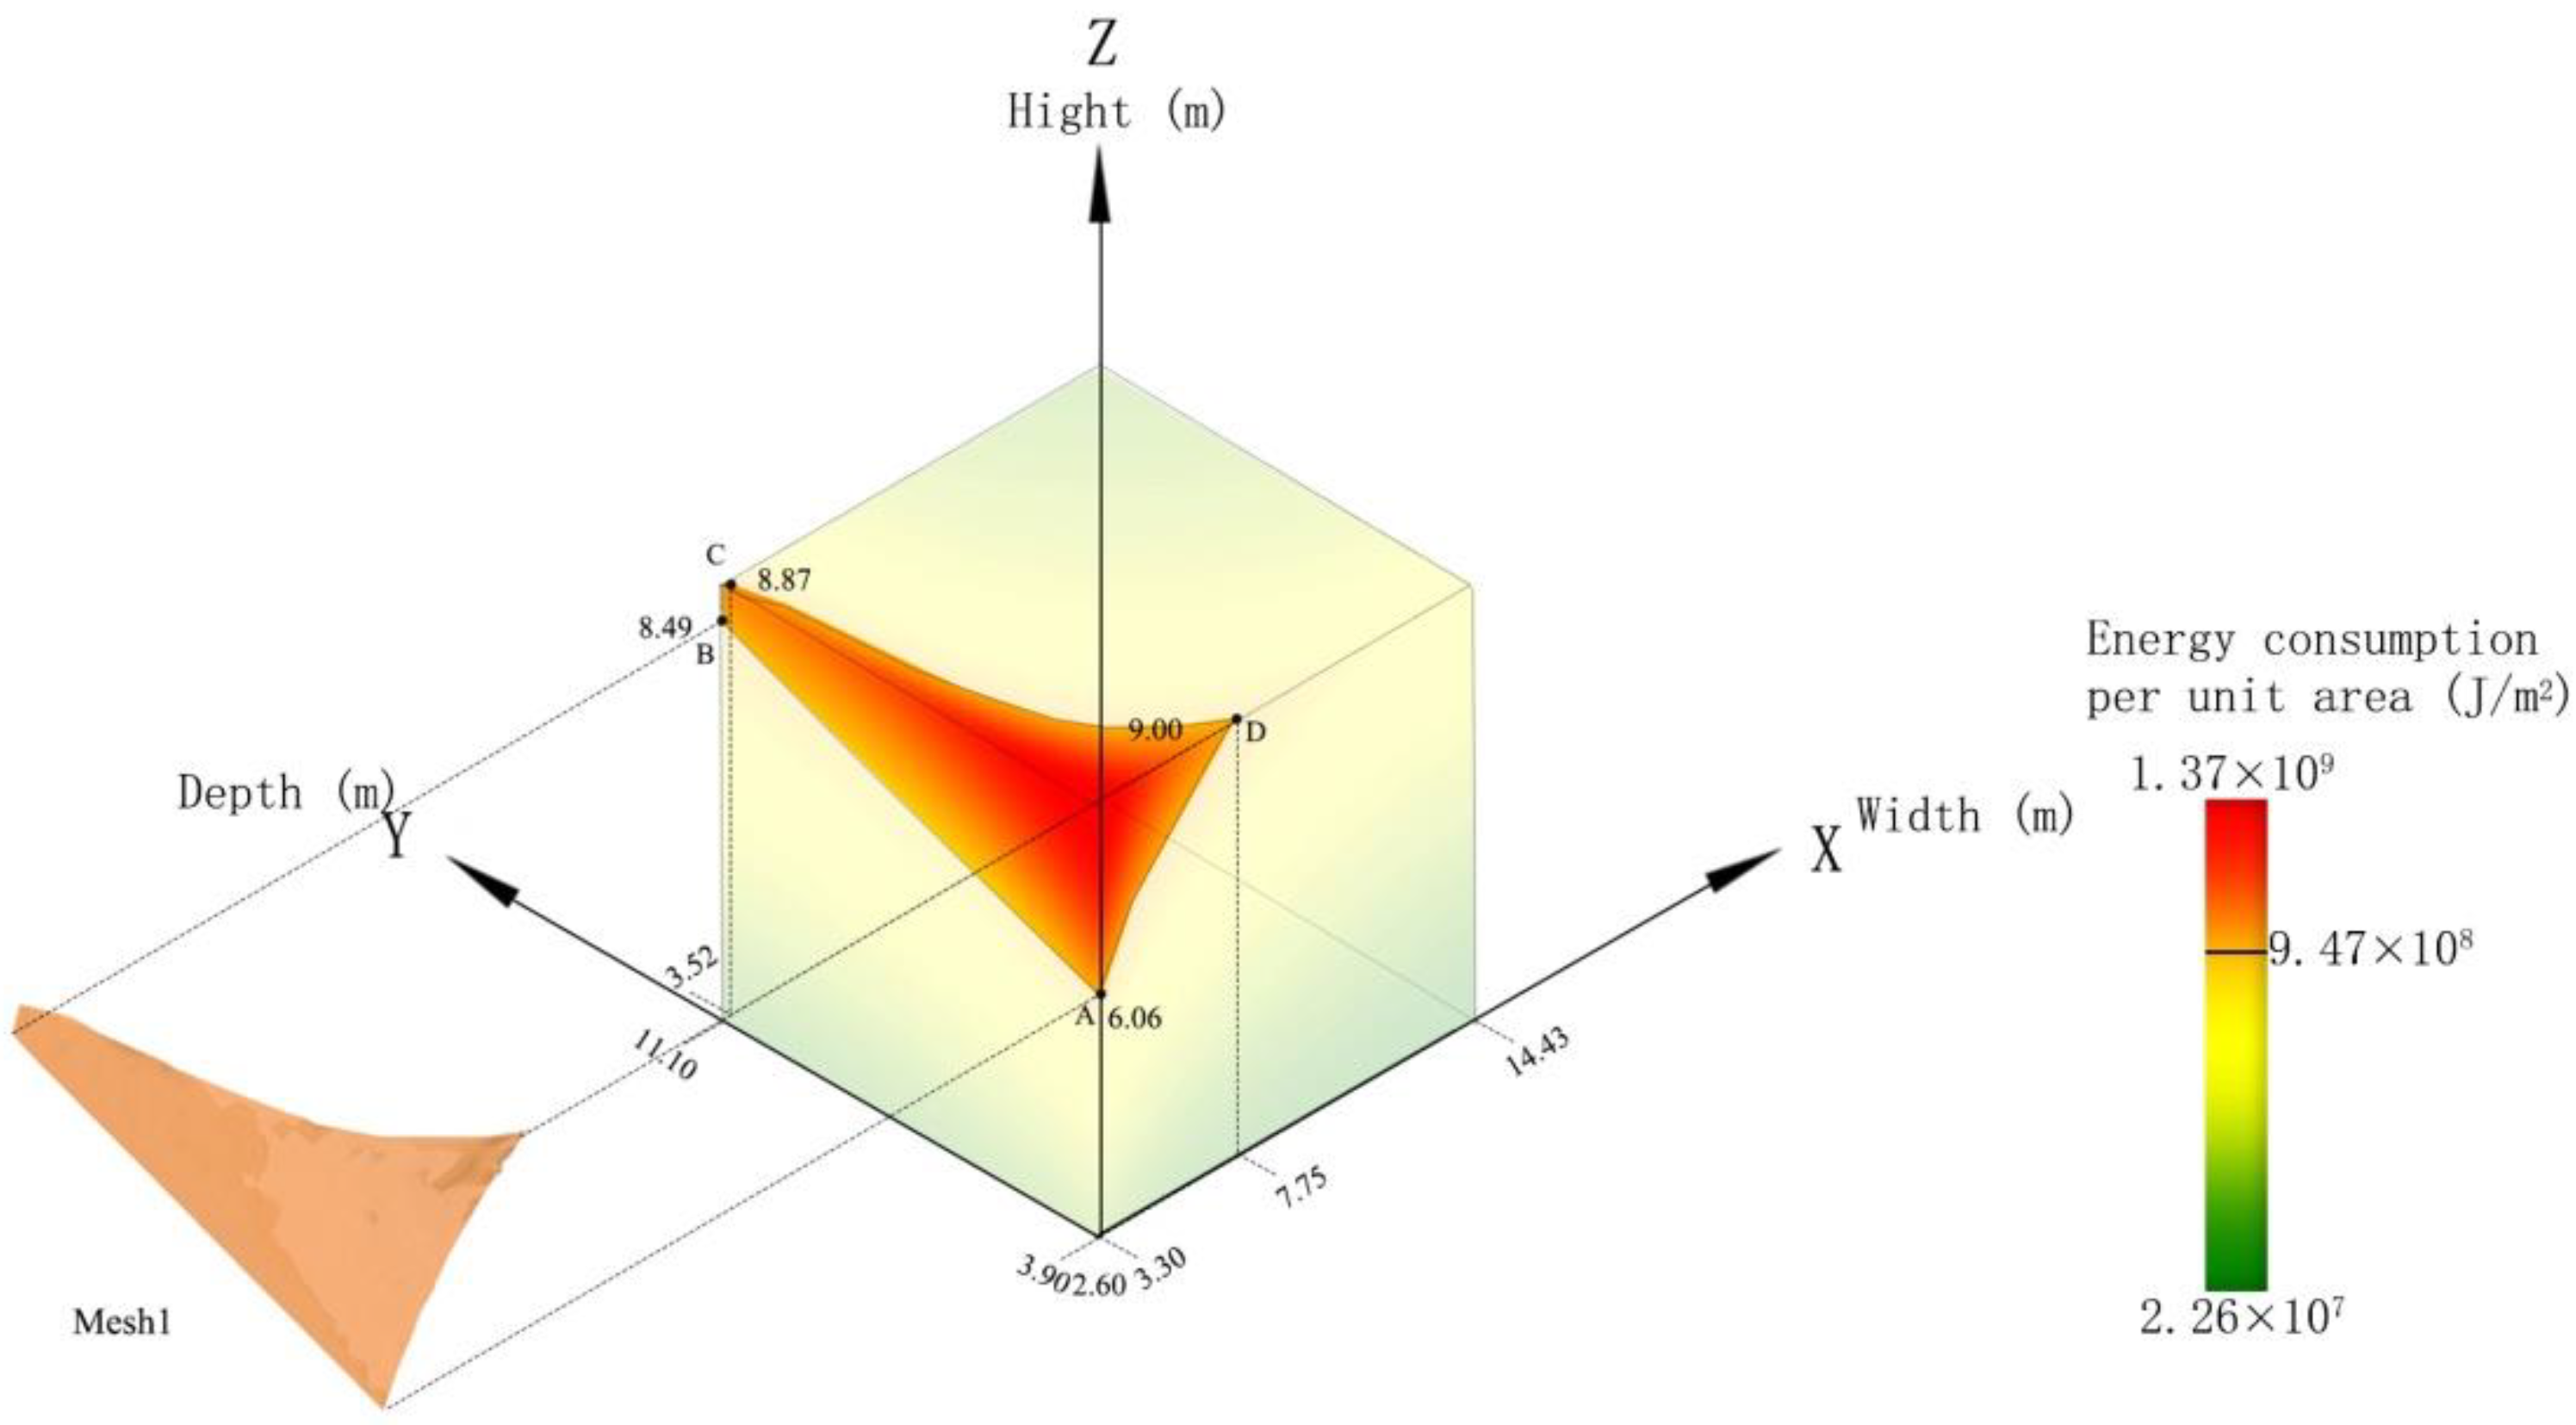
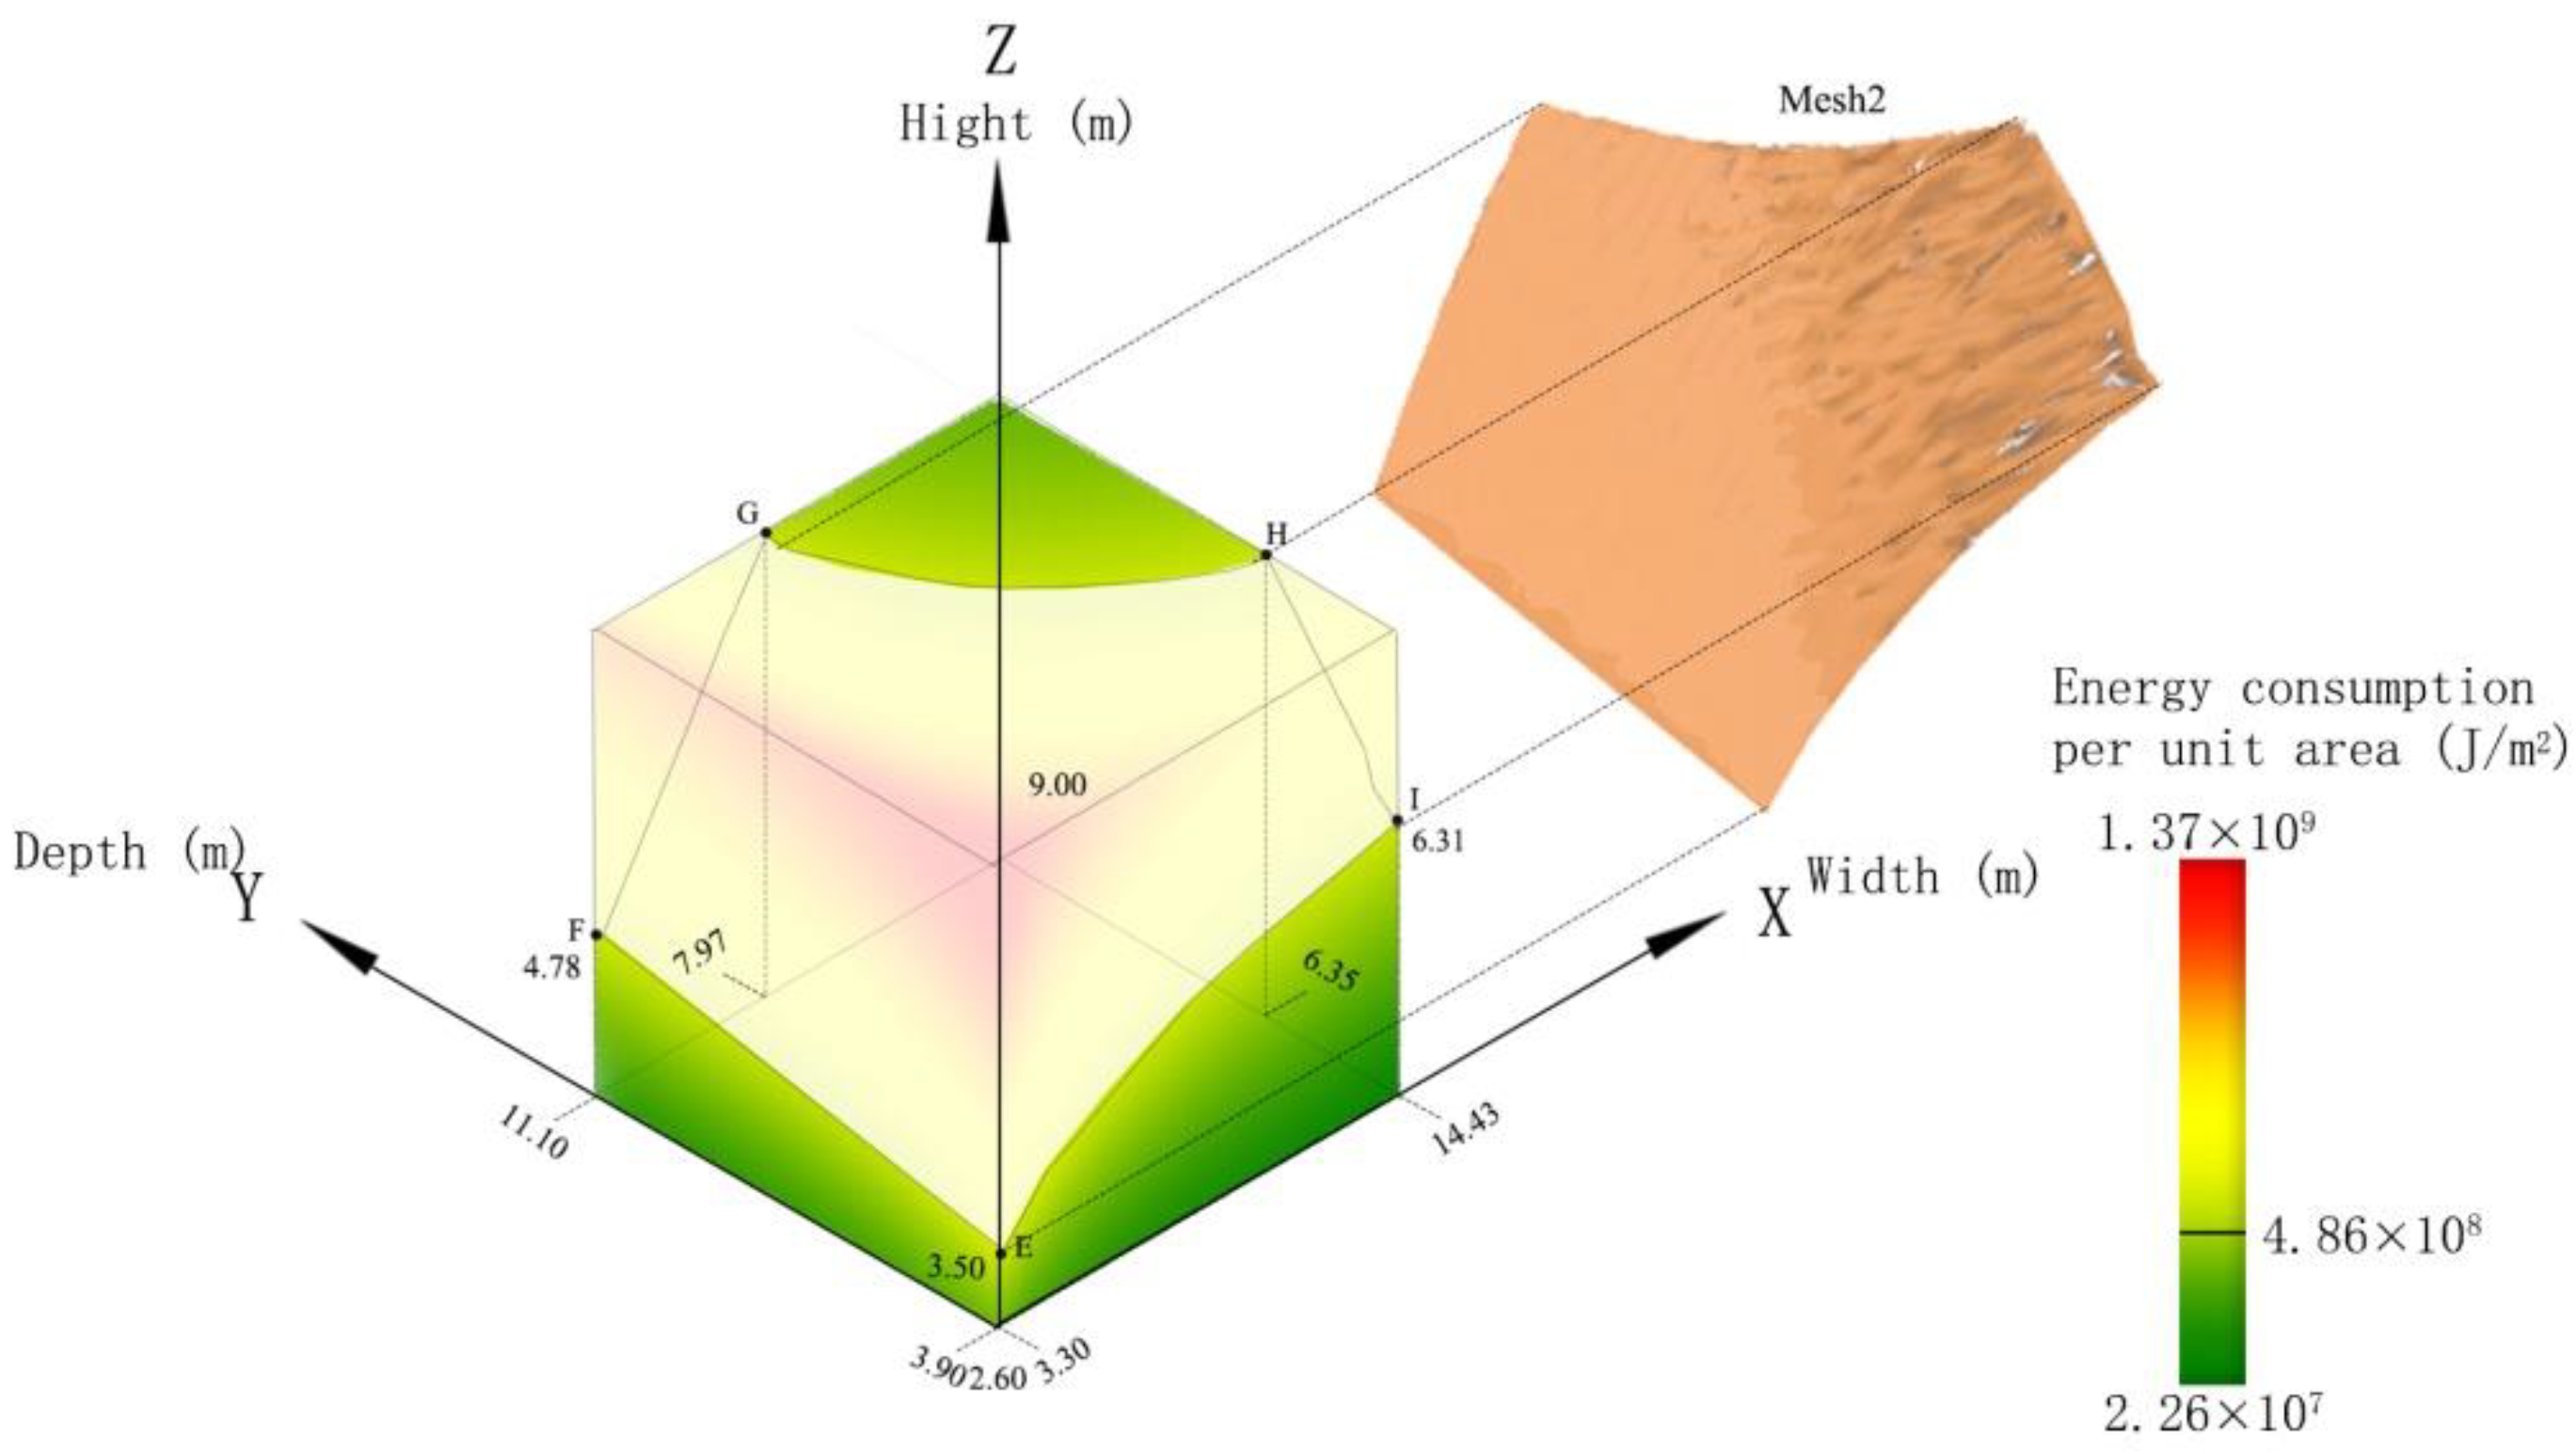
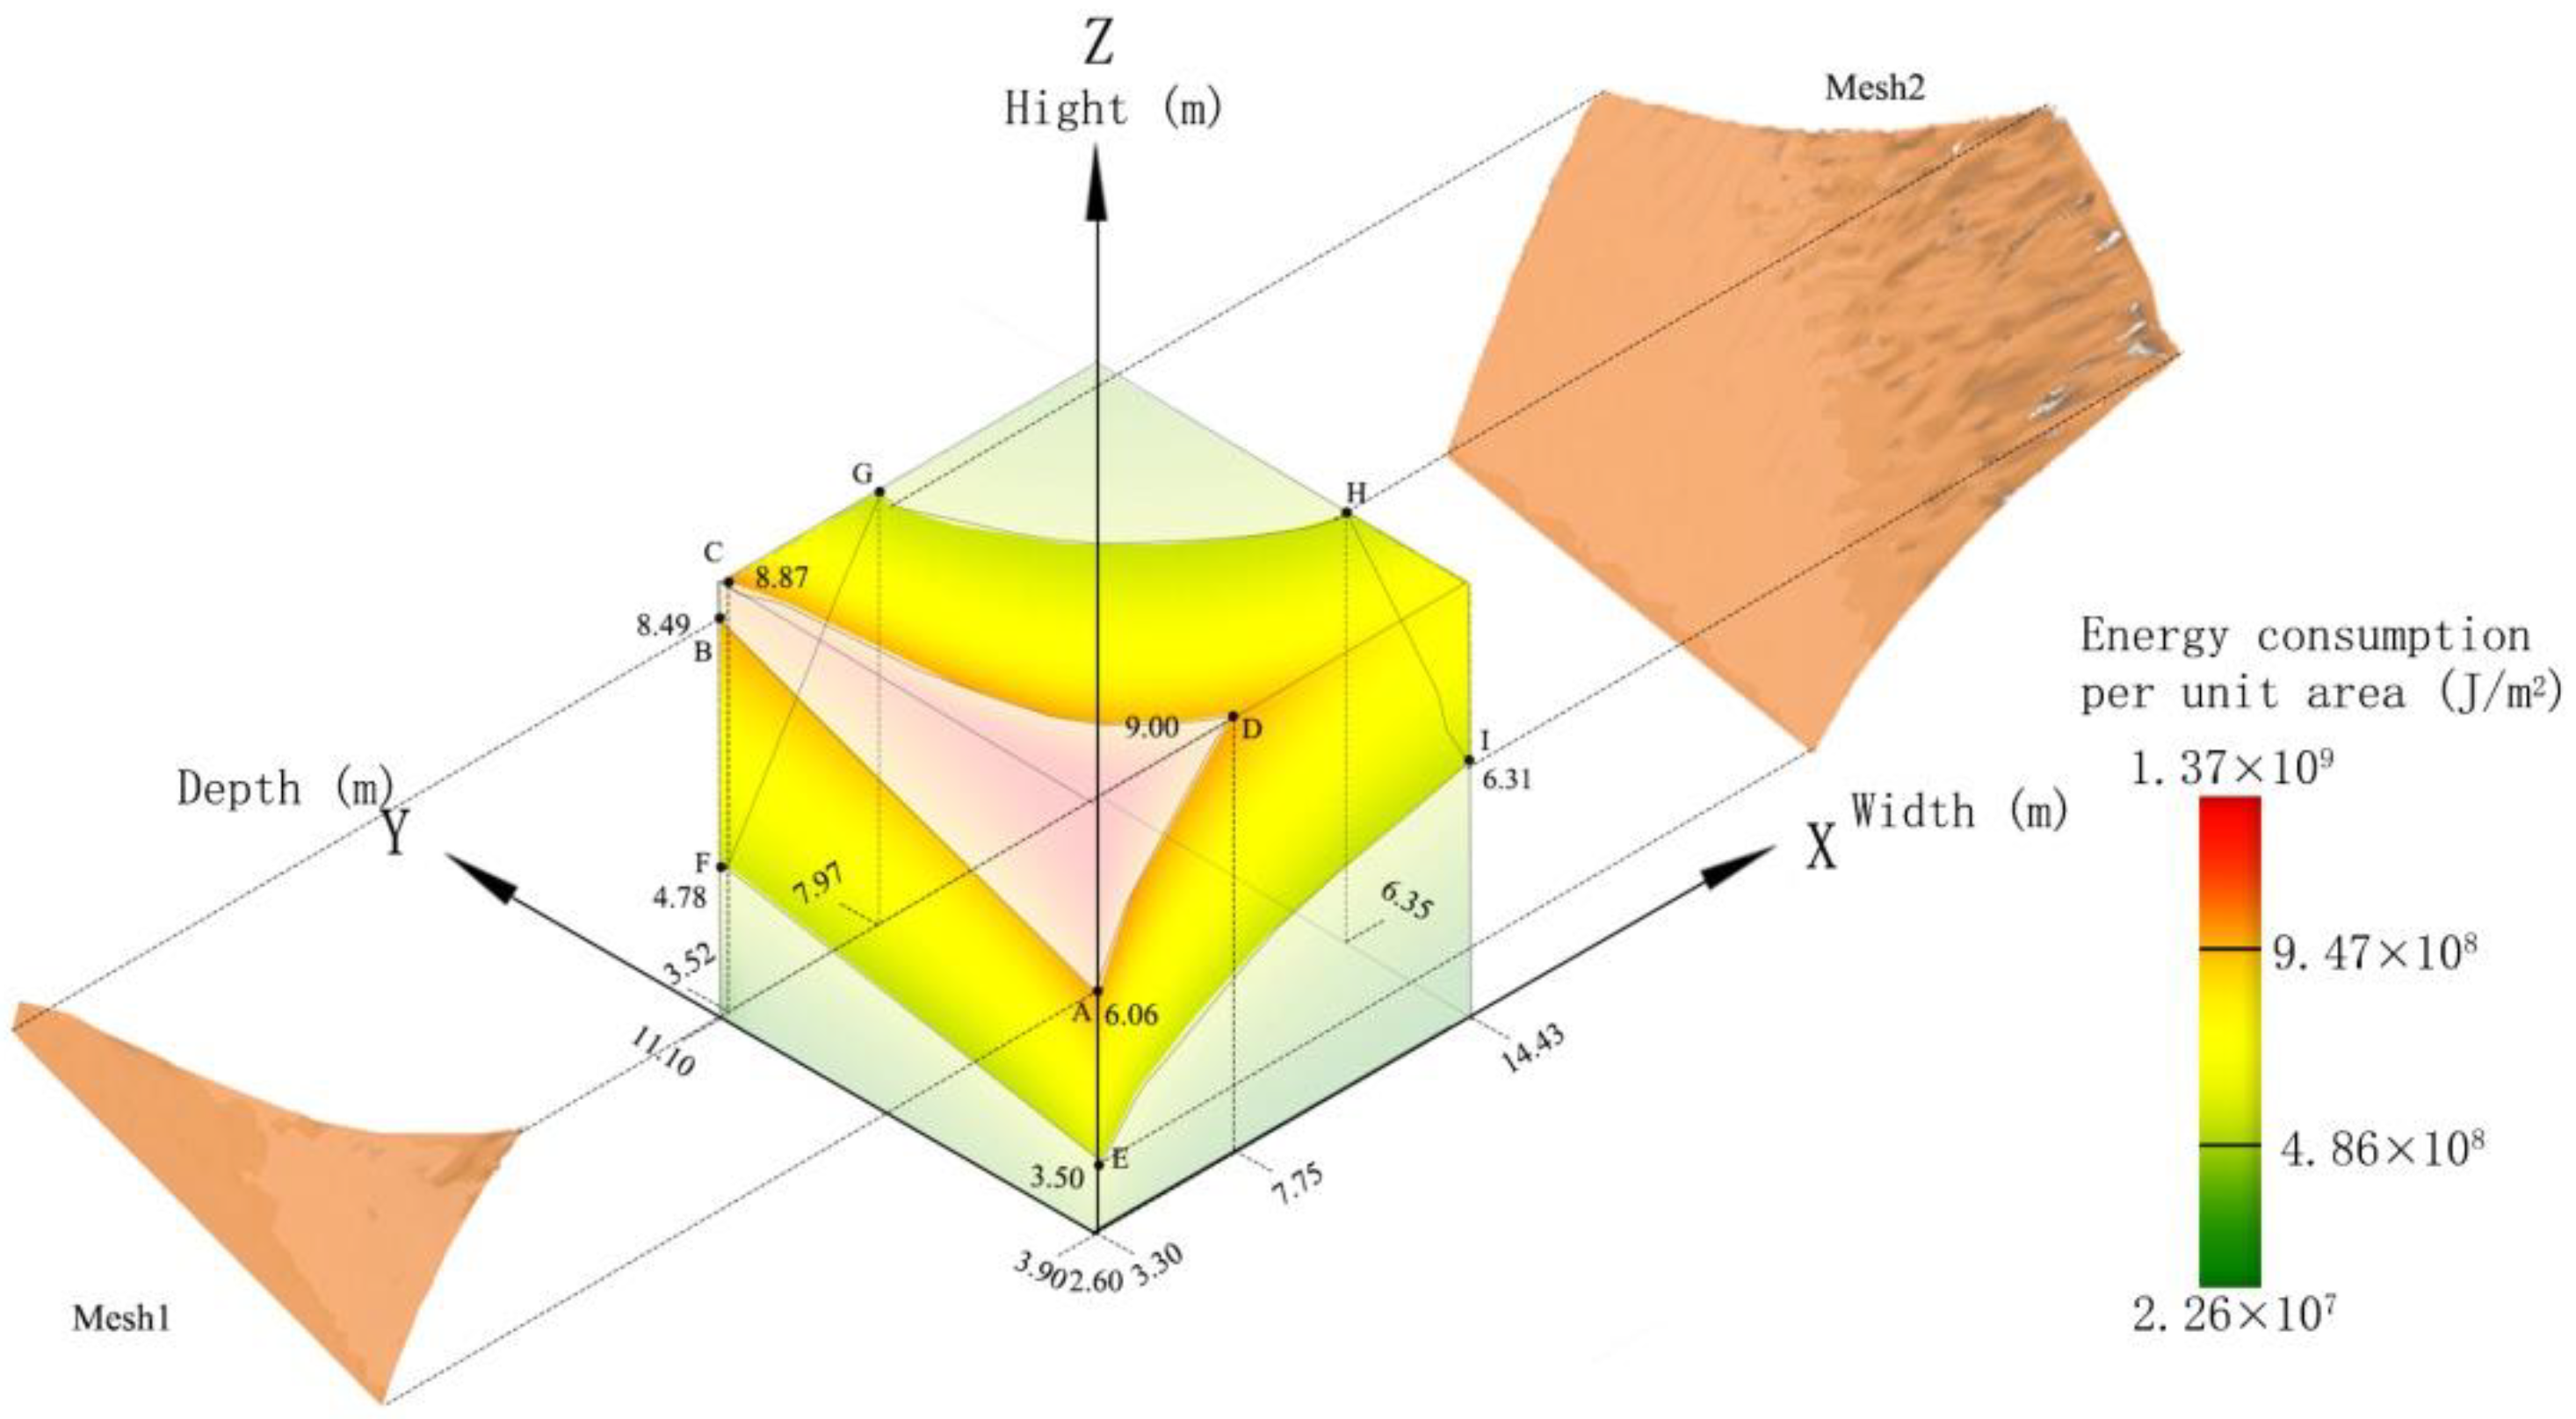
- For rectangular buildings, the larger the building area is, the lower the building energy consumption per unit area will be within the limited building size (width: 3.30 m to 14.43 m, depth: 3.90 m to 11.10 m, height: 2.60 m to 9.00 m);
- (2)
- When the width of the rectangular is higher than 7.97 m (X coordinate of point G) and the depth is higher than 6.35 m (Y coordinate of point H), the energy consumption per unit area is the lowest. At this point, increasing width and depth has almost no impact on the energy consumption; and
- (3)
- Energy consumption increases with the increase of rectangular building height. The influence of building height on energy consumption decreases with the increase of building width and depth. Therefore, on the premise of meeting the housing needs, reducing building height, and increasing building width and depth will lead to lower energy consumption.
- (1)
- Regardless of whether they are rectangular buildings or L-shaped buildings, the building height should be reduced, and the building width and depth should be increased as much as possible. It is recommended that the building width be higher than 5.54 m and the depth be higher than 4.75 m.
- (2)
- Based on this study, the suggested building heights and corresponding optimal width-to-depth ratios are summarized in Table A1 in Appendix A. Overall, the width-to-depth ratio ranges from 0.90 to 1.16. When the building height is between 2.6 m and 3 m, the width-to-depth ratio is higher than 1.09, and when the building height is higher than 5.2 m, the width-to-depth ratio is lower than 1.
- (3)
- For L-shape, the building thickness should be greater than 4.23 m.
- (4)
- The lower the building roof angle, the lower the energy consumption is, and the most energy-efficient flat roof. If a sloping roof shape design is required, the building roof angle should be as low as 29.98°.
5.2. Thermal Performance of the Envelope
- (1)
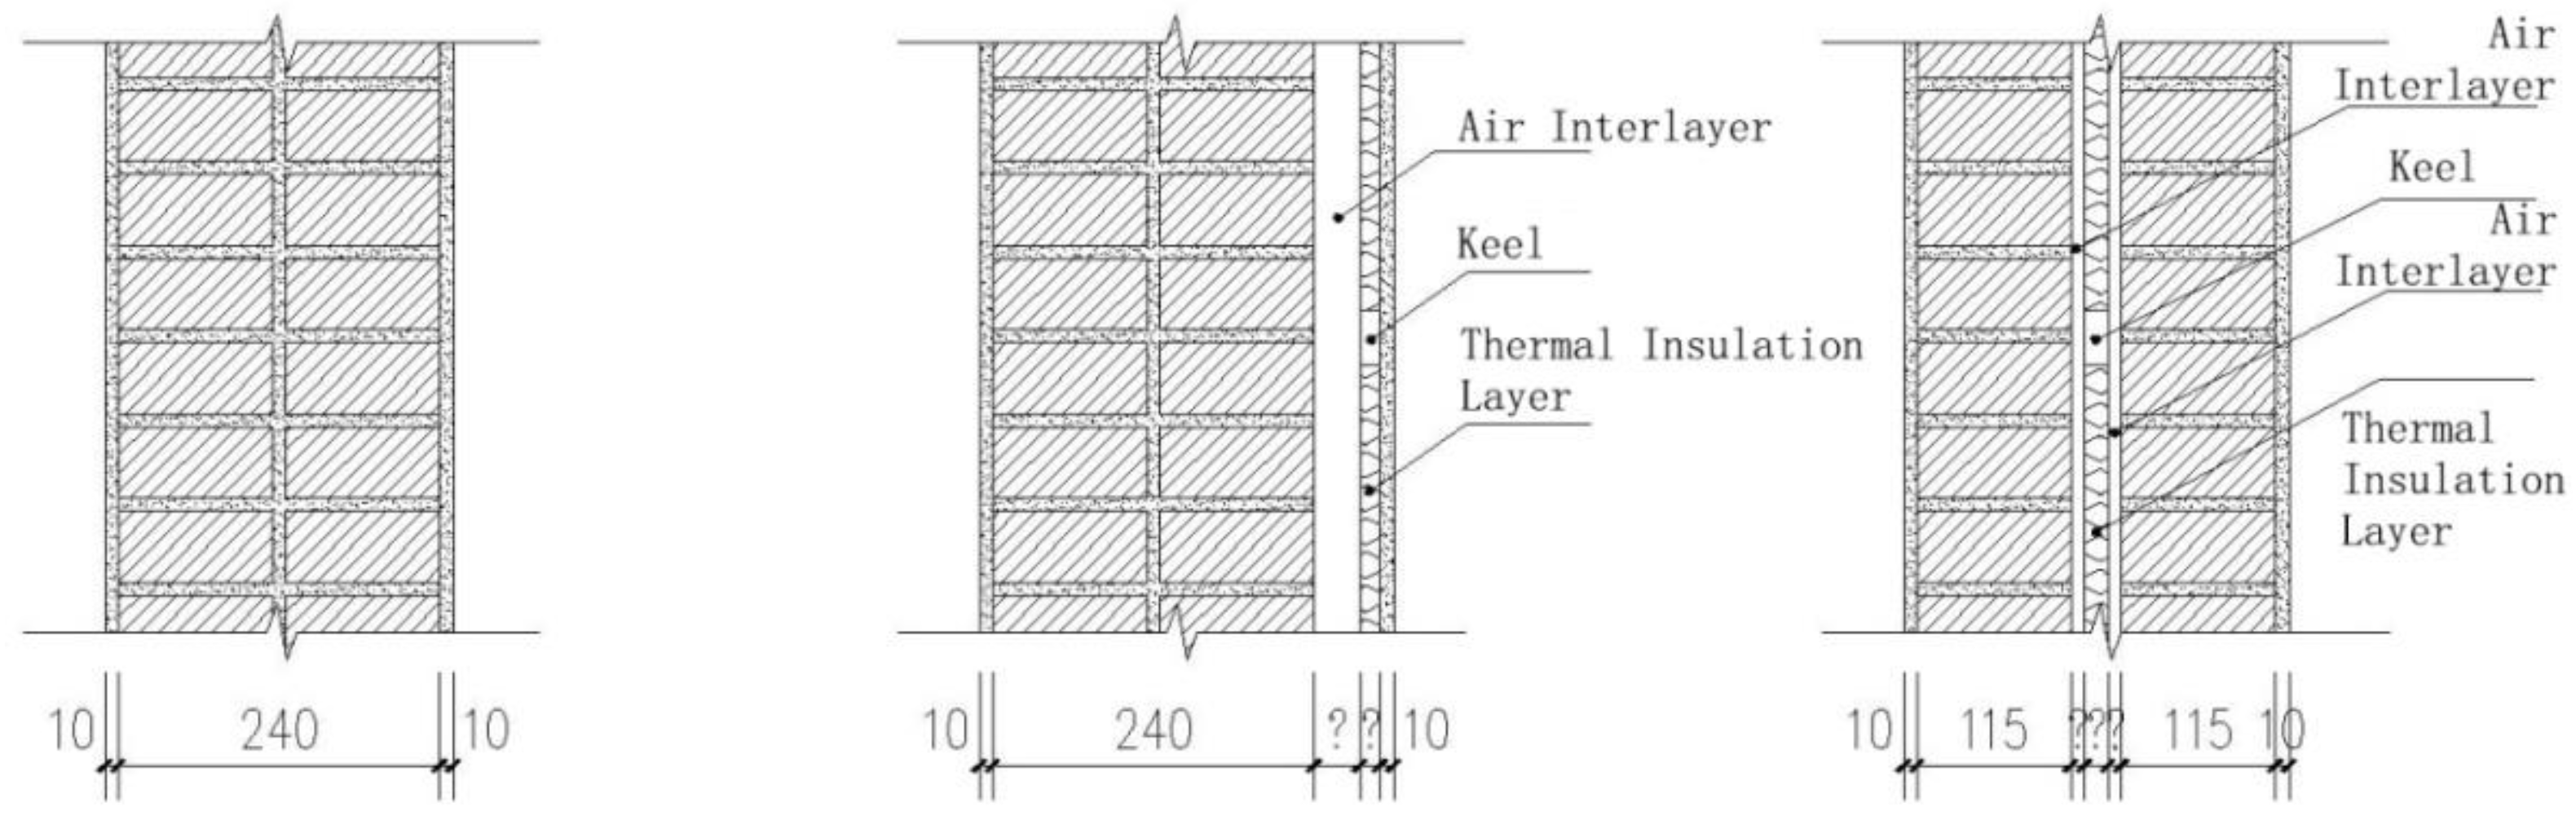
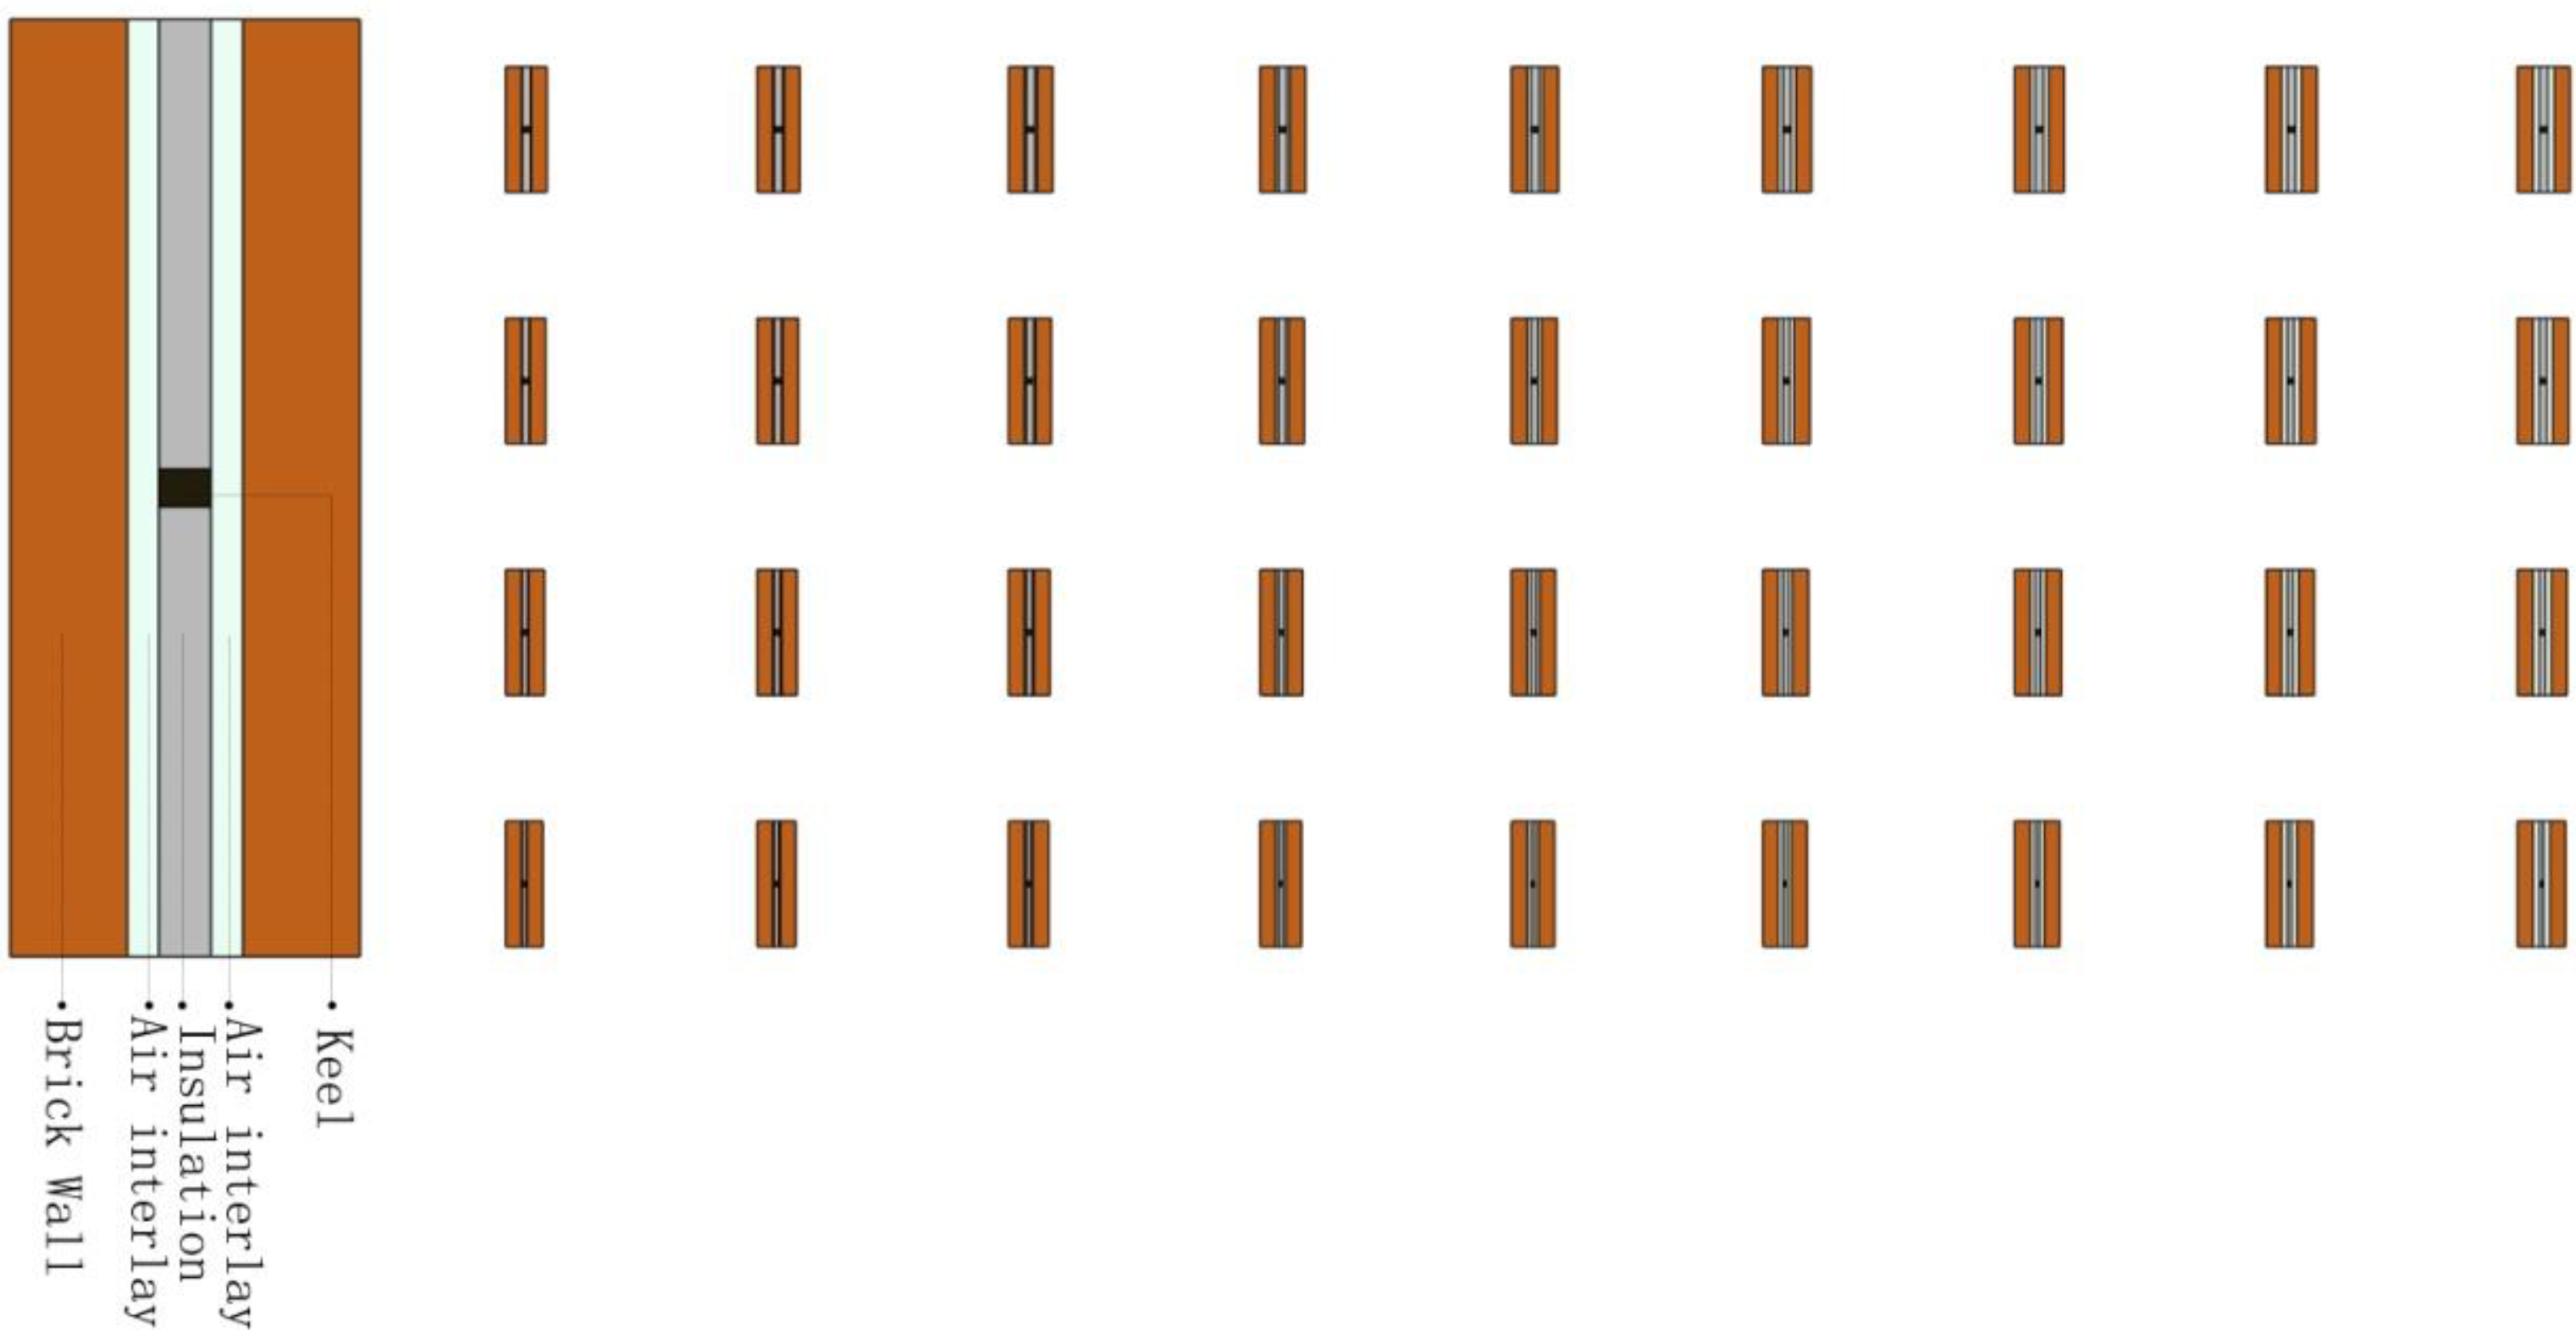
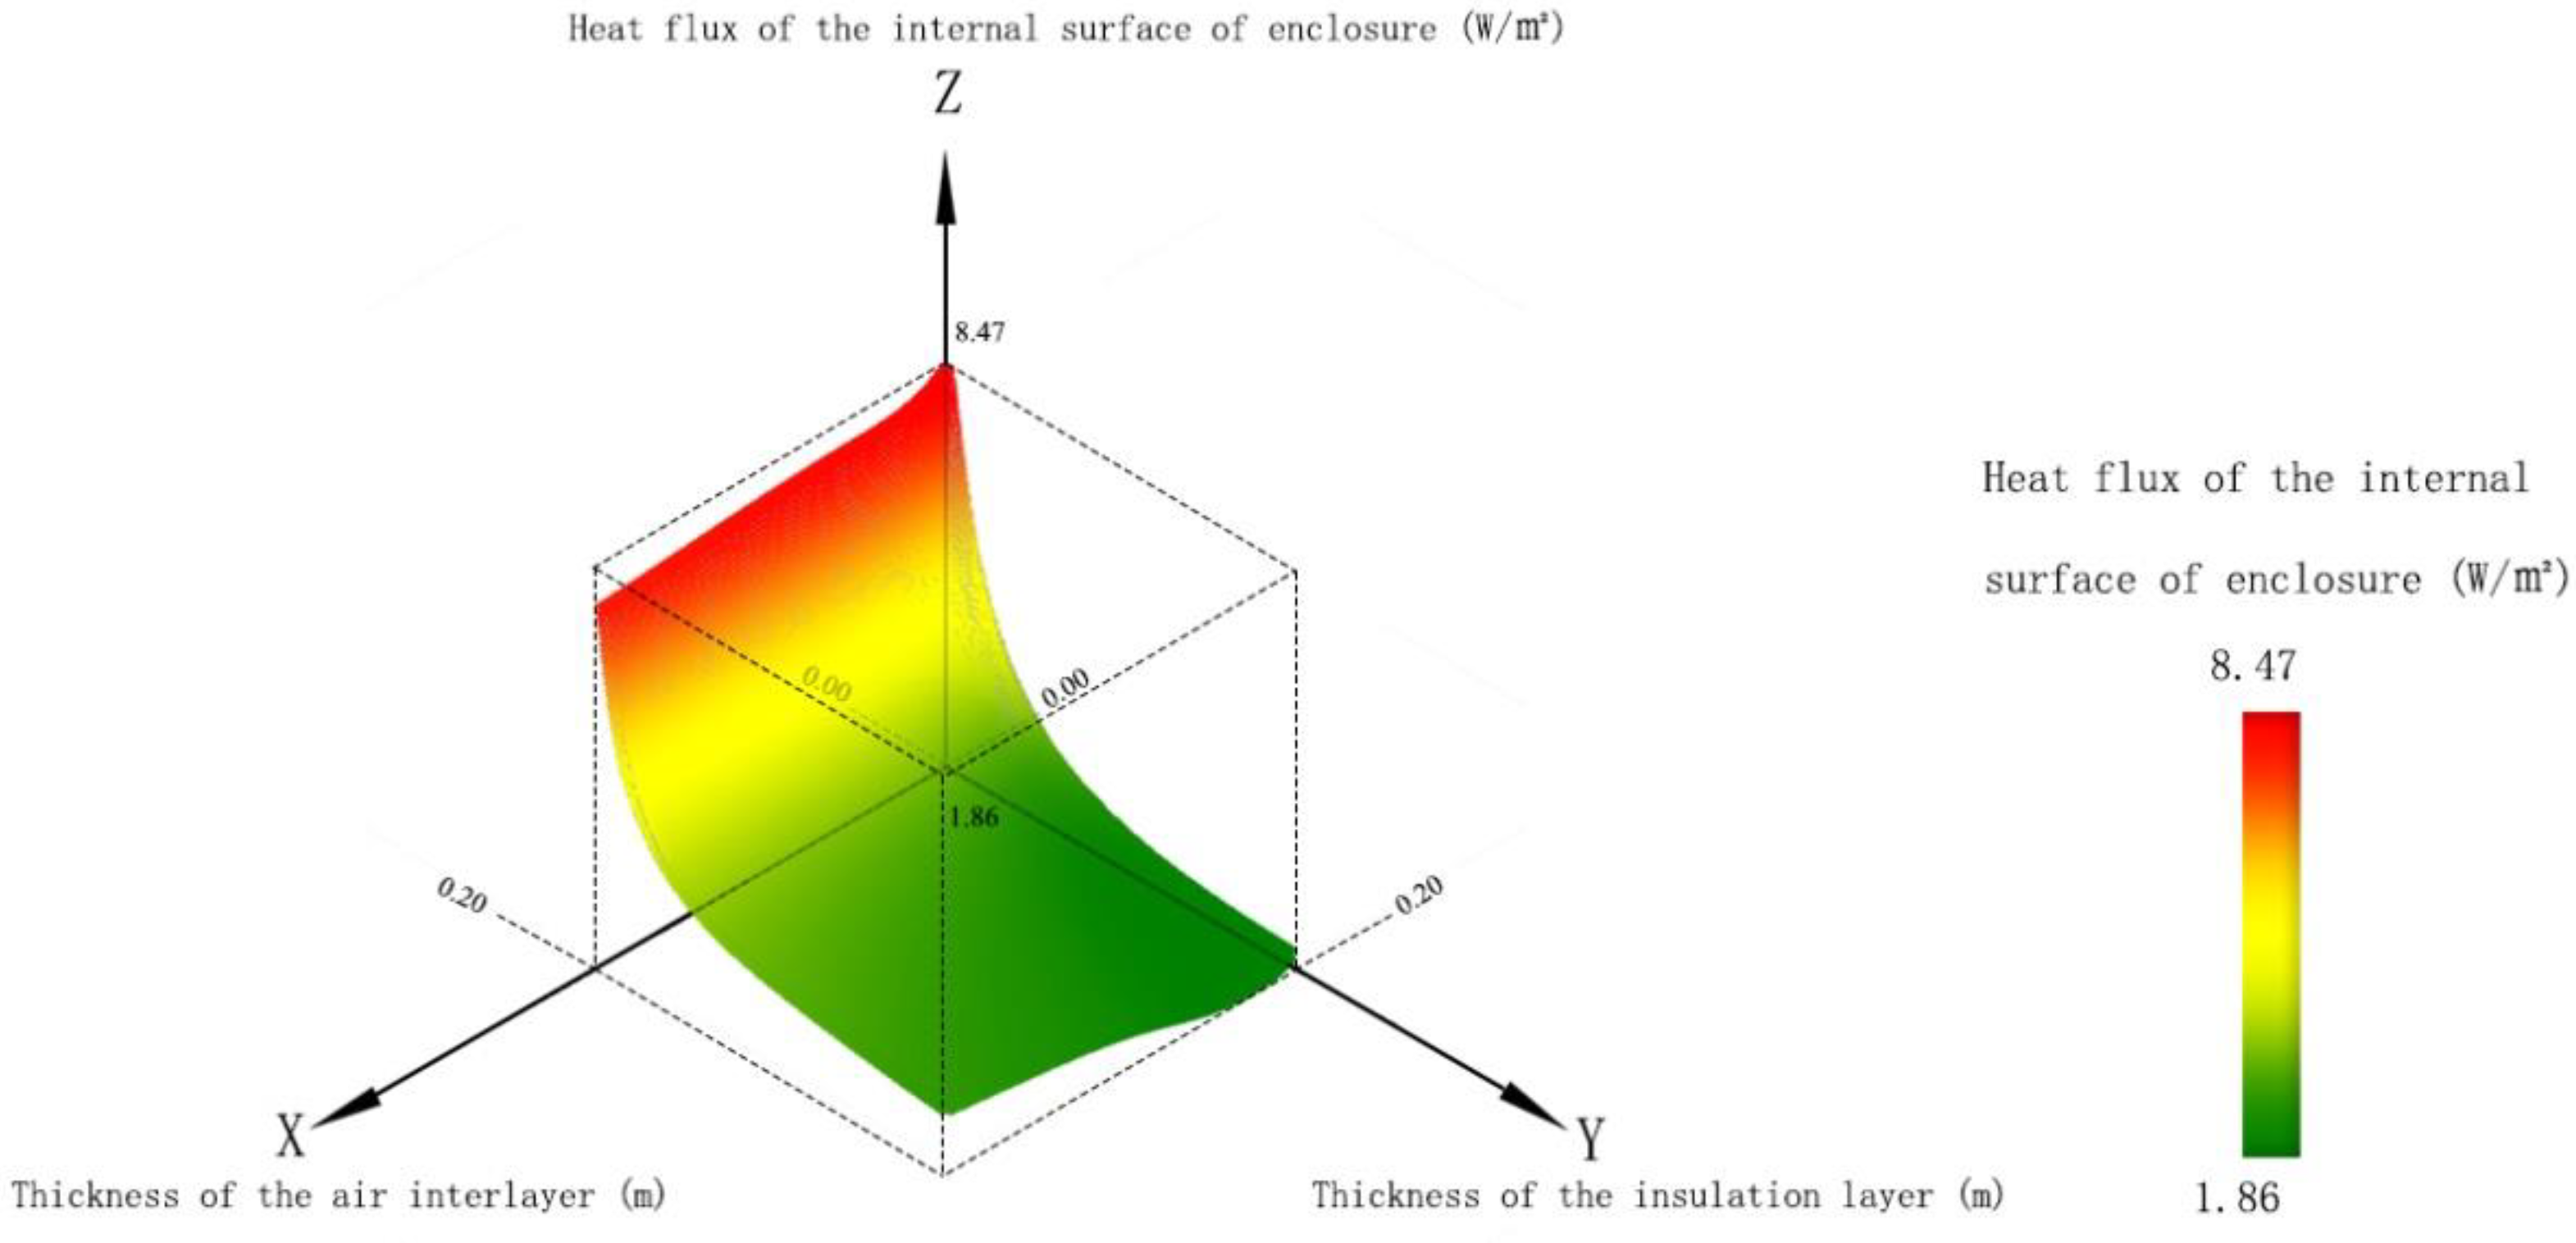
- The increase in the thickness of the air interlayer and the thermal insulation layer can improve the wall’s thermal insulation performance in the summer and winter seasons. Furthermore, the thickness changes in the thermal insulation in summer are similar to that in winter. With the increase of the thickness of the air interlayer and the thermal insulation layer, the thermal insulation effect has shown a trend of first improvement and then stabilization.
- (2)
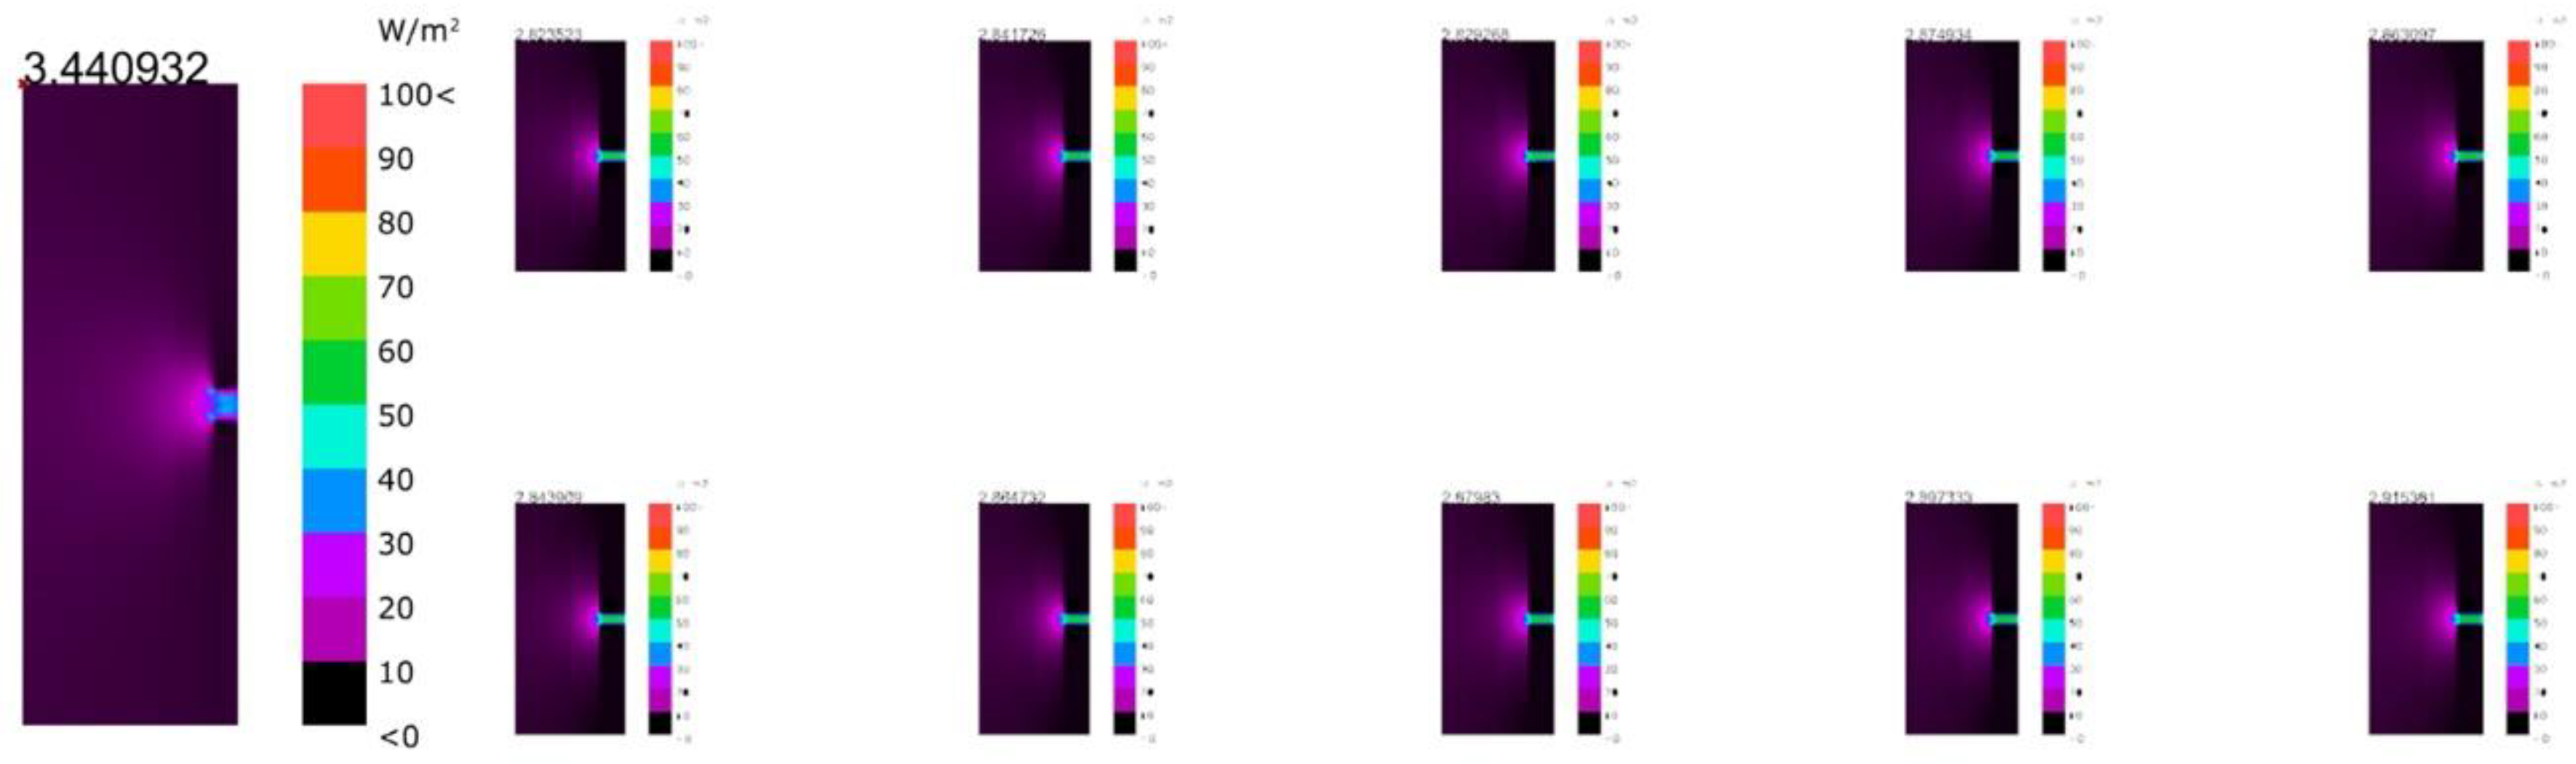
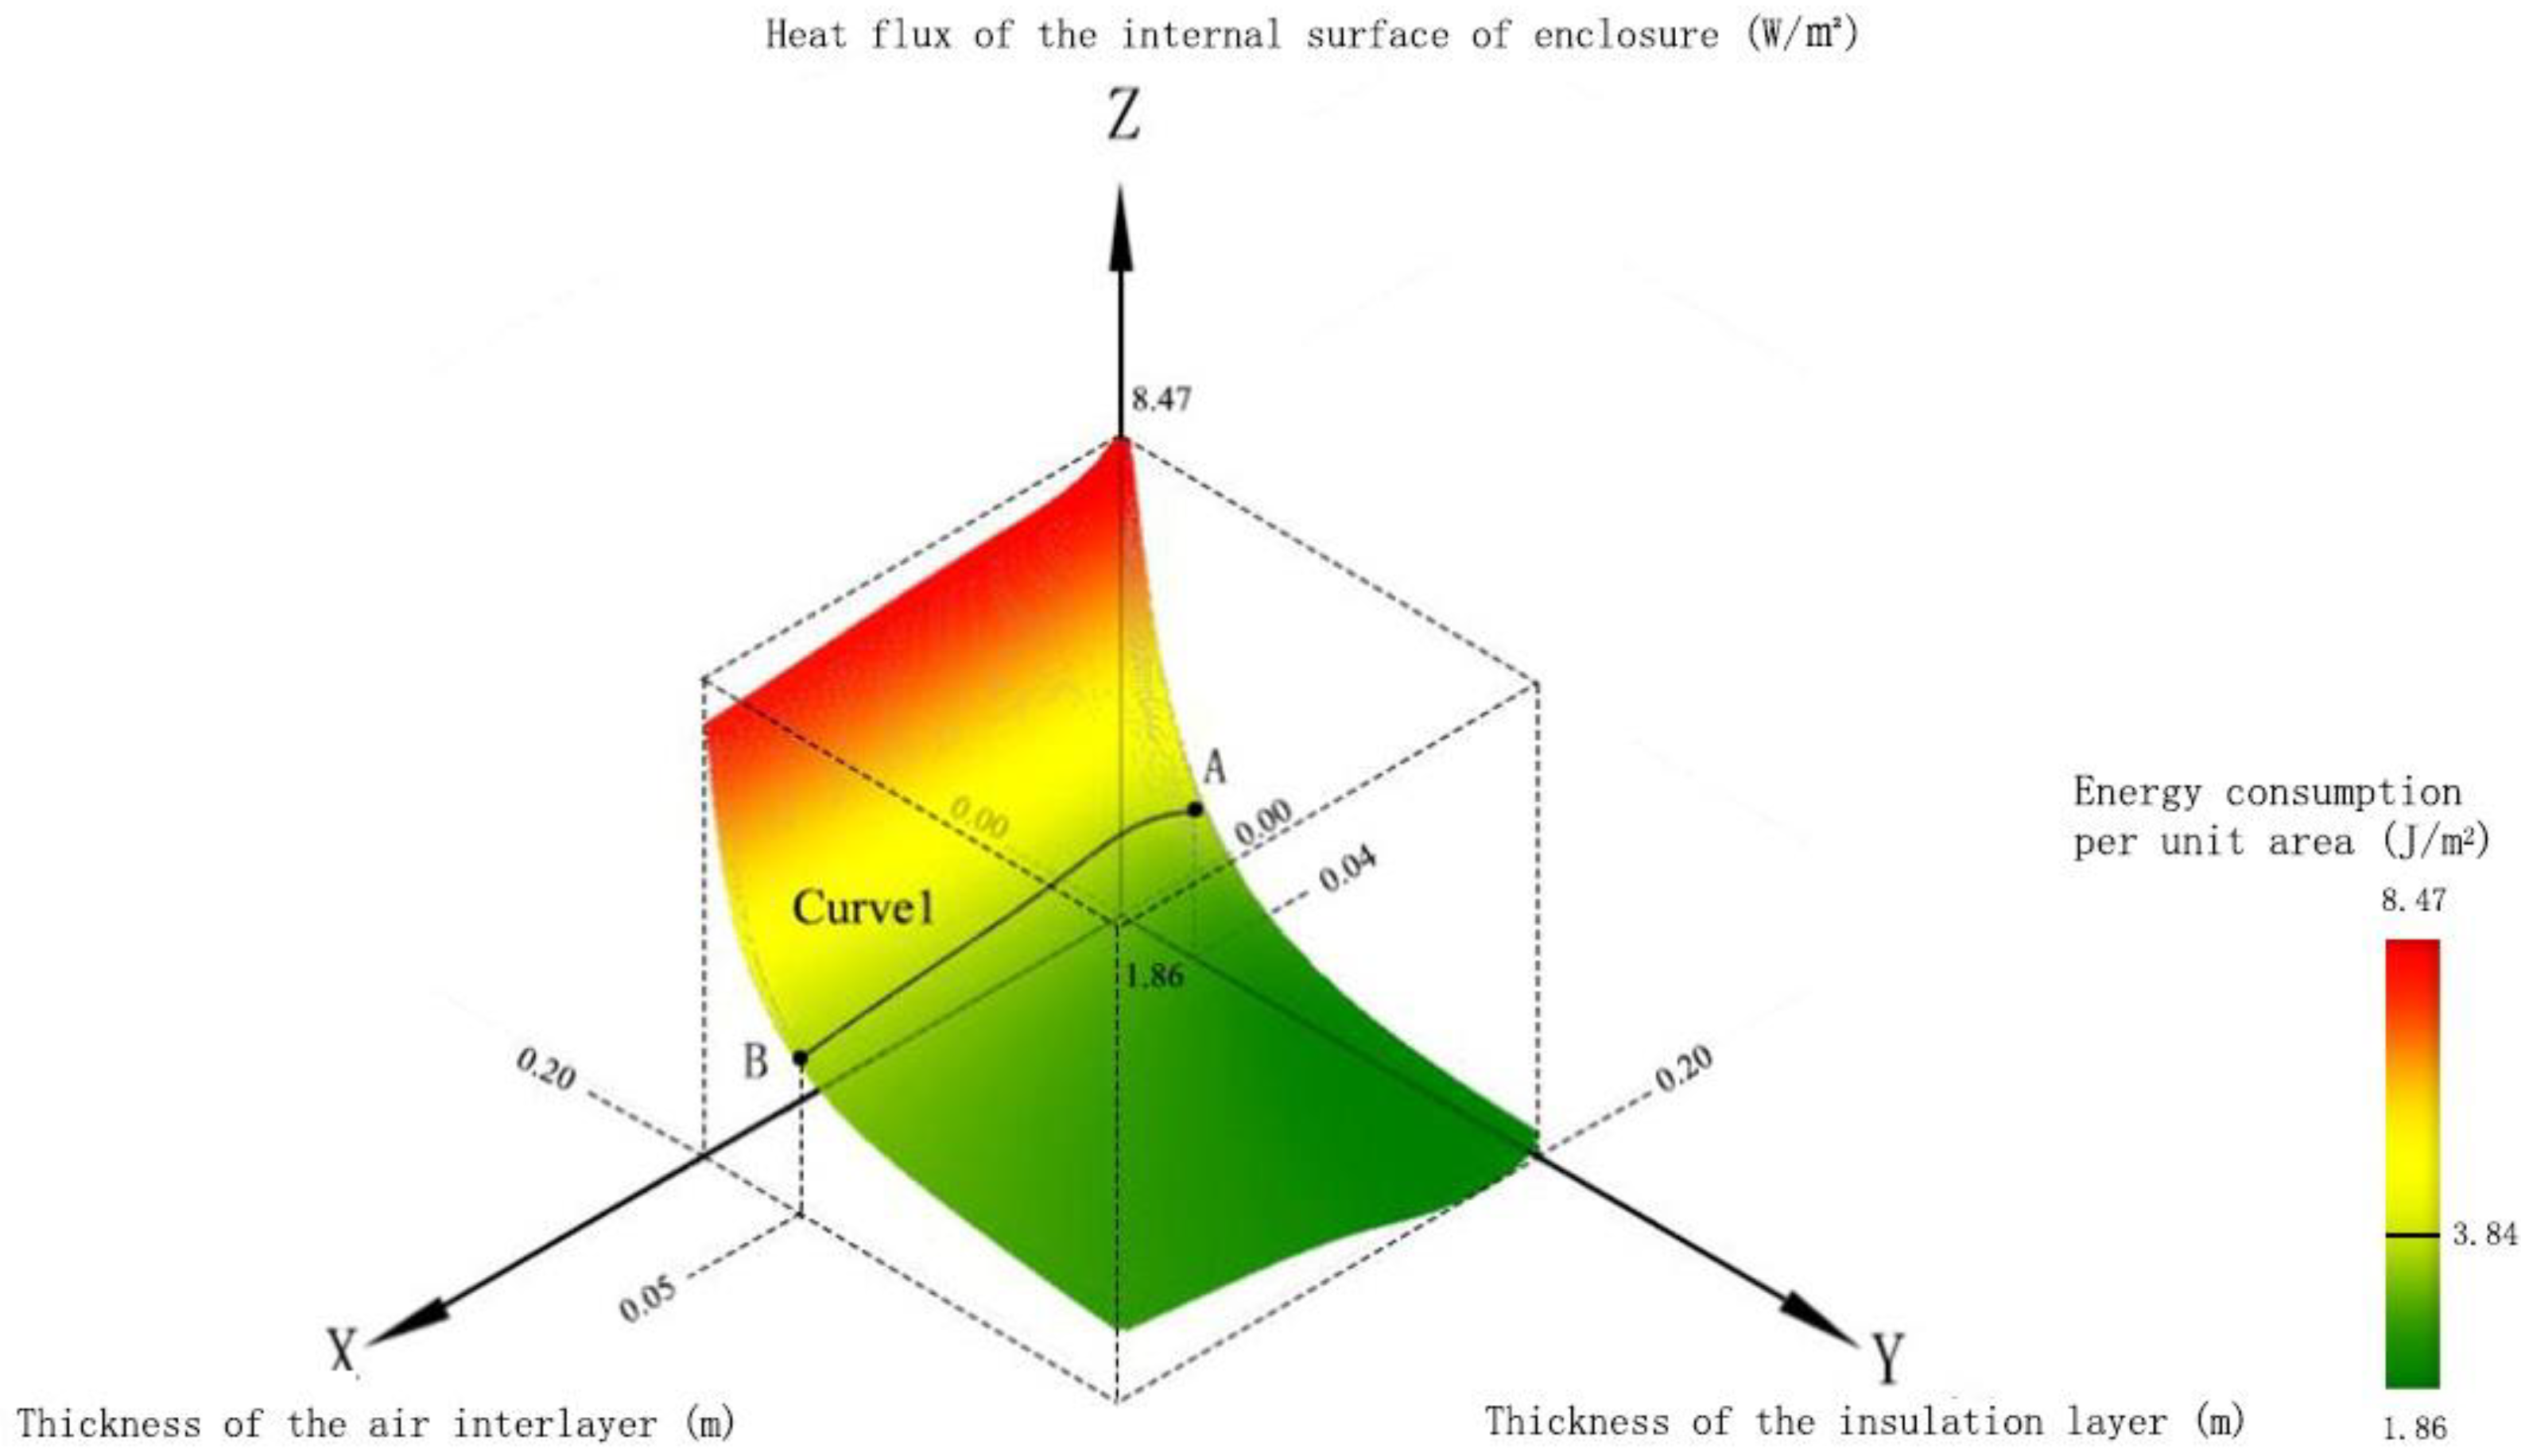
- The change in the thickness of the thermal insulation layer has a more significant impact on the thermal insulation. With the increase in the thickness of the thermal insulation layer, the heat flux on the inner surface of the envelope structure first showed a sharp decrease and then gradually flattened. It can be known from the calculation that when the EPS (Expanded Polystyrene) insulation board is selected for external insulation, the optimal thickness of the insulation layer is 0.05 m; when the EPS insulation board is selected for sandwich insulation, the optimal thickness of the insulation layer is 0.037 m.
- (3)
- The change in the thickness of the air interlayer has less influence on the thermal insulation effect. With the increase of the thickness of the air interlayer, the change of the heat flux on the inner surface of the envelope structure shows a trend of rapid decrease and then gentleness. It can be known from the calculation that when the EPS insulation board is selected for external insulation, the optimal thickness of the air interlayer is 0.024 m; when the EPS insulation board is selected for sandwich insulation, the optimal thickness of the air interlayer is 0.013 m.
- (4)
- The comparison between the optimal thickness of the brick wall insulation layer and the air interlayer in the external insulation and sandwich insulation structure. The “+ 10 mm plastering” sandwich insulation method is better than the “10 mm plastering + 115 mm brick wall + 10 mm plastering + 115 mm brick wall + air interlayer + insulation layer” outer insulation method.
6. Conclusions
Author Contributions
Funding
Institutional Review Board Statement
Informed Consent Statement
Data Availability Statement
Conflicts of Interest
Appendix A

| Floor | Height (m) | Width/Depth |
|---|---|---|
| 1 | 2.60 | 1.09 |
| 2.70 | 1.13 | |
| 2.80 | 1.16 | |
| 2.90 | 1.16 | |
| 3.00 | 1.15 | |
| 2 | 5.20 | 0.93 |
| 5.30 | 0.92 | |
| 5.40 | 0.91 | |
| 5.50 | 0.95 | |
| 5.60 | 0.94 | |
| 5.70 | 0.93 | |
| 5.80 | 0.90 | |
| 5.90 | 0.92 | |
| 6.00 | 0.90 | |
| 3 | 7.80 | 0.96 |
| 7.90 | 0.96 | |
| 8.00 | 0.96 | |
| 8.10 | 0.96 | |
| 8.20 | 0.97 | |
| 8.30 | 0.97 | |
| 8.40 | 0.98 | |
| 8.50 | 0.93 | |
| 8.60 | 0.94 | |
| 8.70 | 0.95 | |
| 8.80 | 0.95 | |
| 8.90 | 0.96 | |
| 9.00 | 0.96 |
References
- 2018 Annual Report on China Building Energy Efficiency. Available online: https://www.cabee.org/site/content/22960.html (accessed on 1 July 2020).
- Chen, X.; Yang, H.; Zhang, W. Simulation-based Approach to Optimize Passively Designed Buildings: A Case Study on a Typical Architectural Form in Hot and Humid Climates. Renew. Sustain. Energy Rev. 2018, 82, 1712–1725. [Google Scholar] [CrossRef]
- Elshafei, G.; Vilcekova, S.; Zelenakova, M.; Negm, A.M. Towards an Adaptation of Efficient Passive Design for Thermal Comfort Buildings. Sustainability 2021, 13, 9570. [Google Scholar] [CrossRef]
- Lee, J. Multi-objective Optimization Case Study with Active and Passive Design in Building Engineering. Struct. Multidiscip. Optim. 2019, 59, 507–519. [Google Scholar] [CrossRef]
- Vargas, A.P.; Hamui, L. Thermal Energy Performance Simulation of a Residential Building Retrofitted with Passive Design Strategies: A Case Study in Mexico. Sustainability 2021, 13, 8064. [Google Scholar] [CrossRef]
- Chen, Y.; Mae, M.; Taniguchi, K.; Kojima, T.; Mori, H.; Trihamdani, A.R.; Morita, K.; Sasajima, Y. Performance of passive design strategies in hot and humid regions. Case study: Tangerang, Indonesia. J. Asian Archit. Build. Eng. 2021, 20, 458–476. [Google Scholar] [CrossRef]
- Brito-Coimbra, S.; Aelenei, D.; Gomes, M.G.; Rodrigues, A.M. Building Façade Retrofit with Solar Passive Technologies: A Literature Review. Energies 2021, 14, 1774. [Google Scholar] [CrossRef]
- Mushtaha, E.; Salameh, T.; Kharrufa, S.; Mori, T.; Aldawoud, A.; Hamad, R.; Nemer, T. The impact of passive design strategies on cooling loads of buildings in temperate climate. Case Stud. Therm. Eng. 2021, 28, 101588. [Google Scholar] [CrossRef]
- Jung, Y.; Heo, Y.; Lee, H. Multi-objective optimization of the multi-story residential building with passive design strategy in South Korea. Build. Environ. 2021, 203, 108061. [Google Scholar] [CrossRef]
- Qiu, Z.; Wang, J.; Yu, B.; Liao, L.; Li, J. Identification of passive solar design determinants in office building envelopes in hot and humid climates using data mining techniques. Build. Environ. 2021, 196, 107566. [Google Scholar] [CrossRef]
- Zune, M.; Rodrigues, L.; Gillott, M. Vernacular passive design in Myanmar housing for thermal comfort. Sustain. Cities Soc. 2020, 54, 101992. [Google Scholar] [CrossRef]
- Mahar, W.A.; Verbeeck, G.; Reiter, S.; Attia, S. Sensitivity Analysis of Passive Design Strategies for Residential Buildings in Cold Semi-Arid Climates. Sustainability 2020, 12, 1091. [Google Scholar] [CrossRef] [Green Version]
- Lin, Y.; Zhao, L.; Liu, X.; Yang, W.; Hao, X.; Tian, L. Design Optimization of a Passive Building with Green Roof through Machine Learning and Group Intelligent Algorithm. Buildings 2021, 11, 192. [Google Scholar] [CrossRef]
- Shao, T.; Zheng, W.; Jin, H. Analysis of the Indoor Thermal Environment and Passive Energy-Saving Optimization Design of Rural Dwellings in Zhalantun, Inner Mongolia, China. Sustainability 2020, 12, 1103. [Google Scholar] [CrossRef] [Green Version]
- Lin, B. Green Building Performance Simulation Optimization Method; China Construction Industry Press: Beijing, China, 2016. (In Chinese) [Google Scholar]
- Shi, X. Performance-Based and Performance-Driven Architectural Design and Optimization. Front. Archit. Civ. Eng. China 2010, 4, 512–518. [Google Scholar] [CrossRef]
- Sun, C.; Han, Y. Research on the Theory of Digital Energy-Saving Design of Buildings under the Guidance of Green Performance. J. Archit. 2016, 11, 89–93. (In Chinese) [Google Scholar]
- Ji, G.H. Parametric Diagram and Performance Design. Times Archit. 2016, 5, 44–47. (In Chinese) [Google Scholar]
- Li, L.; Qian, R.; Wu, J. Formalization of Energy and Ecological Shaping of High-Rise Buildings. Urban Archit. 2014, 19, 21–23. (In Chinese) [Google Scholar]
- Pelken, P.M.; Zhang, J.; Chen, Y.; Rice, D. Virtual Design Studio-Part 1: Interdisciplinary Design Processes. Build. Simul. 2013, 6, 235–251. [Google Scholar] [CrossRef]
- Souza, C.B. A Critical and Theoretical Analysis of Current Proposals for Integrating Building Thermal Simulation Tools into the Building Design Process. J. Build. Perform. Simul. 2009, 2, 283–297. [Google Scholar] [CrossRef]
- Wu, J.; Zhang, Y. Influence of Occlusion Effect on Wind Pressure Difference of Buildings in the Row-Type Residential Area. Build. Sci. 2016, 8, 13–19. (In Chinese) [Google Scholar]
- Liu, L.; Wu, D.; Li, X.; Liu, C.; Jones, P. Research on the Influence of Spatial Design Elements on Building Energy Consumption-Taking the Point-Style High-Rise Office Building in Cold Region as an Example. Build. Energy Effic. 2016, 9, 59–65. (In Chinese) [Google Scholar]
- Mechri, H.; Capozzoli, A.; Corrado, V. Use of the ANOVA Approach for Sensitive Building Energy Design. Appl. Energy 2010, 87, 3073–3083. [Google Scholar] [CrossRef]
- Lu, S.; Yan, X.; Li, J.; Xu, W. The Influence of Shape Design on the Acoustic Performance of Concert Halls from the Viewpoint of Acoustic Potential of Shapes. Acta Acust. United Acust. 2016, 102, 1027–1044. [Google Scholar] [CrossRef]
- Talbourdet, F.; Michel, P.; Andrieux, F.; Millet, J.R.; Mankibi, M.E.; Vinot, B. A Knowledge-Aid Approach for Designing High-Performance Buildings. Build. Simul. 2013, 6, 337–350. [Google Scholar] [CrossRef]
- Lu, S.; Yan, X.; Xu, W.; Chen, Y.; Liu, J. Improving Auditorium Designs with Rapid Feedback by Integrating Para-metric Models and Acoustic Simulation. Build. Simul. 2016, 9, 235–250. [Google Scholar] [CrossRef]
- Li, B. Architectural Generative Design; Southeast University Press: Nanjing, China, 2012. (In Chinese) [Google Scholar]
- Sun, C.; Han, Y. Research on Energy-Saving Design of Office Building Forms in Severe Cold Areas Considering Light and Thermal Performance. J. Archit. 2016, 2, 38–42. (In Chinese) [Google Scholar]
- Caldas, L.; Santos, L. Painting with Light: An Interactive Evolutionary System for Daylighting design. Build. Environ. 2016, 109, 154–174. [Google Scholar] [CrossRef] [Green Version]
- Xie, M. Evolutionary Topology Optimization of Continuum Structures: Methods and Applications; John Wiley & Sons: Chichester, UK, 2010. [Google Scholar]
- You, W.; Qin, M.; Ding, W. Improving Building Facade Design Using the Integrated Simulation of Daylighting, Thermal Performance and Natural Ventilation. Build. Simul. 2013, 6, 269–282. [Google Scholar] [CrossRef]
- Trubiano, F.; Ozkan, A.; Roudsari, M.S. Building Simulation and Evolutionary Optimization in the Conceptual Design of a High-Performance Office Building. In Proceedings of the Building Simulation Conference, Chambrey, France, 25–28 August 2013. [Google Scholar]
- Kim, J.; Yi, Y.K.; Malkawi, A. Building Form Optimization in the Early Design Stage to Reduce Adverse Wind Condition–Using Computational Fluid Dynamics. In Proceedings of the Building Simulation Conference, Chambrey, France, 25–28 August 2013. [Google Scholar]
- Znouda, E.; Ghrab-Morcos, N.; Hadj-Alouane, A. Optimization of Mediterranean Building Design Using Genetic Algorithms. Energy Build. 2007, 39, 148–153. [Google Scholar] [CrossRef]
- DB33/1015–2015; Design Standard for Energy Efficiency Design of Residential Buildings in Zhejiang Province. Ningbo Municipal People’s Government: Ningbo, China, 2015.
- Gao, R.K. Study on the Influence of Air Interlayer on the Performance of Integrated Exterior Wall Insulation System; Anhui University of Architecture: Hefei, China, 2014. [Google Scholar]
- AcGuidance of Ningbo Municipal People’s Government on Implementing the Action Plan of “Improving Urban and Rural Quality and Building a Beautiful Ningbo”; Official Gazette of Ningbo Municipal People’s Government and Ningbo University: Ningbo, China, 2017.
- Liu, J. Architectural Physics, 4th ed.; China Architecture & Building Press: Beijing, China, 2009. [Google Scholar]


| No. | Village Name | Village Type | Number of Houses |
|---|---|---|---|
| 1 | Shangshejiaye village, Dayan town | hilly village, new (expanded) coexisting houses inside | 80 |
| 2 | Maoxin village, Gulin town | hilly village, preserved houses inside | 389 |
| 3 | Longguanxiangheng village, township | hilly village, preserved houses inside | 723 |
| 4 | Baibujie village, Lijiakeng, Zhangshui town | hilly village, new (expanded) coexisting houses inside | 177 |
| 5 | Longxi village, Longguan township | plain village, retaining new (expanded) coexisting houses inside | 79 |
| 6 | Renjiaxi village, Zhangqi town | plain village, preserved houses inside | 653 |
| 7 | Yongwang village, Zhenhai district | plain village, preserved houses inside | 789 |
| 8 | Tingshan village, Fenghua district | plain village, preserved houses inside | 450 |
| 9 | Dongqian lake Hanling | water village, whole village demolition | 520 |
| 10 | Dongqian lake city Yangcun | water village, preservation houses inside | 409 |
| Depth (m) | 3.30 | 3.80 | 4.30 | 4.80 | 5.30 | |
|---|---|---|---|---|---|---|
| Width (m) | ||||||
| 3.90 | 3.30 × 3.90 | 3.80 × 3.90 | 4.30 × 3.90 | 4.80 × 3.90 | 5.30 × 3.90 | |
| 4.40 | 3.30 × 4.40 | 3.80 × 4.40 | 4.30 × 4.40 | 4.80 × 4.40 | 5.30 × 4.40 | |
| 4.90 | 3.30 × 4.90 | 3.80 × 4.90 | 4.30 × 4.90 | 4.80 × 4.90 | 5.30 × 4.90 | |
| 5.40 | 3.30 × 5.40 | 3.80 × 5.40 | 4.30 × 5.40 | 4.80 × 5.40 | 5.30 × 5.40 | |
| 5.90 | 3.30 × 5.90 | 3.80 × 5.90 | 4.30 × 5.90 | 4.80 × 5.90 | 5.30 × 5.90 | |
| 6.40 | 3.30 × 6.40 | 3.80 × 6.40 | 4.30 × 6.40 | 4.80 × 6.40 | 5.30 × 6.40 | |
| 6.90 | 3.30 × 6.90 | 3.80 × 6.90 | 4.30 × 6.90 | 4.80 × 6.90 | 5.30 × 6.90 | |
| 7.40 | 3.30 × 7.40 | 3.80 × 7.40 | 4.30 × 7.40 | 4.80 × 7.40 | 5.30 × 7.40 | |
| 7.90 | 3.30 × 7.90 | 3.80 × 7.90 | 4.30 × 7.90 | 4.80 × 7.90 | 5.30 × 7.90 | |
| 8.40 | 3.30 × 8.40 | 3.80 × 8.40 | 4.30 × 8.40 | 4.80 × 8.40 | 5.30 × 8.40 | |
| 8.90 | 3.30 × 8.90 | 3.80 × 8.90 | 4.30 × 8.90 | 4.80 × 8.90 | 5.30 × 8.90 | |
| 9.40 | 3.30 × 9.40 | 3.80 × 9.40 | 4.30 × 9.40 | 4.80 × 9.40 | 5.30 × 9.40 | |
| 9.90 | 3.30 × 9.90 | 3.80 × 9.90 | 4.30 × 9.90 | 4.80 × 9.90 | 5.30 × 9.90 | |
| 10.40 | 3.30 × 10.40 | 3.80 × 10.40 | 4.30 × 10.40 | 4.80 × 10.40 | 5.30 × 10.40 | |
| 10.90 | 3.30 × 10.90 | 3.80 × 10.90 | 4.30 × 10.90 | 4.80 × 10.90 | 5.30 × 10.90 | |
| 11.10 | 3.30 × 11.10 | 3.80 × 11.10 | 4.30 × 11.10 | 4.80 × 11.10 | 5.30 × 11.10 | |
| Parameter | Value |
|---|---|
| Human density | 0.05 people/m2 |
| Equipment energy consumption | 12.00 W/m2 |
| Lighting energy consumption | 12.00 W/m2 |
| Illumination | 300.00 lx |
| Heating and cooling limit | 100.00 W/m2 |
| Wall | 0.26 m brick wall |
| Roof | 150 mm reinforced concrete + 50 mm rock wool insulation |
| Roof slope | 45 degrees |
| Ground | 300 mm concrete |
| Parameter | Value |
|---|---|
| Thermal conductivity of brick wall | 0.81 W/(m·K) |
| Thermal storage coefficient of brick wall | 10.53 W/(m2·K) |
| Thermal conductivity of EPS board | 0.04 W/(m·K) |
| Thermal storage coefficient of EPS board | 0.36 W/(m2·K) |
| Thermal conductivity of air interlayer | 0.023 W/(m·K) |
| Thermal storage coefficient of air interlayer | 0.00 W/(m2·K) |
Publisher’s Note: MDPI stays neutral with regard to jurisdictional claims in published maps and institutional affiliations. |
© 2022 by the authors. Licensee MDPI, Basel, Switzerland. This article is an open access article distributed under the terms and conditions of the Creative Commons Attribution (CC BY) license (https://creativecommons.org/licenses/by/4.0/).
Share and Cite
Li, N.; Peng, Z.; Dai, J.; Li, Z. Performance-Oriented Passive Design Strategies for Shape and Envelope Structure of Independent Residential Buildings in Yangtze River Delta Suburbs. Sustainability 2022, 14, 4571. https://doi.org/10.3390/su14084571
Li N, Peng Z, Dai J, Li Z. Performance-Oriented Passive Design Strategies for Shape and Envelope Structure of Independent Residential Buildings in Yangtze River Delta Suburbs. Sustainability. 2022; 14(8):4571. https://doi.org/10.3390/su14084571
Chicago/Turabian StyleLi, Ning, Zhechen Peng, Jian Dai, and Ziwei Li. 2022. "Performance-Oriented Passive Design Strategies for Shape and Envelope Structure of Independent Residential Buildings in Yangtze River Delta Suburbs" Sustainability 14, no. 8: 4571. https://doi.org/10.3390/su14084571
APA StyleLi, N., Peng, Z., Dai, J., & Li, Z. (2022). Performance-Oriented Passive Design Strategies for Shape and Envelope Structure of Independent Residential Buildings in Yangtze River Delta Suburbs. Sustainability, 14(8), 4571. https://doi.org/10.3390/su14084571