Article

How Comprehensive Innovation Reform Pilot Improve Urban Green Innovation Efficiency?—Evidence from China

1
School of Government, Beijing Normal University, Beijing 100875, China
2
Department of Geography, Dartmouth College, Hanover, NH 03755, USA
3
Postdoctoral Research Station, Hua Xia Bank Co., Ltd., Beijing 100005, China
4
Postdoctoral Research Station of School of Economics and Management, Tsinghua University, Beijing 100084, China
*
Author to whom correspondence should be addressed.
Sustainability 2022, 14(8), 4550; https://doi.org/10.3390/su14084550
Submission received: 26 February 2022 / Revised: 3 April 2022 / Accepted: 8 April 2022 / Published: 11 April 2022

Abstract

:
Innovation policy is important to sustainable development. However, few scholars have paid attention to the impact of Comprehensive Innovation Reform Pilot (CIRP) Zone Policy on urban green innovation efficiency. To fill this gap, this paper uses difference-in-differences and robustness tests to explore the impact of CIRP on urban Green Innovation Efficiency (GIE) in 275 cities in China from 2008 to 2017. The impacts are investigated in terms of the innovation-driven effect, talent cluster effect, and market effect. The results show that: (1) the impact of CIRP on the GIE of pilot cities significantly increased by 12% from 2008 to 2017, indicating that the innovation policy for sustainable development has an important positive effect on urban green innovation; (2) CIRP has improved the overall innovation level and talent cluster, accelerated the marketization process, and promoted the GIE of the pilot cities; and (3) the analysis of urban heterogeneity showed that CIRP has a greater impact on GIE in central cities in China than in western and eastern cities. The impact on GIE in low-administrative-level cities is greater than in high-administrative-level cities. It is suggested that the government takes the lead in green innovation and improves the talent introduction measures and green financial services. Achieving green innovation and development is the common goal of many countries around the world. The research results provide implications about introducing innovative policies for sustainable development in other countries and regions, especially developing countries that face the dilemma between economic growth and environmental protection.

1. Introduction

Achieving sustainable growth by decoupling economic growth from environmental pollution is a common goal pursued by many countries in the world [1]. Innovation is the driving force for development. Similarly, green innovation is the driving force for sustainable growth [2]. Previous studies have documented that economic growth becomes more sustainable due to green innovation [3,4]. Green innovation has a positive impact on productivity in the medium to long term and has become a key catalyst for sustainable development [5].
Many countries are increasingly aware that development dependent on factor inputs has led to lower total factor productivity. Huge “ecological deficits” and insufficient innovation capacity provide no benefits to economic growth sustainability. China is no exception; therefore, the Chinese government has actively explored innovation policies to promote green innovation. The innovation policy system has gone through three stages. Innovation policy 1.0 aims to overcome market failure and guide market players to increase innovation investment. Innovation policy 2.0 aims to reduce system failures and create a well-functioning national innovation system. Innovation policy 3.0 addresses transformational changes and sustainable development goals [6]. Currently, the Comprehensive Innovation Reform Pilot (CIRP) has become an important innovation policy for China to transform to innovation policy 3.0 [7]. It is believed that CIRP is conducive to the formation of new impetus for economic and social sustainable development and regional green innovation.
However, due to the constraints of institutional transition in China, CIRP has some shortcomings. For example, because the political system in China is answerable to the higher authority, regions selected as CIRP double their investment in innovative resources to gain attention from their superiors in the short term. However, this practice lacks continuity and is not conducive to the long-term improvement of regional green innovation capabilities. It is unknown whether the shift of China’s CIRP policy to innovation policy 3.0 can promote regional green innovation development. The mechanism of the impacts of CIRP on regional green innovation development is also unclear. A comprehensive assessment of the impact of CIRP on Green Innovation Efficiency (GIE) is needed. Such an assessment will help China optimize and improve the reform pilot policy and provide a basis for decision making. It can also provide valuable experience for other countries to formulate similar innovation policies and improve green innovation. In addition, other countries and regions can benefit from our assessment to formulate similar location-oriented innovation policies to improve the institutional environment for green innovation.
There are different definitions of green innovation. Kemp and Arundel argued that green innovations consist of new or modified processes, techniques, practices, systems, and products to avoid or reduce environmental harms [8]. Beise and Rennings regarded green innovations as an important means of solving a country’s ecological problems without curtailing the economic activity underlying such problems [9]. Castellacci and Lie defined green innovation as a process that contributes to the creation of new products and technologies with the aim of reducing environmental risks, such as pollution and the negative consequences of resource exploitation [10]. To sum up, there is no consensus on the concept of green innovation at present, but its core connotation has commonalities—that is, through technological innovation, it means improving the utilization rate of input resources, minimizing environmental pollution, maximizing economic benefits, and satisfying people’s higher-quality living needs, and ultimately promoting the sustainable development of the economy and society. Previous research about innovation policy mainly focuses on three aspects. The first is the overall innovation system construction and specific innovation policy design of different pilot areas [11]. The second is about building an indicator system for assessing CIRP’s implementation [12]. The third is about the impact of CIRP on regional innovation ability, which is similar to the theme of this study. For example, Xia et al. (2020) found that CIRP significantly improved the innovation ability of the pilot area, based on embedded intervention theory and the spatial correlation perspective [13]. They also found that the spatial correlation and spillover effect between the pilot and non-pilot areas are obvious, and the policy pilot value and promotion value are significant. Wang and Du (2020) found that CIRP significantly promotes patent output [14]. Moreover, CIRP has different effects on cities in different regions and at different administrative levels. For example, Lin and Dong (2021) used patent output as a measure of innovation capability and found that CIRP significantly improves the innovation capability of the pilot area both fiscally and financially [15].
Despite excellent previous work on innovation policies, there are two research gaps. First, few studies have directly discussed the impact of CIRP on urban GIE and its mechanism in the context of the transformation to innovation policy 3.0 in China. Second, it is difficult to apply existing indices of green innovation efficiency at the urban level in China due to the limited available data. This paper will improve the scientific measurement of urban GIE.
The contributions of this paper are as follows. (1) Based on the panel data of 275 prefecture-level cities in China, the difference-in-differences (DID) model is used to empirically study the impact of CIRP on urban GIE. Our empirical evidence on the effect of policy implementation helps fill the gap regarding the impacts of CIRP on urban GIE. (2) Our study contributes to a more comprehensive and scientific measurement of GIE. Most previous studies used coal consumption to represent energy consumption [16,17]. However, China’s coal supply and demand are significantly undervalued [18]. Instead, electricity consumption has become the main form of energy consumption in China [19]. Thus, it is better to use electricity consumption as the energy input. The challenge is that the electricity consumption data at the city level are usually unavailable, and the index underestimates energy consumption. Therefore, we use the nighttime light data integrated with the Defense Meteorological Program Operational Line-Scan System (DMSP/OLS) and Visible Infrared Imaging Radiometer Suite (VIIRS) as the proxy variable of energy input to measure electricity consumption at the urban level. (3) We investigate the influencing mechanism of CIRP on regional GIE. The results can provide a reference for policy optimization to improve urban GIE in the future. (4) This paper examines the heterogeneous impact of CIRP on GIE in regions and cities at different administrative levels. It provides a theoretical reference for promoting comprehensive innovation reform policies in regions other than China.

2. Theoretical Analysis and Research Hypothesis

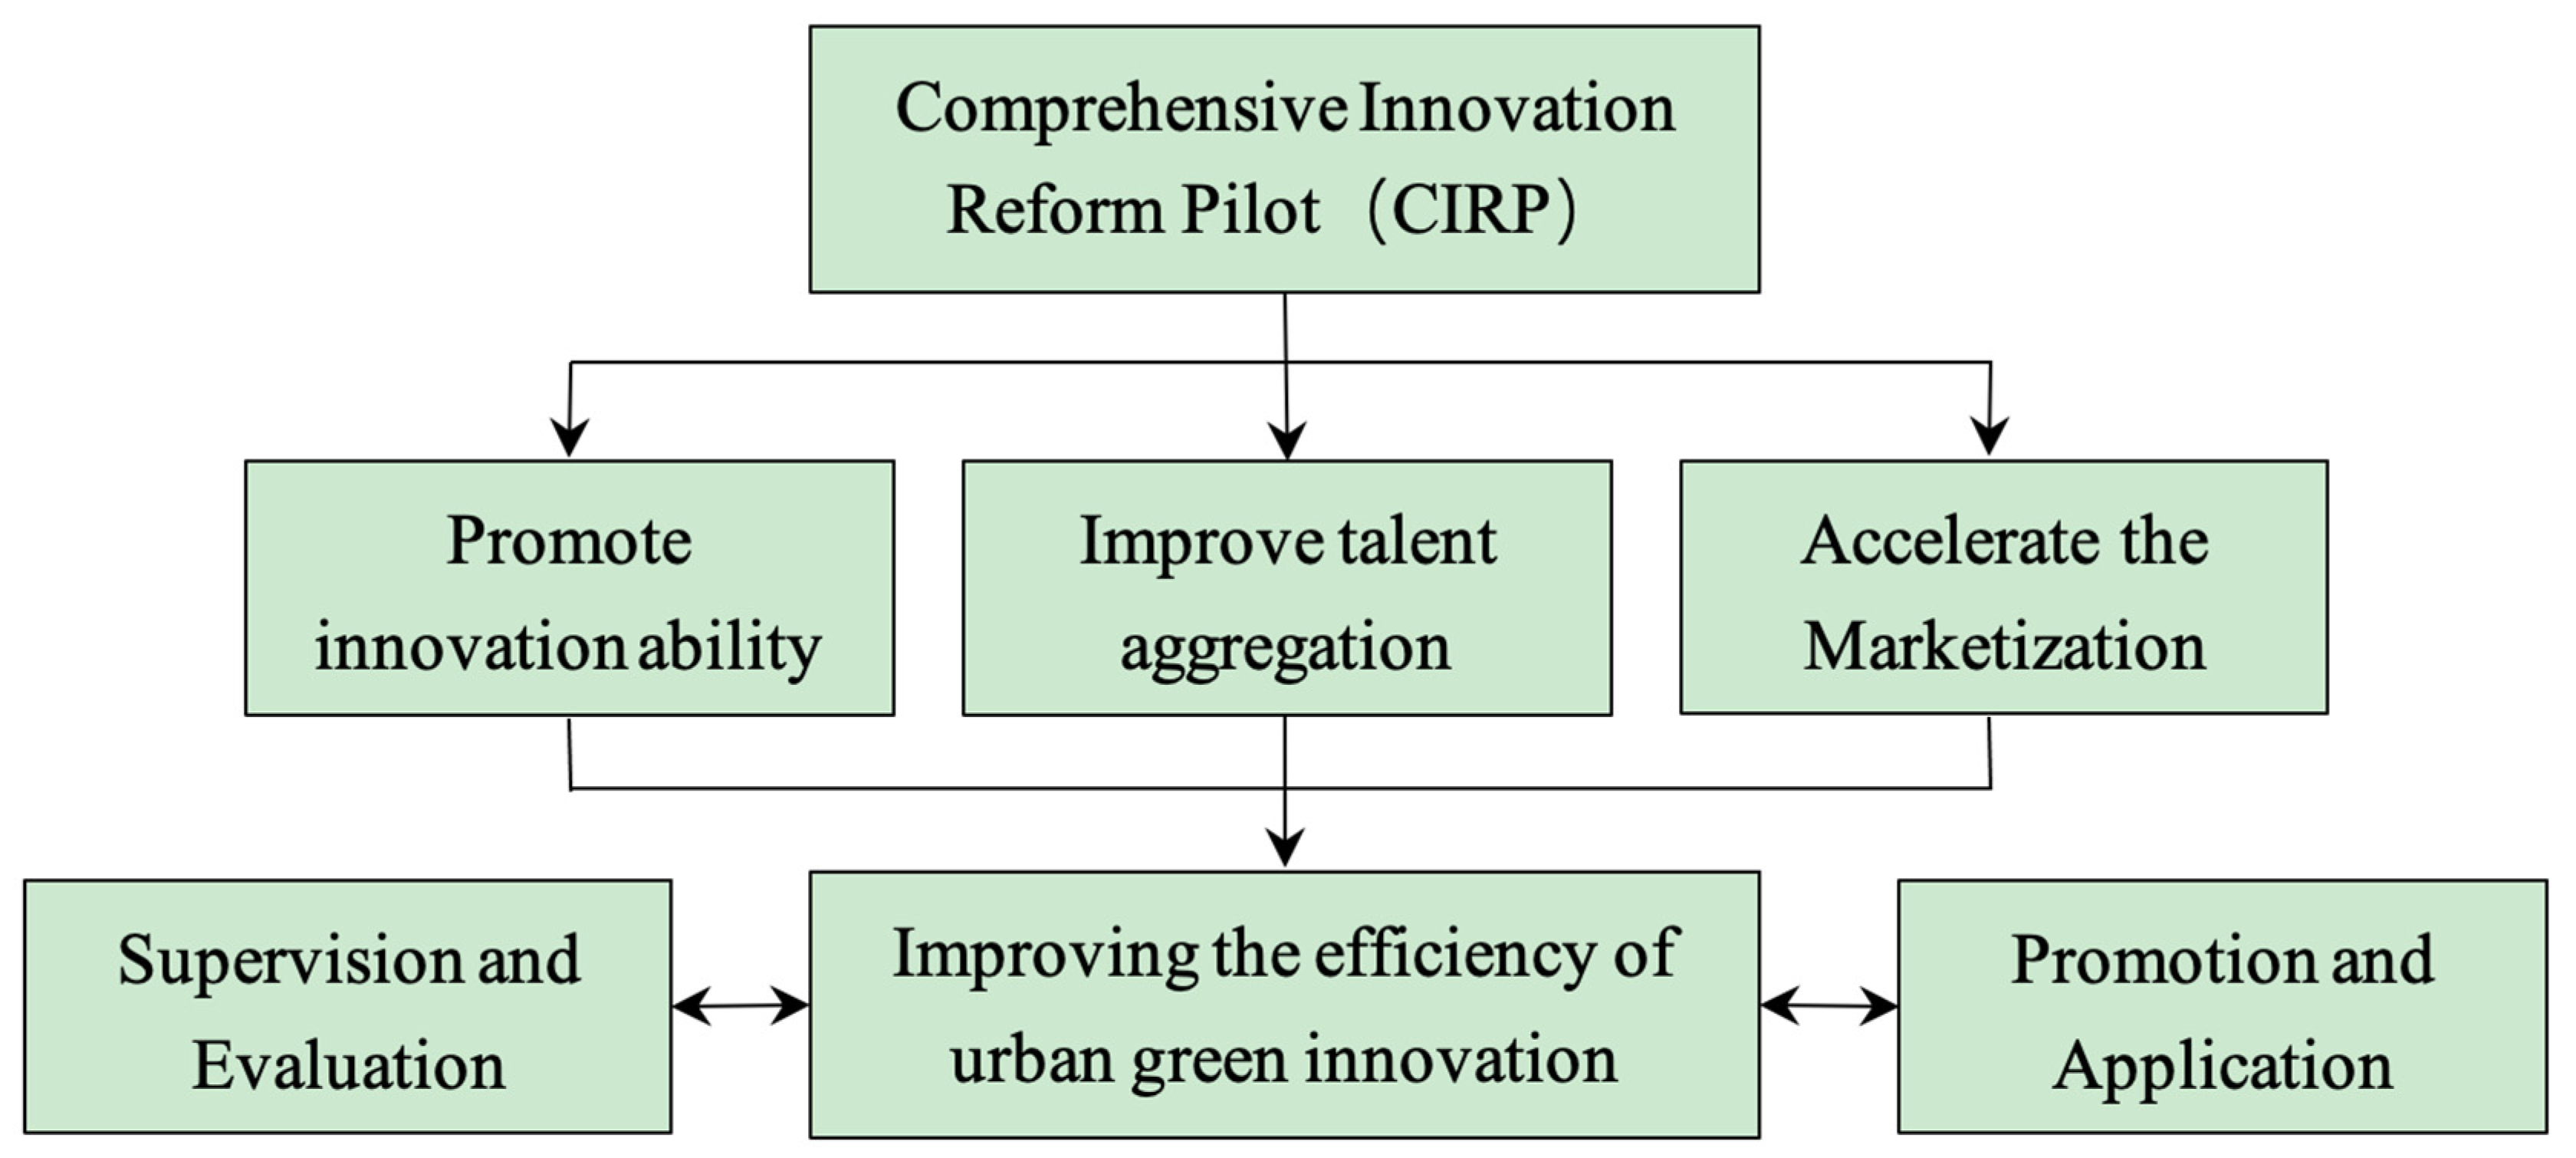
The policy pilot is an institutional arrangement with Chinese characteristics, which has played an important role in promoting a series of reforms in China. The policy pilot can reduce the uncertainty of policy innovation and has been widely used in science, technology, economy, and other fields. In May 2015, the Chinese government proposed the “Overall Plan for Systematic Promotion of Comprehensive Innovation Reform Pilots in Some Regions”, and selected inter-provincial administrative regions such as Beijing, Tianjin, and Hebei, four provincial-level administrative regions of Shanghai, Guangdong, Anhui, and Sichuan, as well as Wuhan and Xi’an. The core areas of the three provincial-level administrative regions of Shenyang are used as pilot cities. Different from the previous policy pilots, firstly, CIRP emphasizes technological innovation as the core, accelerates the construction of technological innovation centers, and breaks through the obstacles of development systems and mechanisms; secondly, it emphasizes talents that introduce and promote talent agglomeration, strengthen cooperation with well-known and efficient research institutions at home and abroad, focus on creating high-end intellectual talent agglomeration, and improve the level of green innovation; thirdly, CIRP focuses on high-end manufacturing, new energy and other industrial agglomeration construction, focusing on the development of ecological and environmental protection technologies; and finally, CIRP insists on optimizing the innovation environment, takes institutional innovation and technological innovation as dual tasks, makes the market play a decisive role in resource allocation, and forms a market environment and social atmosphere that dare to explore and encourage innovation. To sum up, CIRP emphasizes innovation, talent gathering, and optimization of the market environment. Therefore, theoretically, the government’s CIRP policy can significantly improve the efficiency of green innovation in pilot cities, mainly due to the following reasons.
First, CIRP is the pilot promotion of the national innovation-driven development strategy with an aim to build an innovative country. It promotes urban innovation capabilities both nationally and locally. The improvement of the city’s innovation capability is conducive to enhancing the city’s GIE. On the one hand, innovation is the endogenous power of urban technological progress and green growth, making urban economic development less dependent on natural resources. Therefore, innovation is the key to solving practical problems such as resource shortages and ecological imbalance, and provides a new path for urban green economic development [20]. On the other hand, an enhanced urban innovation capability can help reshape the core competitiveness of the city, achieve economic growth that is less dependent on natural resource consumption, and provide new growth as a driving force in continuous innovation. In addition, the improvement of innovation ability promotes the upgrading of the industrial structure, thereby improving the city’s GIE [21].
Secondly, under the support of the dual talent incentive policy of the central government and local governments, pilot cities are attracting a large number of high-skilled talents with innovative means of training, use, and introduction of talents. The accumulation and agglomeration of high-skilled talents drive high-quality development [22], which improves the green innovation efficiency of pilot cities. On the one hand, talent clusters can overcome the temporal and spatial barriers of knowledge dissemination and form a scale effect. Knowledge sharing, skill matching, and learning exchange can improve the efficiency of knowledge dissemination [23]. On the other hand, a knowledge cluster can form when the high-skilled talents in a region gather to a certain scale. The knowledge cluster will allocate innovation resources to the surrounding areas and strengthen the spillover effect through spatial proximity [24].
Thirdly, the formulation of government green innovation policies and the investment in green innovation are affected by the marketization process. Enterprises are the main body of the market, and when to adopt green innovation and what type of green innovation to adopt are largely affected by the process of marketization. CIRP proposes to reduce government administrative intervention in the market and create a fair and competitive market environment. These measures are the embodiment of the Chinese government’s efforts to improve the overall level of marketization. On the one hand, the improvement of the overall level of marketization is conducive to the flow of production factors from low-efficiency production sectors to high-efficiency production sectors and the improvement of enterprise productivity [25]; on the other, with marketization advancement, the market mechanism provides a more transparent and orderly competition environment for market players, and a more reasonable product pricing mechanism for green innovation technology. Such provision reduces the risk of the spillover of green innovation results and encourages enterprises to carry out green innovation.
Therefore, this study has three hypotheses.
Hypothesis 1 (H1).
CIRP will improve the overall innovation level of pilot cities, thereby improving the GIE of pilot cities.
Hypothesis 2 (H2).
CIRP will improve the talent cluster of pilot cities, thereby improving the GIE of pilot cities.
Hypothesis 3 (H3).
CIRP will accelerate the marketization process of pilot cities, thereby improving the GIE of pilot cities.
In addition, CIRP also includes the supervision, evaluation, and application of pilot performance. The monitoring and evaluation data provide decision-making references for mastering the pilot effect. The popularization and application provide practical guidance for maximizing the role of the policy pilot. In summary, CIRP is a systematic project, and its mechanism of action on urban GIE is shown in Figure 1.

3. Methodology and Data

3.1. Method for Assessing GIE

Since Charnes et al. initiated new work in 1978, the DEA model has been widely used in the measurement of nonparametric efficiency [26]. A relaxed data envelopment model including undesired output is proposed to measure the efficiency of urban green innovation [27,28]. Data Envelopment Analysis (DEA) can deal with the measurement of the innovation efficiency of multi-input and multi-output variables. On the one hand, it does not need to set specific function forms in advance and is consistent with the actual situation of the complex economic system; on the other, DEA is based on the concept of relative efficiency and evaluates the effectiveness of decision-making units according to multi-input and multi-output indicators, which can avoid subjective factors in weight setting. Therefore, this paper selects the DEA model to measure urban GIE. However, the traditional DEA model is radial and angle, ignoring the influence of slack variables on efficiency value. When a non-zero slack is caused by excessive input or insufficient output, the radial model overestimates the efficiency value.
The angle model leads to a biased measured efficiency value due to the ignorance of the input or output of a certain aspect [29]. Therefore, the non-radial and non-angular SBM model proposed by Tone (2002) is used in this research [30]. The super-efficiency SBM model combines the advantages of the super efficiency DEA model and SBM model. By incorporating undesired output into the model, it can effectively solve the relaxation of input and output and the juxtaposition of ranking. It has gradually become the mainstream model for measuring efficiency [31].
min r * = 1 m i = 1 m x ¯ / x i k 1 r 1 + r 2 s = 1 r 1 y d ¯ / y s k d + q = 1 r 2 y u ¯ / y q k u s . t . x ¯ j = 1 , k n x i j λ j ; y d ¯ j = 1 , k n y s j d λ j ; y d ¯ j = 1 , k n y q j d λ j ; , x ¯ x k ; y d ¯ y k d ; y u ¯ y k u ; λ j 0 , i = 1 , 2 , , m ; j = 1 , 2 , , n , j 0 ; s = 1 , 2 , , r 1 ; q = 1 , 2 , , r 2 ;
In Formula (1), it is assumed that there are n DMUs, and each DMU is composed of input m, expected output, and undesired output. x, yd, yu are the elements in the corresponding input matrix, expected output matrix, and undesired output matrix. r is urban GIE.
Firstly, this paper considered four innovation input elements. They are the basis and premise of green innovation activities. The elements are: (1) labor input. This paper focuses on the labor variables highly related to innovation and environmental protection. We use the number of people engaged in scientific and technological activities as the proxy variable for the input of scientific and technological labor. We use the number of people engaged in water conservancy, urban environment, and public services as the proxy variable for the input of environmental protection labor [32,33,34]. (2) Financial expenditure on science and technology. Fiscal investment in science and technology provides necessary financial support for innovation activities, reflecting the degree of support of local governments for scientific and technological innovation [33]. (3) Fixed asset investment. Fixed asset investment provides the necessary material basis for innovation. Current fixed asset investment will impact future innovation output, and direct use cannot well explain the accumulation of innovation activities [35]. Referring to the practice of most previous studies, the fixed asset investment stock is calculated using the permanent inventory method according to the 15% depreciation rate [36]. (4) Energy input. As mentioned earlier, most studies have used coal consumption and electricity consumption to represent energy consumption [37]. However, given the significant underestimation of coal supply and demand in China and the incomplete data of electricity consumption at the urban level, this paper uses integrated DMSP/OLS and VIIRS continuous nighttime lighting data as proxy variables for energy input [38]. The nighttime lighting data are widely used in urban space expansion, population density simulation, urban heat island effect, and power consumption. Scholars have proven the rationality of using nighttime light data to measure regional energy consumption [39,40,41,42,43]. A higher city night light brightness indicates more economic activities at night and higher energy consumption.
Secondly, this paper has three output variables, including two expected outputs and one undesired output. The expected outputs are actual gross domestic product (GDP) and the number of green patent applications. The actual GDP has been transferred into a constant 2008 price. The number of green patent applications is stable, reliable, and timely in reflecting the innovation ability and vitality of society [44,45]. Therefore, it is used to represent the green technology output of urban green innovation. The green patents refer to the “green list of International Patent Classification” launched by the World Intellectual Property Organization (WIPO) in 2010. In terms of undesired output, most previous studies selected industrial waste-water emissions, sulfur dioxide emissions, and smoke (powder) dust emissions [46]. While following the above approach, this paper included carbon dioxide emissions as an additional undesirable output in carbon neutralization and carbon peak. The entropy method was used to generate environmental pollution indices for the above four pollutants to measure undesirable outputs.

3.2. Empirical Model

3.2.1. Baseline Model

By constructing the difference-in-differences (DID) model, this paper compares the changes of GIE between the experimental and control groups before and after implementing CIRP. CIRP includes Beijing–Tianjin–Hebei, Shanghai, Guangdong, Anhui, Sichuan, Wuhan, Xi’an, and Shenyang. Among them, Hebei Province is based on Shijiazhuang, Baoding, and Langfang. Guangdong Province is based on the Pearl River Delta region, including Guangzhou, Foshan, Zhaoqing, Shenzhen, Dongguan, Huizhou, Zhuhai, Zhongshan, and Jiangmen. Anhui Province is based on Hefei, Wuhu, and Bengbu. Sichuan Province is based on Chengdu, Deyang, and Mianyang. Accordingly, a total of 24 cities in CIRP constitutes the experimental group, and the remaining prefecture-level cities are the control group. The two-way fixed effect model is used for difference-in-difference estimation. The benchmark model is:
G I E i t = α 0 + α 1 C I R P i t + α 2 C O N T R O L i t + φ t + μ i + ε i t ,
In Formula (2),   G I E i t is the explanatory variable of urban green innovation efficiency, where i is the city and t is the time. Variable   C I R P i t indicates whether city i becomes a CIRP in year t. α 1   is the core coefficient of this paper, reflecting the net effect of CIRP on GIE. Statistically significant α 1   indicates that CIRP has changed the city’s GIE, and vice versa indicates that CIRP has no effect on GIE. C O N T R O L i t represents the control variable selected in this article. φ t and μ i are time fixed effect and individual fixed effect, respectively, and ε i t is a random error term.

3.2.2. Dynamic Effect Model

The benchmark regression results reflect the average impact of pilot policy implementation on urban GIE, and do not reflect the impact of pilot policies in different periods. To explore the dynamic effect, this paper refers to Jacobson et al. (1993) and proposes the Event Study Approach to test the dynamic effect of CIRP empirically [47]. The model is as follows:
G I E i t = δ 0 + δ 1 t = 2010 2017 treat φ t + δ 2 C O N T R O L i t + φ t + μ i + ε i t ,
Taking 2014 as the benchmark year before the pilot policy, δ 1 indicates the estimated value of CIRP for GIE from 2010 to 2017. Among them, the pilot city treat = 1, and the non-pilot city treat = 0. The definitions of other variables are the same as those in Formula (2).

3.2.3. Mechanism Test Model

Theoretical analysis shows that CIRP can improve the GIE of pilot cities by improving the overall innovation ability of cities, improving the talent cluster of pilot cities, and accelerating the marketization process of pilot cities. To verify this, this article draws on approaches by Gao et al. [48]. The variables that affect GIE’s urban innovation level, talent cluster level, and marketization level were embedded into the benchmark model in Formula (2) to investigate the significance of the impact mechanism. The model is set as follows:
M i t = β 0 + β 1 C I R P i t + β 2 C O N T R O L i t + φ t + μ i + ε i t ,
G I E i t = γ 0 + γ 1 C I R P i t M i t + γ 2 C O N T R O L i t + φ t + μ i + ε i t ,
In the above formula, M i t is a mechanism variable, which means innovation-driven effect, talent cluster effect, and market-oriented effect, respectively. The definition of other variables is the same as Formula (2). The first step is to verify the impact of CIRP on urban innovation, talent cluster, and marketization through Formula (4). The second step is to test the impact of CIRP variables and mechanism variables on urban GIE through Formula (5). The coefficient γ 1 is the core coefficient of this paper, representing the effect of CIRP on GIE through innovation-driven effect, talent cluster effect, and marketization effect.

3.2.4. Variable Selection

Firstly, the dependent variable is the city GIE. The measurement method and the selection basis of the input and output variables are given in Section 3.1.
Secondly, the core explanatory variable is the dummy variable C I R P i t , i = 0 indicates non-CIRP cities, and i = 1 indicates CIRP cities. t is the time dummy variable. CIRP began in 2015. In other words, the pilot cities were not affected by CIRP before 2015 and were affected by CIRP after 2015.
Thirdly, the overall innovation level of the mechanism variable city is measured by the urban innovation index released by Kou and Liu [49]. The talent cluster degree is measured by the total employment number divided by the built-up area of the secondary and tertiary industries. The marketization level is measured by the total marketization index released by Wang et al. [50].
Finally, five control variables are used. They are: (1) Economic Development Level (PERGDP). The level of urban economic development is an important factor affecting innovation and total factor productivity. In this paper, the urban economic development level is measured by the ratio of urban real GDP (constant price in 2008) to the total population at the end of the year. The index is processed by a natural logarithm (lnPERGDP). (2) Foreign Direct Investment (FDI). FDI affects the total factor productivity [51], sustainable innovation, and environmental conditions of the host country [52,53,54]. This paper uses the proportion of FDI in GDP to measure urban FDI. (3) Industrial Structure (STRU). Changes in urban industrial structure affect pollution emissions and the quality of economic growth, thereby affecting urban GIE. This paper measures the industrial structure of cities using the proportion of the added value of the tertiary industry in GDP. (4) Scale of Financial Development (FINANCE). Financial development affects green development through economic development and environmental protection [55]. This paper measures the development of urban finance using the proportion of deposit and loan balance of financial institutions to GDP at the end of the year. (5) Human Capital Content (HRCAP). In general, the more full-time teachers in higher-level schools there are, the higher the human capital content of the city is. Drawing on Fan, this paper measures the number of full-time teachers per ten thousand colleges and universities and processes the index with natural logarithm (lnHRCAP) [56].

3.3. Data

The data sources used in this paper are as follows. (1) Data for measuring urban GIE. The energy input data are derived from publicly integrated continuous nighttime lighting data for DMSP/OLS and VIIRS [38]. Green patent application data are from China Research Data Services (CNRDs). Carbon dioxide emissions are from Carbon Emission Accounts and Datasets (CEADs). (2) The data used for the talent cluster degree (lnHRAGG) are from the China City Statistical Yearbook. The data of the urban innovation index (IVDEX) are from the “China Urban and Industrial Innovation Report 2017” released by Kou and Liu [49]. This report provides the innovation index of more than 300 prefecture-level cities in China from 2000 to 2016 and the corresponding calculation method. This paper uses the natural logarithm of the urban innovation index (lnIVDEX) to measure the overall level of urban innovation. MARKET is measured by the total market index issued by Wang et al. [50]. Since the only authoritative data source of the marketization index is at the provincial level, this paper measures the city’s marketization level using the marketization index of the provinces where the city is located and conducts a natural logarithm (lnMARKET). In addition, the urban innovation index and marketization index are only available up to 2016. Therefore, the data for 2017 with the above two missing indices are obtained by linear interpolation. (3) The data for all other variables are from the China Urban Statistical Yearbook 2009–2018. Missing data are supplemented by linear interpolation. We cross-checked all statistical data to ensure the consistency and accuracy of the data. The statistical characteristics of each variable are shown in Table 1. GIE is the value of green innovation efficiency, with the minimum value of 0.013, the maximum value of 2.633, and the average value of 0.302. The regional differences in GIE in China are large, which motivates the heterogeneity analysis in Section 5.

4. Empirical Results

4.1. Baseline Results

Table 2 presents the benchmark regression results based on the fixed-effect model. To test the robustness of the regression results, the control variables are added one by one by stepwise regression. In columns (1)–(6), the coefficient of CIRP is significantly positive. This result does not vary substantially at different significance levels, indicating that the positive effects of CIRP on urban GIE are reliable. After controlling the urban individual effect and time effect and adding all control variables into the equation, the GIE level of CIRP cities significantly increased by about 12% compared with non-CIRP cities, according to the coefficient of column (6).
As seen from the regression results of the control variables in columns (2)–(6), the regression coefficient of FDI is significantly negative, indicating that FDI inhibits the improvement of urban GIE. This result agrees with Candau and Dienesch [57], who prove the pollution heaven hypothesis to some extent. One possible reason for the inhibiting effect of FDI is that China’s local governments are development-oriented. They tend to ignore the growth of FDI quality, and instead focus on the growth of the FDI scale to promote economic expansion. Low-quality FDI inflows inhibit the improvement of urban GIE. The impact of foreign direct investment on the host country can be divided into two kinds. One is the “pollution halo hypothesis”, which holds that foreign direct investment can bring more advanced development ideas and advanced production technology to the host country, promote the improvement of regional green innovation levels, and accelerate the sustainable development and transformation of the host country. This type of foreign direct investment is called high-quality foreign direct investment. The other is the “pollution paradise hypothesis”, which holds that developed countries often transfer their high pollution and high energy consumption industries to the host country in the form of foreign capital export, resulting in the decline of the green innovation efficiency of the host country [58].
As seen from columns (3)–(6), the industrial structure regression coefficient is significantly positive, indicating that increasing the proportion of the tertiary industry can effectively promote urban GIE. At present, China’s industrial structure is transforming, upgrading, and moving forward in the direction of green innovation. As shown in columns (4)–(6), the regression coefficient of the financial development scale is significantly negative at the level of 1%, indicating that the development of the financial industry will inhibit the improvement of urban GIE. Financial development should provide good services for the financing constraints faced by urban innovation. However, green innovation with dual externalities also has the characteristics of high risks, difficult research and development, unpredictable market prospects, and a long return period [59]. Such characteristics lead to insufficient support of financial institutions that emphasize risk control for green innovation activities. The rapid development of green credit has become an important choice to improve the enthusiasm of market players for green innovation in the future. Columns (5) and (6) show that the urban economic development level regression coefficient is significantly negative. This indicates that the current development model of Chinese cities has not yet been transformed into the intensive efficiency growth model, and the serious environmental pollution problems of economically developed cities are still worthy of attention. The regression coefficient of human capital content on urban GIE is not significant in column (6), indicating that the development of urban higher education does not currently provide a good human capital basis. This conclusion is consistent with Li and Yang [60]. It may be because colleges and universities in the city pay too much attention to scale expansion and fail to improve the quality of education to promote economy. The number, enrollment, and average size of Chinese colleges and universities have increased rapidly in recent years. This scale expansion-oriented education policy will result in the government, colleges, and universities lacking sufficient energy and resources to address the internal components of higher education, such as talent training modes and professional structure. If colleges and universities are guided by scale expansion, their scientific research and innovation ability is bound to be adversely affected. Reducing the innovation ability of colleges and universities is not conducive to the formation and trans-formation of innovation achievements.

4.2. Dynamic Effect Analysis

The premise of the consistency of the results of DID estimation is that the experimental group and the control group meet the parallel trend hypothesis. Figure 2 shows that the GIE of pilot cities is always higher than that of non-pilot cities. Before implementing CIRP in 2015, the GIE of the experimental group and the control group showed a parallel trend, and there was no systematic difference over time. Therefore, the precondition for the use of DID was met. To more accurately identify whether the GIE trend significantly differs between the experimental group and the control group before and after the implementation of CIRP, this paper calculates the effect of CIRP on GIE from 2010 to 2017 based on the dynamic effect analysis method of the Event Study Approach. The results are shown in Figure 3. It is found that the impact of CIRP on GIE is not significant in the 95% confidence interval between 2010 and 2015, indicating that there is no significant difference between the experimental group and the control group before the implementation of the pilot policy. It also proves the parallel trend hypothesis.

4.3. Mechanism Results

Next, this paper evaluates the hypothesis that policy pilots affect GIE through the innovation-driven effect, talent cluster effect, and marketization effect. First, columns (1) and (2) in Table 3 show that the pilot policy significantly improves the overall innovation level of the city regardless of whether the control variables are added. As shown in columns (3) and (4), the interaction coefficient between the CIRP and urban innovation level is significantly positive at the 1% level, indicating that the pilot policy improves the urban GIE through innovation-driven effect.
Secondly, columns (1) and (2) of Table 4 show that the regression coefficient of CIRP on urban talent cluster is significantly positive at the 1% level, indicating that the pilot policy is conducive to urban talent cluster. As seen from columns (3) and (4), the regression coefficient of urban talent cluster on GIE is significantly positive at the 1% level, indicating that talent cluster can effectively promote urban GIE. Table 4 shows that CIRP can improve the talent cluster of pilot cities and increase the city GIE. Therefore, Hypothesis 2 of this paper is verified.
Finally, columns (1) and (2) in Table 5 show the regression results of the impacts of pilot policy on the level of urban marketization. Columns (3) and (4) show the regression results of the interaction term between the pilot policy and the level of marketization on the urban GIE. Whether or not the control variables are added, the above results are significant at the 1% level, indicating that CIRP improves urban GIE by accelerating the process of urban marketization, which verifies Hypothesis 3.
In terms of the role of the three mechanisms, the effect of talent cluster on improving urban GIE is the most obvious, which is due to the self-enhancement effect and endogenous growth effect of talent cluster driving innovation [61]. With the increase of talent cluster, the scale effect and spatial spillover effect of agglomeration will be strengthened.

4.4. Robustness Check

To ensure the robustness of the estimation results, this paper conducts four robustness tests. First, placebo tests were conducted by randomly allocating pilot cities. Specifically, this paper randomly selected 24 cities from 275 cities as the experimental group. It is assumed that the 24 cities implemented CIRP, while the remaining cities were the control group. Random sampling ensures that the independent variable, CIRP, constructed in this paper has no effect on urban GIE, and any significant findings will indicate that the regression results are biased. Figure 4 shows after 1000 random samplings and benchmark regression according to Equation (1), the distribution of 1000 estimated coefficients and the related p-value distribution are concentrated near zero, and the p-value of most estimated values is greater than 0.1. At the same time, the real estimated value in this paper is an obvious abnormal value in the placebo test. The results show that the estimated results in this paper are robust.
Second, considering the time lag from CIRP to the actual effect, the one-period lagged pilot policy is introduced as the independent variable for regression. The regression results are shown in column (1) of Table 6. The regression results are consistent with the above.
Third, in 275 sample cities, the economic development level of municipalities directly under the central government (MDC), provincial capital (PC), and municipalities with independent planning status (MIP) are much higher than that of other cities. Their innovative resource collection and utilization ability, environmental protection, and pollution control investment ability are strong, and the green innovation development power brought by political demand is also higher than that of other cities [62]. Therefore, the GIE of these cities will be affected by more factors, which may affect the estimation results of the model. Therefore, the robustness test is carried out by excluding these 34 cities. The regression results are shown in column (2) of Table 6. The symbol and significance level of the estimation coefficient are consistent with Table 2, indicating that the above conclusion is robust.
Fourth, previous analysis has investigated the dynamic effect of CIRP on urban GIE, but only focused on the impact after introducing the policy. A comparison with the policy before the introduction was not conducted. Therefore, following Dong and Zhu [63], the significance of the differences in urban GIE in different periods was tested by changing the time window width before and after CIRP. Specifically, the year 2015 was taken as the time node of the pilot policy. The 1-year and 2-year lengths were selected as the window width for the dynamic time window test. The results are shown in columns (3)–(4) of Table 6. Changing the width of the time window does not change the direction of the impact of CIRP on urban GIE. With the increase in the width of the time window, the urban GIE shows an upward trend, and the significance level is increasing, which indicates that the conclusions in the baseline model are robust.

5. Heterogeneity Analysis: City Location and Administrative Grade

5.1. Heterogeneity of City Location

The impact of CIRP may be different in different regions. This paper divides cities into eastern, central, and western cities (the eastern part includes cities in 11 provinces including Beijing, Tianjin, Hebei, Liaoning, Shanghai, Jiangsu, Zhejiang, Fujian, Shandong, Guangdong, and Hainan; the central part includes cities in 8 provinces including Shanxi, Jilin, Heilongjiang, Henan, Hubei, Hunan, Anhui, and Jiangxi; the west includes cities in 11 provinces including Inner Mongolia, Chongqing, Sichuan, Guangxi, Guizhou, Yunnan, Shaanxi, Gansu, Qinghai, Ningxia, and Xinjiang). Regression analysis was conducted to test the policy effect of cities in different regions. The results are shown in columns (1)–(3) in Table 7. For eastern and western cities, the regression coefficients of the pilot policies are significant at the 5% and 10% levels, respectively. This indicates that the pilot policies have significantly improved the GIE of the eastern and western cities. The scale of urban financial development and economic development have a significant inhibiting effect on the GIE of eastern and western cities, which is consistent with the conclusion of the benchmark model. FDI, industrial structure, and human capital content have no obvious influence on GIE in eastern and western cities. In central cities, the regression coefficient of the pilot policy is significant at the 1% level, indicating that the pilot policy has significantly improved the GIE of central cities. The industrial structure and financial development scale of the city have a significant role in promoting the GIE of the central city, indicating that the reform of the central city to promote the development of green innovation should focus on adjusting the industrial structure and improving the financial services of green innovation. FDI, urban economic development level, and human capital content have no significant effects on the GIE of central cities.
Since 2013, the north–south gap in China’s economy has increasingly become a new focus of attention [64]. In this paper, cities are divided into northern cities and southern cities (the northern region includes cities in 15 provinces including Beijing, Tianjin, Hebei, Shanxi, Inner Mongolia, Liaoning, Jilin, Heilongjiang, Shandong, Henan, Shaanxi, Gansu, Qinghai, Ningxia, and Xinjiang; the southern region includes cities in 15 provinces including Shanghai, Jiangsu, Zhejiang, Anhui, Fujian, Jiangxi, Hubei, Hunan, Guangdong, Guangxi, Hainan, Sichuan, Chongqing, Guizhou, and Yunnan). The regression results are shown in Table 2, columns (4) and (5). In both southern and northern cities, pilot policies have significantly improved the urban GIE. In terms of the control variables, FDI has a significant inhibiting effect on the GIE of northern cities, but has no obvious effect on southern cities, indicating that northern cities should pay attention to the quality of foreign capital introduction in the future reform pilot work. The industrial structure has a significant role in promoting the GIE of the southern cities, but has no obvious effect on the northern cities. This indicates that the southern cities should adjust the industrial structure and take advantage of the green innovation effect during industrial transformation and upgrades in future reform pilot work. The scale of financial development has a significant inhibiting effect on the GIE of northern and southern cities, which is consistent with the conclusion of the benchmark column (6). The level of urban economic development has a significant inhibiting effect on the GIE of southern cities. It negatively impacts the GIE of northern cities, but the effect is not statistically significant. This conclusion shows that the economic development model has not yet changed to intensive efficiency growth in the south or the north. The impact of human capital on GIE in both northern and southern cities is not significant. As noted in the baseline results, this may be the consequence of focusing on the size of the universities rather than on their quality.
Overall, CIRP has improved the GIE of cities in different regions. Nevertheless, the effects are different in eastern, central, and western regions. Among them, the GIE promotion effect of the central region is the most obvious, followed by the western region, and the promotion effect of the eastern region is the smallest. The possible reason is that the eastern region has advantages in the possession and utilization of innovative resources, while the western region has relatively rich ecological resources. The same policy preferences and financial support play a more important role in these areas, and the marginal effect is small. The central region is less abundant in innovation resources and ecological resources than the eastern and western regions. According to the law of diminishing marginal utility, CIRP has a weak marginal effect on the eastern and western regions. It has the greatest impact on the central region. In terms of the difference between the north and the south, the impact of CIRP on the GIE of the southern city is slightly higher than that of the northern city. One possible reason is that the pilot cities are mainly concentrated in the southern region, and spatial agglomeration is conducive to better play to the policy effect.

5.2. Heterogeneity of City Administrative Grade

China is a typical unitary country. The central government carries out vertical management through provinces, cities, counties, and townships. In addition to the municipalities directly under the central government of provincial administrative units, there are three types of core cities at different levels in prefecture-level cities in China, namely, sub-provincial cities, ordinary provincial capital cities, and ordinary prefecture level cities. In China’s administrative system, the level of urban administration means the difference in the authority of the examination, approval, and planning of urban development, as well as the difference in the negotiation ability of local governments to affect the central decision making. The administrative level is a measure of the political capital endowment of each city, highlighting the ability of urban resource mobilization and policy influence [65]. In essence, the administrative level of a city is to measure the distance between the local government and the central decision-making center. High-level cities have comparative advantages in human, financial, and material aspects. The local government will take advantage of this political capital endowment to bring benefits to local development.
In China’s political and economic system, the differences in factor endowments between cities are highly correlated with administrative levels [66]. To further examine the impact of urban administrative levels on the effect of CIRP, this paper divides urban administrative levels into low-level cities and high-level cities (cities with a high administrative grade include Beijing, Tianjin, Shanghai, Chongqing, Shijiazhuang, Taiyuan, Hohhot, Shenyang, Changchun, Harbin, Nanjing, Hangzhou, Hefei, Fuzhou, Nanchang, Jinan, Zhengzhou, Wuhan, Changsha, Guangzhou, Nanning, Haikou, Chengdu, Guiyang, Kunming, Xi’an, Lanzhou, Xining, Urumqi, Shenzhen, Dalian, Qingdao, Ningbo, and Xiamen) (including 34 cities in MDC, PC, and MIP). The regression results are shown in Table 8. Column (1) is the regression result of low-level cities, and the regression coefficient is significant at the 1% level, indicating that the pilot policy significantly improves the GIE of low-level cities. Specifically, CIRP improves the GIE of low-level cities by 8.1%. Among them, FDI, the scale of financial development, and economic development significantly inhibited the urban GIE. Industrial structure significantly promoted the urban GIE. The impact of human capital content on urban GIE was not significant, and the possible reasons have been analyzed separately in the baseline results.
The regression results for the high-level cities are shown in column (2). Unlike low-level cities, CIRP has no significant impact on high-level cities. One possible reason is that high-level cities are more advanced in the possession and use of innovative resources, leading to a less catalytic effect, even when the same policies are adopted. Therefore, according to the law of diminishing marginal effect, CIRP has a smaller marginal promoting effect on the GIE in high-level cities than in low-level cities. It is worth noting that FDI in high-level cities has a significant positive impact on urban GIE, indicating that these cities fully consider the impact of FDI on high-quality economic development when introducing FDI. In the next reform pilot, deepening open innovation should focus on foreign investment cooperation to promote green innovation.

6. Conclusions and Policy Implications

6.1. Conclusions

This paper uses the difference-in-differences model to study the impact of CIRP on GIE in 275 prefecture-level and above cities from 2008 to 2017. The main conclusions are as follows. (1) CIRP significantly improves GIE, and the policy effect is increasing over time. (2) CIRP significantly improves GIE by improving the overall innovation level of the city, improving the urban talent cluster, and accelerating the process of urban marketization. (3) Urban location and urban administrative level affect the effect of the pilot policy. According to the law of diminishing marginal utility, the pilot policy has a weak marginal impact on the eastern and western regions, and a strong marginal impact on the central region. Since most of the pilot cities are in the southern region, the relative spatial agglomeration is conducive to a better policy effect, and the impact of the pilot policy on the GIE of the southern city is slightly higher than that of the northern city. In addition, the pilot policy significantly improved the GIE of low-level cities, but had no significant effect on the GIE of high-level cities.
This paper has some limitations for future research opportunities. First, this study shows that financial development has no significant effect on improving urban GIE. However, green finance is a key link between innovative resources and ecological environment. It is important to investigate how to effectively serve green innovation when promoting CIRP. Second, due to the availability of environmental data at the urban level, the sample of this study was only taken from data up to 2017. With the publication of China’s urban environmental data and the gradual increase of CIRP, future studies can increase the sample size temporally and spatially to further test the dynamic effects of pilot policies on urban GIE.

6.2. Policy Implications

Based on the above empirical results, the main policy recommendations for improving GIE are as follows:
(1)
It is suggested to comprehensively deepen the innovation reform system and spread the experience of comprehensive innovation reform. This paper found that the comprehensive innovation reform policy can improve the efficiency of green innovation. Therefore, the government should summarize the experimental experience of innovation and reform, comprehensively promote the relevant measures of innovation and reform, create an efficient and convenient scientific and technological innovation governance system, optimize the operation mechanism of the innovation ecosystem, and promote regional high-quality development.
(2)
According to the mechanism of comprehensive innovation reform on green innovation, suggestions are proposed in terms of green innovation, talents, and marketization. First, we should further strengthen the protection and support of green patents, simplify the administrative examination and approval process, and speed up the promotion and application of green patents to improve green innovation. In addition, governments at all levels should increase their support for green science and technology innovation activities, increase the proportion of green financial science and technology expenditure, and promote the improvement of regional green innovation ability. Second, the recommendations are to accelerate the introduction of innovative talents and the training of local talents, strengthen the incentive for innovative talents, overcome the institutional obstacles that hinder innovative talent flow, consolidate the foundation of green innovation, and gather more high-quality resources and elements for green innovation activities. Third, suggestions include accelerating the market-oriented reform of factors, clarifying the functional orientation of the market and factors in promoting the upgrading of industrial structure, and giving full play to the decisive role of the market in allocating resources. Improving GIE should focus on accelerating the market-oriented mechanism of green innovation, promoting the innovation of factor resources, creating a market environment of fair competition, and promoting the transformation of innovation achievements.
(3)
To improve the efficiency of green innovation in cities with different characteristics, we should adhere to strategies adapted to local conditions. To promote the construction of the pilot area for comprehensive innovation reform, we should consider the differences in the development of different regions and local conditions. Different cities should consider their development characteristics, invest funds to introduce innovative talents, and prevent the excessive investment of resources. In cities with advanced economic development and innovation foundations, it is suggested that the focus be placed on intellectual property, patent research and development, and dynamically adjusted policy tools. In addition, the innovation radiation effect of cities with advanced green innovation should be promoted in surrounding cities to improve the overall green innovation efficiency of the region.

Author Contributions

Conceptualization, C.Z. and T.L.; methodology, T.L.; software, T.L.; validation, T.L., C.Z. and Q.X.; formal analysis, T.L.; investigation, Z.L.; resources, Z.L.; data curation, T.L.; writing—original draft preparation, T.L.; writing—review and editing, Z.L.; visualization, C.Z.; supervision, Q.X.; project administration, Q.X.; funding acquisition, T.L. All authors have read and agreed to the published version of the manuscript.

Funding

This research was funded by the National Social Science Foundation of China, grant number [18FGL005].

Institutional Review Board Statement

Ethical review and approval was not required for the study as the research does not involve humans.

Informed Consent Statement

Not applicable.

Data Availability Statement

Data available on request.

Conflicts of Interest

The authors declare no conflict of interest.

References

  1. Abu Seman, N.A.; Govindan, K.; Mardani, A.; Zakuan, N.; Saman, M.Z.M.; Hooker, R.E.; Ozkul, S. The mediating effect of green innovation on the relationship between green supply chain management and environmental performance. J. Clean. Prod. 2019, 229, 115–127. [Google Scholar] [CrossRef]
  2. Wang, K.-H.; Umar, M.; Akram, R.; Caglar, E. Is technological innovation making world “Greener”? An evidence from changing growth story of China. Technol. Forecast. Soc. Chang. 2021, 165, 120516. [Google Scholar] [CrossRef]
  3. Rennings, K. Redefining innovation—Eco-innovation research and the contribution from ecological economics. Ecol. Econ. 2000, 32, 319–332. [Google Scholar] [CrossRef]
  4. Aldieri, L.; Carlucci, F.; Vinci, C.P.; Yigitcanlar, T. Environmental innovation, knowledge spillovers and policy implications: A systematic review of the economic effects literature. J. Clean. Prod. 2019, 239, 118051. [Google Scholar] [CrossRef]
  5. de Azevedo Rezende, L.; Bansi, A.C.; Alves, M.F.R.; Galina, S.V.R. Take your time: Examining when green innovation affects financial performance in multinationals. J. Clean. Prod. 2019, 233, 993–1003. [Google Scholar] [CrossRef]
  6. Schot, J.; Steinmueller, W.E. Three frames for innovation policy: R&D, systems of innovation and transformative change. Res. Policy 2018, 47, 1554–1567. [Google Scholar] [CrossRef]
  7. Wang, H.Z.; Wang, H.B.; Fan, Y.G. An evaluation of the impact of comprehensive innovation reform trial policies based on big-data analysis. Sci. Res. Manag. 2019, 40, 43–54. [Google Scholar] [CrossRef]
  8. Kemp, R.; Arundel, A. Survey Indicators for Environmental Innovation. IDEA (Indicators and Data for European Analysis) Paper Series 8/1998, STEP Group Norway. 1998. Available online: https://nifu.brage.unit.no/nifu-xmlui/bitstream/handle/11250/226478/Idea8.pdf?sequence=1 (accessed on 22 December 2021).
  9. Beise, M.; Rennings, K. Lead markets and regulation: A framework for analyzing the international diffusion of environmental innovations. J. Ecol. Econ. 2005, 52, 5–17. [Google Scholar] [CrossRef]
  10. Castellacci, F.; Lie, C.M. A taxonomy of green innovators: Empirical evidence from South Korea. J. Clean. Prod. 2017, 143, 1036–1047. [Google Scholar] [CrossRef] [Green Version]
  11. Yan, L.; Wei, C.; Shizhu, L.; Shiyun, Z. Research on the Related Policies of Comprehensive Innovation and Reform Pilot Zone of Shanghai. Sci. Tech. Manag. Res. 2017, 37, 72–78. [Google Scholar] [CrossRef]
  12. Wang, Z.J.; Tian, D.L.; Liu, H. The Study of Evaluation Framework and Index of National Pilot Regions for Comprehensive Innovation and Reform. Forum. Sci. Tech. China 2018, 34, 44–51. [Google Scholar] [CrossRef]
  13. Xia, Y.L.; Liu, B.; Li, D. Evaluation for Policy Effectiveness of “Comprehensive Innovation and Reform Experimental Zone” Make Oneself Alone Good or Make World around Benefit. Forum. Sci. Tech. China 2020, 36, 26–37. [Google Scholar] [CrossRef]
  14. Wang, X.; Du, B.G. Impact of Comprehensive Innovation Reform Experimental Policy. Stud. Sci. Sci. 2021, 39, 1418–1427. [Google Scholar] [CrossRef]
  15. Lin, S.F.; Dong, X.Q. Research on the Effect of Comprehensive Innovation Reform Experiment on Regional Innovation Capability and Its Transmission Mechanism. Sci. Technol. Prog. Policy 2021, 39, 91–100. [Google Scholar] [CrossRef]
  16. Sun, H.; Edziah, B.K.; Sun, C.; Kporsu, A.K. Institutional quality, green innovation and energy efficiency. Energy Policy 2019, 135, 111002. [Google Scholar] [CrossRef]
  17. Fan, J.-D.; Xiao, Z.-H. Analysis of spatial correlation network of China’s green innovation. J. Clean. Prod. 2021, 299, 126815. [Google Scholar] [CrossRef]
  18. Lin, B.Q. Electricity Consumption and China’s Economic Growth: A Study Based on Production Function. Mana. World 2003, 11, 18–27. [Google Scholar] [CrossRef]
  19. Lin, B.Q. Structural Changes, Efficiency Improvement and Electricity Demand Forecasting. Econ. Res. J. 2003, 5, 57–66. [Google Scholar]
  20. Wang, H.L.; Lian, X.Y.; Lin, D.M. Effects of Green Technological Innovation Efficiency on Regional Green Growth Performance: An Empirical Analysis. Sci. Sci. Manag. 2016, 37, 80–87. [Google Scholar]
  21. Wang, F.Y.; He, Z.L. Environmental Regulation, Green Innovation and Industrial Structure Upgrading. J. Stat. Decis. 2022, 38, 73–76. [Google Scholar]
  22. Glaeser, E.L.; Ponzetto, G.A.M.; Tobio, K. Cities, Skills and Regional Change. Reg. Stud. 2012, 48, 7–43. [Google Scholar] [CrossRef] [Green Version]
  23. Ning, L.; Wang, F.; Li, J. Urban innovation, regional externalities of foreign direct investment and industrial agglomeration: Evidence from Chinese cities. Res. Policy 2016, 45, 830–843. [Google Scholar] [CrossRef]
  24. Xu, B.; Luo, W. The Influence of the Distribution of Talents on the Efficiency of Regional Innovation System from the Perspective of Value Chain. Sci. Technol. Prog. Policy 2020, 37, 52–61. [Google Scholar] [CrossRef]
  25. Zhang, J.; Li, K.; Liu, Z.B. Market-Oriented Transition and Enterprises Productivity in China. China Econ. Q. 2011, 10, 571–602. [Google Scholar] [CrossRef]
  26. Charnes, A.; Cooper, W.W.; Rhodes, E. Measuring the efficiency of decision making units. Eur. J. Oper. Res. 1978, 2, 429–444. [Google Scholar] [CrossRef]
  27. Tone, K. A slack-based measure of efficiency in context-dependent data envelopment analysis. Eur. J. Oper. Res. 2001, 130, 498–509. [Google Scholar] [CrossRef] [Green Version]
  28. Tone, K. Dealing with undesirable outputs in DEA: A slacks-based measure (SBM) approach. In Presentation at North American Productivity Workshop III; Toronto, ON, Canada, 2004; pp. 44–45. Available online: https://www.researchgate.net/publication/284047010_Dealing_with_undesirable_outputs_in_DEA_a_Slacks-Based_Measure_SBM_approach (accessed on 22 December 2021).
  29. Xu, J.Z.; Wang, M.M.; Guan, J. Research on Mechanism of Carbon Emission from Energy Consumption and Green In-novation Efficiency in Dynamic Endogenous Perspective Based on Chinese Equipment Manufacturing Industries. Manag. Rev. 2019, 31, 81–93. [Google Scholar] [CrossRef]
  30. Tone, K. A slacks-based measure of super-efficiency in data envelopment analysis. Eur. J. Oper. Res. 2002, 143, 32–41. [Google Scholar] [CrossRef] [Green Version]
  31. Zhang, Z.; Liao, X.; Li, C.; Yang, C.; Yang, S.; Li, Y. Temporal and spatial characteristics and influencing factors of county agricultural ecological efficiency in Hunan Province. Econ. Geogr. 2022, 42, 181–189. [Google Scholar]
  32. Huang, Y.; Wang, Y. How does high-speed railway affect green innovation efficiency? A perspective of innovation factor mobility. J. Clean. Prod. 2020, 265, 121623. [Google Scholar] [CrossRef]
  33. Fan, F.; Lian, H.; Liu, X.; Wang, X. Can environmental regulation promote urban green innovation Efficiency? An empirical study based on Chinese cities. J. Clean. Prod. 2021, 287, 125060. [Google Scholar] [CrossRef]
  34. Li, J.; Du, Y. Spatial effect of environmental regulation on green innovation efficiency: Evidence from prefectural-level cities in China. J. Clean. Prod. 2021, 286, 125032. [Google Scholar] [CrossRef]
  35. Cao, X.; Yu, J. Regional Innovation Efficiency in China from the Green Low-carbon Perspective. China Popul. Environ. 2015, 25, 10–19. [Google Scholar] [CrossRef]
  36. Berlemann, M.; Wesselhöft, J.-E. Estimating Aggregate Capital Stocks Using the Perpetual Inventory Method. Rev. Econ. 2014, 65, 1–34. [Google Scholar] [CrossRef]
  37. Tian, P.; Lin, B. Regional technology gap in energy utilization in China’s light industry sector: Non-parametric meta-frontier and sequential DEA methods. J. Clean. Prod. 2018, 178, 880–889. [Google Scholar] [CrossRef]
  38. Chen, Z.; Yu, B.; Yang, C.; Zhou, Y.; Yao, S.; Qian, X.; Wang, C.; Wu, B.; Wu, J. An extended time series (2000–2018) of global NPP-VIIRS-like nighttime light data from a cross-sensor calibration. Earth Syst. Sci. Data 2021, 13, 889–906. [Google Scholar] [CrossRef]
  39. Doll, C.N.; Pachauri, S. Estimating rural populations without access to electricity in developing countries through night-time light satellite imagery. Energy Policy 2010, 38, 5661–5670. [Google Scholar] [CrossRef]
  40. Letu, H.; Hara, M.; Yagi, H.; Naoki, K.; Tana, G.; Nishio, F.; Shuhei, O. Estimating energy consumption from night-time DMPS/OLS imagery after correcting for saturation effects. Int. J. Remote Sens. 2010, 31, 4443–4458. [Google Scholar] [CrossRef]
  41. Hu, T.; Huang, X. A novel locally adaptive method for modeling the spatiotemporal dynamics of global electric power consumption based on DMSP-OLS nighttime stable light data. Appl. Energy 2019, 240, 778–792. [Google Scholar] [CrossRef]
  42. Zhu, Y.; Xu, D.; Ali, S.H.; Ma, R.; Cheng, J. Can Nighttime Light Data Be Used to Estimate Electric Power Consumption? New Evidence from Causal-Effect Inference. Energies 2019, 12, 3154. [Google Scholar] [CrossRef] [Green Version]
  43. Lu, L.; Weng, Q.; Xie, Y.; Guo, H.; Li, Q. An assessment of global electric power consumption using the Defense Meteorological Satellite Program-Operational Linescan System nighttime light imagery. Energy 2019, 189, 116351. [Google Scholar] [CrossRef]
  44. Li, D.; Zhao, Y.; Zhang, L.; Chen, X.; Cao, C. Impact of quality management on green innovation. J. Clean. Prod. 2018, 170, 462–470. [Google Scholar] [CrossRef]
  45. Zhou, X.; Yu, Y.; Yang, F.; Shi, Q. Spatial-temporal heterogeneity of green innovation in China. J. Clean. Prod. 2021, 282, 124464. [Google Scholar] [CrossRef]
  46. Huang, J.; Xia, J.; Yu, Y.; Zhang, N. Composite eco-efficiency indicators for China based on data envelopment analysis. Ecol. Indic. 2018, 85, 674–697. [Google Scholar] [CrossRef]
  47. Jacobson, L.S.; LaLonde, R.J.; Sullivan, D.G. Earnings Losses of Displaced Workers. Am. Econ. Rev. 1993, 83, 685–709. Available online: https://www.jstor.org/stable/2117574?seq=1 (accessed on 23 December 2021).
  48. Gao, A.G.; Zhang, L. Does the national high-tech zone reduce the resource dependence of resource-based cities? An empirical test based on the double difference method. Inq. Int. Econ. 2018, 5, 127–138. [Google Scholar]
  49. Kou, Z.L.; Liu, X.Y. FIND Report on City and Industrial Innovation in China; Fudan Institute of Industrial Development, School of Economics, Fudan University: Shanghai, China, 2017. [Google Scholar]
  50. Wang, X.L.; Fan, G.; Hu, L.P. Marketization Index of China’s Province: Neri Report 2018; Social Sciences Academic Press: Beijing, China, 2019. [Google Scholar]
  51. Newman, C.; Rand, J.; Talbot, T.; Tarp, F. Technology transfers, foreign investment and productivity spillovers. Eur. Econ. Rev. 2015, 76, 168–187. [Google Scholar] [CrossRef] [Green Version]
  52. Amendolagine, V.; Lema, R.; Rabellotti, R. Green foreign direct investments and the deepening of capabilities for sustainable innovation in multinationals: Insights from renewable energy. J. Clean. Prod. 2021, 310, 127381. [Google Scholar] [CrossRef]
  53. Rahman, Z.U.; Cai, H.; Ahmad, M. A new look at the remittances-fdi- energy-environment nexus in the case of selected asian nations. Singap. Econ. Rev. 2019, 64, 1–19. [Google Scholar] [CrossRef]
  54. Ahmad, M.; Khan, Z.; Rahman, Z.U.; Khattak, S.I.; Khan, Z.U. Can innovation shocks determine CO2 emissions (CO2e) in the OECD economies? A new perspective. Econ. Innov. New Technol. 2021, 30, 89–109. [Google Scholar] [CrossRef]
  55. Campiglio, E. Beyond carbon pricing: The role of banking and monetary policy in financing the transition to a low-carbon economy. Ecol. Econ. 2016, 121, 220–230. [Google Scholar] [CrossRef] [Green Version]
  56. Fan, J.Y. Industrial Agglomeration and Difference of Regional Labor Productivity: Chinese Evidence with International Comparison. Eco. Res. J. 2006, 11, 72–81. [Google Scholar]
  57. Candaua, F.; Dienesch, E. Pollution Haven and Corruption Paradise. J. Environ. Econ. Manag. 2017, 85, 171–192. [Google Scholar] [CrossRef] [Green Version]
  58. Li, F.R.; Shang, Y.Z.; Xue, Z.Y. The impact of foreign direct investment on China’s green development—Based on the data of 260 prefecture level cities in China. Econ. Issues 2022, 4, 75–84. [Google Scholar] [CrossRef]
  59. Xu, X.Z.; Ruan, K. Industry structure, financial development and provincial innovation performance. Sci. Res. Manag. 2016, 37, 53–60. [Google Scholar] [CrossRef]
  60. Li, Z.; Yang, S.Y. Can the National High-tech Zone Improve the Level of Urban Innovation? J. South. Econ. 2019, 12, 49–67. [Google Scholar] [CrossRef]
  61. Ji, X.L.; Pu, Y.Z. Regional Talent Agglomeration Effect and Management Follow-up under the Background of Industrial Innovation—Taking Jiangsu as an Example. Mod. Eco. Res. 2017, 4, 72–76. [Google Scholar] [CrossRef]
  62. Li, B.; Wu, S. Effects of local and civil environmental regulation on green total factor productivity in China: A spatial Durbin econometric analysis. J. Clean. Prod. 2017, 153, 342–353. [Google Scholar] [CrossRef]
  63. Dong, Y.M.; Zhu, Y.M. Study on the Employment Effect of the Construction of High Speed Railway—Evidence from 285 Cities of China Based on PSM-DID Method. Busi. Mana. J. 2016, 38, 26–44. [Google Scholar] [CrossRef]
  64. Yang, D.G.; Liu, K.D.; Zhou, Z.T. Study on Regional Economic Development Disparity and Its Evolution between Southern and Northern China. Bull. Chin. Acad. Sci. 2018, 33, 1083–1092. [Google Scholar] [CrossRef]
  65. Huang, H.; Wang, F.; Song, M.; Balezentis, T.; Streimikiene, D. Green innovations for sustainable development of China: Analysis based on the nested spatial panel models. Technol. Soc. 2021, 65, 101593. [Google Scholar] [CrossRef]
  66. Liu, R.M.; Zhao, R.J. Does the national high-tech zone promote regional economic development? Based on the verification of the double difference method. Mana World 2015, 8, 30–38. [Google Scholar] [CrossRef]
Figure 1. Flowchart of framework.
Sustainability 14 04550 g001
Figure 2. Parallel trend.
Sustainability 14 04550 g002
Figure 3. The dynamic effect of the impact of CIRP on urban GIE (Since the first period before the policy pilot is used as the benchmark group, the data for 2014 are not available in the figure).
Sustainability 14 04550 g003
Figure 4. Placebo check. Note: the X-axis represents the estimated coefficients from 1000 randomly assigned CIRP pilot policies. The red vertical dashed line is the true estimated value of the model (6) in Table 2, and the red horizontal solid line is the significance level of p = 0.1.
Sustainability 14 04550 g004
Table 1. Descriptive statistics of the main variables.
VariablesObs.MeanStd. Dev.Min.Max.
GIE27500.3020.2130.0132.633
FDI27501.8401.789013.165
STRU275038.0559.3698.58080.605
FINANCE2750217.930105.73356.001792.575
lnPERGDP27509.9800.5838.18912.021
lnHRCAP27501.9130.917004.436
lnHRAGG27508.3210.5105.6429.978
lnIVDEX27500.4791.820−5.0887.150
lnMARKET27501.8370.2470.8462.303
Table 2. Baseline results.
(1)(2)(3)(4)(5)(6)
GIEGIEGIEGIEGIEGIE
CIRP0.122 ***0.119 ***0.122 ***0.126 ***0.120 ***0.120 ***
(0.024)(0.024)(0.025)(0.024)(0.024)(0.024)
FDI −0.007 **−0.006 *−0.007 **−0.006 *−0.006 *
(0.003)(0.003)(0.003)(0.003)(0.003)
STRU 0.004 **0.007 ***0.005 ***0.005 ***
(0.002)(0.002)(0.002)(0.002)
FINANCE −0.001 ***−0.001 ***−0.001 ***
(0.000)(0.000)(0.000)
lnPERGDP −0.133 ***−0.130 ***
(0.040)(0.040)
lnHRCAP −0.023
(0.023)
Constant0.298 ***0.311 ***0.163 **0.228 ***1.627 ***1.644 ***
(0.003)(0.007)(0.063)(0.058)(0.427)(0.425)
Time FEYesYesYesYesYesYes
City FEYesYesYesYesYesYes
Observations275027502750275027502750
R-squared0.5830.5840.5860.5940.5970.597
Notes: Robust standard errors are in parentheses, ***, **, and * denote statistical significance at the 1%, 5%, and 10% level, respectively.
Table 3. Mechanism results of innovation-driven effect.
(1)(2)(3)(4)
lnIVDEXlnIVDEXGIEGIE
CIRP0.149 *** (0.042)0.154 *** (0.042)
CIRP×lnIVDEX 0.031 *** (0.006)0.032 *** (0.006)
Constant0.475 *** (0.006)0.136(0.835)0.298 *** (0.003)1.622 *** (0.425)
Control variablesNoYesNoYes
Time FEYesYesYesYes
City FEYesYesYesYes
Observations2750275027502750
R-squared0.9770.9780.5840.598
Notes: Robust standard errors are in parentheses, *** denote statistical significance at the 1% level.
Table 4. Mechanism results of talent aggregation.
(1)(2)(3)(4)
lnHRAGGlnHRAGGGIEGIE
CIRP0.182 *** (0.043)0.188 *** (0.043)
CIRP×lnHRAGG 0.015 *** (0.003)0.015 *** (0.003)
Constant8.317 *** (0.004)8.054 *** (0.557)0.298 *** (0.003)1.641 *** (0.425)
Control variablesNoYesNoYes
Time FEYesYesYesYes
City FEYesYesYesYes
Observations2750275027502750
R-squared0.8760.8770.5840.597
Notes: Robust standard errors are in parentheses, *** denote statistical significance at the 1% level.
Table 5. Mechanism results of marketization effect.
(1)(2)(3)(4)
lnMARKETlnMARKETGIEGIE
CIRP0.023 *** (0.006)0.026 *** (0.006)
CIRP×lnMARKET 0.057 *** (0.012)0.056 *** (0.011)
Constant1.837 *** (0.001)1.552 *** (0.149)0.298 *** (0.003)1.628 *** (0.425)
Control variablesNoYesNoYes
Time FEYesYesYesYes
City FEYesYesYesYes
Observations2750275027502750
R-squared0.9570.9570.5830.597
Notes: Robust standard errors are in parentheses, *** denote statistical significance at the 1% level.
Table 6. Robustness check.
(1)(2)(3)(4)
Post Lagged
One Period
Exclude MDC PC and MIPObservation Window WidthObservation Window Width
(1 Year)(2 Years)
CIRP0.162 *** (0.030)0.080 *** (0.026)0.057 ** (0.026)0.093 *** (0.026)
FDI−0.005(0.003)−0.010 *** (0.003)0.004(0.005)−0.003(0.004)
STRU0.005 *** (0.002)0.006 *** (0.002)−0.001(0.004)−0.003 * (0.002)
FINANCE−0.001 *** (0.000)−0.001 *** (0.000)−0.000(0.000)−0.001 *** (0.000)
lnPERGDP−0.132 *** (0.040)−0.131 *** (0.043)0.062(0.083)−0.072 ** (0.037)
lnHRCAP−0.023(0.023)−0.017(0.024)0.074(0.053)0.037(0.026)
Constant1.662 *** (0.423)1.595 *** (0.452)−0.388(0.847)1.171 *** (0.389)
Time FEYesYesYesYes
City FEYesYesYesYes
Observations275024508251375
R-squared0.5990.5340.730.70
Notes: Robust standard errors are in parentheses, ***, **, and * denote statistical significance at the 1%, 5%, and 10% level, respectively.
Table 7. Heterogeneity of city location regression result.
(1)(2)(3)(4)(5)
EastMiddleWestSouthNorth
CIRP0.058 **0.250 ***0.134 *0.127 ***0.108 ***
(0.025)(0.072)(0.073)(0.031)(0.032)
FDI0.001−0.002−0.005−0.010−0.005 *
(0.004)(0.007)(0.011)(0.006)(0.003)
STRU0.0040.007 ***0.0050.005 **0.004
(0.003)(0.002)(0.005)(0.003)(0.003)
FINANCE−0.001 ***0.000 *−0.001 **−0.001 **−0.001 ***
(0.000)(0.000)(0.001)(0.000)(0.000)
lnPERGDP−0.153 ***−0.033−0.153 *−0.132 ***−0.121
(0.048)(0.049)(0.092)(0.047)(0.074)
lnHRCAP−0.062−0.000−0.014−0.050−0.010
(0.050)(0.018)(0.050)(0.039)(0.029)
Constant2.139 ***0.2731.922 **1.717 ***1.544 **
(0.537)(0.537)(0.935)(0.497)(0.773)
Observations98099078015301220
R-squared0.7370.5020.5470.5740.586
Notes: Robust standard errors are in parentheses, ***, **, and * denote statistical significance at the 1%, 5%, and 10% level, respectively.
Table 8. Heterogeneity of city administrative grade regression result.
(1)(2)
Cities with Low Administrative GradeCities with High Administrative Grade
CIRP0.081 *** (0.027)0.024(0.040)
FDI−0.012 *** (0.004)0.020 *** (0.007)
STRU0.006 *** (0.002)−0.005(0.004)
FINANCE−0.001 *** (0.000)−0.001 *** (0.000)
lnPERGDP−0.132 *** (0.045)−0.066(0.104)
lnHRCAP−0.015(0.024)−0.072(0.056)
Constant1.611 *** (0.469)2.025 * (1.132)
Observations2410340
R-squared0.5360.816
Notes: Robust standard errors are in parentheses, ***, * denote statistical significance at the 1%, 10% level, respectively.
Publisher’s Note: MDPI stays neutral with regard to jurisdictional claims in published maps and institutional affiliations.

