Article

Waste to Hydrogen: Elaboration of Hydroreactive Materials from Magnesium-Aluminum Scrap

by
Olesya A. Buryakovskaya
1,*,
Anna I. Kurbatova
2,
Mikhail S. Vlaskin
1,
George E. Valyano
1,
Anatoly V. Grigorenko
1,
Grayr N. Ambaryan
1 and
Aleksandr O. Dudoladov
1
1
Laboratory of Energy Storage Substances, Joint Institute for High Temperatures of the Russian Academy of Sciences, Izhorskaya Street, 13, Build. 2, 125412 Moscow, Russia
2
Department of Environmental Safety and Product Quality Management, Institute of Environmental Engineering, Peoples’ Friendship University of Russia (RUDN University), 6 Miklukho-Maklaya Street, 117198 Moscow, Russia
*
Author to whom correspondence should be addressed.
Sustainability 2022, 14(8), 4496; https://doi.org/10.3390/su14084496
Submission received: 19 February 2022 / Revised: 26 March 2022 / Accepted: 7 April 2022 / Published: 10 April 2022

Abstract

:
Ball-milled hydroreactive powders of Mg-Al scrap with 20 wt.% additive (Wood’s alloy, KCl, and their mixture) and with no additives were manufactured. Their hydrogen yields and reaction rates in a 3.5 wt.% NaCl aqueous solution at 15–35 °C were compared. In the beginning of the reaction, samples with KCl (20 wt.%) and Wood’s alloy (10 wt.%) with KCl (10 wt.%) provided the highest and second-highest reaction rates, respectively. However, their hydrogen yields after 4 h were correspondingly the lowest and second-lowest percentages—(45.6 ± 4.4)% and (56.0 ± 1.2)% at 35 °C. At the same temperature, samples with 20 wt.% Wood’s alloy and with no additives demonstrated the highest hydrogen yields of (73.5 ± 10.0)% and (70.6 ± 2.5)%, correspondingly, while their respective maximum reaction rates were the lowest and second-lowest. The variations in reaction kinetics for the powders can be explained by the difference in their particle sizes (apparently affecting specific surface area), the crystal lattice defects accumulated during ball milling, favoring pitting corrosion, the morphology of the solid reaction product covering the particles, and the contradicting effects from the potential formation of reaction-enhancing microgalvanic cells intended to induce anodic dissolution of Mg in conductive media and reaction-hindering crystal-grain-screening compounds of the alloy and metal scrap components.

1. Introduction

In recent years, waste management has become one of the mainstream environmental topics for scientists, entrepreneurs, and politicians worldwide. According to the report ‘What a Waste 2.0: A Global Snapshot of Solid Waste Management to 2050’, the global annual waste generation is expected to rise from 2.01 billion tons in 2016 to 3.5 billion tons in 2050. Today, in high-income countries, about 40% of waste is disposed of in landfills, another 40% undergoes recycling, and energy is recovered from 20% of waste. In low-income countries, over 90% of waste is either burned or openly dumped, and only 4% of waste is recycled. In Russia, almost 96% of solid waste—with metals contributing 4% to the total amount—is buried in landfills; municipal solid waste is collected as mixed aggregations without any sorting efforts and has a moisture content between 30–40% [1,2].
Some sorts of metal waste can be effectively recycled on the condition that its separate collection and proper disposal are ensured. In study [3], the sustainability of different approaches to collecting the metal fraction of household waste was examined. The results confirmed that, in terms of greenhouse gas emissions, separate collection and recycling of the municipal solid waste metallic fraction at residential properties represented the preferable option compared to a scenario with no source sorting and incineration of everything. However, such measures of efficient metal waste handling are still not implemented widely. Not only households, but many small metal mechanical enterprises as well, negatively affect the environment by inadequate disposal of manufacturing and raw material wastes generated in their production processes [4].
Metal processing scrap of light metals, such as magnesium, aluminum, and their alloys, can be used for in situ hydrogen production by their oxidation in aqueous media [5]. The typical solid reaction products—Mg(OH)2, Al(OH)3, and AlOOH—do not produce any negative environmental impacts and can be used as raw stuff for the manufacture of various valuable materials. For example, MgO-based composites are currently attracting attention as a durable concrete for sustainable and energy-efficient building design [6]. Al2O3-based materials are used for the manufacture of heat-resistant ceramics, porous catalyst carriers, synthetic sapphire for microelectronics, etc. [7]. Additionally, the said solid reaction by-products can be returned to the metal production cycles and, thereby, eliminate the process stages of mining, separation of aluminum or magnesium compounds from their ores, and disposal of mud that is produced in large amounts [8]. If a scenario of secondary aluminum or magnesium production by melting, refining, and casting is preferred, some amount of magnesium- and aluminum-based scrap can be used to produce hydrogen that, in turn, can be further utilized to produce energy for the furnaces of the secondary metal industry itself [9].
Today, large amounts of Mg waste in the form of chips and discards are generated from the machining of sheets and castings [10]. Up to 30% of Mg is lost as scrap during manufacturing [11]. Extensive mechanical processing is required for the production of magnesium-based components for the automobile and aerospace industries (engine blocks, oil pans, transmission housings, seat frames, etc.) [12]. Widely used construction alloys for cyclically loaded structural applications include the NZK (Mg-Nd-Zn-Zr), AZ91D, GW103, and AM-SC grades [13]. ML10 and ML5 casting alloys have elemental compositions generally corresponding to NZK and AZ91D respectively. ML10 is applied for the loaded components of engines, instruments, and equipment requiring high levels of leak tightness. ML5 is used for manufacturing components of plane wings, chassis, and control elements, as well as for large shaped castings, such as fan housings (290 kg), compressor housings (720 kg), helicopter gearbox housings (340 kg), and other complex contoured parts [14]. Thus, magnesium-based casting alloys represent materials for which processing generates plenty of waste chips, shavings, and cuts, and this scrap should be effectively utilized.
Under normal conditions, the reaction between aluminum or magnesium and water barely proceeds because of a poorly permeable oxide film on the surfaces of these metals and the formation of a dense layer of reaction products thereon. Therefore, higher temperatures or special activation methods must be employed to carry out the reaction. Today, many studies are known on hydrogen production from aluminum or magnesium scrap and water or aqueous solutions. In pioneer studies [15,16,17,18], low-grade magnesium scrap in bulk form has been converted into hydrogen using titanium platinum-coated or stainless steel nets as a catalyst (in [15], as a grinding surface as well) and either natural sea water or a 3.5 wt.% NaCl aqueous solution, either with citric acid or without it. In study [19], different types of aluminum waste (foil, capacitor casings) were hydrothermally treated at temperatures of 230–340 °C under the corresponding saturated steam pressure, and it was established that the reaction mechanism was similar to that for pure aluminum powder. Another widely-known method for producing hydrogen from aluminum is the implementation of alkali solutions, most commonly KOH and NaOH [20,21,22], under moderate (below 100 °C) and hydrothermal [23] conditions.
A promising approach for obtaining hydrogen from aluminum or magnesium oxidation in aqueous media at moderate conditions without the implementation of acids or alkali solutions is the preparation of powder materials by ball milling [5,24]. Aluminum or magnesium in the form of powders or larger particles can be ball-milled either as they are or with various additives. Early studies [25,26] on magnesium ball milling have demonstrated a significant decrease in the corrosion resistance of ball-milled magnesium both in pure water and in conductive solutions. It was established as well that a ball-milled composition of Mg and Ni (10 at.%) powders substantially represented a so-called ‘mechanical alloy’, wherein Ni sites acted as cathodes while Mg sites acted as anodes. Due to a high electrode potential difference between Mg and Ni, intensive Mg galvanic corrosion in the conductive media (1 M KCl aqueous solution) was observed. The same ‘galvanic’ effects in sea water or its simulation (3.5 wt.% NaCl aqueous solution) were investigated also for a wide range of additives to magnesium: Zn, In, Co, Bi, Al, Fe, Ni, Cu, Sn, Ga, Ce, and La [27,28,29,30,31,32,33,34,35,36,37,38,39,40]. Studies [41,42] have been devoted to the investigation of the effect of other salt solutions (0.5–2.5 M NiCl2 solution; NiCl2 added to Marmara and Aegean sea water; 1 M CoCl2, CuCl2, FeCl3, and MnCl2 solutions) on magnesium powder obtained by the ball milling of scraps for 3–30 h. In other papers, different salts (primarily metal chlorides: AlCl3, NaCl, and KCl) have been added to magnesium [43,44] or aluminum [45,46,47,48] powder, and the intensification of ball-milling effects (the formation of metal lattice structure defects, metal particle size reduction, etc.) has been demonstrated. In recent studies [49,50,51] devoted to the elaboration of hydroreactive powders from magnesium waste, simulated sea water (3.5 wt.% NaCl solution) has been used as aqueous media as well, and a complex ball-milling process has been implemented that included the simultaneous or chronological addition of 5 wt.% C (carbon) and Ni or AlCl3 powders.
As it can be concluded from the survey of studies on hydrogen production from the oxidation of Al- and Mg-based materials in aqueous media, this subject remains relevant. A number of methods for manufacturing metal scrap-based compositions for hydrogen production have been tested. The ball milling of Mg- and Al-based disperse materials with metal or salt additives, as well as the implementation of sea water or its simulation with NaCl aqueous solutions, are still relevant. The present study is focused on the elaboration of hydroreactive materials from Mg-Al alloy scrap by its ball milling with commercially available additives in order to test their hydrogen generation properties in simulated sea water. The main aim of this study is to compare the performances (hydrogen yields and evolution rates) of different powder materials ball-milled for 4 h both with 20 wt.% additives (KCl salt, Wood’s alloy (composed of low-melting-point metals), and their mixture) and without additives. The compositions and content of the additives, as well as the ball-milling duration, were selected based on the results from preceding studies.

2. Materials and Methods

2.1. Original Materials and Powder Preparation Procedure

The original materials for the preparation of hydroreactive powders included chemically pure KCl salt (National State Standard GOST 4234-77, rev. 1–2, ‘VEKTON’ JSC, Saint-Petersburg, Russia); pure Wood’s metal alloy containing 9.7 wt.% Sn, 40.4 wt.% Pb, 9.67 wt.% Cd, and 40 wt.% Bi (Technical Specification No. 6-09-4064-87, ‘Rushim’ LLC, Moscow, Russia; solidification temperature—71.0 °C); and metal scrap composed mainly of waste chips of a magnesium-aluminum alloy of the ML5 grade with some amount of ML10 shavings (National State Standard GOST 2856-79) originated from mechanical processing at an aircraft manufacturing plant. The original magnesium-aluminum scrap and chips manufactured from melted Wood’s alloy pellets are illustrated in Figure 1. For the preparation of the salt aqueous solution, deionized water and chemically pure NaCl salt (National State Standard GOST 4233-77, ‘VEKTON’ JSC, Saint-Petersburg, Russia) were used.
Prior to ball milling, in order to remove lubricating oil remaining on the surface of the scrap particles after mechanical processing, a degreasing procedure was carried out. The degreasing process included the immersion of a scrap portion into a flask filled with pure acetonitrile (Technical Specification No. 2636-092-44493179-04, ‘EKOS-1’ JSC, Moscow, Russia), ultrasonic cleaning for 1 h in an ultrasonic bath sonicator (PSB-2835-05; ‘PSB-Gals’ Ltd., Moscow, Russia), and further stirring of the ‘scrap–acetonitrile suspension’ by a magnetic mixer (C-MAG; ‘HS 7 IKA-Werke’ GmbH & Co. KG, Staufen, Germany) with a stirring bar for 1 h. Then, the ‘used’ acetonitrile portion was changed for a fresh one, and ultrasonic cleaning for 1 h and stirring for 1 h were repeated. The degreased metal scrap was separated from the acetonitrile and dried at ambient temperature for 24 h.
For the ball milling procedure, a 50 mL milling pot of corundum and stainless steel and 24 stainless steel milling balls of 10 mm in diameter were used. The milling pot was filled with the original materials and balls in a glove box (G-BOX-F-290; ‘FUMATECH’ Ltd., Novosibirsk, Russia) under pure argon (99.993%, National State Standard GOST 10157-79, ‘NII KM’ Ltd., Moscow, Russia). For all samples, the ball : powder mass ratio was 24:1. Ball milling was performed using a centrifugal ball mill (S 100; ‘Retsch’ GmbH, Haan, Germany) for 4 h at a rotational speed of 580 rpm.

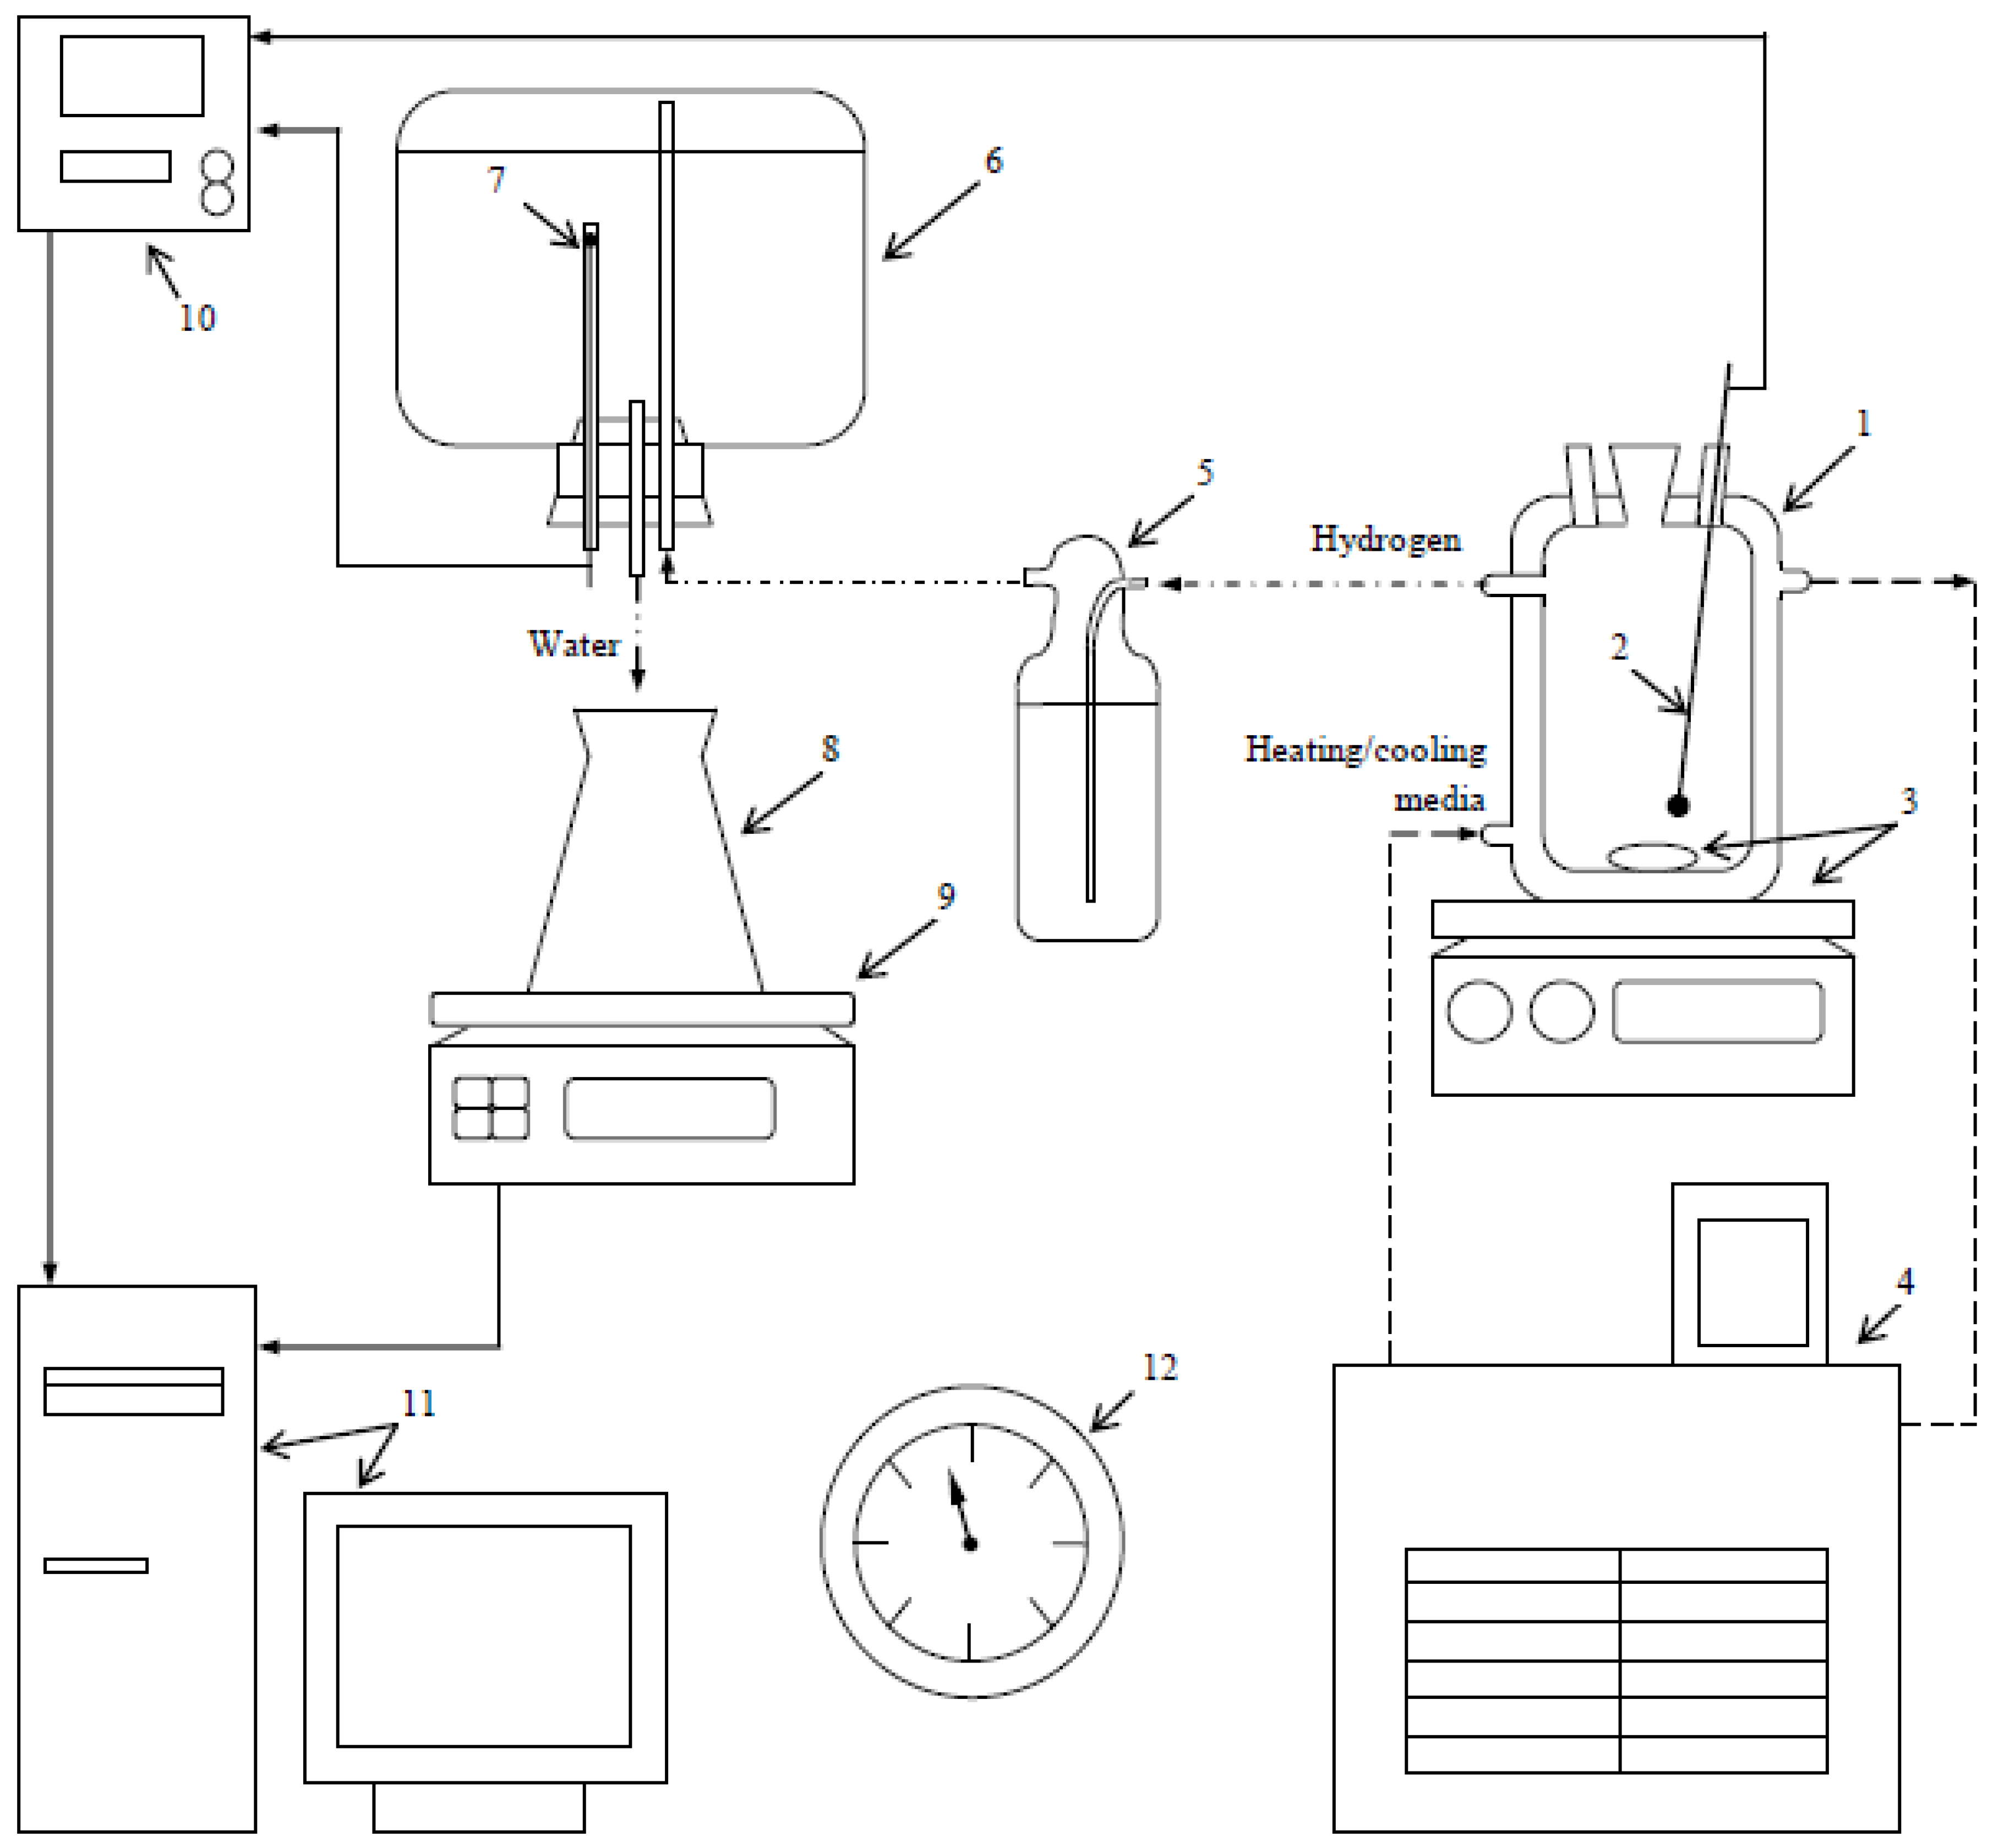
2.2. Experimental Facility and Procedure

In the experiments on hydrogen evolution kinetics, an experimental facility schematically shown in Figure 2 was employed. The main functional elements of the facility included a 500 mL reactor (Simax glass) with its heating and cooling jacket connected—for experiments at 25 °C and higher temperatures—to a heater (CC-308B; ‘ONE Peter Huber Kältemaschinenbau’ GmbH, Offenburg, Germany) or—for experiments at temperatures below 25 °C—to a cryothermostat (LOIP FT-311-80; ‘Laboratory Equipment and Instruments’ Ltd., Saint-Petersburg, Russia), and the gas exhaust outlet was connected to a Drexel flask connected, in turn, to a glass vessel filled with water. The said water was ejected by incoming hydrogen into a flask placed on scales (ATL-8200d1-I; ‘Acculab Sartorius Group’, New York, USA) continuously transmitting data to a personal computer. The mixture in the reactor was stirred by means of a magnetic mixer (C-MAG HS 7; ‘IKA-Werke’ GmbH & Co. KG, Staufen, Germany) with a stirring bar. The temperatures in the reactor and in the glass vessel containing water and hydrogen were measured, respectively, with an L-type thermocouple (TP.KhK(L)-K11; ‘Relsib’ LLC, Novosibirsk, Russia) and a Pt100-type resistance temperature detector (TS-1288 F/11; ‘Elemer’ LLC, Podolsk, Russia) connected to a multichannel thermometer (TM 5103; ‘Elemer’ LLC, Podolsk, Russia) for data collection and storage. The atmosphere pressure was measured by an aneroid barometer (BTKSN-18; Technical Specification No. 1-099-20-85, ‘UTYOS’ JSC, Ulyanovsk, Russia).
The experimental procedure included pouring into the reactor 400 mL of 3.5 wt.% NaCl solution and heating or cooling it to the desired temperature under stirring. Upon temperature stabilization, 0.75 g of powder was loaded into the reactor. The hydrogen produced during the reaction was bubbled in a Drexel flask and then passed into a glass vessel filled with water. The water ejected by incoming hydrogen was collected in a flask placed onto scales, and its mass readings were transmitted to a computer for recording and storage. The data on the temperatures in the reactor and glass vessel were continuously recorded as well. The atmospheric pressure values were fixed at the beginning and in the end of each experiment. The duration of each experiment was 4 h. The resulting solid product was separated from the water using a Bunsen flask, Buchner funnel, paper filter, and circulating water vacuum pump (SHZ-D III; ‘FAITHFUL Instrument Co.’, Ltd., Hebei, China) and was dried at ambient temperature.
The data on the ejected water volume (mass), temperature in the glass vessel, and atmospheric pressure were used to calculate the hydrogen volume values at standard conditions (101,325 Pa, 0 °C) using the ideal gas law. In the present study, kinetic curves represented plots of hydrogen yield vs. time. The hydrogen yield represented the ratio of the hydrogen volume (normalized to the standard conditions) obtained in the experiments to the theoretical maximum hydrogen volume. The theoretical maximum hydrogen volume was obtained providing that the total amount of hydroreactive components in a sample was consumed by the reaction. The calculation of the hydrogen yield was performed using the following equation:
α ( τ ) = V ( τ ) V max ,
where α(τ) is the hydrogen yield (%), V(τ) is the hydrogen volume (mL) produced in the experiment, τ is time (s), and Vmax is the theoretical maximum hydrogen volume (mL). For each powder sample and each tested temperature point, a series of three experiments was carried out. Each of the kinetic curves was obtained by averaging the data sets obtained from the three experiments, and the standard deviations for all of them were provided.
The reaction rate constants were derived from the approximation of the kinetic curves by the Avrami–Erofeev equation for heterogeneous reactions [52]:
α ( τ ) = 1 e x p [ ( k · τ ) n ]   ,
where α(τ) is the hydrogen yield (%), τ is time (s), k is the reaction rate constant (s−1), and n is a nondimensional parameter depending on the nucleation rate law (derived from kinetic curve approximation as well).
The reaction rate constants were employed for the calculation of the activation energy using the Arrhenius relationship [52] in the following form:
ln ( k ) = ln ( A ) E a R · 1 T ,
where k is the reaction rate constant (s−1), Ea is the activation energy (J), R is the universal gas constant, T is temperature (K), and A is the pre-exponential factor (frequency factor).

2.3. Methods and Equipment for Sample Analyzing

For the hydroreactive powders prepared by high-energy ball milling and solid reaction products, X-ray diffraction (XRD) analysis was performed using a ‘Difrey 401’ diffractometer (‘Scientific Instruments’ JSC, Saint Petersburg, Russia) with Cr-Kα radiation (wavelength of 0.22909 nm). The XRD patterns were processed using a Powder Diffraction File™ database (PDF®) from the International Centre for Diffraction Data (ICDD).
Visual imaging investigation and particle size measurements of the manufactured powder samples were performed using a Bio 6 model optical microscope equipped with a high-resolution camera (UCMOS 10000KPA; ‘Altami’ LLC, Saint Petersburg, Russia). Particle size measurements in the microscope images were carried out by means of ‘Altami Studio 3.5’ software. The image processing procedure included ‘capturing’ particles in the image by adjusting rendering settings, contouring, and further calculation of the contour sizes (maximum Feret diameters) using the preliminary obtained calibration data.
The surface morphology of the manufactured powder samples and reaction products was investigated by scanning electron microscopy (SEM) in backscattered electron (BSE) imaging mode. For these investigations, a NOVA NanoSem 650 scanning electron microscope (FEI Co., Hillsboro, OR, USA) with an annular backscattered electron detector was used.

3. Results and Discussion

3.1. Characteristics of Hydroreactive Powders

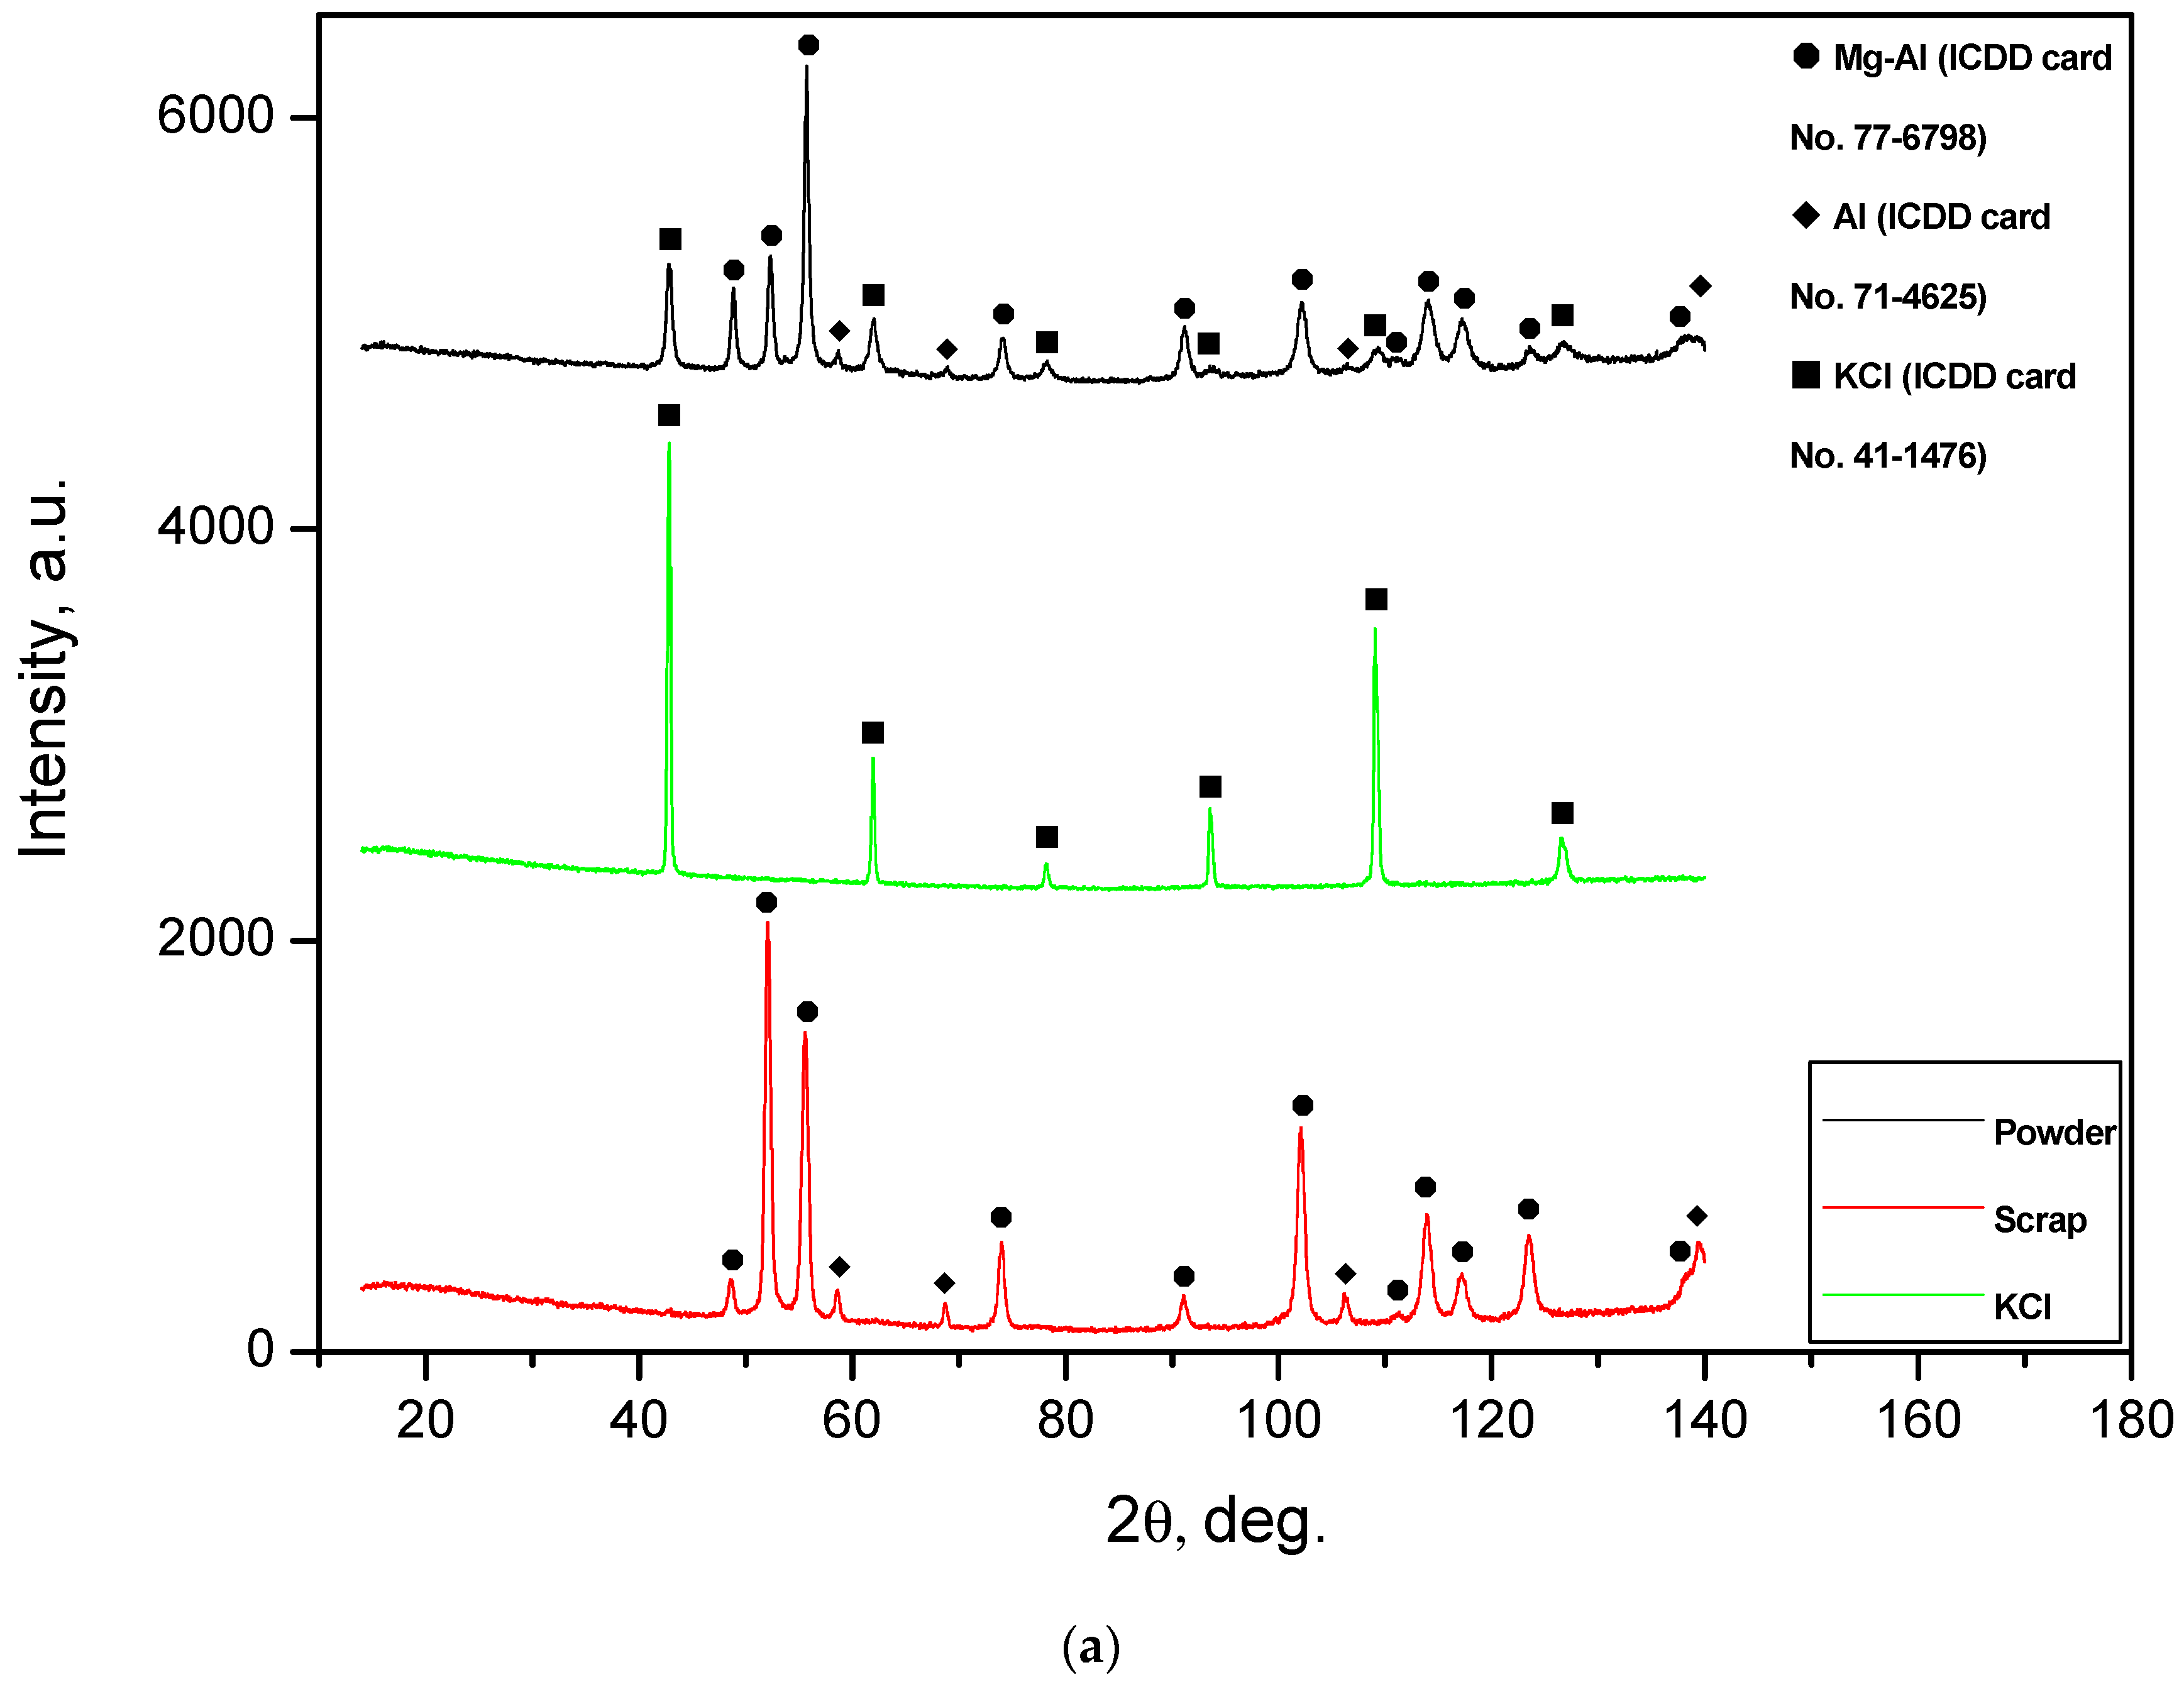
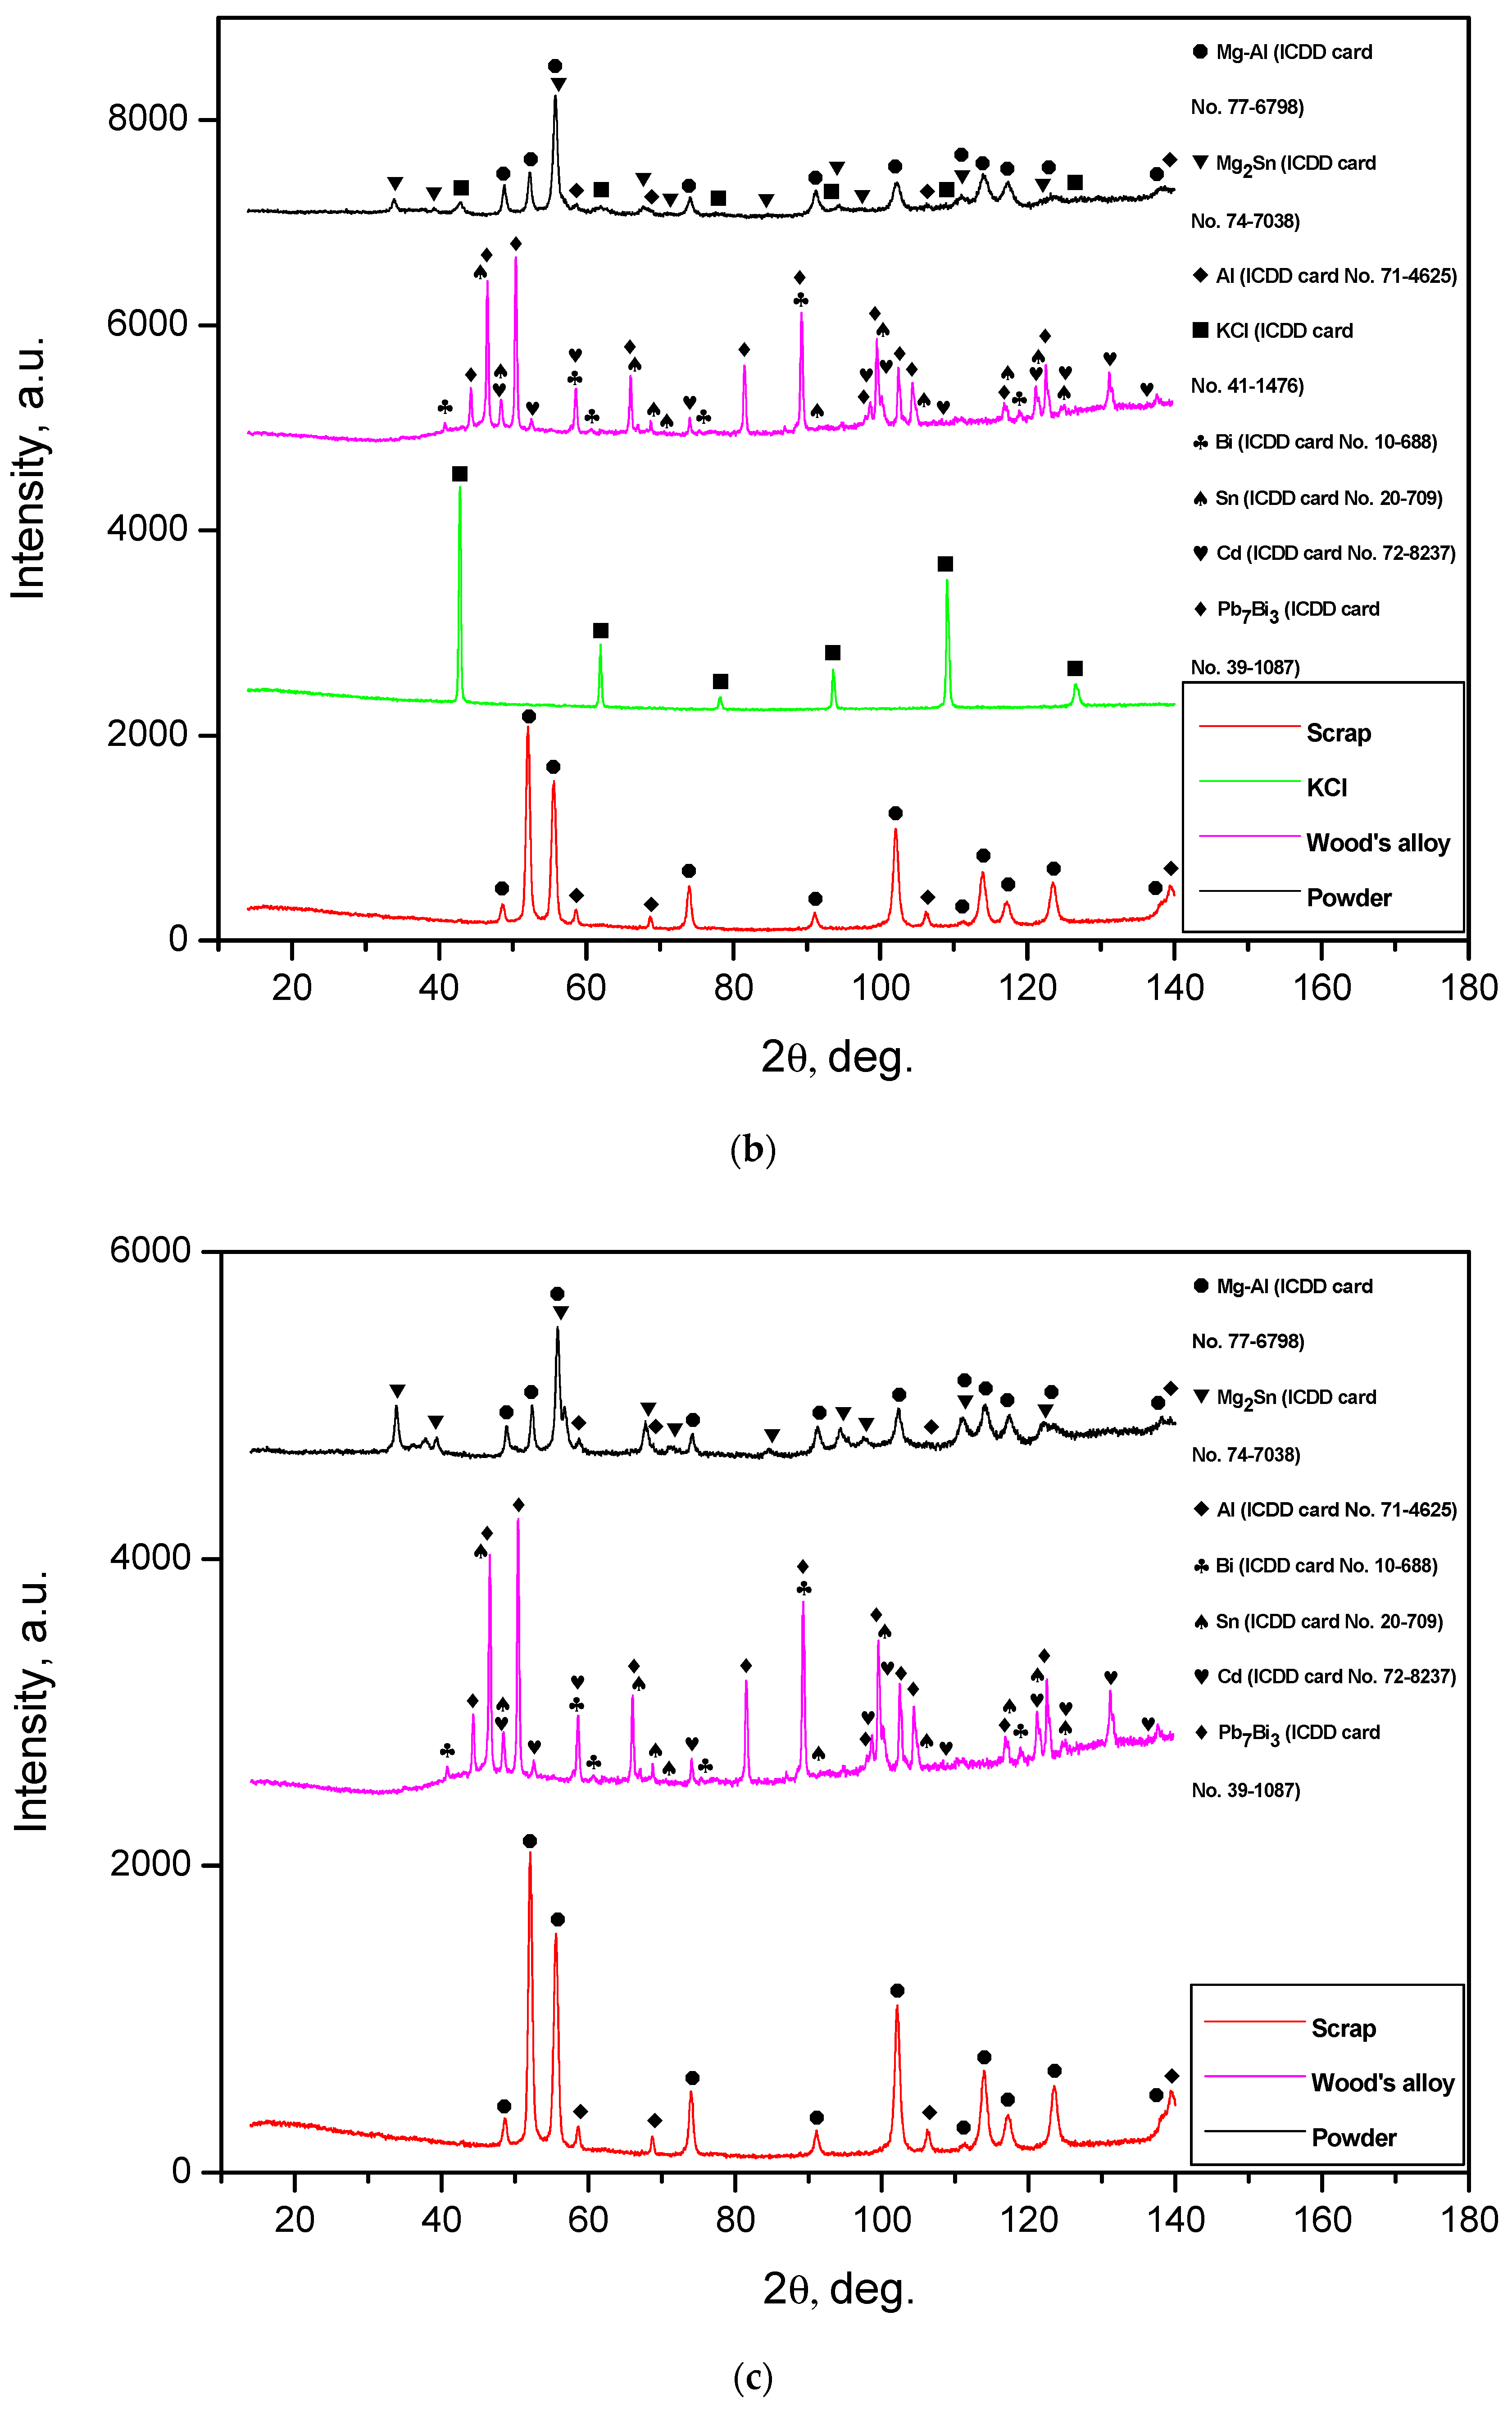
3.1.1. X-ray Diffraction Analysis

For the experiments, powder samples of four different types were prepared by ball milling. A first sample contained metal scrap (80 wt.%) and KCl salt (20 wt.%); a second sample was composed of metal scrap (80 wt.%), KCl, and Wood’s metal alloy (10 wt.%); a third sample was made of metal scrap (80 wt.%) and Wood’s metal alloy (20 wt.%); and a fourth sample was metal scrap (100 wt.%) without additives.
The XRD patterns for the powder samples supplemented with ones for the original materials (metal scrap, salt, and alloy) are given in Figure 3. It was concluded from the XRD analysis results that all samples contained a solid solution of aluminum in the primary hexagonal close-packed magnesium lattice and face-centered cubic lattice of the aluminum phase. ML5 is a Mg-Al-Zn-type alloy with concentrations of the major elements generally close to those of the AZ91 alloy, which is composed mainly of α-phase Mg and β-phase Mg17Al12 [53]. Presumably, the identification of Al in the ML5 sample may be associated with the effect of the enrichment of the Mg17Al12 phase with Al after a thermal treatment (holding at 420 °C for 12 h and aging at 200 °C for 8 h) standard for this alloy grade. In report [54], the content of Mg17Al12 in an ML5 alloy sample was 5.31 wt.%, with the content of Al in the Mg17Al12 phase achieving as much as 3.42 wt.% of the total alloy sample mass.
For the samples ball-milled with salt, a KCl phase was observed. From a comparison of the XRD patterns for the powder samples with those for pure KCl, it can be seen that several KCl peaks were barely distinguishable in the XRD patterns of the powders.
Wood’s metal alloy is composed of Pb7Bi3 solid solution (hexagonal close-packed lattice), Bi (rhombohedral lattice), Sn (tetragonal lattice), and Cd (hexagonal lattice) phases. The powders comprising Wood’s metal alloy have an Mg2Sn phase, which apparently originated from ball milling under increased temperature due to heat release. Thus, the presence of Sn from Wood’s alloy in the powder samples was confirmed, while no other Wood’s alloy components were detected by the XRD analysis.
It can be seen that the peak intensities of the Mg-Al and Al phases for several metal scrap peaks were higher than those for the powder samples. Such a result can be ascribed to a partially textured structure of the original metal scrap (the orientation of crystalline grains along a certain crystallographic direction). A slight widening of the diffraction peaks for the Mg-Al phase was observed: the peaks for the sample of Al-Mg and Wood’s metal alloy were wider than those for the sample of Mg-Al, KCl, and Wood’s metal alloy, and for the latter, they were wider than those for both the Mg-Al and KCl sample and Mg-Al without additives. Such an effect obviously resulted from the difference in the crystallite sizes of the samples. It was demonstrated that, during ball milling, hard and brittle salt particles were fractured and contributed greatly to ‘cutting’ ductile Al-Mg particles into pieces with crystalline size reduction [48], while Wood’s alloy did not produce such an impact. In a preceding study, it was demonstrated as well that, due to their higher hardness, KCl particles provided a greater enhancement of ball-milled Mg hydrogen production properties than NaCl [43] (which is why, in this study, KCl was used for ball milling).
For all the samples, no Fe contamination from ball milling with steel balls was detected by the XRD analysis. However, it was estimated from the change in the ball weight: the initial ball mass was 96.6050 g; after the first ball-milling cycle, it reduced to 96.5999 g; and after four cycles of ball milling, it decreased to 96.5863 g. Therefore, the average ball mass reduction per ball-milling cycle was about 0.005 g per 4 g of powder sample, which corresponded to the Fe content of ~0.1 wt.%. The estimated value is in good agreement with the iron contamination result (up to 0.1 wt.%) for the ball-milled Mg powders measured in study [26].

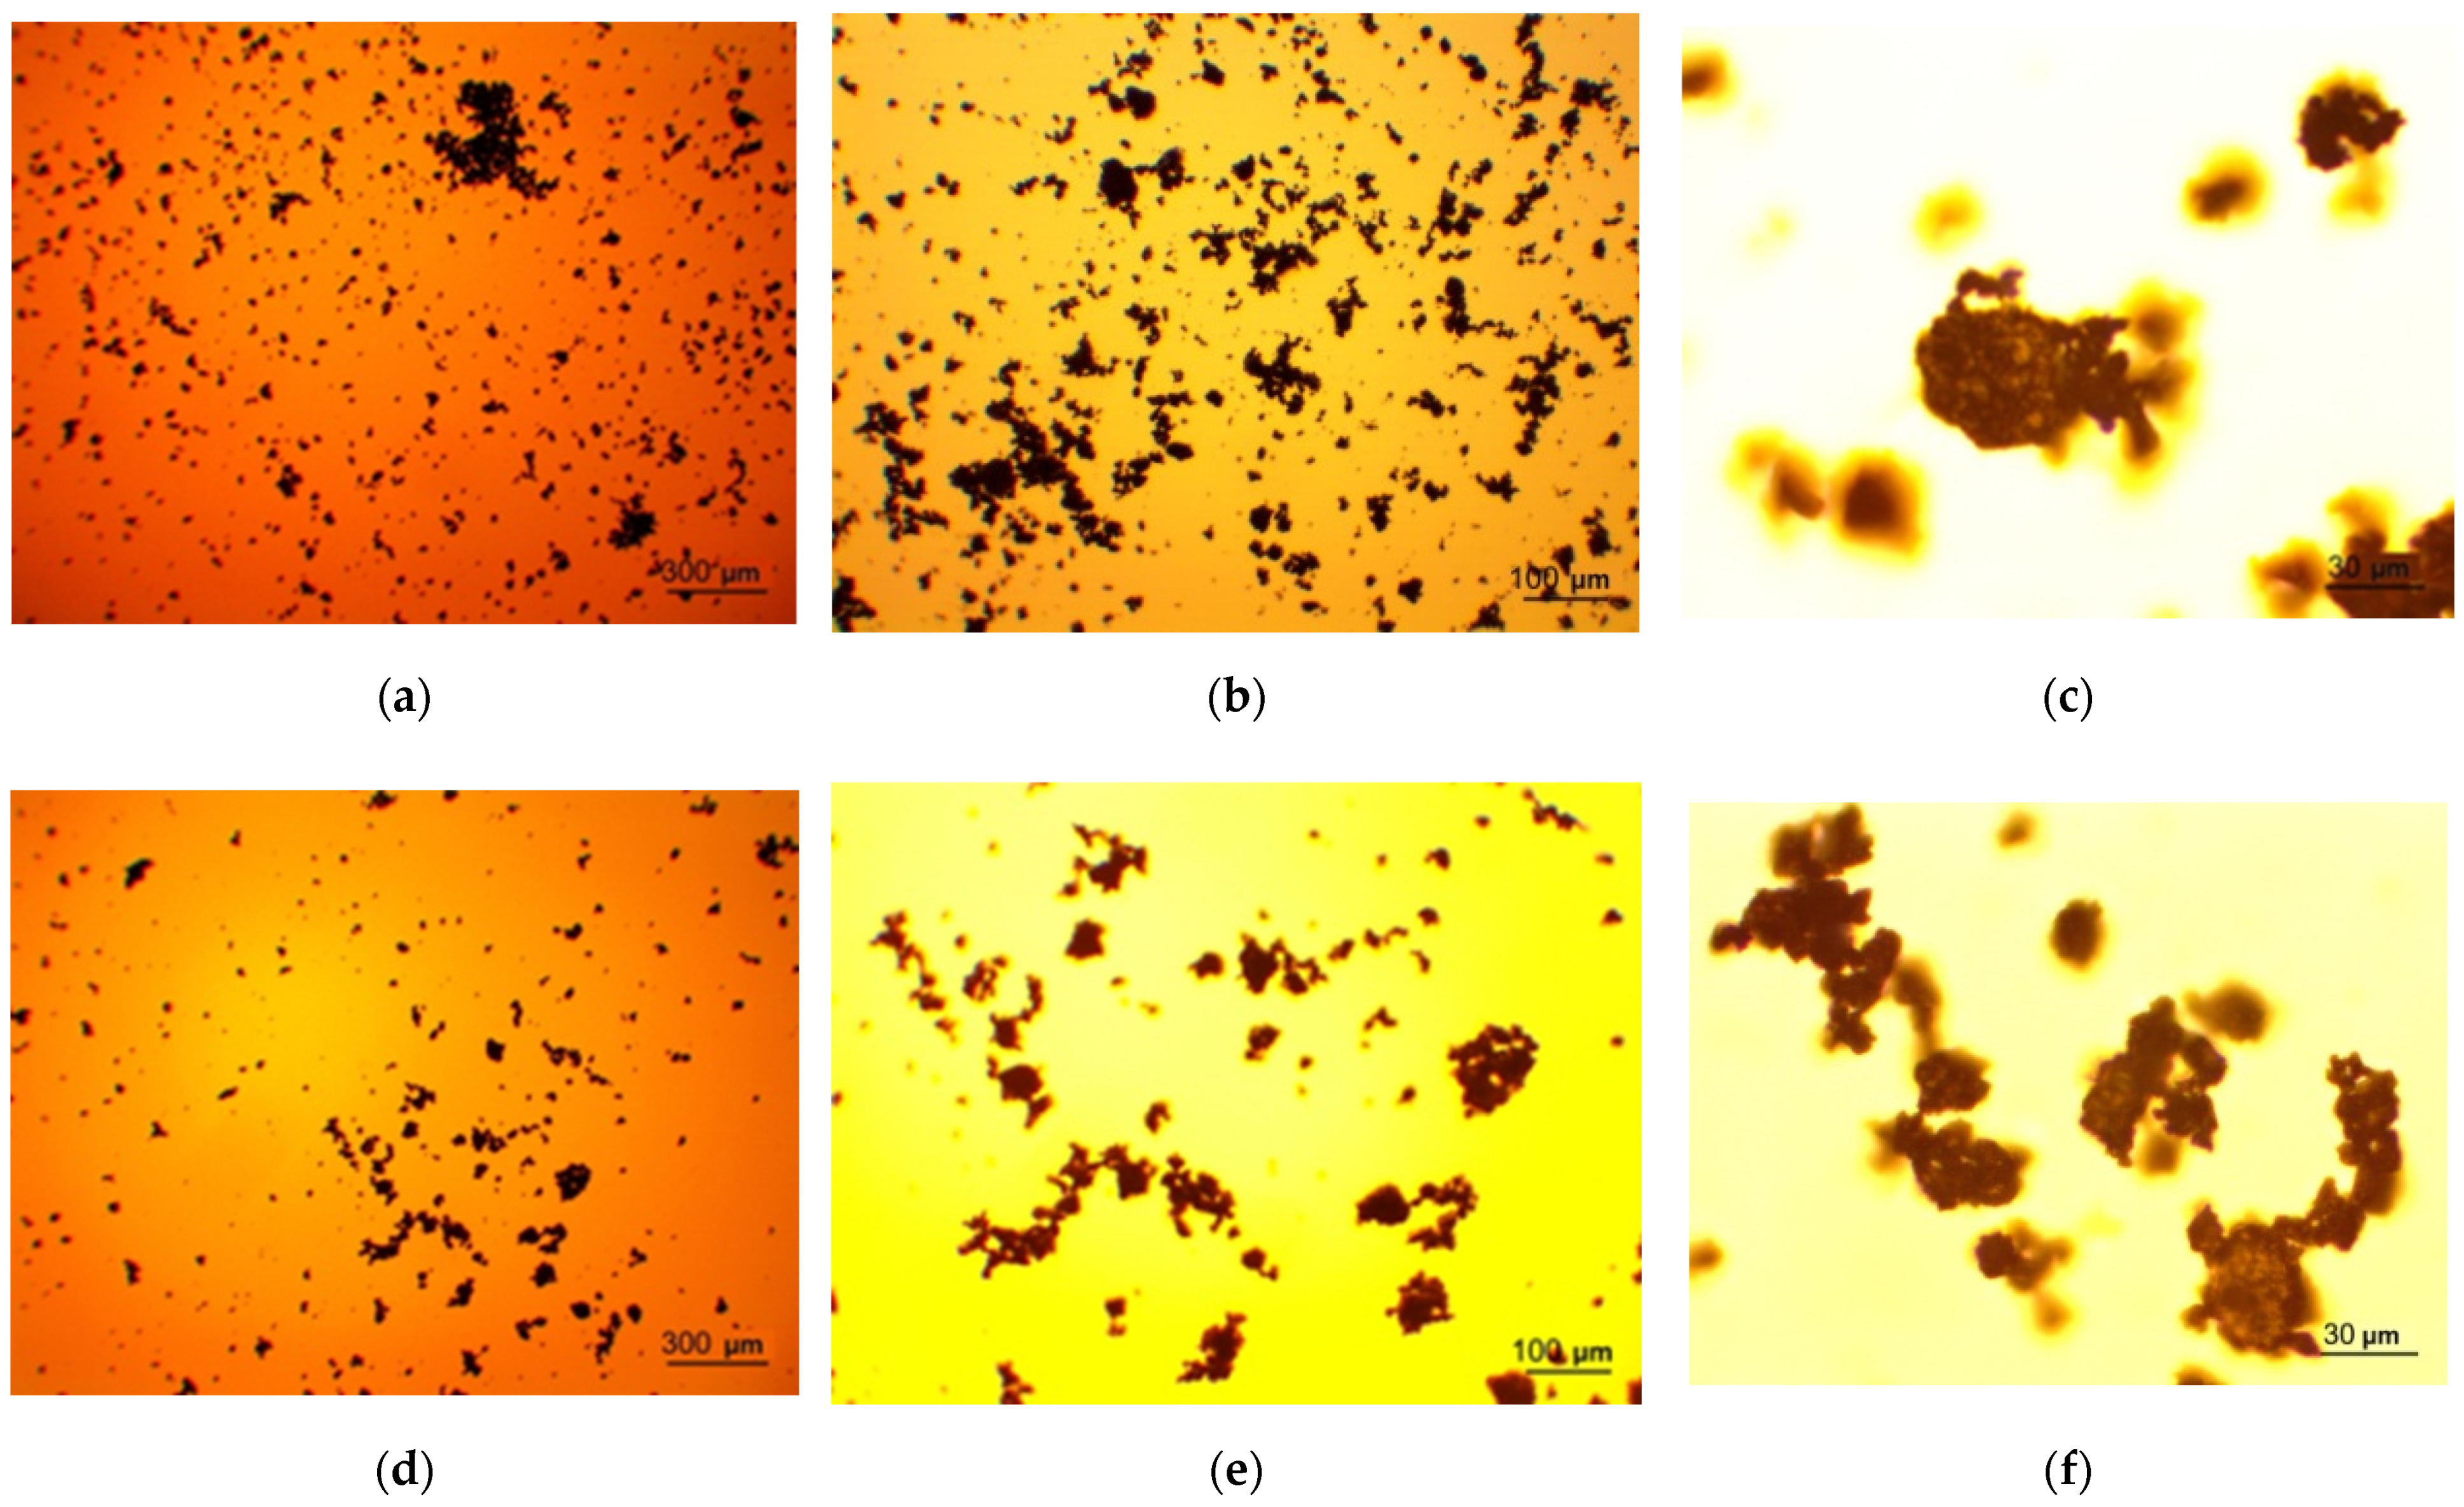
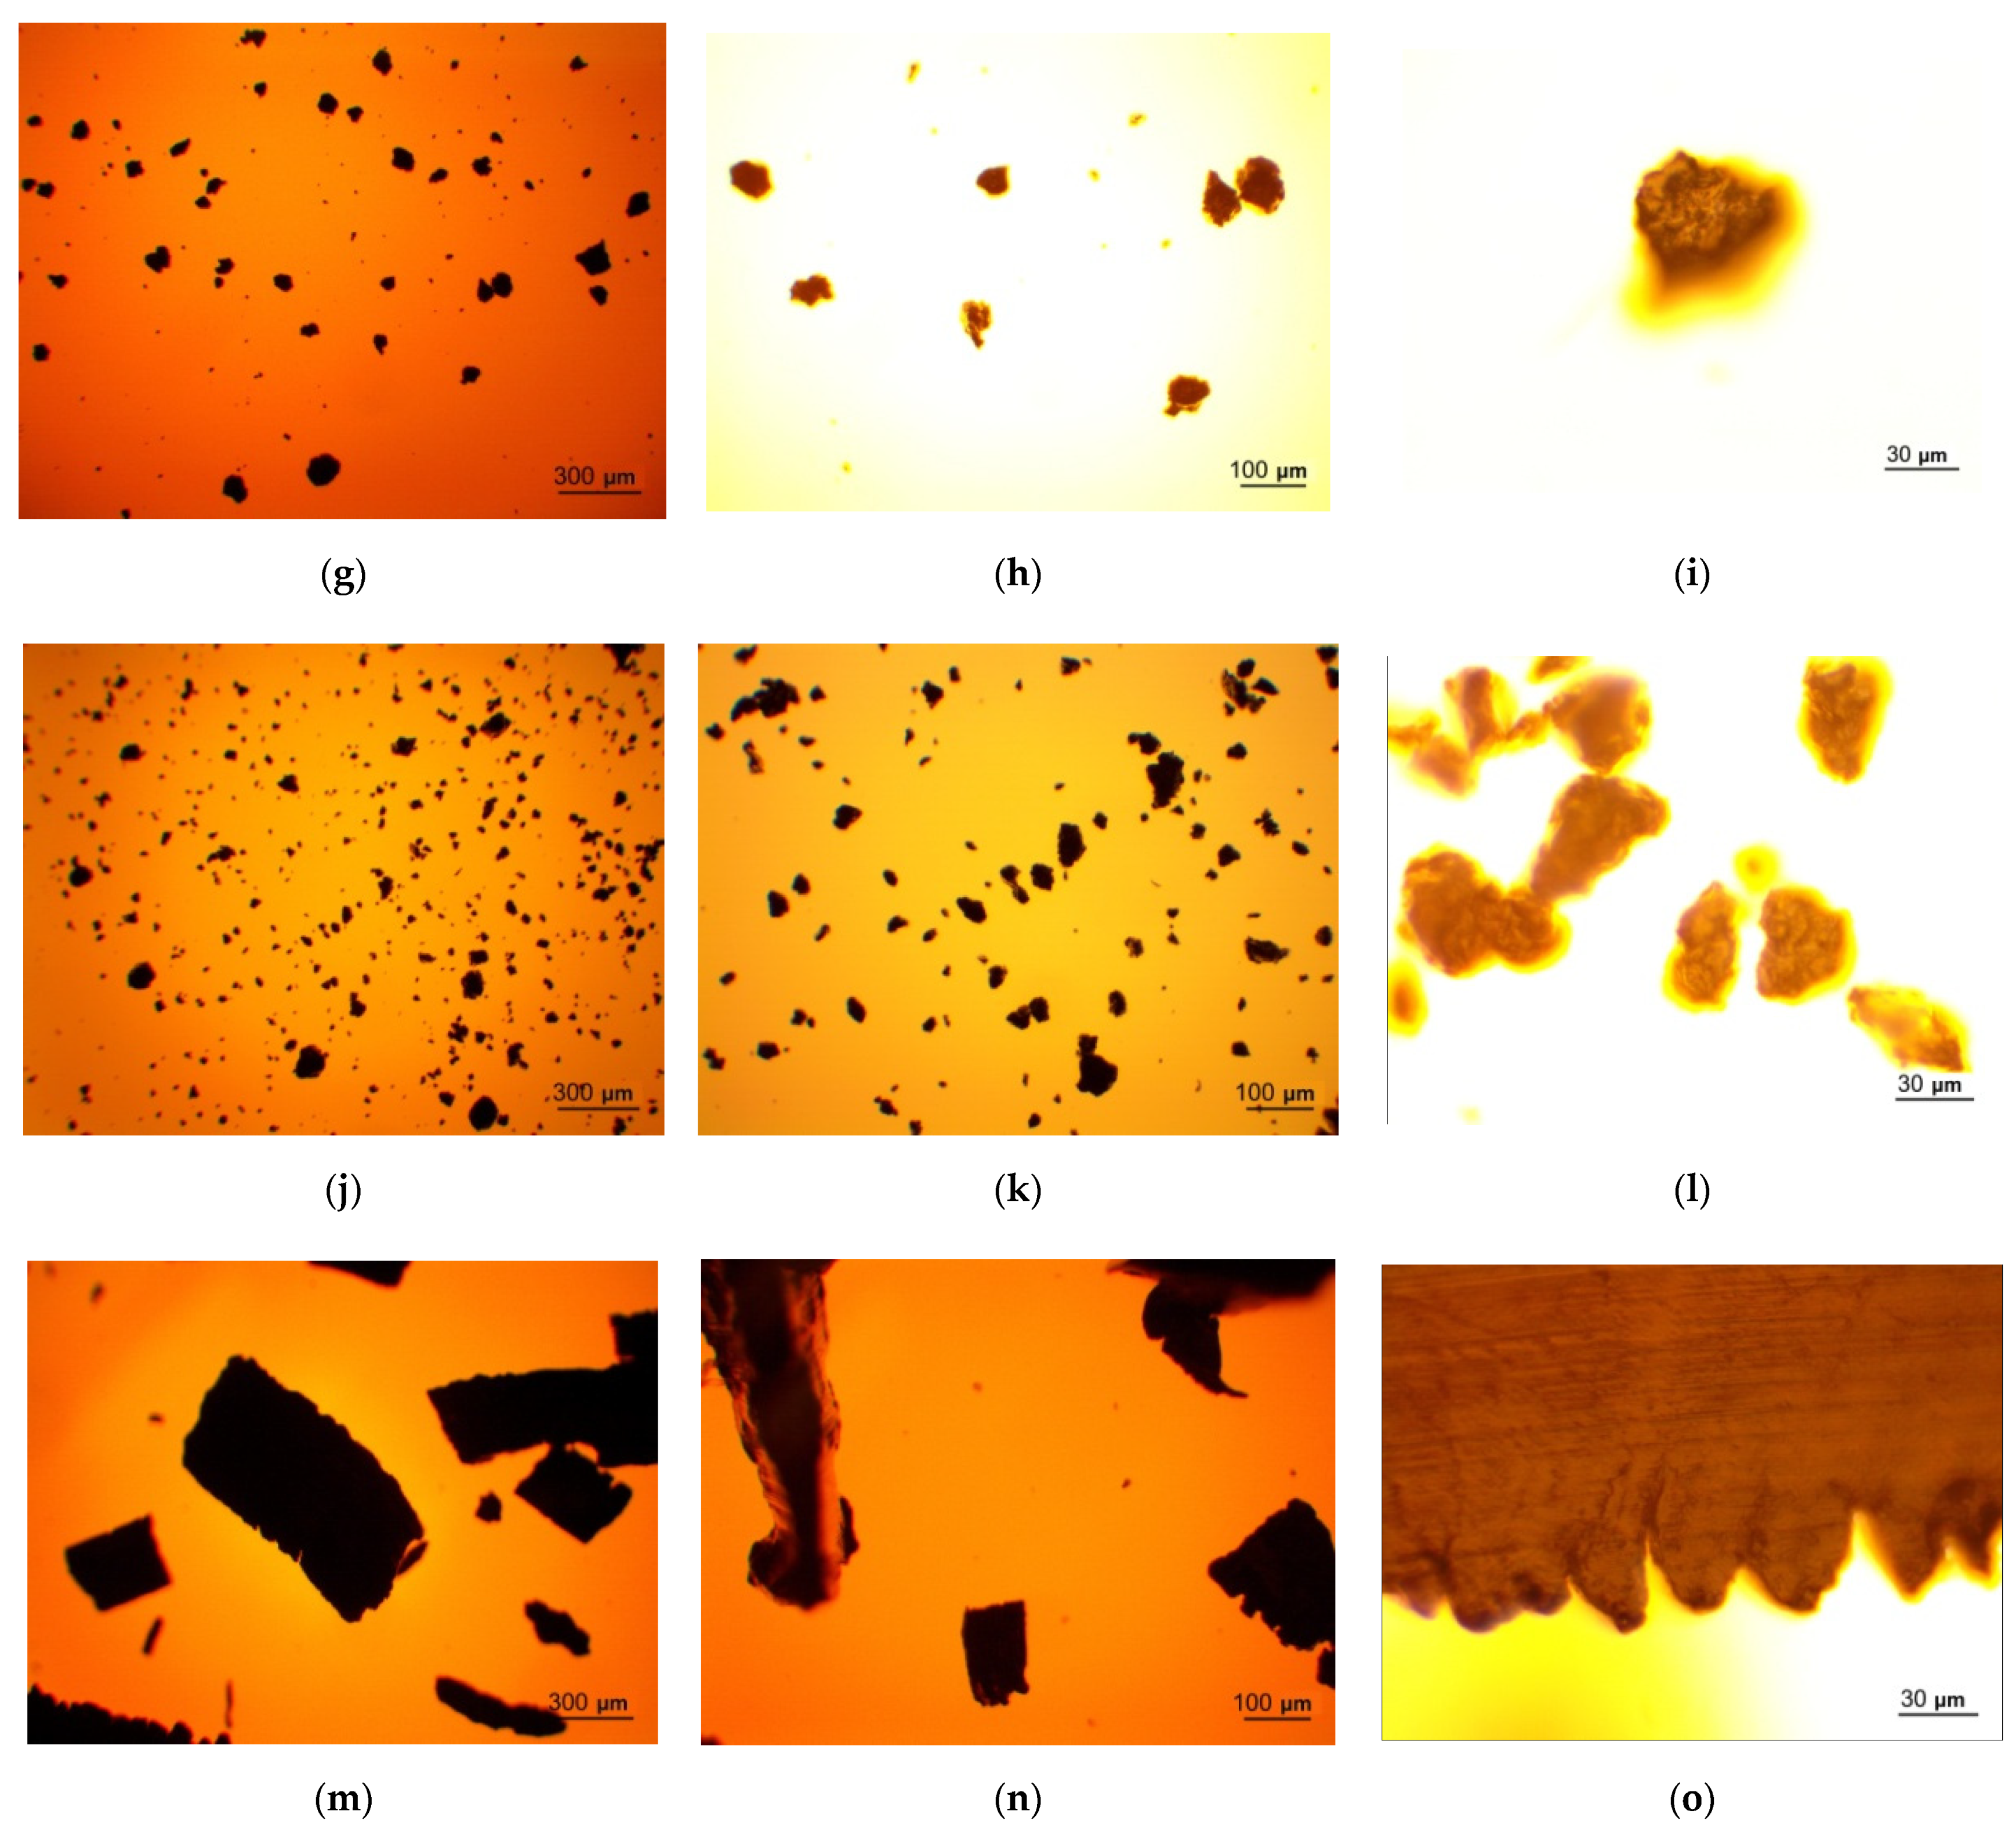
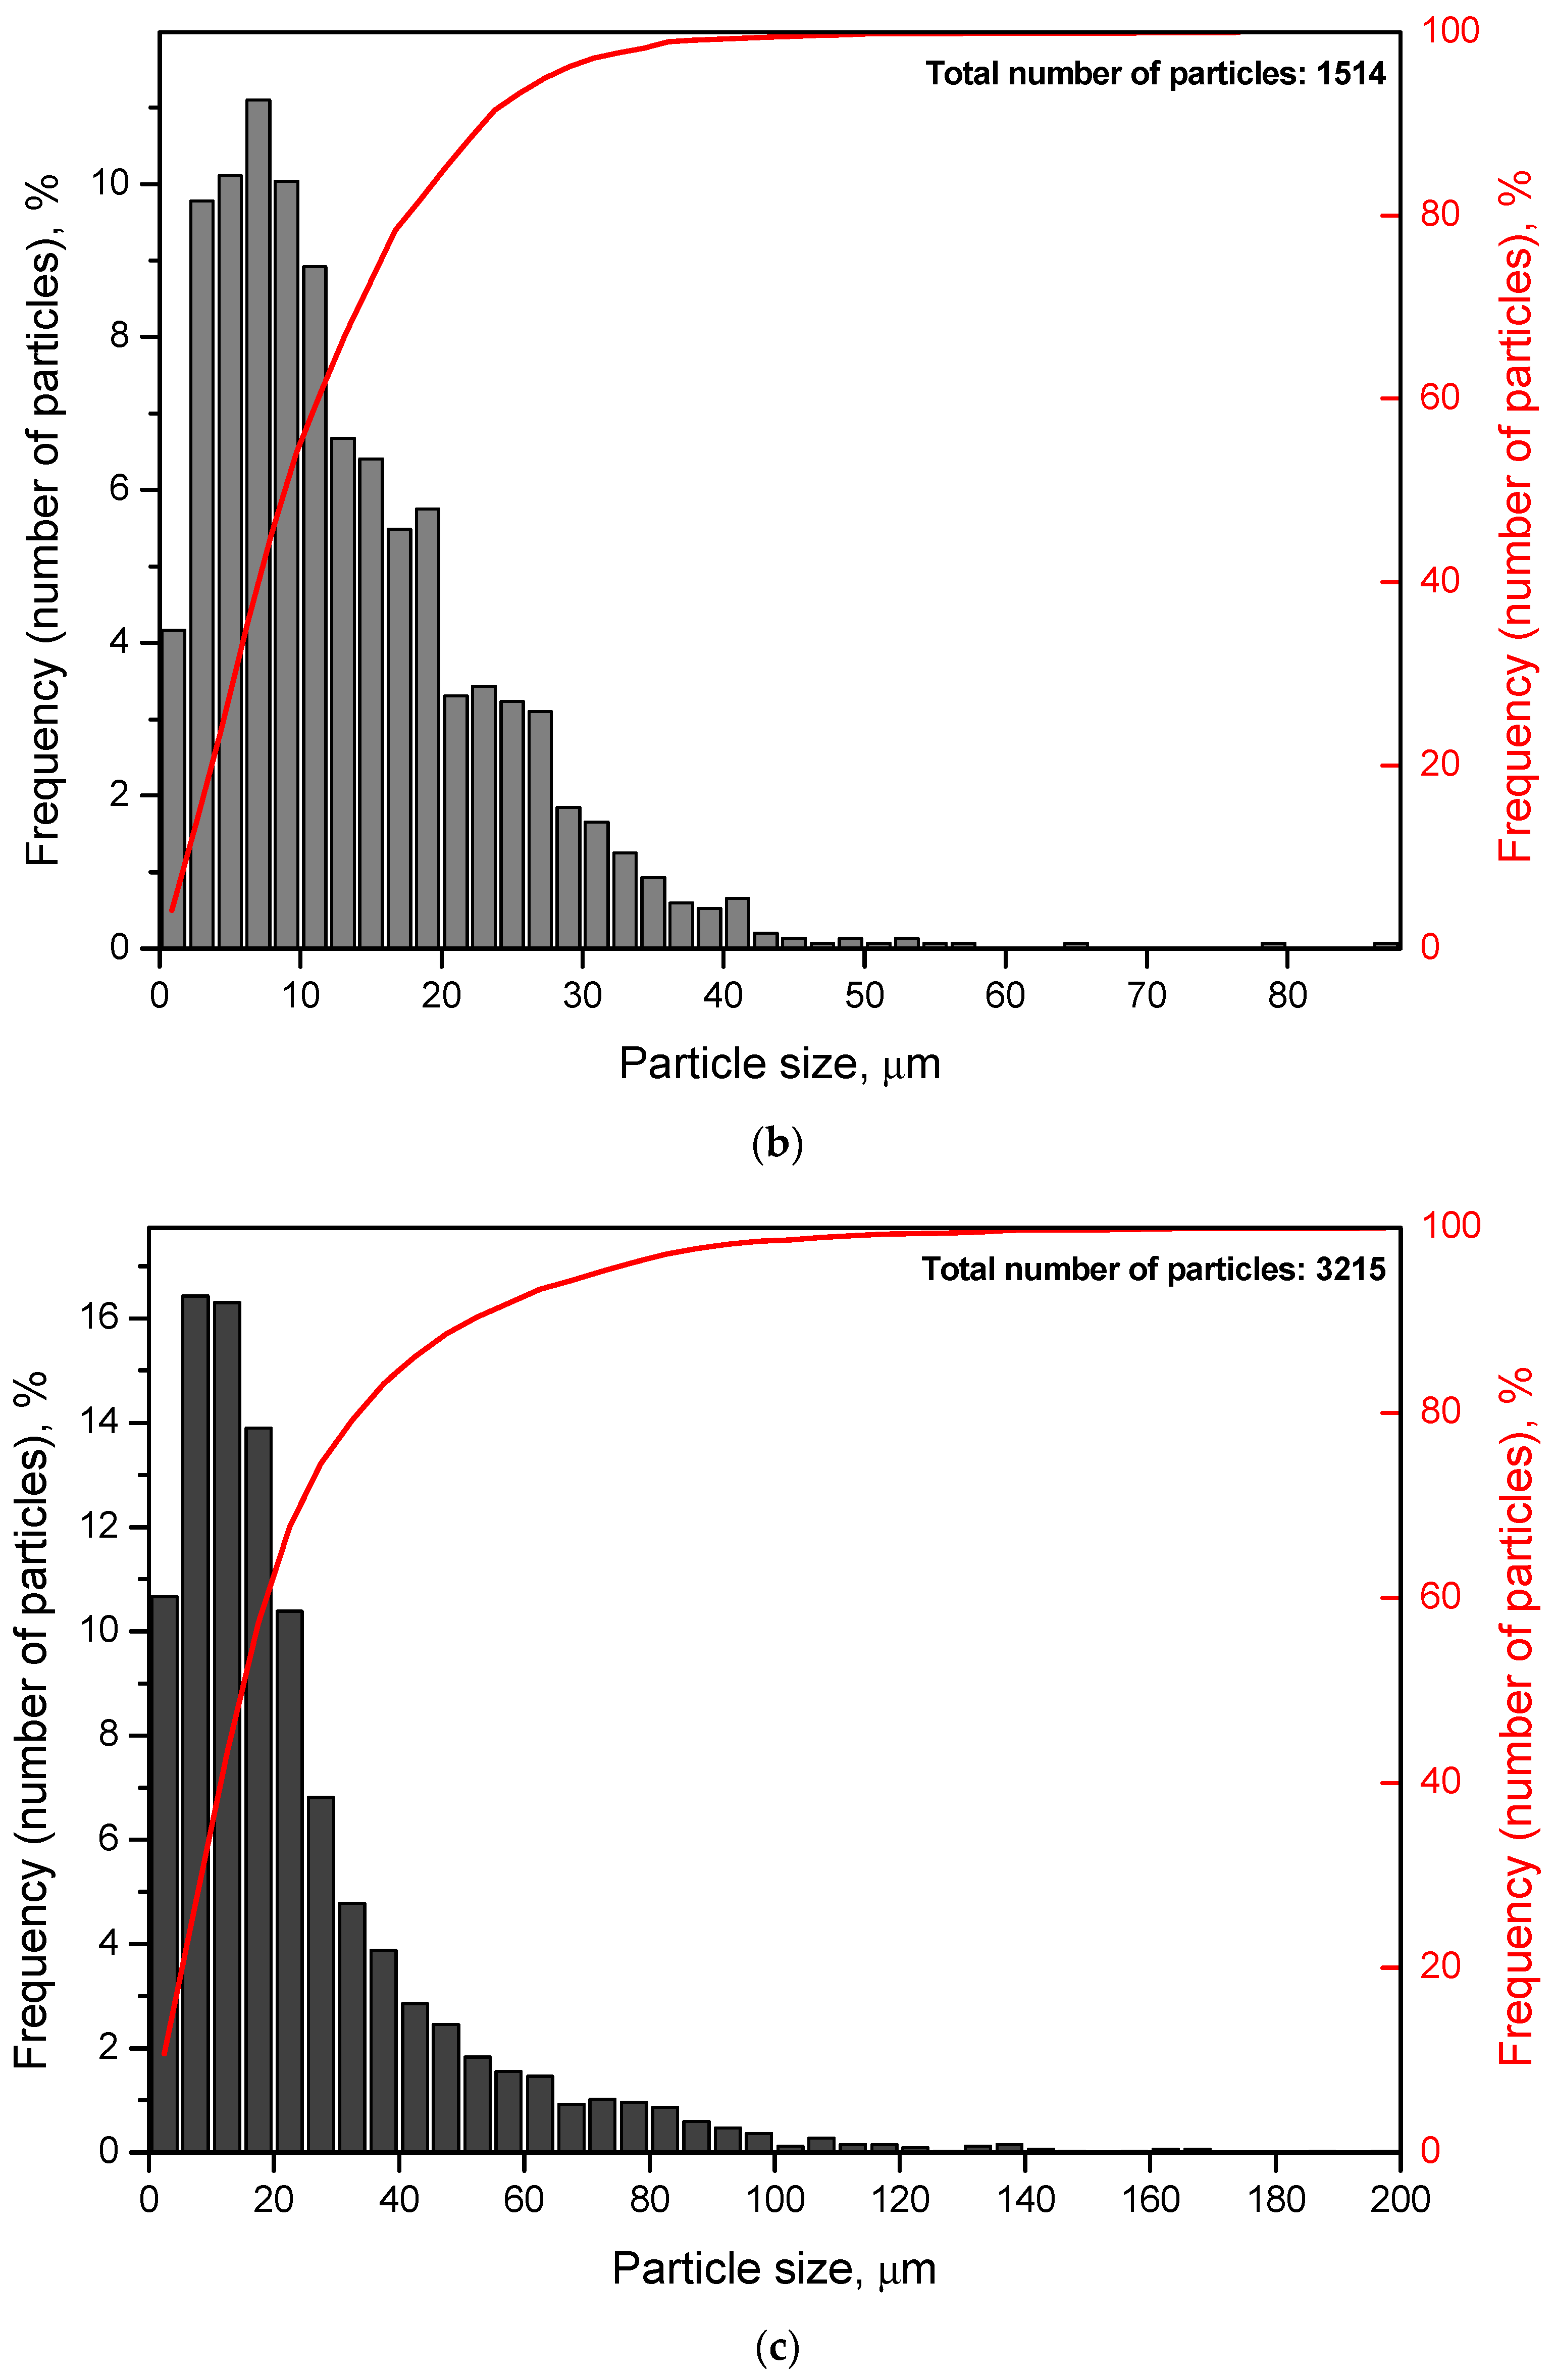
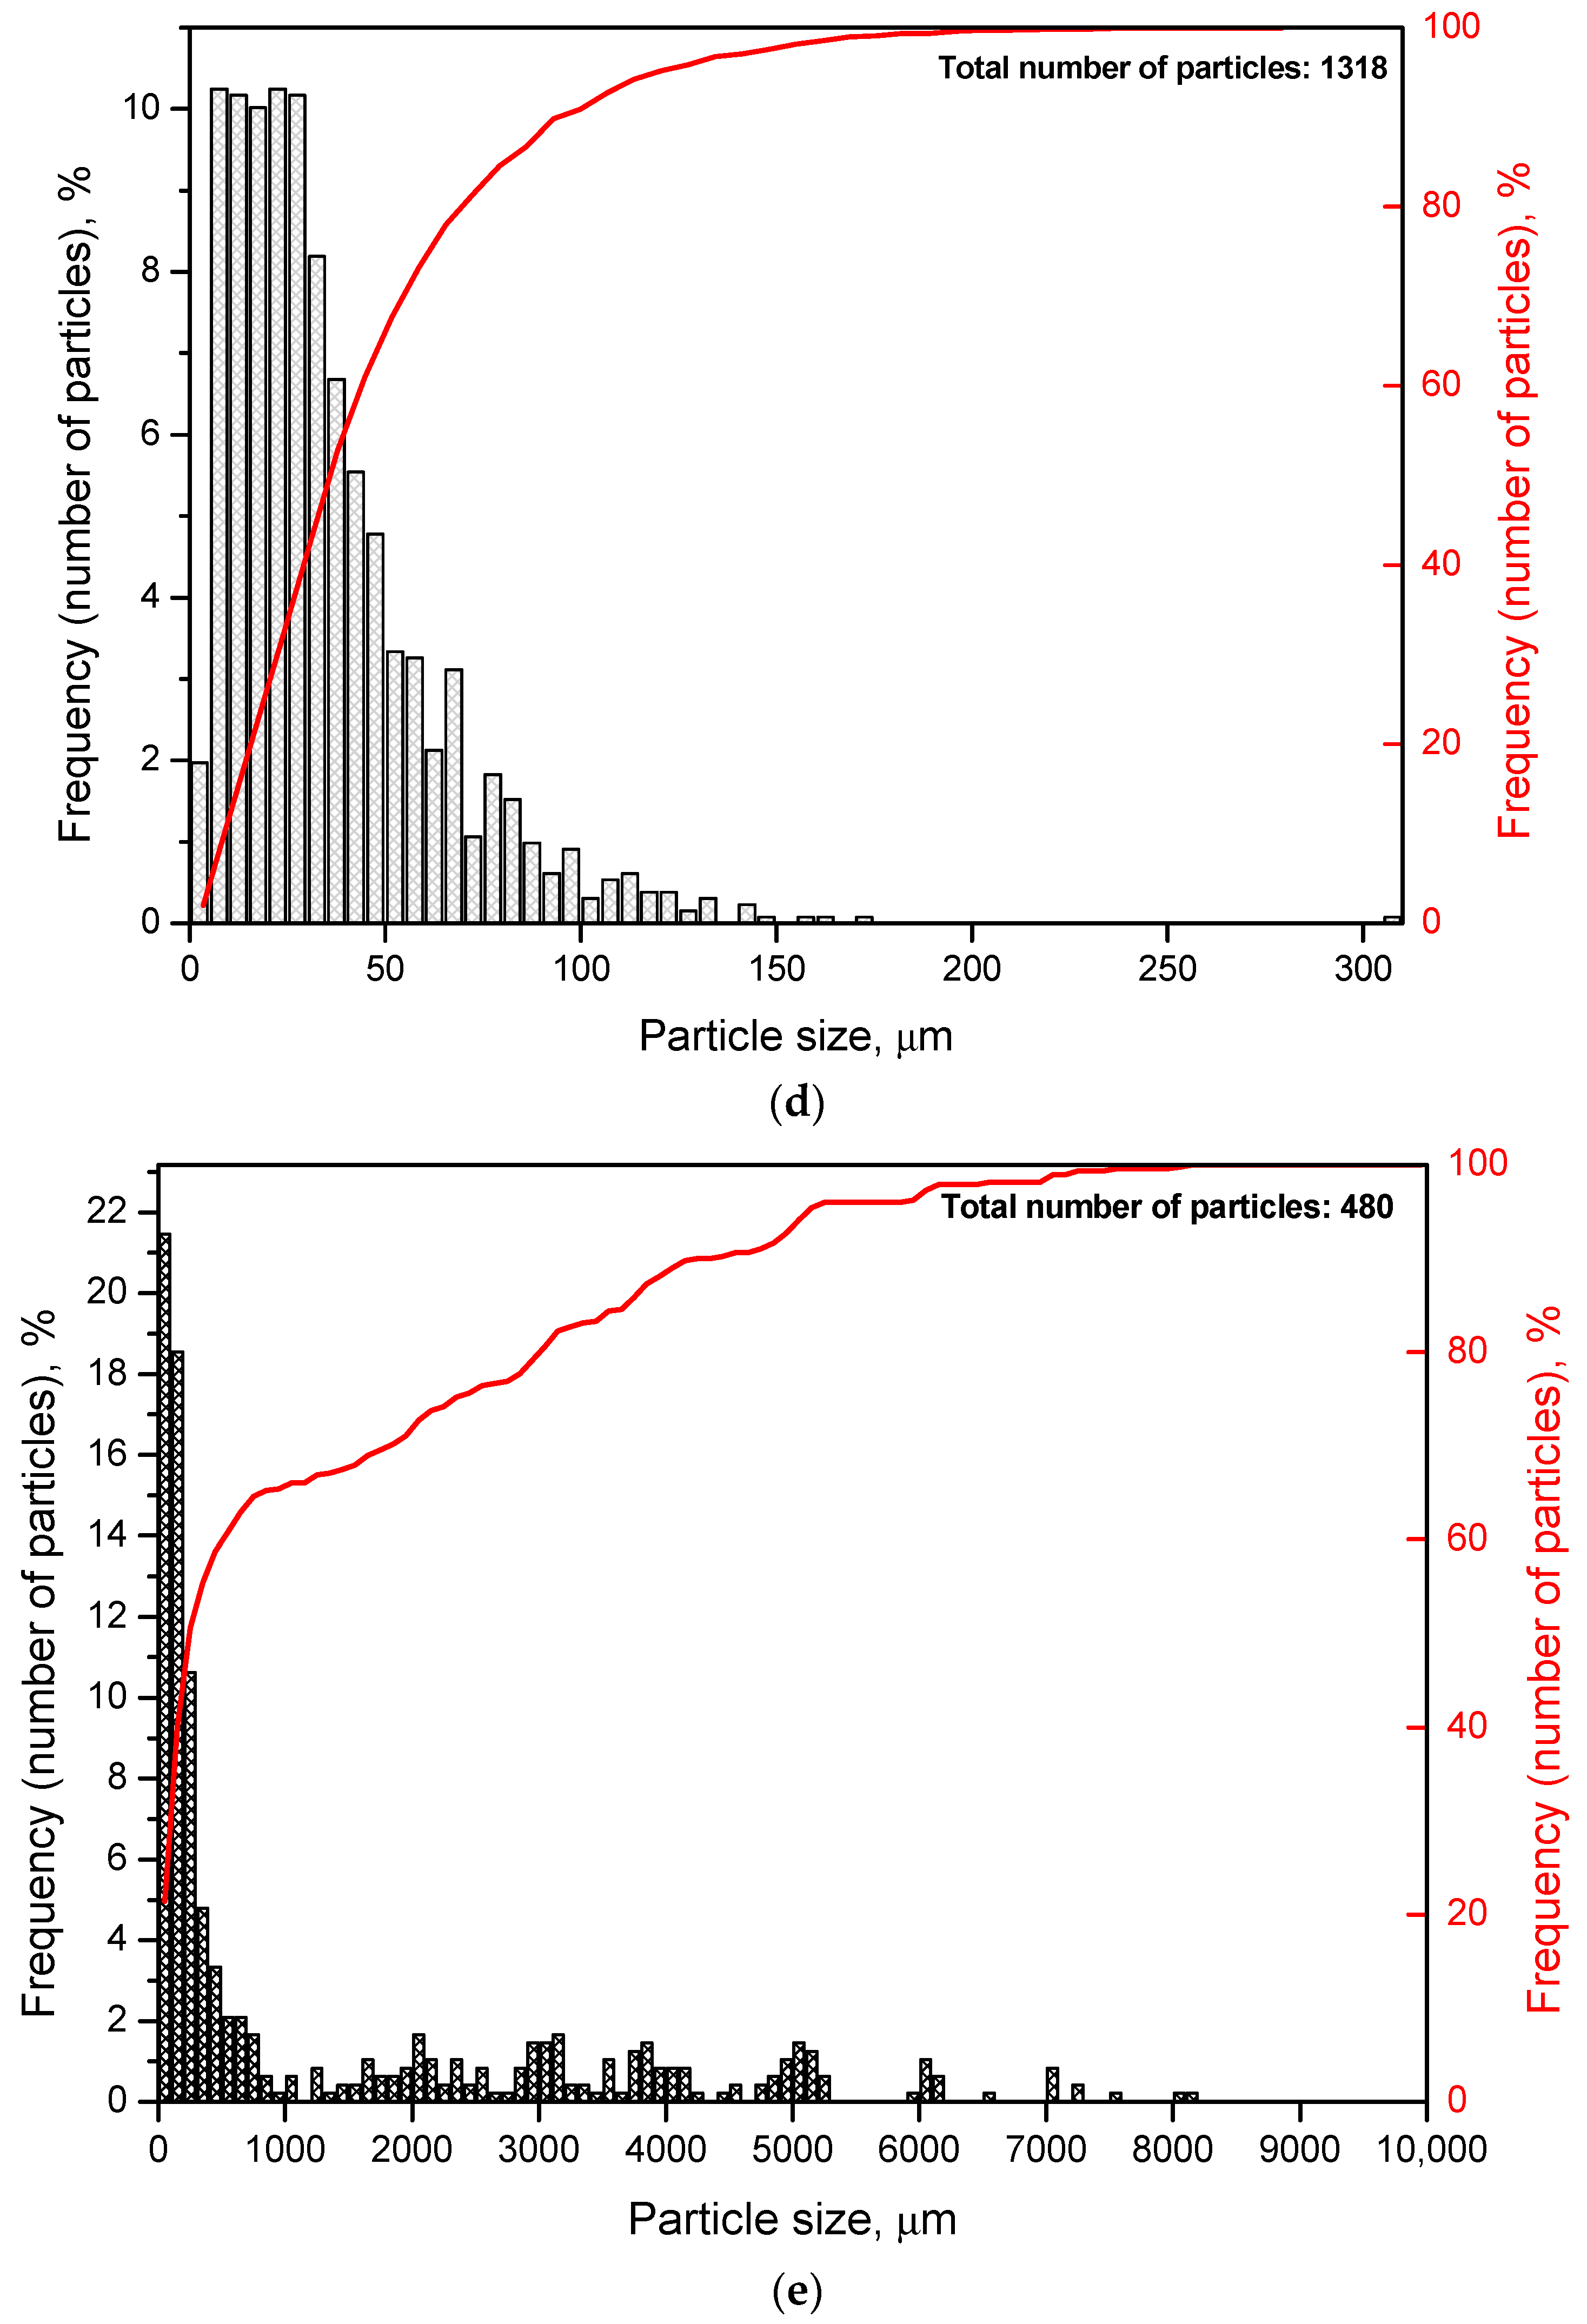
3.1.2. Investigation by Optical Microscopy

The photographs of the powder samples and original metal scrap captured using a microscope camera are given in Figure 4. As it can be seen from the photographs under ×20 magnification, the particles for all the powder samples had uneven, ‘hummocky’ surfaces. Such morphology resulted from the impact of steel balls (and KCl particles for the samples containing salt). The ball-milled sample with 20 wt.% Wood’s alloy represented a dense layer covering the milling pot internal surface that was separated by scratching. From this fact, it was concluded that Wood’s alloy liquefied during ball milling and produced a negligible impacting effect, if any. In the images of the metal scrap, the particle surfaces covered with scratches and uneven edges—resulting from mechanical processing—are shown.
From the other photographs (×2 and ×5 magnifications), it can be seen that, in general, the finest particles corresponded to the sample ball-milled with 20 wt.% KCl. The largest particles were ones of the sample ball-milled with 20 wt.% Wood’s metal alloy and the 100 wt.% Mg-Al powder, and the particles of the sample containing both KCl and Wood’s alloy had intermediate sizes, as expected. The finest particles demonstrated a tendency to form clusters (due to electrostatic adhesion), while the largest ones were loose. Metal scrap contained many particles too large to be captured in full size.
Particle size distributions were obtained by processing several images of different random regions of the disperse samples. The numbers of images were 5 for each of the samples containing Wood’s alloy, 10 for each of the samples both with KCl and without additives, and 20 for metal scrap. The corresponding histograms and cumulative curves are given in Figure 5. According to the obtained results, most of the particles for the sample containing 20 wt.% KCl had their sizes below 10 μm. Those for the sample with both KCl and Wood’s alloy were mostly smaller than 20 μm. Particles of the powder with 20 wt.% Wood’s alloy were generally limited to 35–40 μm. As to the sample obtained by scrap ball milling without additives (100 wt.% Mg-Al), its particle sizes were mostly smaller than 70–80 μm. The scrap sample was characterized by high non-uniformity in the particle size distribution with nearly 60% of the particles smaller than ~1 mm and the rest as large as ~1–10 mm. Such big sizes were attributed to the prolate form typical for a large portion of scrap particles.
The average particle sizes for the samples containing KCl, both Wood’s alloy and KCl, Wood’s alloy, and no additives were 6 μm, 14 μm, 24 μm, and 36 μm, respectively. Some errors in size determination could arise from the fact that the samples containing KCl might contain some amount of separate salt particles of the smallest sizes contributing to composite particle size ‘underestimation’. The average scrap particle size was ~1.4 mm. The total numbers of particles used for size averaging are given in Figure 5.
According to the results of the optical microscopy investigations, the sample containing 20 wt.% KCl represented the finest powder and, consequently, it should have the largest specific surface area. The composition containing both KCl and Wood’s alloy with larger particles should have a lower value of specific surface area. The powder containing 20 wt.% Wood’s alloy was characterized by relatively big particles and should have a still smaller specific surface area. Finally, the sample of metal scrap ball-milled without additives comprised the largest particles and should have the smallest specific surface area.

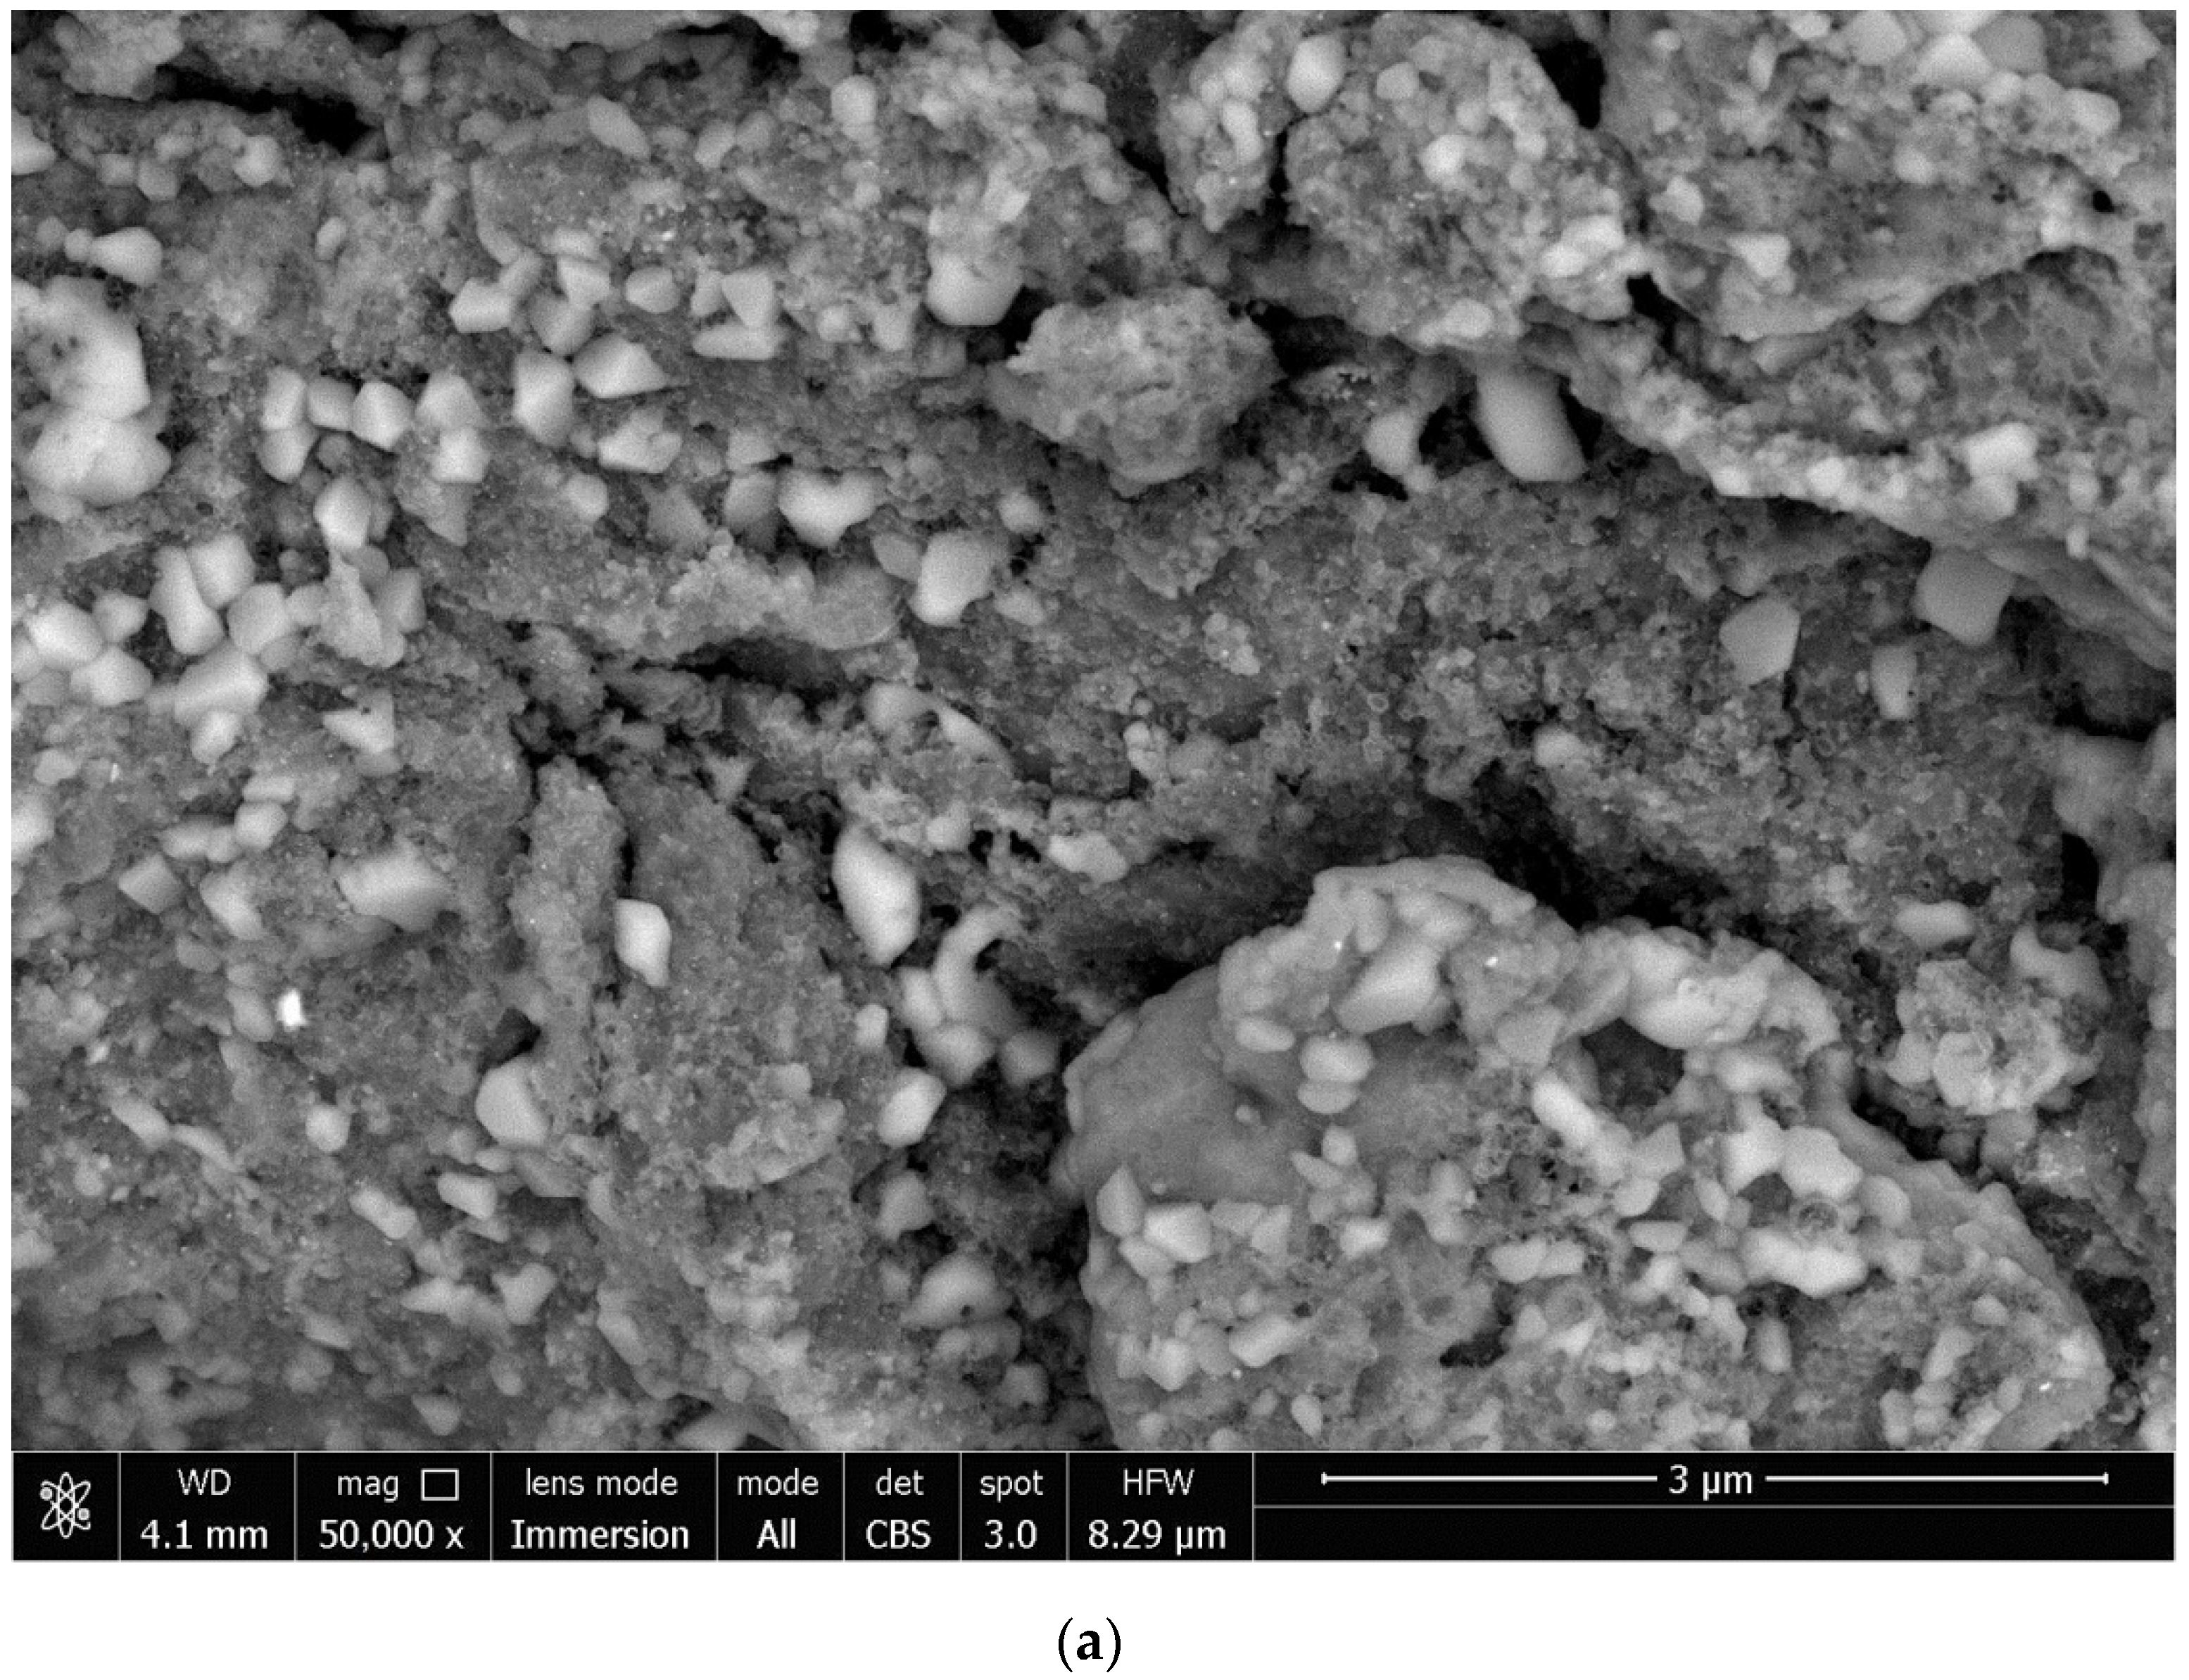
3.1.3. Investigation by Scanning Electron Microscopy

The microphotographs of the powder samples obtained by scanning electron microscopy in BSE imaging mode are given in Figure 6. In the image of a particle composed of metal scrap (shown in grey and dark grey) and KCl (shown in light grey and white), embedded salt crystals and many cavities originating from impacts with salt particles were clearly seen on the surface. Particles composed of metal scrap (shown in grey and dark grey), KCl (shown in grey and light grey), and Wood’s alloy (shown in white) also had some cavities on their surfaces, as well as embedded salt crystals and alloy spots. A particle of metal scrap (shown in grey and dark grey) with Wood’s alloy (shown in light grey and white) likely represented a lamellar structure composed of smaller flattened particles agglomerated due to the ‘cold welding’ process during ball milling. Particles of the scrap ball-milled without additives represented similar multilayer structures formed by ‘cold welding’, with the magnesium-aluminum alloy shown in grey and inclusions of heavier elements—Zn, Zr, and Nd segregated on the surface and Fe contaminations from the steel balls—shown in light grey and white.

3.2. Hydrogen Evolution Kinetics

3.2.1. Metal Scrap and KCl

The preliminary tests on the oxidation of the powder samples in a 3.5 wt.% NaCl aqueous solution demonstrated that the sample composed of Mg-Al (80 wt.%) and KCl (20 wt.%) started to react with vapor at nearly 80 °C. The sample inflamed and—a few seconds after emergency unsealing of the reactor loading outlet—a flame jet representing, presumably, burning magnesium and a hydrogen-air mixture was observed during several seconds. At 50 °C, the same composition inflamed upon contacting the surface of the aqueous solution. Additionally, a just-prepared sample with the same composition inflamed upon exposure to air. More careful pretesting of the samples (0.5 g weight portions) in the temperature range from 25 to 40 °C with an interval of 5 °C revealed that, for the samples containing KCl, ignition with a flash was observed at 40 °C. Therefore, hydrogen evolution kinetics was studied in the temperature range from 15 to 35 °C; before the experiments, the ‘fresh’ samples with 20 wt.% KCl were held in a glove box under Ar.
The kinetic curves obtained for the powder of Mg-Al and KCl are represented in Figure 7. As it can be seen, in the beginning of the reaction, the hydrogen evolution rate at 35 °C was the highest, as expected, and it decreased with lowering temperature. At all temperatures, the highest reaction rates were observed for nearly the first 20 min. of the experiment. At about 40 min. after the beginning, the kinetic curves tended to move towards their plateaus, reflecting a definite slowing down of the reaction.
As for the hydrogen yields, large uncertainties were typical for all the kinetic curves. Moreover, overlapping of the error bars (standard deviations) of the kinetic curves was observed. After nearly 20 min. of the experiments, the error bars of all three kinetic curves overlapped within some yield intervals; by the end of the measurement time, the ‘shared’ yield interval was from 41.2% to 42.1%. The hydrogen yields obtained at 15, 25, and 35 °C were (37.6 ± 4.5)%, (41.4 ± 2.9)%, and (45.6 ± 4.4)%, respectively.
Such large variations in the experimental data probably resulted from the fast aging of this sort of powder materials, despite their storing under an Ar atmosphere. For a set of three experiments at different temperatures, the same powder sample was divided into portions, and the reactivity of the samples that were used later could decrease after several hours of storing.
In study [47], it was reported that the effect of salt particles on the activation of aluminum powders prepared by ball milling was that they acted as nano-millers. The aluminum activation mechanism constituted the creation of a great number of new ‘fresh’ metal surfaces and the prevention of their re-oxidation in air by the formation of salt layers on them. However, in study [45], it was demonstrated that the mechanism of merely covering aluminum particles with salt did not explain the higher reactivity of the samples produced by prolonged (4–19 h) ball milling. The said samples represented composite particles formed by the aggregation of the salt and aluminum phases. In hot water, salt inclusions dissolved, leaving many voids and tunnels in the aluminum particles. Such porous structure provided a good deal of ‘fresh surfaces’ coming into contact with hot water. Other effects of ‘salt-assisted’ ball milling useful for enhancing aluminum (or magnesium) corrosion with hydrogen evolution include an increase in lattice strain, a reduction in crystalline size, and the creation of defects (dislocations, vacancies, grain boundaries, etc.) in metal particles [48].
In the present study, Mg-based alloys were employed, and it seemed to be useful to compare the obtained results with similar ones for Mg and KCl composites. In study [43], samples manufactured with Mg powder (99.8% purity, particle size 20–100 mesh) and KCl were tested in pure water at 80 °C. The tested parameters closest to those employed in our study were a KCl concentration of 25 wt.% and 3 or 7 h of ball milling. According to the reported kinetic curves, the hydrogen yields for those samples achieved nearly 48–49% (~450–460 mL) in 1 h. The most intensive hydrogen release proceeded during nearly the first 5–10 min. of the experiment, and after ~15–20 min., a significant slow-down was observed, with the kinetic curves gradually moving towards their plateaus. The hydrogen yields of ~42–46% obtained in the present study at 25–35 °C are not drastically lower than the 48–49% obtained in [43] for Mg at 80 °C, considering that, by the end of the experiments (4 h and 1 h), the reaction either achieved its termination stage or scarcely proceeded. Somewhat higher hydrogen yields reported in [43] could be ascribed to a higher KCl content (25 wt.% vs. 20 wt.% in the present study), smaller original Mg powder particle size (~100 μm vs. ~100–1000 μm in the present study), and higher Mg content in the Mg powder compared to the Mg-based scrap.
In order to follow up on the discussion, some other results were referred to and compared. The relevant experimental conditions and results of preceding studies are given in Table 1.
From a comparison of the above data, the following conclusion can be made. In the cases of ball-milled Mg or Al mixtures with some salts (NaCl and KCl), the eventual hydrogen yields were majorly affected by the salt content and ball-milling time. However, in a certain temperature range, the said values were scarcely affected or almost unaffected by the reaction temperature. Salt content and ball-milling time most notably affected powder particle size and structure (embedded salt inclusions) and, therefore, specific surface area of the samples. As it can be seen, the particle sizes reported in different studies, as well as in the present one, were much different, which can be attributed to different conditions of their measurement (optical or scanning electron microscopes, number of particles for averaging, inclusion or exclusion of separate salt particles, etc.). However, for the results obtained in the present study, the following deduction still can be made. Upon dissolution of KCl inclusions in the samples, the uncovered ‘fresh’ surfaces were likely to be covered with a mostly dense and ‘compact’ layer of poorly soluble reaction product (according to the XRD data the product was Mg(OH)2). As the powder particle sizes were mostly too large compared to the thickness of the Mg(OH)2 layer at the moment of a considerable reaction slowing down or termination, a significant amount of the Mg-Al alloy remained unreacted. It is quite possible that—in a certain temperature range—such ‘terminal’ thicknesses of the reaction product layers (for Al or Mg) were about the same, regardless particle sizes. Therefore, the eventual hydrogen yield values depended on the ratio of the ‘terminal’ product layer thickness to the initial particle size, or the wideness of the metal regions between hollows remaining in the particles after dissolution of the embedded salt inclusions. In other words, the eventual hydrogen yields were substantially limited by the said ratio, while the reaction temperature (in a certain interval) affected only whether the said values were achieved sooner or later.
These conclusions are supported by the results of studies [55,56], wherein experiments with aluminum nanoparticles (87 and 120 nm) provided their 100% conversion into hydrogen in pure water at 67–70 °C. In [56], the term ‘penetration thickness’ was introduced, and its values were calculated for various particle sizes and temperatures. According to the reported results, the penetration thicknesses for aluminum particles at temperatures up to ~100 °C were below 1 μm and not too much different from each other (taking into account the uncertainties). However, with increasing the temperature from 100 °C to 200 °C, these values rose up to ~2 μm. It was reported as well, that the penetration thickness was the same for different particle sizes, and its increase at temperatures over 100 °C was attributed to a considerable increase in diffusivity of the water. Therefore, the mentioned ‘certain temperature range’ is presumably limited by 100 °C or so.

3.2.2. Metal Scrap and Wood’s Alloy

The results of the experiments with the Mg-Al (80 wt.%) and Wood’s alloy (20 wt.%) composition are illustrated in Figure 8. The kinetic curves for this powder sample had an S-shape typical for topochemical reactions [52]. Kinetic curves for the said reactions usually have an ‘acceleration’ section in the beginning of the reaction, a section of the highest reaction rate with further deceleration, and a section referring to the completion of the reaction. The presence of a distinguishable ‘acceleration stage’ was accounted for slower initial reaction rates in the experiments for this powder compared with the previously discussed sample composition.
As in the preceding experiments, an increase in the hydrogen yield was observed, along with temperature growth. However, the differences between the hydrogen yield values for different temperatures were, in general, considerably larger than those for the previously discussed sample with salt. In study [57], some of the hydrogen yield statistical uncertainties for aluminum powder samples reacting with water achieved nearly 10%. Thus, relative deviation values of 10% or so may be typical for similar experiments with aluminum or magnesium powders. In the case of the present study, such statistical uncertainty may result from the variation in powder particle sizes, irregular distribution of salt or alloy additives, structure defects produced during ball milling, and, presumably, the effect of powder aging.
Although the uncertainties were large for all the kinetic curves, no overlapping of their error bars was observed, except at the very beginning of the reaction. Therefore, the results for this sample were quite distinguishable. The hydrogen yields achieved were (42.4 ± 6.3)%, (57.7 ± 5.9)%, and (73.5 ± 10.0)% for 15, 25, and 35 °C, respectively. These values were substantially higher than those for the sample with 20 wt.% KCl salt.
The addition of Bi and Sn to aluminum and magnesium is rather a common method to promote their reactions with water [5,37,58,59]. The standard electrode potentials of all Wood’s alloy components—Bi, Sn, Cd, and (presumably) Pb7Bi3—and the intermetallide-phase MgSn2 detected in the ball-milled powder samples were higher than those of Mg and Al (although some shifts in the 3.5 wt.% NaCl solution can be expected). Therefore, in the conductive media, the dominating mechanism of the hydrogen producing reaction was ‘anodic dissolution’ of the Mg (and probably Al) due to galvanic corrosion. Although an electrode potential difference between Mg and Al (or its intermetallide Mg12Al17) also promotes oxidation of the less noble metal (Mg) in conductive (0.6 mol/l NaCl solution) media [60], the said potential difference is much less than that between Mg and the Wood’s metal components.

3.2.3. Metal Scrap, KCl, and Wood’s Alloy

The results of another set of experiments for the powder of Mg-Al (80 wt.%), Wood’s alloy (10 wt.%), and KCl (10 wt.%) are given in Figure 9. The represented kinetic curves demonstrated a predictable increase in the reaction rate along with the temperature growth. As compared to the preceding results, ‘acceleration’ sections of the kinetic curves were not visible, which indicated a relatively fast start of the reaction. The error bars for all three kinetic curves were much shorter than those for the previously discussed samples. This suggests a surprisingly high reproducibility of the experimental data for this composite material. It can be supposed that either such results were obtained by coincidence and more experiments are required for data averaging or that the material had some specific properties whose investigation is beyond the scope of the present research.
For this powder sample, a synergetic effect of galvanic corrosion from Wood’s alloy and specific surface area enlargement from KCl was expected to provide the highest hydrogen yields and evolution rates compared to the samples with either of these additives. The time intervals until the reaction deceleration for this sample were nearly 20–40 min. at 25 and 35 °C and 40–60 min. at 15 °C. The said time periods were longer than those for the sample with 20 wt.% KCl—up to 20 min at 35 °C and 20–40 min. at 15 and 25 °C. Additionally, these intervals were shorter than those for the sample with 20 wt.% Wood’s alloy—nearly 60–100 min. for 25 and 35 °C and 120–160 min. at 15 °C. The hydrogen yields achieved were (43.3 ± 1.5)%, (50.4 ± 1.2)%, and (56.0 ± 1.2)% at 15, 25, and 35 °C, respectively. These results exceeded those for the sample with the KCl additive and fell below ones for the Wood’s alloy additive. Therefore, the results for hydrogen yields and initial reaction rates for the sample with both additives appeared to fall between those for the samples containing either of the two additives.

3.2.4. Metal Scrap Powder without Additives

Figure 10 demonstrates the results obtained for the sample of metal scrap ball milled without additives. Although some error bars for the kinetic curves corresponding to 25 and 35 °C partially overlapped, all the curves were still easily distinguishable. An S-shape was clearly identified for the curve at 15 °C, while for the other curves, it was too faint. The kinetic curve sections of reaction deceleration were located in the intervals of 20–60 min., 40–80 min., and 60–100 min. for 35, 25, and 15 °C, respectively. The hydrogen yields corresponding to 15, 25, and 35 °C were (56.0 ± 1.1)%, (64.0 ± 5.1)%, and (70.6 ± 2.5)%, respectively. Without any doubts, these values were much higher than those for the sample ball-milled with 20 wt.% KCl. Additionally, they definitely exceeded the corresponding hydrogen yield figures for the sample comprising both KCl and Wood’s alloy. As to a comparison with the sample containing 20 wt.% Wood’s alloy, at 15 °C the hydrogen yield for the latter was lower, while at 25 and 35 °C, these values matched within the statistical error limits.
For this sample, the mechanisms presumably enhancing Mg oxidation in the NaCl aqueous solution were based on the formation of imperfections (dislocations, vacancies, grain boundaries, stacking faults, etc.) in the metal lattice due to ball milling [48]. Such structure defects favor the localized enrichment of Cl ions; therefore, they are readily attacked by pitting corrosion [25]. Another useful mechanism can be associated with the formation of porous lamellar structures with interlayer spaces at certain ball-milling durations. Such structures are composed of aggregated flattened particles, and despite large sizes of the entire aggregates, their specific surface area can achieve rather high values [46]. Unfortunately, in the present study, measurements of the specific surface areas were not performed. SEM investigation of the cross-sections of powder particles for lamellar structures identification was out of the scope of this study as well.
However, some information on the accumulated strain energy was derived from comparison of the peaks of XRD patterns for different powder samples. In [48], it was reported that the Al powder milled with NaCl had more lattice strain compared to that milled without NaCl, which was proved by a comparison of the full width at half maximum for the typical Al phase peaks. A similar visual analysis of the peaks of the powder samples with different additives (and with no additives) was performed in the present study. In Figure 11, several typical peaks for the base Mg-Al phase in the XRD patterns for different powders are shown. According to the assessment results, the full width at half maximum for two less intensive peaks had nearly the same value for all powder samples. For a third—the most intensive—peak, the relevant width values for the samples with Wood’s alloy and with no additives were close, while the width of the sample with 20 wt.% KCl was definitely smaller. Thus, the peak for the sample ball milled without salt turned out to be wider than the peak for the sample with 20 wt.% salt, and this contradicts the result from [48]. However, this contrariety could be attributed to a difference in the ball milling time (20 h vs. 4 h in the present study), materials (Al vs. Mg-based alloy in the present study), as well as implemented salts (NaCl vs. KCl in the present study) and their contents.
Therefore, it can be assumed that the latter sample with the narrowest peak width accumulated less strain energy in its crystal lattice during 4 h of ball milling compared to the other powder samples. Thus, for this sample, a large portion of ball-milling energy was actually employed for particle size reduction by cutting with salt particles, rather than for the creation of lattice imperfections. Consequently, this sample could be less affected by pitting corrosion from NaCl aqueous solution. Additionally, the effect of pitting corrosion could contribute significantly to sustaining the reaction.
The fact that the hydrogen yields for the powder without additives were close to or higher than those for the sample with 20 wt.% Wood’s alloy can be explained from the following considerations. In some preceding studies, it has been demonstrated that some additives tended to form intermetallic compounds located at grain boundaries, screening the base metal in the grains from liquid. In cases of high concentrations, some intermetallic phases may hinder the reaction. For example, Cu is known to promote an Al–water reaction, however, its addition to Al-Ga-In-Sn systems inhibits the said reaction [61]. It was shown as well, that adding Ga to Mg promoted its corrosion in an NaCl solution [62], while adding Ga to an Mg-Sn system hindered Mg corrosion in an NaCl solution [63]. Additionally, it was proved that for certain additives there are some optimal concentrations (for example, Sn in an Mg-Ni system [64]) corresponding to the highest hydrogen yields and evolution rates and that exceeding these optimal values led to a decrease in the said values. The abovementioned facts brought us to the conclusion that the contents of Wood’s alloy in the samples tested in the present study were far from being optimal, and we suspect that the optimal values may actually be lower than the tested ones.

3.3. Characteristics of Solid Reaction Products

3.3.1. X-ray Diffraction Analysis

The XRD patterns for the solid reaction products obtained by the oxidation of different hydroreactive powder samples are given in Figure 12. The XRD analysis results demonstrated that all the reaction products contained some amount of the unreacted Mg-Al phase. The intensities of the corresponding peaks for the reaction products were lower than those for the powder samples before reaction, but most of the peaks were still distinguishable. In the XRD patterns for all the reaction product samples, Mg(OH)2 was present. This phase resulted from the oxidation of Mg—the base component of the metal scrap—by an NaCl aqueous solution. A comparison of the XRD patterns for the powder samples with those for their reaction products showed a disappearance of the KCl phase. This was obviously attributed to KCl particle dissolution in the NaCl aqueous solution. In the samples comprising Wood’s metal alloy, Mg2Sn—present in the powders before the reaction—remained. PbBiO2Cl apparently originated from a reaction between the Wood’s alloy component Pb7Bi3 and the NaCl aqueous solution. In a preceding study [28], for the experiments with ‘mechanical alloy’ powders—55 wt.% Mg, 30 wt.% Al, and 15 wt.% Fe ball-milled for 4 h—and 0.6 mol/l NaCl solution, in the solid reaction product Mg6Al2(OH)18∙4.5H20 and Al(OH)3 were detected. However, from the present XRD patterns, neither Al nor its reaction products were identified. Such a result may be associated with a relatively low Al content in the ML5 alloy scrap—up to 9 wt.% according to the standard—or with the possible formation of pseudoboehmite, which has weak diffraction intensity.

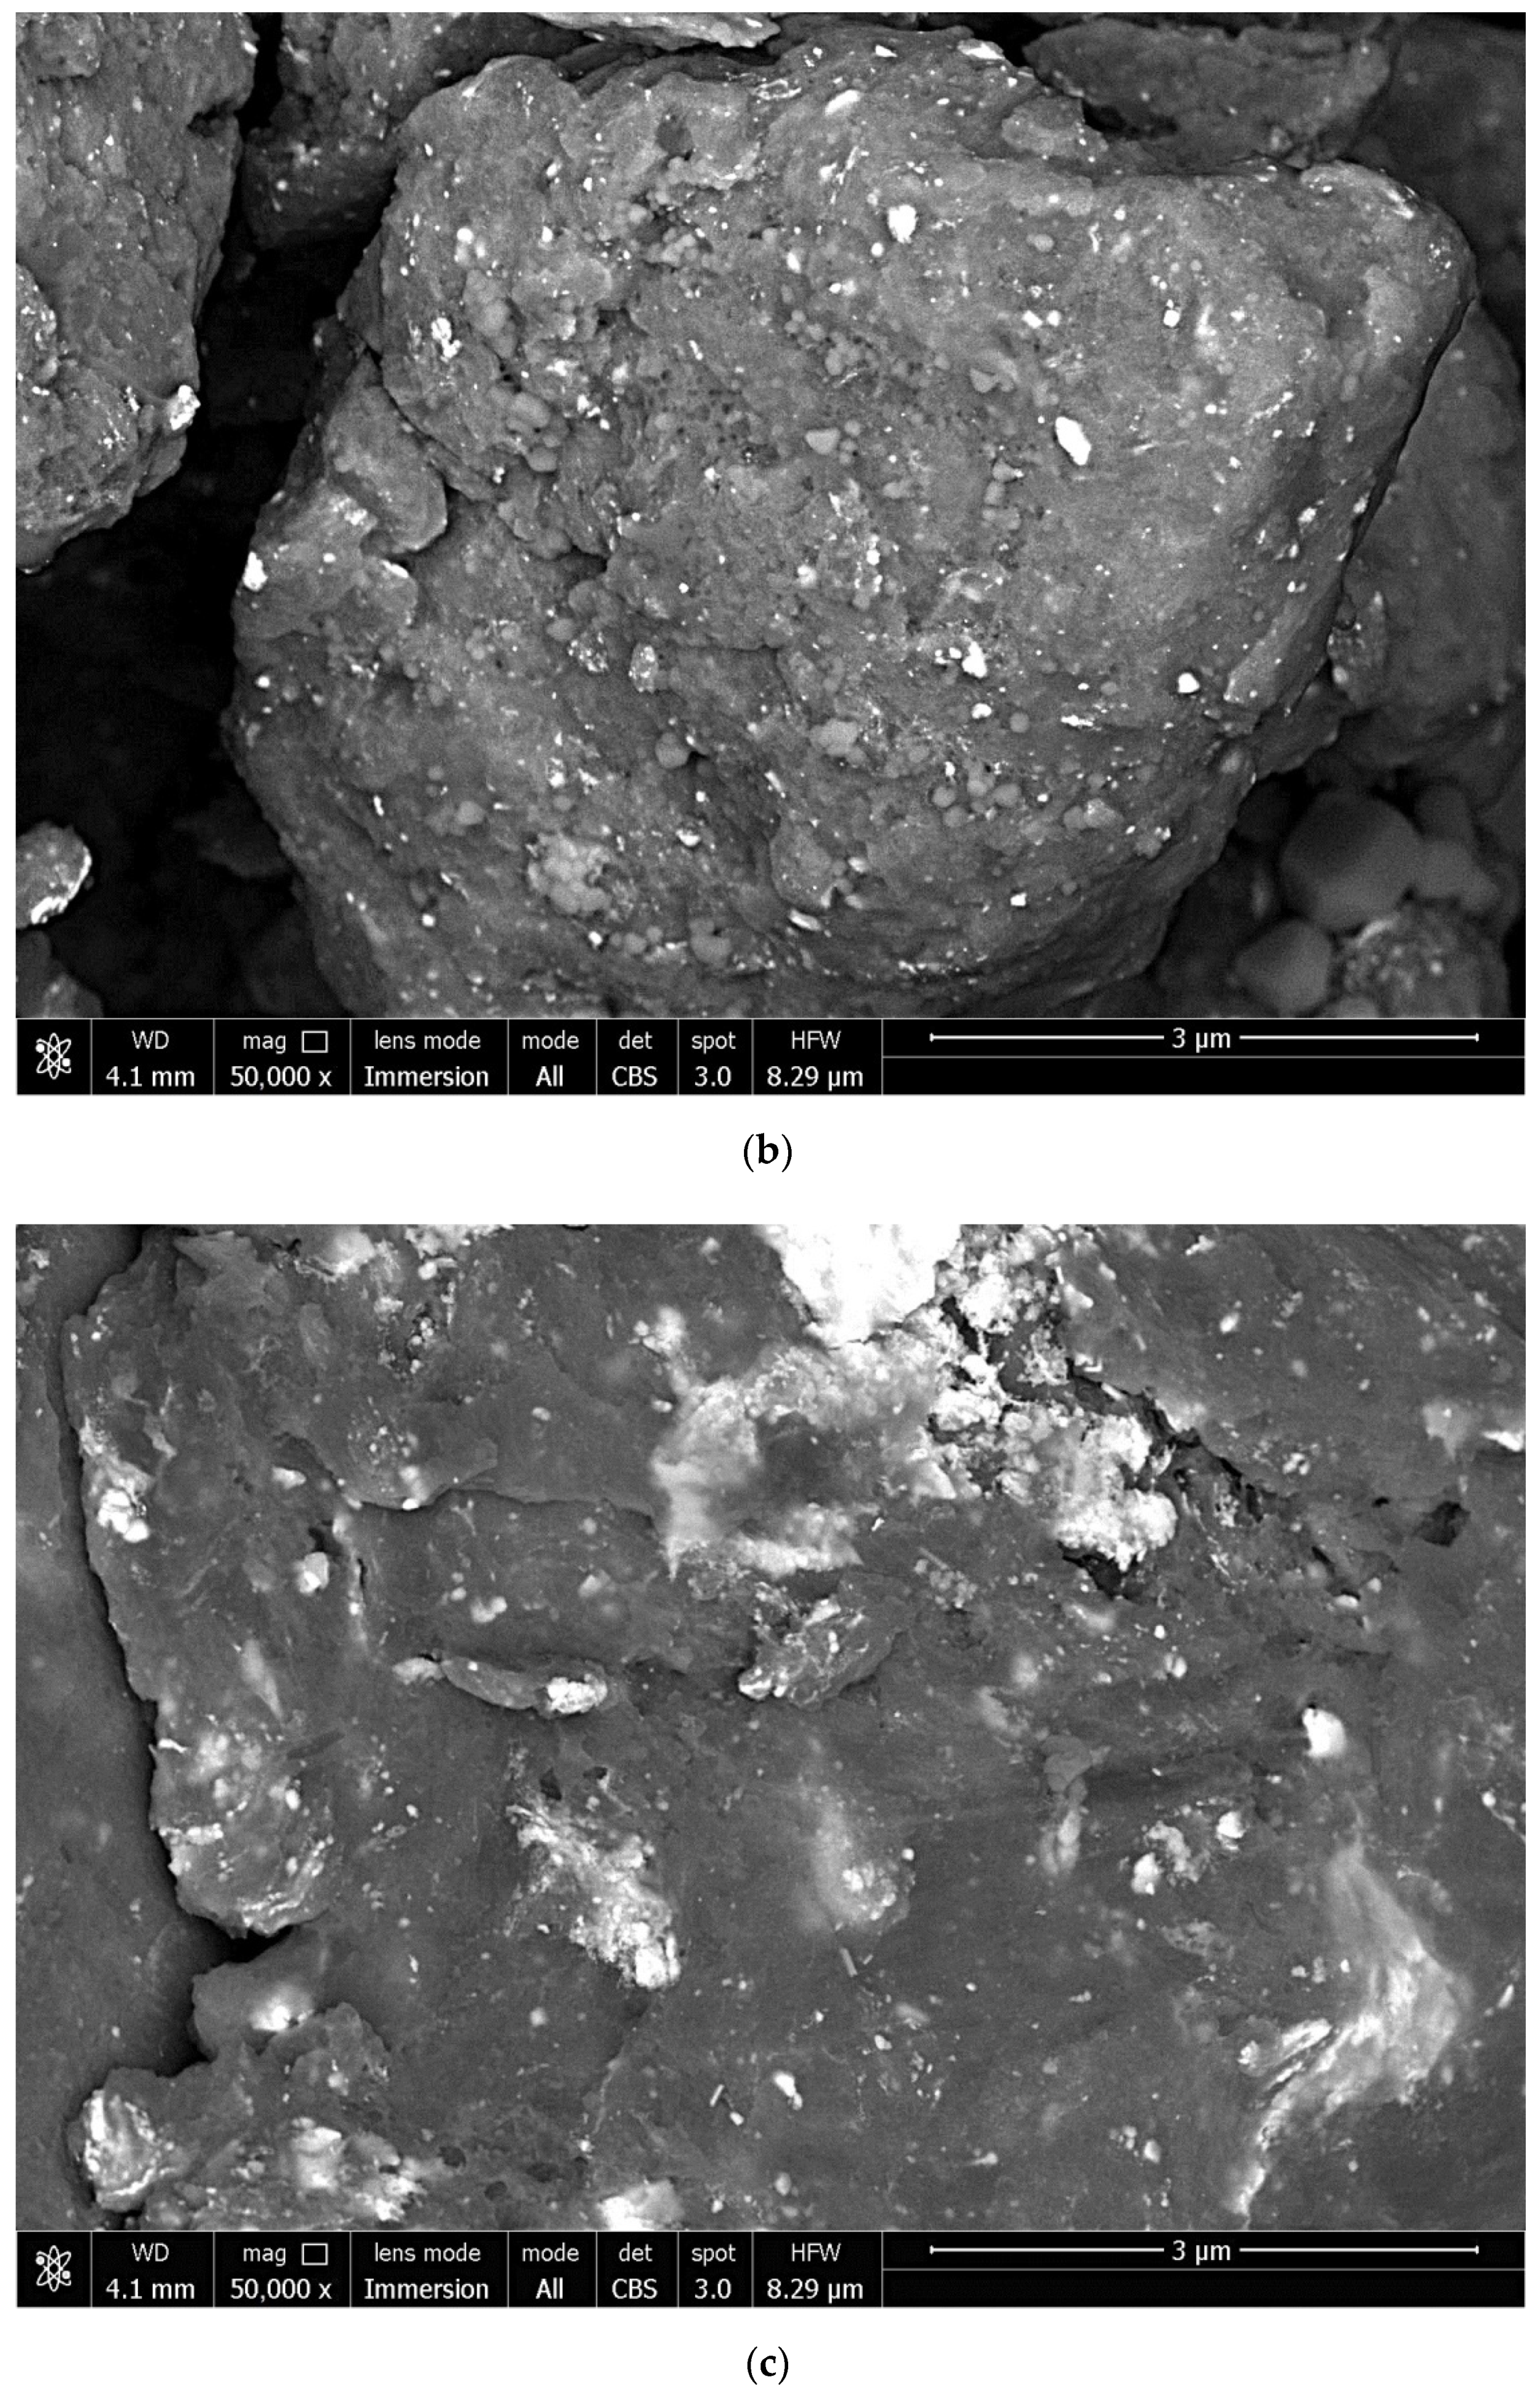
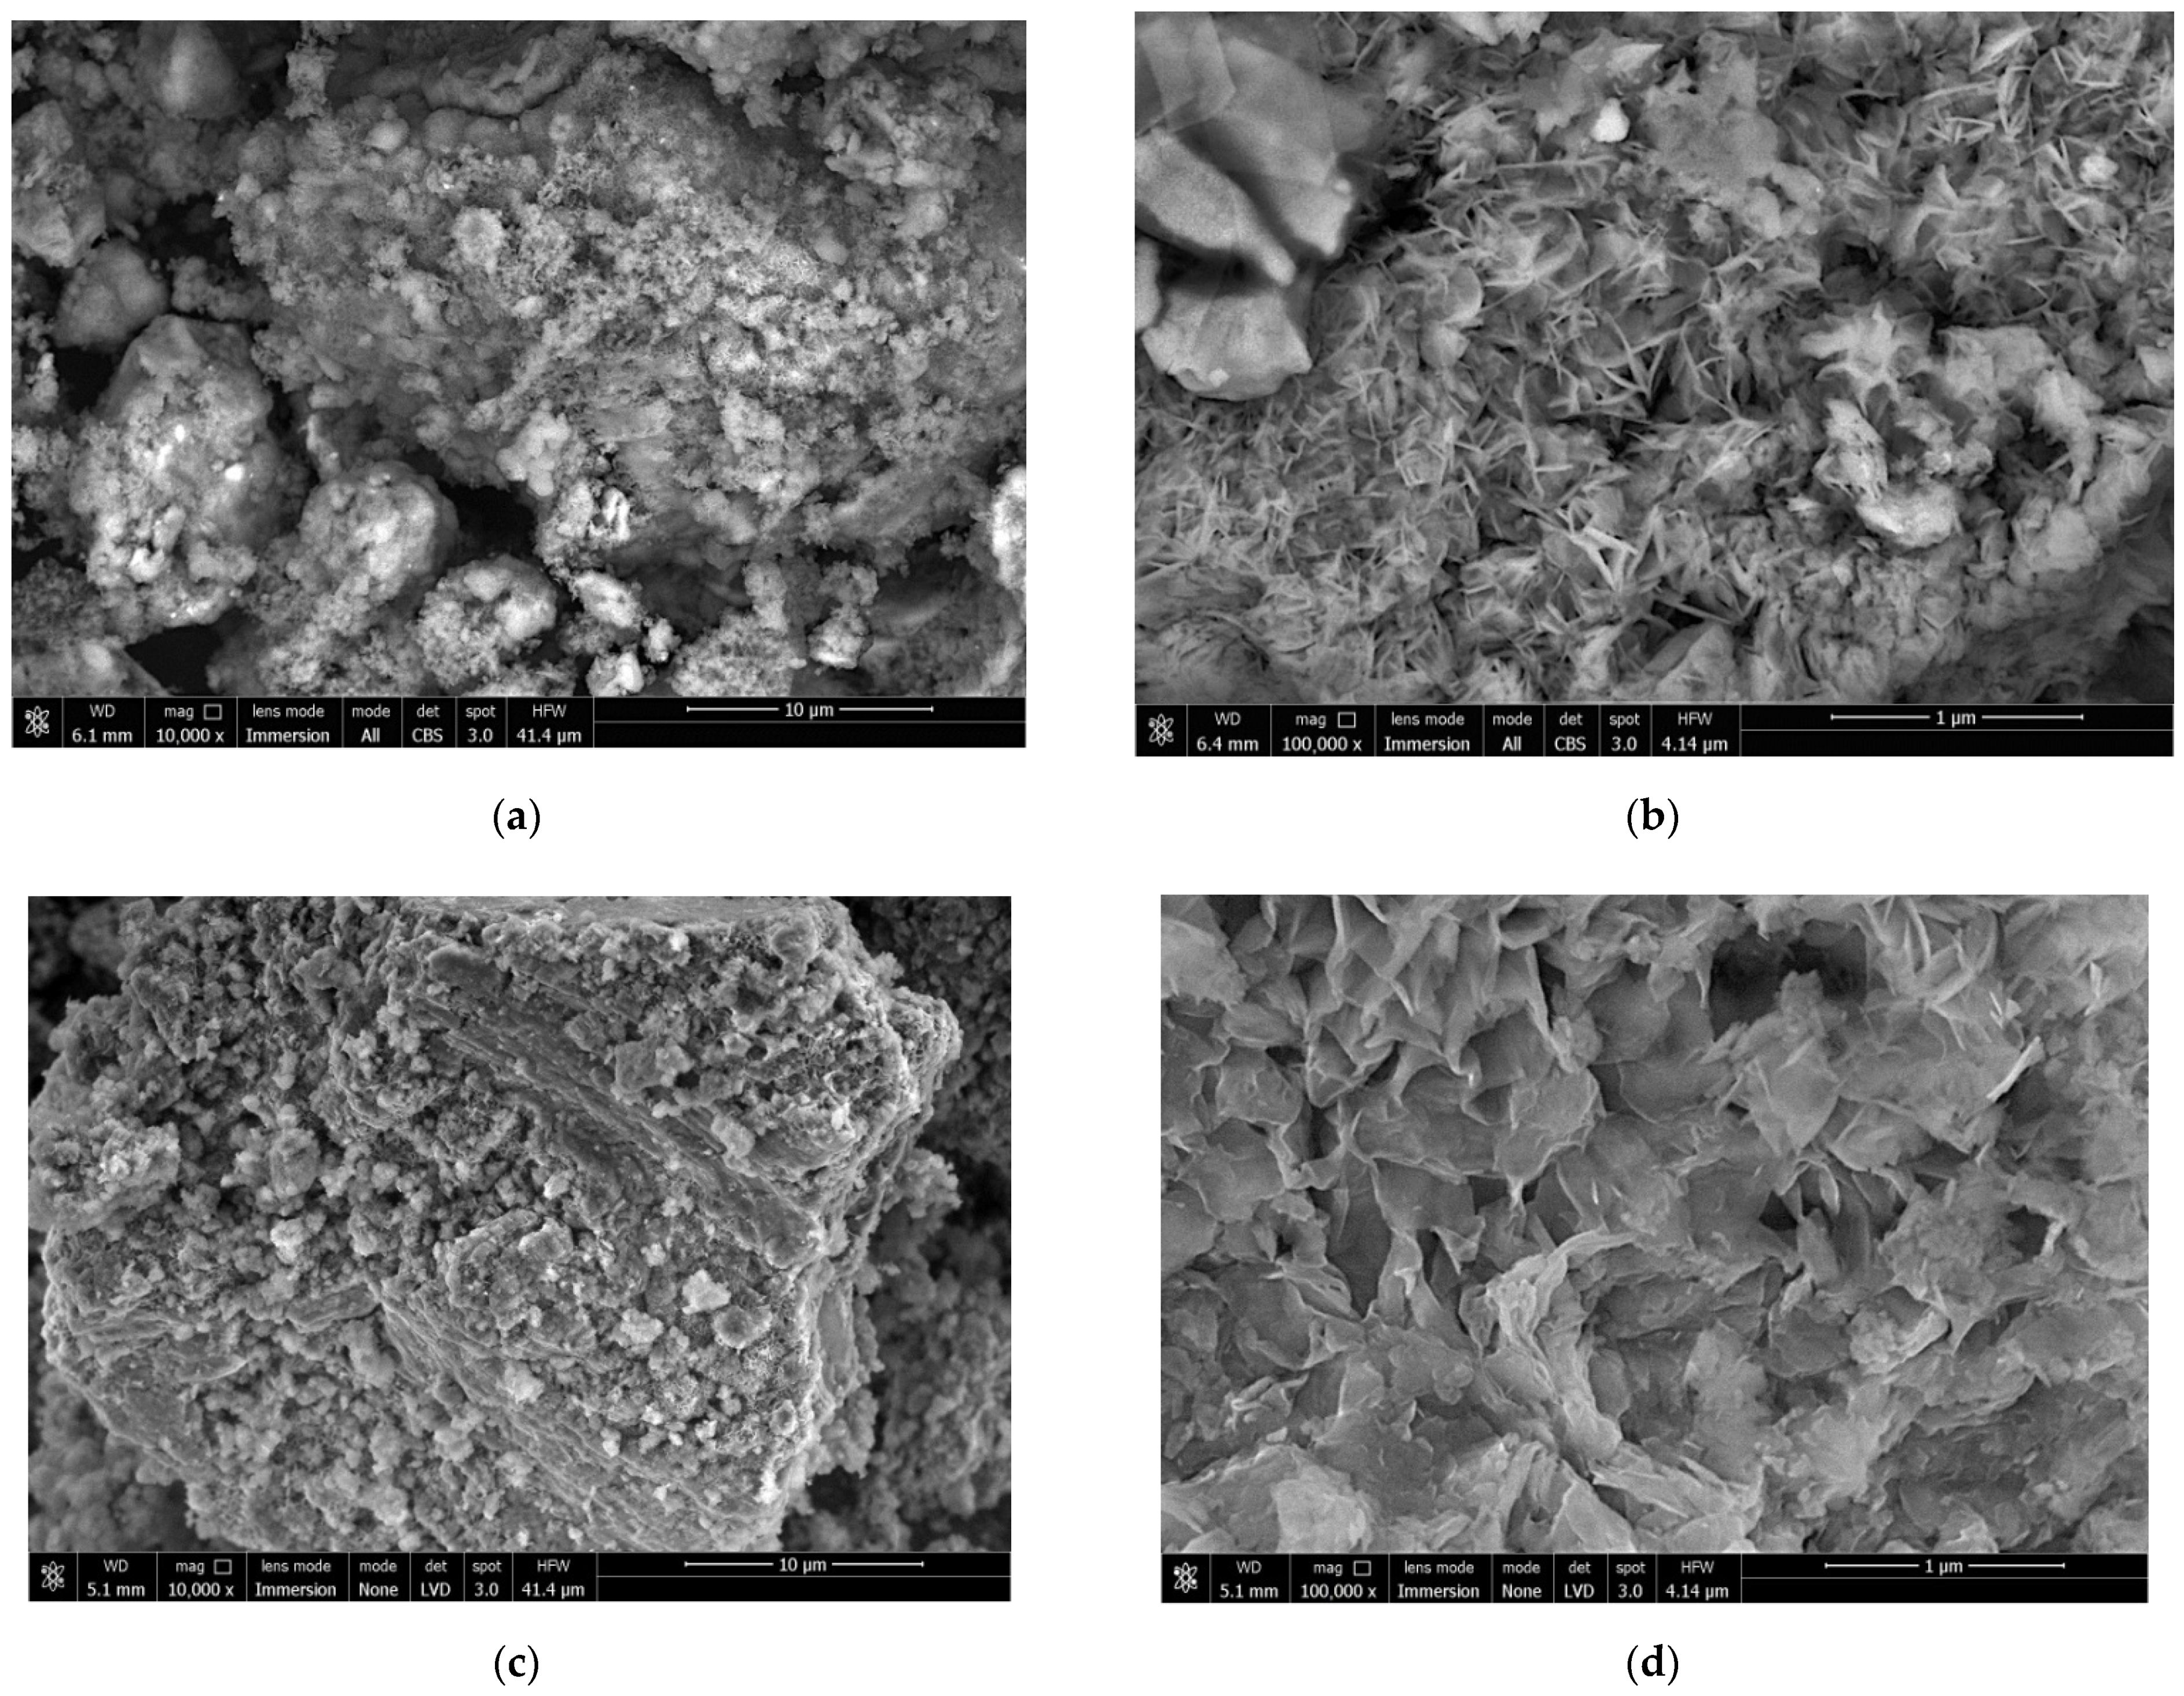
3.3.2. Investigation by Scanning Electron Microscopy

The BSE images of the reaction product samples are represented in Figure 13. As it can be seen from the images, for the sample comprising metal scrap and KCl, the solid reaction product formed highly irregular structures on the particle surfaces. These irregular structures included clusters of large-sized ‘flakes’ (~100–500 nm), along with spongy areas formed by much smaller structure elements that looked similar to moss cover. The product layer corresponding to the sample manufactured with metal scrap, KCl, and Wood’s alloy also had a very irregular morphology. The said morphology was characterized by porous structures formed of large-sized flakes and regions where the product layer formed in a much more ‘compact’ and dense manner. For the sample composed of metal scrap and Wood’s alloy, the visible particle surfaces were totally covered with clusters composed of large-scale flakes. As for the sample manufactured of scrap without additives, not all of the captured particles were covered with large-sized flakes. The surfaces of the larger particles had quite irregular morphologies including ‘mossy’ areas, while almost all of the smaller particles looked like clusters of large-sized flakes.
It can be assumed that the structures composed of large-scale flakes were more liquid-permeable compared to the spongy areas formed by fine-structured elements. Although visual assessment of the sizes of large-scale flakes for different samples is not sufficient for making any final conclusions, the flakes for the samples containing Wood’s alloy and for the sample without additives seemed to be generally larger than those for the sample with the KCl additive only.

3.4. Summarization and Discussion of the Results

The kinetic curves for all the experiments were approximated by Equation (2), and from those approximations, the values of the reaction rate constant (k) were derived. The obtained k values were used for graphical determination of the activation energy (Ea) from Arrhenius plots based on Equation (3). The Arrhenius plots for all powder samples are represented in Figure 14. The data on reaction constants and activation energy are given in Table 2. The calculated results demonstrated that the powder containing 20 wt.% KCl had the lowest activation energy of (7.0 ± 0.8) kJ/mol, the sample comprising 10 wt.% KCl and 10 wt.% Wood’s alloy had a higher activation energy of (30.6 ± 2.9) kJ, the scrap ball-milled without additives had a somewhat higher activation energy of (35.9 ± 2.5) kJ, and the highest activation energy of (48.6 ± 4.8) kJ corresponded to the sample with 20 wt.% Wood’s alloy.
For easier summarization of the study results and their discussion, the total hydrogen yields and maximum hydrogen evolution rates for all experiments were gathered in Table 3. The main findings based on the reaction kinetics data, results of sample analyses, and calculations were the following:
-
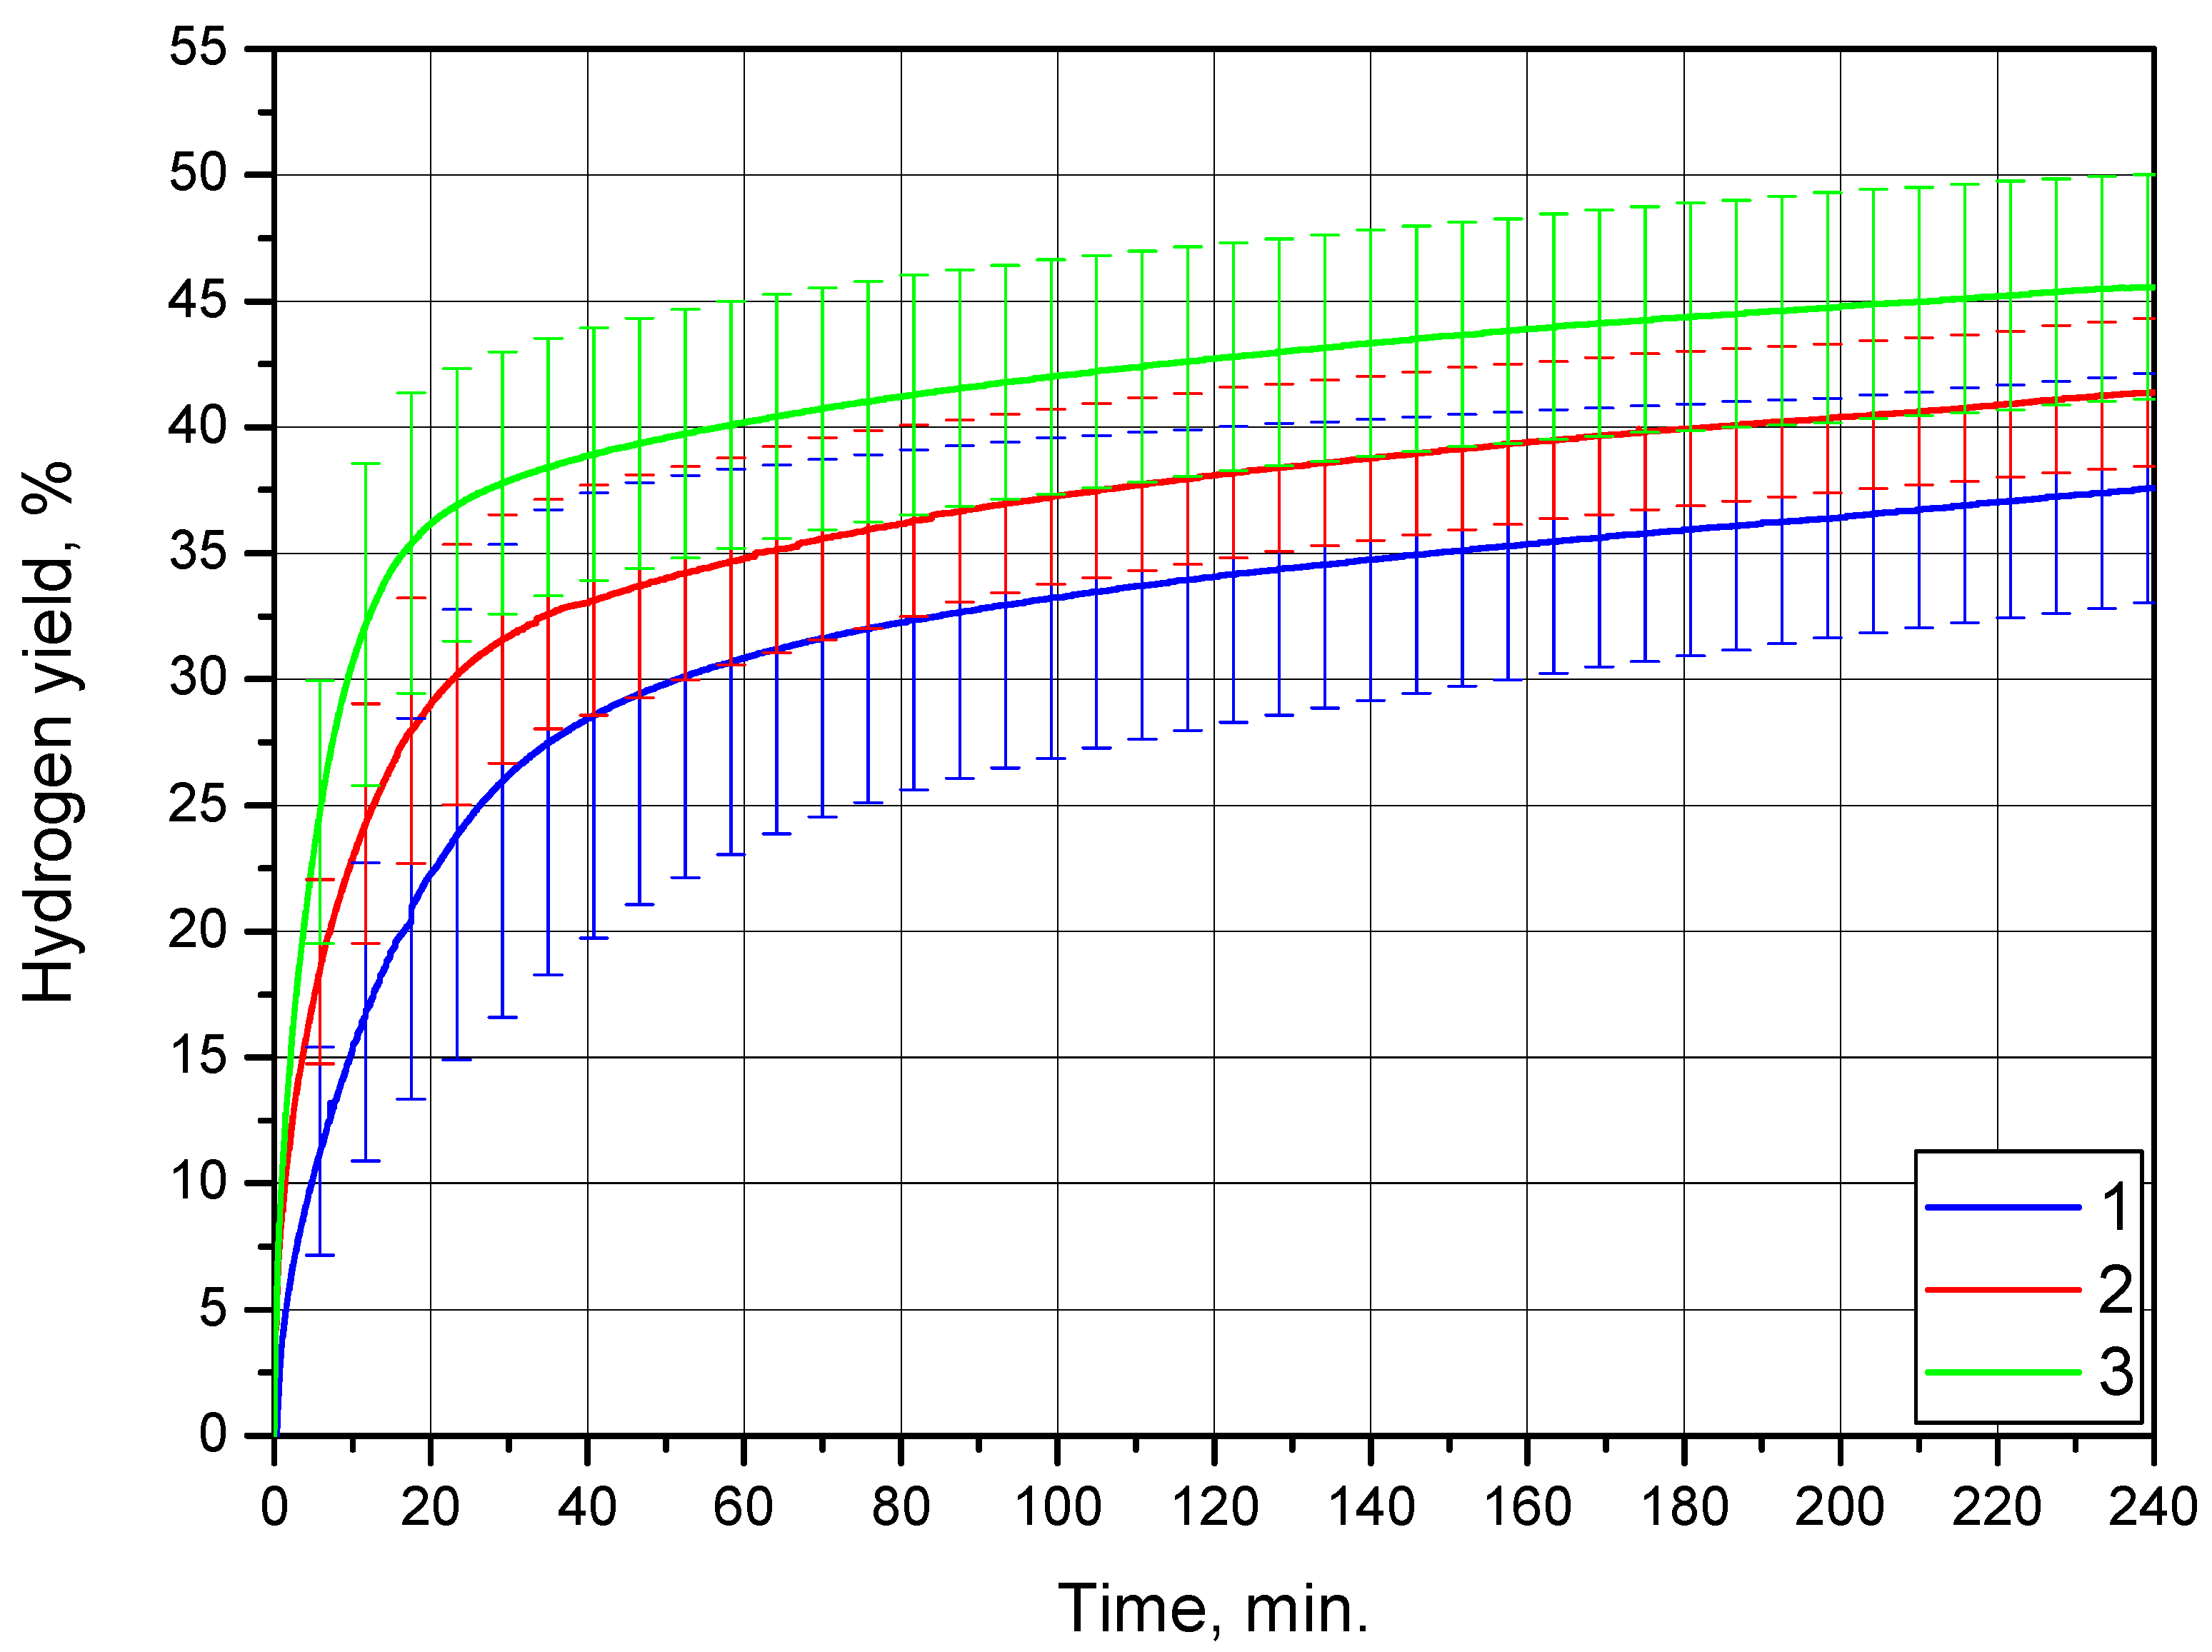
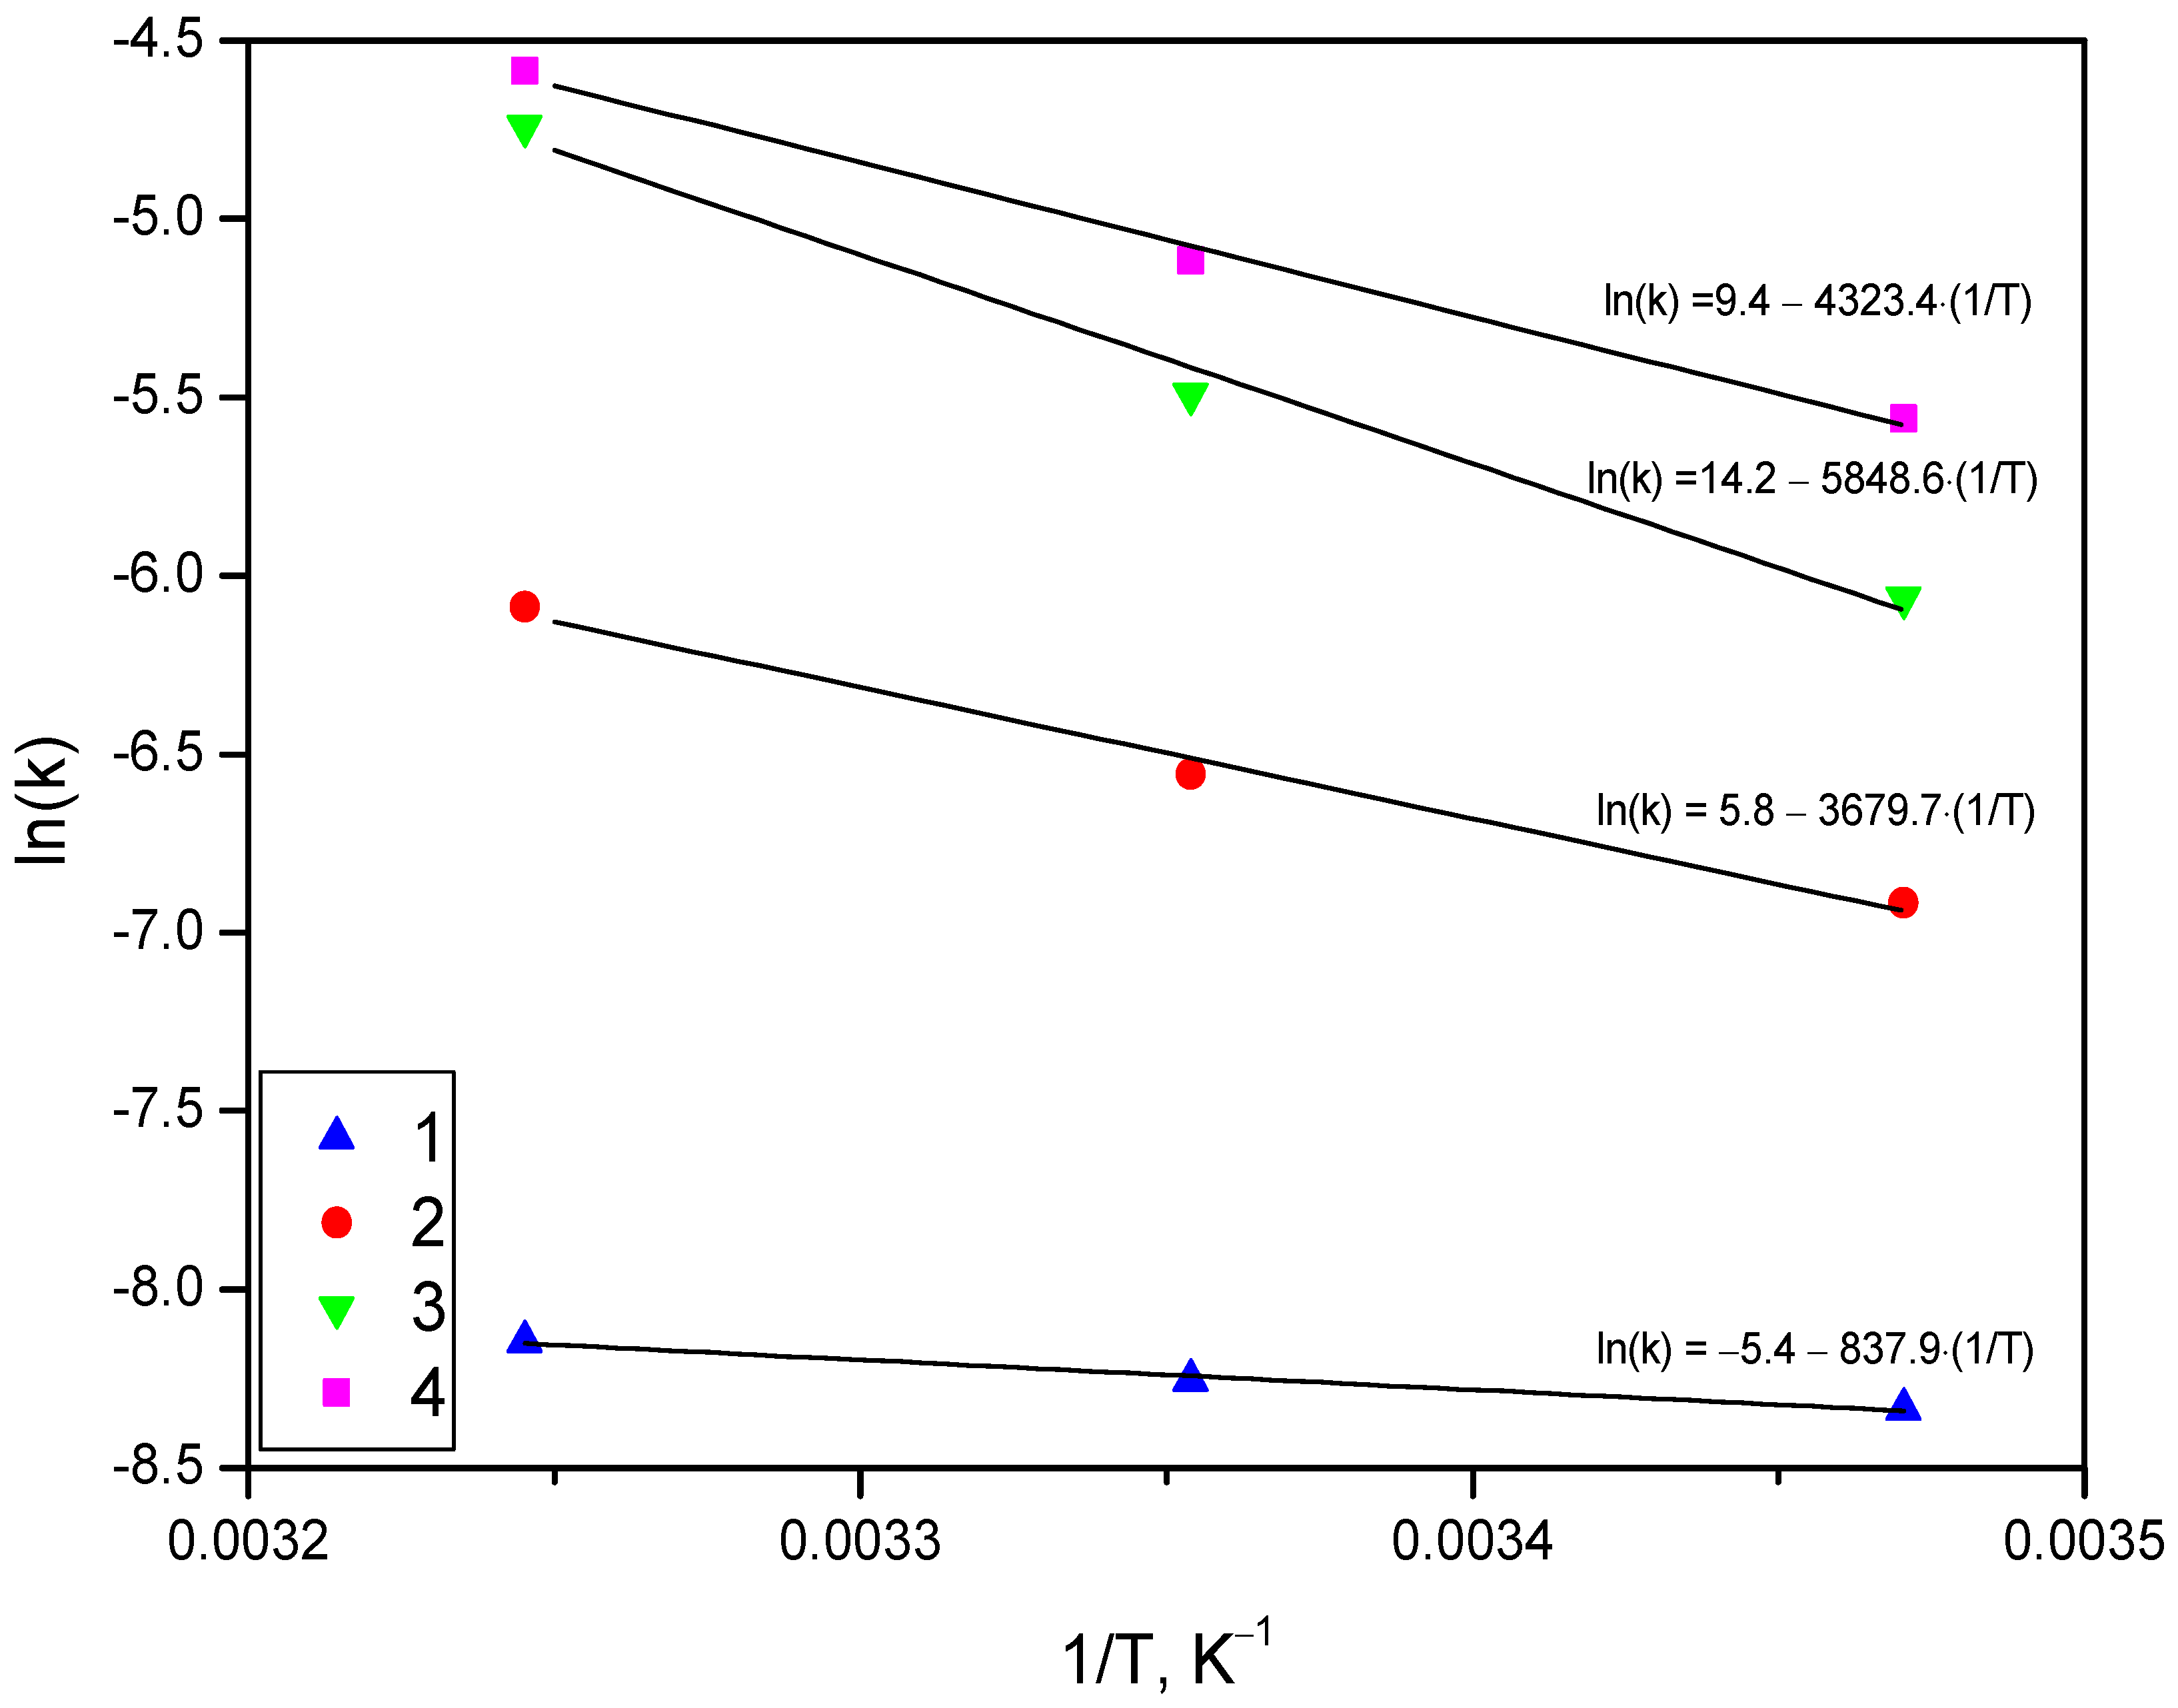
Powder containing 20 wt.% KCl provided the highest hydrogen evolution rate at the beginning of the reaction. It had the finest particles and, presumably, the largest specific surface area. Its activation energy was the lowest. The two latter facts were the reasons for the highest initial reaction rates. However, this sample provided the lowest hydrogen yield for 4 h of experimentation. Such an effect was attributed to the formation of a ‘dense’ and ‘compact’ reaction product layer on the surface of the powder particles. The product layer structure included large, ‘mossy’ areas of fine-structured elements that were likely low-permeable to liquid with clusters of large-sized ‘flakes’, which, however, were not abundant at all;
-
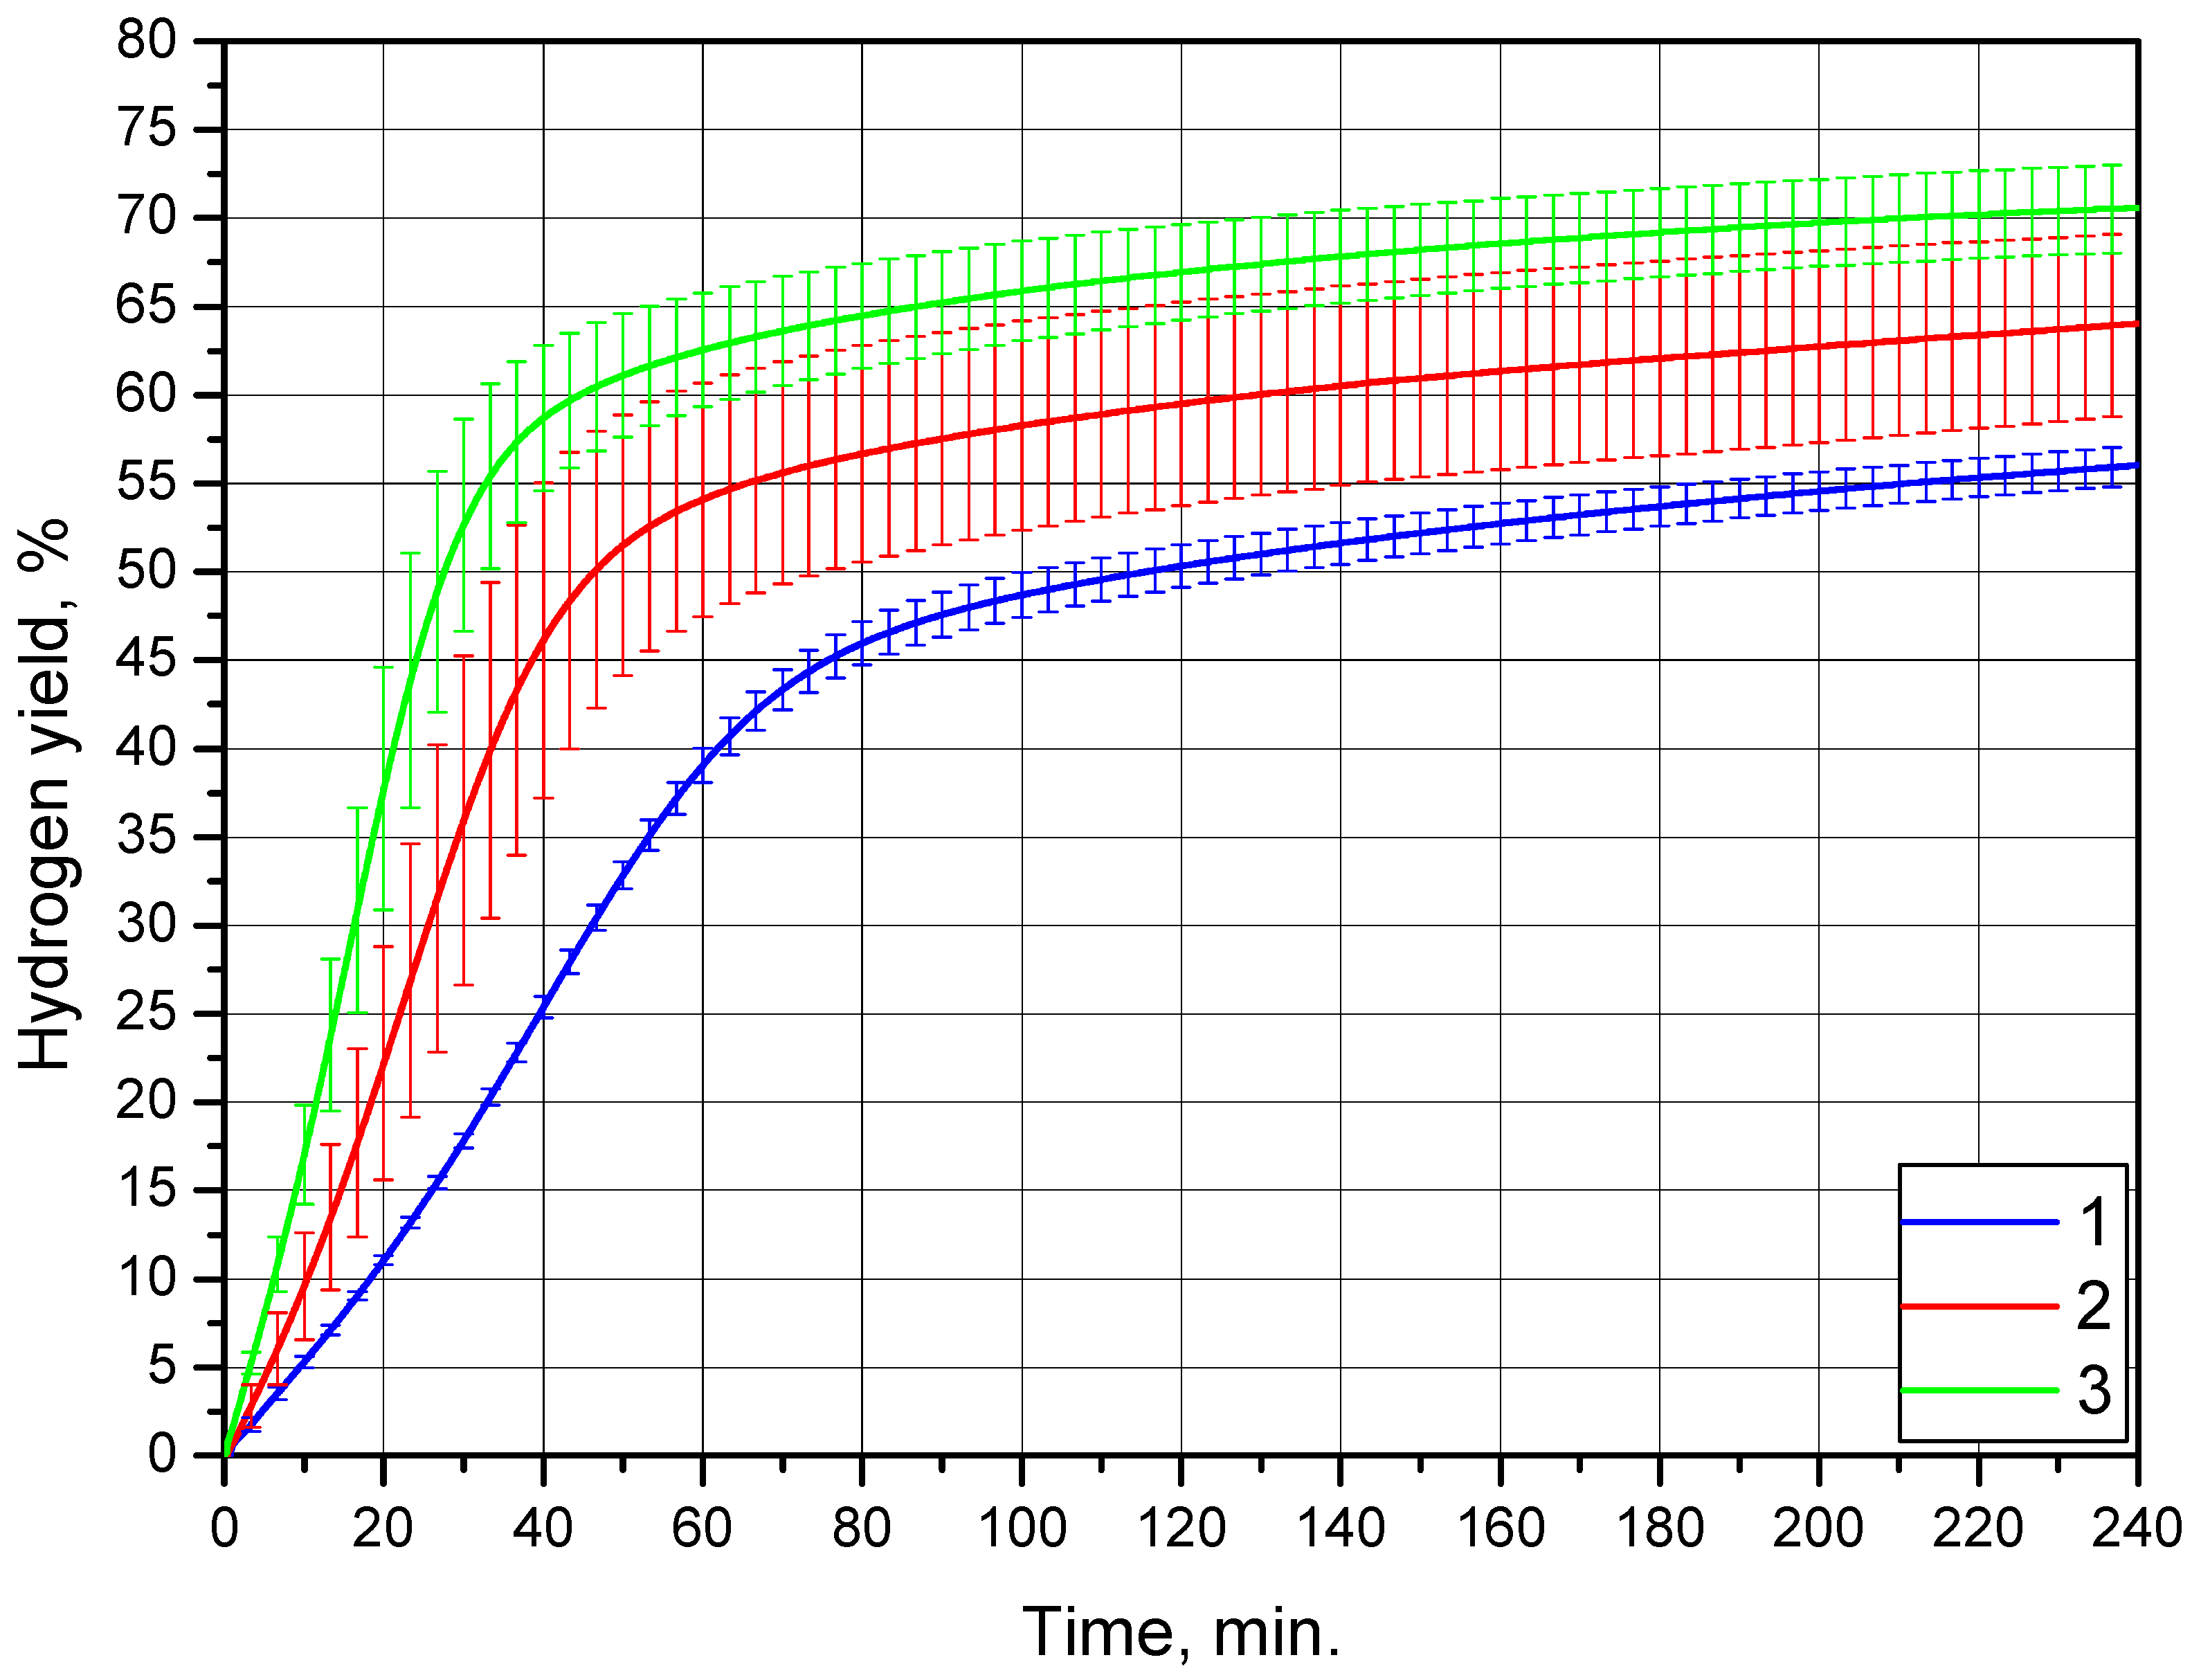
Powder activated with 20 wt.% Wood’s alloy provided the lowest hydrogen evolution rates at the beginning. Its particle size was the second-largest, and the specific surface area was likely the third-largest among the four samples. It had the highest activation energy. The lowest initial reaction rate possibly resulted from the combination of a low specific surface area and high activation energy. However, the hydrogen yields for this sample were higher than those for the powders with KCl but comparable with those for the ball-milled scrap without additives. The high hydrogen yields were achieved due to the fact that the reaction product structure covering the particles was almost entirely formed by large-sized ‘flakes’. Due to this, the product layer remained highly permeable to liquid for a long time during the reaction. It should be noted that the negligible effect of alloying for this sample (compared to the ball-milled scrap) could be attributed to possible screening effects from some of its compounds with Mg scrap due to extra concentration in the sample. The said effects could suppress the activation effect from the formation of microgalvanic couples of Mg and Wood’s alloy components by ball milling;
-
Powder with both 10 wt.% KCl and 10 wt.% Wood’s alloy had its maximum hydrogen evolution rate exceeding that of the sample with 20 wt.% Wood’s alloy and falling below that for the sample with 20 wt.% KCl. The particle size and hydrogen yield for this sample fell between these values for the powders with KCl and Wood’s alloy. Its product layer morphology contained both ‘mossy’ areas typical for a sample activated with salt and large-sized ‘flakes’ presented on a particle surface of the reacted alloyed sample. Its activation energy was the second-lowest among the four samples;
-
Powder of the scrap ball-milled without additives had the second-highest activation energy. Its maximum hydrogen evolution rate fell between the relevant values for the powder with 20 wt.% Wood’s alloy and that with both (salt and alloy) additives. It had the largest particle size and, presumably, the smallest specific surface area. The hydrogen yields for this sample were close to or higher than those for the one with 20 wt.% Wood’s alloy. Such an effect was attributed to a combination of the following factors: the accumulation of plenty of lattice imperfections favoring pitting corrosion from ball milling, the absence of any crystal grain screening compounds, and the formation of the product layer mostly in the form of clusters of large-sized ‘flakes’.
Thus, under the considered reaction and ball-milling conditions, the implementation of KCl as an additive resulted in the lowest conversion of Mg-Al scrap into hydrogen. Moreover, this material required careful handling due to its combustible nature and demonstrated a high uncertainty for ‘Hydrogen Yield vs Time’ dependencies. Although the results obtained for ball-milled scrap samples looked competitive with those for the composites with Wood’s alloy, this alloying additive still has potential for application because of its low melting temperature. It was suspected that the alloy concentrations tested in this study may turn out to be excessive, leading to the opposite effects, and that the alloy portion can be substantially reduced. Therefore, further investigations on adjusting the content of Wood’s alloy and ball-milling conditions should be performed in order to reveal the optimal composition and to elaborate usable material for hydrogen production. The tested temperature interval can be extended as well.
It should be noted, however, that Pb and Cd can produce some toxic influences, and this is the reason why Wood’s alloy should be handled in a proper manner. Thus, the alloyed hydroreactive materials are not intended for implementation everywhere by everyone. After optimization of the alloy content, a toxicity characteristic leaching procedure (TCLP) should be performed for the reaction products in order to avoid contamination with heavy metals. Depending on the results, the product can be disposed of with common waste, undergo decontamination procedures, or be utilized in some other way. The produced hydrogen should be tested for corrosive or toxic properties as well to determine whether its treatment is required. However, Wood’s alloy is a commercial product and, at aircraft manufacturing plants, Mg-Al scrap is available in abundance. Therefore, the said hydroreactive materials have potential for in situ production and conversion into hydrogen to provide energy for balance-of-plant needs.

4. Conclusions

In the present study, the hydrogen production performances of different powder composites elaborated by ball milling were compared. It was shown that the samples with a salt additive had the finest particle size and provided fast reactions proceeding in the beginning of the process. However, after a longer reaction time, their hydrogen yields turned out to be considerably lower than those for the samples without salt, although for some time after the beginning, they reacted quite slowly.
The observed effects resulted from the difference in the powder particle sizes (apparently affecting specific surface area), crystal lattice imperfections accumulated during ball milling, which enhance pitting corrosion in the presence of Cl ions, morphology of the solid reaction product particles covering the powders, and the contradicting effects from the potential formation of reaction-enhancing microgalvanic cells and reaction-hindering crystal grain screening compounds of the alloy and metal scrap components.
It was demonstrated that, in the reaction beginning, the sample with 20 wt.% KCl rapidly reacted with the aqueous solution because it was composed of the finest powder particles (and, subsequently, had large specific surface area). However, after nearly 20 min, the reaction was largely slowed down due to the formation of a ‘dense’ and ‘compact’ reaction product layer covering the particles. The investigated reaction product morphology for this sample suggested this version, while for other reaction product samples, the aggregations of large-sized ‘flakes’ covered either the entire particle surface or a large part.
The hydrogen yield for the sample with 20 wt.% Wood’s alloy was one of the highest for 4 h of experiment. This additive was expected to create ‘microgalvanic cells’ of Mg-Al scrap and Wood’s alloy heavy metal components. The said ‘microgalvanic cells’ were intended to induce anodic Mg dissolution in the conductive media, ensuring enhanced hydrogen production. However, the effect of Wood’s alloy was negligible compared to the data obtained for the powder of the ball-milled scrap without additives. It is known that some compounds originating from alloying tend to locate along crystal grain boundaries. If their amounts are not exceeding a certain optimal value, they can promote corrosion of the base metal in the grains. However, extra amounts of some compounds or elements can lead to an opposite effect of screening grains from liquid. For the present study, it was assumed that the obtained results were associated with alloy contents largely exceeding the optimal value.
The sample composed of 10 wt.% KCl and 10 wt.% Wood’s alloy was expected to demonstrate the best hydrogen production performance in terms of yield and reaction rate due to the synergetic effect of particle size reduction and the formation of ‘galvanic couples’. However, the results for this composition fell between those obtained for the two samples discussed above.
For the ball-milled sample without additives, it was established that it combined a number of reaction-enhancing properties of other powder samples. In particular, it did not contain compounds potentially screening base metal grains, it presumably accumulated many structure defects from ball milling, and its reaction product formed structures containing many clusters of large-sized ‘flakes’.

Author Contributions

O.A.B., M.S.V. and A.I.K. designed the study; A.O.D. and G.N.A. wrote the introduction section; G.E.V. and A.V.G. performed analyses of the samples; O.A.B., A.O.D. and G.N.A. carried out the experiments; O.A.B. analyzed the results and wrote the rest of the manuscript; M.S.V. and A.I.K. supervised the study and edited the manuscript. All authors have read and agreed to the published version of the manuscript.

Funding

This work was funded by the Ministry of Science and Higher Education of the Russian Federation (State Assignment No. 075-01056-22-00).

Acknowledgments

This work was supported by the Ministry of Science and Higher Education of the Russian Federation (State Assignment No. 075-01056-22-00). (Recipients Buryakovskaya O.A., Vlaskin M.S., Valyano G.E., Grigorenko A.V., Ambaryan G.N., Dudoladov A.O.). This paper was prepared with the support of the ‘RUDN University Program [RUDN University Strategic Academic Leadership Program]’ (Recipient Kurbatova A.I.)

Conflicts of Interest

The authors declare no conflict of interest.

References

  1. Fedotkina, O.; Gorbashko, E.; Vatolkina, N. Circular Economy in Russia: Drivers and Barriers for Waste Management Development. Sustainability 2019, 11, 5837. [Google Scholar] [CrossRef] [Green Version]
  2. Kurbatova, A.; Abu-Qdais, H.A. Using Multi-Criteria Decision Analysis to Select Waste to Energy Technology for a Mega City: The Case of Moscow. Sustainability 2020, 12, 9828. [Google Scholar] [CrossRef]
  3. Kuusiola, T.; Wierink, M.; Heiskanen, K. Comparison of Collection Schemes of Municipal Solid Waste Metallic Fraction: The Impacts on Global Warming Potential for the Case of the Helsinki Metropolitan Area, Finland. Sustainability 2012, 4, 2586–2610. [Google Scholar] [CrossRef] [Green Version]
  4. Leite, R.; Amorim, M.; Rodrigues, M.; Neto, G.O. Overcoming Barriers for Adopting Cleaner Production: A Case Study in Brazilian Small Metal-Mechanic Companies. Sustainability 2019, 11, 4808. [Google Scholar] [CrossRef] [Green Version]
  5. Ouyang, L.; Jiang, J.; Chen, K.; Zhu, M.; Liu, Z. Hydrogen Production via Hydrolysis and Alcoholysis of Light Metal-Based Materials: A Review. Nano-Micro Lett. 2021, 13, 134. [Google Scholar] [CrossRef]
  6. Kara, S.; Erdem, S.; Lezcano, R.A. MgO-Based Cementitious Composites for Sustainable and Energy Efficient Building Design. Sustainability 2021, 13, 9188. [Google Scholar] [CrossRef]
  7. Grigorenko, A.; Vlaskin, M. Densification of Porous Aluminum Oxide Powder by Plasma Arc Treatment. IOP Conf. Ser. Mater. Sci. Eng. 2018, 381, 012050. [Google Scholar] [CrossRef] [Green Version]
  8. Silveira, N.C.G.; Martins, M.L.F.; Bezerra, A.C.S.; Araújo, F.G.S. Red Mud from the Aluminium Industry: Production, Characteristics, and Alternative Applications in Construction Materials—A Review. Sustainability 2021, 13, 12741. [Google Scholar] [CrossRef]
  9. Ercoli, R.; Orlando, A.; Borrini, D.; Tassi, F.; Bicocchi, G.; Renzulli, A. Hydrogen-Rich Gas Produced by the Chemical Neutralization of Reactive By-Products from the Screening Processes of the Secondary Aluminum Industry. Sustainability 2021, 13, 12261. [Google Scholar] [CrossRef]
  10. Yam, B.J.Y.; Le, D.K.; Do, N.H.; Nguyen, P.T.T.; Thai, Q.B.; Phan-Thien, N.; Duong, H.M. Recycling of magnesium waste into magnesium hydroxide aerogels. J. Environ. Chem. Eng. 2020, 8, 104101. [Google Scholar] [CrossRef]
  11. Oslanec, P.; Iždinský, K.; Simančík, F. Possibilities of magnesium recycling. Mater. Sci. Technol. 2008, 4, 83–88. [Google Scholar]
  12. Viswanadhapalli, B.; Bupesh Raja, V.K. Application of Magnesium Alloys in Automotive Industry—A Review. In International Conference on Emerging Current Trends in Computing and Expert Technology; Hemanth, D.J., Kumar, V.D.A., Malathi, S., Castillo, O., Patrut, B., Eds.; Springer International Publishing: Cham, Switzerland, 2020; pp. 519–531. [Google Scholar]
  13. Li, Z.; Wang, Q.; Luo, A.A.; Peng, L.; Zhang, P. Fatigue behavior and life prediction of cast magnesium alloys. Mater. Sci. Eng. A 2015, 647, 113–126. [Google Scholar] [CrossRef]
  14. Mukhina, I.Y.; Trofimov, N.V.; Leonov, A.A.; Rostovtseva, A.S. Development of Resource-Saving Technological Processes in the Metallurgy of Magnesium. Russ. Metall. 2021, 2021, 1394–1401. [Google Scholar] [CrossRef]
  15. Uan, J.-Y.; Cho, C.-Y.; Liu, K.-T. Generation of hydrogen from magnesium alloy scraps catalyzed by platinum-coated titanium net in NaCl aqueous solution. Int. J. Hydrogen Energy 2007, 32, 2337–2343. [Google Scholar] [CrossRef]
  16. Uan, J.-Y.; Yu, S.-H.; Lin, M.-C.; Chen, L.-F.; Lin, H.-I. Evolution of hydrogen from magnesium alloy scraps in citric acid-added seawater without catalyst. Int. J. Hydrogen Energy 2009, 34, 6137–6142. [Google Scholar] [CrossRef]
  17. Uan, J.-Y.; Lin, M.-C.; Cho, C.-Y.; Liu, K.-T.; Lin, H.-I. Producing hydrogen in an aqueous NaCl solution by the hydrolysis of metallic couples of low-grade magnesium scrap and noble metal net. Int. J. Hydrogen Energy 2009, 34, 1677–1687. [Google Scholar] [CrossRef]
  18. Yu, S.-H.; Uan, J.-Y.; Hsu, T.-L. Effects of concentrations of NaCl and organic acid on generation of hydrogen from magnesium metal scrap. Int. J. Hydrogen Energy 2012, 37, 3033–3040. [Google Scholar] [CrossRef]
  19. Setiani, P.; Watanabe, N.; Sondari, R.R.; Tsuchiya, N. Mechanisms and kinetic model of hydrogen production in the hydrothermal treatment of waste aluminum. Mater. Renew. Sustain. Energy 2018, 7, 10. [Google Scholar] [CrossRef]
  20. Buryakovskaya, O.A.; Meshkov, E.A.; Vlaskin, M.S.; Shkolnokov, E.I.; Zhuk, A.Z. Utilization of Aluminum Waste with Hydrogen and Heat Generation. IOP Conf. Ser. Mater. Sci. Eng. 2017, 250, 012007. [Google Scholar] [CrossRef]
  21. Ambaryan, G.N.; Vlaskin, M.S.; Dudoladov, A.O.; Meshkov, E.A.; Zhuk, A.Z.; Shkolnikov, E.I. Hydrogen generation by oxidation of coarse aluminum in low content alkali aqueous solution under intensive mixing. Int. J. Hydrogen Energy 2016, 41, 17216–17224. [Google Scholar] [CrossRef]
  22. Ambaryan, G.N.; Vlaskin, M.S.; Zhuk, A.Z.; Shkol’nikov, E.I. Preparation of High-Purity Aluminum Oxide via Mechanochemical Oxidation of Aluminum in a 0.1 M KOH Solution, Followed by Chemical and Heat Treatments. Inorg. Mater. 2019, 55, 244–255. [Google Scholar] [CrossRef]
  23. Hiraki, T.; Yamauchi, S.; Iida, M.; Uesugi, H.; Akiyama, T. Process for Recycling Waste Aluminum with Generation of High-Pressure Hydrogen. Environ. Sci. Technol. 2007, 41, 4454–4457. [Google Scholar] [CrossRef] [PubMed]
  24. Xiao, F.; Yang, R.; Liu, Z. Active aluminum composites and their hydrogen generation via hydrolysis reaction: A review. Int. J. Hydrogen Energy 2021, 47, 365–386. [Google Scholar] [CrossRef]
  25. Grosjean, M.H.; Zidoune, M.; Roué, L. Hydrogen production from highly corroding Mg-based materials elaborated by ball milling. J. Alloys Compd. 2005, 404–406, 712–715. [Google Scholar] [CrossRef]
  26. Grosjean, M.H.; Zidoune, M.; Roué, L.; Huot, J.Y. Hydrogen production via hydrolysis reaction from ball-milled Mg-based materials. Int. J. Hydrogen Energy 2006, 31, 109–119. [Google Scholar] [CrossRef]
  27. Zou, M.-S.; Yang, R.-J.; Guo, X.-Y.; Huang, H.-T.; He, J.-Y.; Zhang, P. The preparation of Mg-based hydro-reactive materials and their reactive properties in seawater. Int. J. Hydrogen Energy 2011, 36, 6478–6483. [Google Scholar] [CrossRef]
  28. Wang, C.; Yang, T.; Liu, Y.; Ruan, J.; Yang, S.; Liu, X. Hydrogen generation by the hydrolysis of magnesium–aluminum–iron material in aqueous solutions. Int. J. Hydrogen Energy 2014, 39, 10843–10852. [Google Scholar] [CrossRef]
  29. Zou, M.-S.; Guo, X.-Y.; Huang, H.-T.; Yang, R.-J.; Zhang, P. Preparation and characterization of hydro-reactive Mg–Al mechanical alloy materials for hydrogen production in seawater. J. Power Sources 2012, 219, 60–64. [Google Scholar] [CrossRef]
  30. Sevastyanova, L.G.; Genchel, V.K.; Klyamkin, S.N.; Larionova, P.A.; Bulychev, B.M. Hydrogen generation by oxidation of “mechanical alloys” of magnesium with iron and copper in aqueous salt solutions. Int. J. Hydrogen Energy 2017, 42, 16961–16967. [Google Scholar] [CrossRef]
  31. Kravchenko, O.V.; Sevastyanova, L.G.; Urvanov, S.A.; Bulychev, B.M. Formation of hydrogen from oxidation of Mg, Mg alloys and mixture with Ni, Co, Cu and Fe in aqueous salt solutions. Int. J. Hydrogen Energy 2014, 39, 5522–5527. [Google Scholar] [CrossRef]
  32. Li, S.-L.; Lin, H.-M.; Uan, J.-Y. Production of an Mg/Mg2Ni lamellar composite for generating H2 and the recycling of the post-H2 generation residue to nickel powder. Int. J. Hydrogen Energy 2013, 38, 13520–13528. [Google Scholar] [CrossRef]
  33. Ha, H.-Y.; Kang, J.-Y.; Yang, J.; Yim, C.D.; You, B.S. Role of Sn in corrosion and passive behavior of extruded Mg-5 wt%Sn alloy. Corros. Sci. 2016, 102, 355–362. [Google Scholar] [CrossRef]
  34. Li, S.-L.; Song, J.-M.; Uan, J.-Y. Mg-Mg2X (X = Cu, Sn) eutectic alloy for the Mg2X nano-lamellar compounds to catalyze hydrolysis reaction for H2 generation and the recycling of pure X metals from the reaction wastes. J. Alloys Compd. 2019, 772, 489–498. [Google Scholar] [CrossRef]
  35. Buryakovskaya, O.A.; Vlaskin, M.S.; Ryzhkova, S.S. Hydrogen production properties of magnesium and magnesium-based materials at low temperatures in reaction with aqueous solutions. J. Alloys Compd. 2019, 785, 136–145. [Google Scholar] [CrossRef]
  36. Tan, W.; Yang, Y.; Fang, Y. Isothermal hydrogen production behavior and kinetics of bulk eutectic Mg–Ni-based alloys in NaCl solution. J. Alloys Compd. 2020, 826, 152363. [Google Scholar] [CrossRef]
  37. Xiao, F.; Guo, Y.; Yang, R.; Li, J. Hydrogen generation from hydrolysis of activated magnesium/low-melting-point metals alloys. Int. J. Hydrogen Energy 2019, 44, 1366–1373. [Google Scholar] [CrossRef]
  38. Oh, S.; Kim, M.; Eom, K.; Kyung, J.; Kim, D.; Cho, E.; Kwon, H. Design of Mg–Ni alloys for fast hydrogen generation from seawater and their application in polymer electrolyte membrane fuel cells. Int. J. Hydrogen Energy 2016, 41, 5296–5303. [Google Scholar] [CrossRef]
  39. Hou, X.; Wang, Y.; Yang, Y.; Hu, R.; Yang, G.; Feng, L.; Suo, G.; Ye, X.; Zhang, L.; Shi, H.; et al. Enhanced hydrogen generation behaviors and hydrolysis thermodynamics of as-cast Mg–Ni–Ce magnesium-rich alloys in simulate seawater. Int. J. Hydrogen Energy 2019, 44, 24086–24097. [Google Scholar] [CrossRef]
  40. Hou, X.; Wang, Y.; Yang, Y.; Hu, R.; Yang, G.; Feng, L.; Suo, G. Microstructure evolution and controlled hydrolytic hydrogen generation strategy of Mg-rich Mg-Ni-La ternary alloys. Energy 2019, 188, 116081. [Google Scholar] [CrossRef]
  41. Kantürk Figen, A.; Coşkuner Filiz, B. Hydrogen production by the hydrolysis of milled waste magnesium scraps in nickel chloride solutions and nickel chloride added in Marmara Sea and Aegean Sea Water. Int. J. Hydrogen Energy 2015, 40, 16169–16177. [Google Scholar] [CrossRef]
  42. Kantürk Figen, A.; Coşkuner, B.; Pişkin, S. Hydrogen generation from waste Mg based material in various saline solutions (NiCl2, CoCl2, CuCl2, FeCl3, MnCl2). Int. J. Hydrogen Energy 2015, 40, 7483–7489. [Google Scholar] [CrossRef]
  43. Shetty, T.; Szpunar, J.A.; Faye, O.; Eduok, U. A comparative study of hydrogen generation by reaction of ball milled mixture of magnesium powder with two water-soluble salts (NaCl and KCl) in hot water. Int. J. Hydrogen Energy 2020, 45, 25890–25899. [Google Scholar] [CrossRef]
  44. Liu, Y.; Wang, X.; Dong, Z.; Liu, H.; Li, S.; Ge, H.; Yan, M. Hydrogen generation from the hydrolysis of Mg powder ball-milled with AlCl3. Energy 2013, 53, 147–152. [Google Scholar] [CrossRef]
  45. Razavi-Tousi, S.S.; Szpunar, J.A. Effect of addition of water-soluble salts on the hydrogen generation of aluminum in reaction with hot water. J. Alloys Compd. 2016, 679, 364–374. [Google Scholar] [CrossRef]
  46. Razavi-Tousi, S.S.; Szpunar, J.A. Effect of structural evolution of aluminum powder during ball milling on hydrogen generation in aluminum–water reaction. Int. J. Hydrogen Energy 2013, 38, 795–806. [Google Scholar] [CrossRef]
  47. Mahmoodi, K.; Alinejad, B. Enhancement of hydrogen generation rate in reaction of aluminum with water. Int. J. Hydrogen Energy 2010, 35, 5227–5232. [Google Scholar] [CrossRef]
  48. Alinejad, B.; Mahmoodi, K. A novel method for generating hydrogen by hydrolysis of highly activated aluminum nanoparticles in pure water. Int. J. Hydrogen Energy 2009, 34, 7934–7938. [Google Scholar] [CrossRef]
  49. Al Bacha, S.; Awad, A.S.; El Asmar, E.; Tayeh, T.; Bobet, J.L.; Nakhl, M.; Zakhour, M. Hydrogen generation via hydrolysis of ball milled WE43 magnesium waste. Int. J. Hydrogen Energy 2019, 44, 17515–17524. [Google Scholar] [CrossRef]
  50. Al Bacha, S.; Pighin, S.A.; Urretavizcaya, G.; Zakhour, M.; Castro, F.J.; Nakhl, M.; Bobet, J.L. Hydrogen generation from ball milled Mg alloy waste by hydrolysis reaction. J. Power Sources 2020, 479, 228711. [Google Scholar] [CrossRef]
  51. Al Bacha, S.; Pighin, S.A.; Urretavizcaya, G.; Zakhour, M.; Nakhl, M.; Castro, F.J.; Bobet, J.L. Effect of ball milling strategy (milling device for scaling-up) on the hydrolysis performance of Mg alloy waste. Int. J. Hydrogen Energy 2020, 45, 20883–20893. [Google Scholar] [CrossRef]
  52. Galwey, A.K.; Brown, M.E. Handbook of Thermal Analysis and Calorimetry; Elsevier Science B.V.: Amsterdam, The Netherlands, 1998; Volume 1. [Google Scholar]
  53. Zhu, T.; Chen, Z.W.; Gao, W. Effect of cooling conditions during casting on fraction of β-Mg17Al12 in Mg–9Al–1Zn cast alloy. J. Alloys Compd. 2010, 501, 291–296. [Google Scholar] [CrossRef]
  54. Lashko, N.F.; Morozova, G.I. Some Issues on the Alloying and Phase Composition of Magnesium Alloys; All-Russia Institute of Aircraft Materials (VIAM): Moscow, Russia, 1974. [Google Scholar]
  55. Rosenband, V.; Gany, A. Application of activated aluminum powder for generation of hydrogen from water. Int. J. Hydrogen Energy 2010, 35, 10898–10904. [Google Scholar] [CrossRef]
  56. Yavor, Y.; Goroshin, S.; Bergthorson, J.M.; Frost, D.L.; Stowe, R.; Ringuette, S. Enhanced hydrogen generation from aluminum–water reactions. Int. J. Hydrogen Energy 2013, 38, 14992–15002. [Google Scholar] [CrossRef]
  57. Buryakovskaya, O.A.; Vlaskin, M.S.; Grigorenko, A.V. Effect of Thermal Treatment of Aluminum Core-Shell Particles on Their Oxidation Kinetics in Water for Hydrogen Production. Materials 2021, 14, 6493. [Google Scholar] [CrossRef] [PubMed]
  58. du Preez, S.P.; Bessarabov, D.G. Hydrogen generation of mechanochemically activated AlBiIn composites. Int. J. Hydrogen Energy 2017, 42, 16589–16602. [Google Scholar] [CrossRef]
  59. Zhang, F.; Edalati, K.; Arita, M.; Horita, Z. Fast hydrolysis and hydrogen generation on Al-Bi alloys and Al-Bi-C composites synthesized by high-pressure torsion. Int. J. Hydrogen Energy 2017, 42, 29121–29130. [Google Scholar] [CrossRef]
  60. Al Bacha, S.; Farias, E.D.; Garrigue, P.; Zakhour, M.; Nakhl, M.; Bobet, J.L.; Zigah, D. Local enhancement of hydrogen production by the hydrolysis of Mg17Al12 with Mg “model” material. J. Alloys Compd. 2022, 895, 162560. [Google Scholar] [CrossRef]
  61. He, T.; Chen, W.; Wang, W.; Ren, F.; Stock, H.-R. Effect of different Cu contents on the microstructure and hydrogen production of Al–Cu-Ga-In-Sn alloys for dissolvable materials. J. Alloys Compd. 2020, 821, 153489. [Google Scholar] [CrossRef]
  62. Mohedano, M.; Blawert, C.; Yasakau, K.A.; Arrabal, R.; Matykina, E.; Mingo, B.; Scharnagl, N.; Ferreira, M.G.S.; Zheludkevich, M.L. Characterization and corrosion behavior of binary Mg-Ga alloys. Mater. Charact. 2017, 128, 85–99. [Google Scholar] [CrossRef]
  63. Wang, X.; Chen, Z.; Guo, E.; Liu, X.; Kang, H.; Wang, T. The role of Ga in the microstructure, corrosion behavior and mechanical properties of as-extruded Mg–5Sn–xGa alloys. J. Alloys Compd. 2021, 863, 158762. [Google Scholar] [CrossRef]
  64. Oh, S.; Cho, T.; Kim, M.; Lim, J.; Eom, K.; Kim, D.; Cho, E.; Kwon, H. Fabrication of Mg–Ni–Sn alloys for fast hydrogen generation in seawater. Int. J. Hydrogen Energy 2017, 42, 7761–7769. [Google Scholar] [CrossRef]
Figure 1. Original materials for powder preparation: (a) magnesium-aluminum alloy scrap; (b) original Wood’s metal alloy pellets and the chips manufactured thereof.
Sustainability 14 04496 g001
Figure 2. Experimental facility: 1—reactor, 2—thermocouple, 3—magnetic mixer and stirring bar, 4—heater or cryothermostat, 5—Drexel flask, 6—glass vessel, 7—resistance temperature detector, 8—flask, 9—scales, 10—multichannel thermometer, 11—computer, and 12—barometer.
Sustainability 14 04496 g002
Figure 3. XRD patterns of the ball-milled powder samples: (a) Mg-Al (80 wt.%) and KCl (20 wt.%); (b) Mg-Al (80 wt.%), Wood’s metal alloy (10 wt.%), and KCl (10 wt.%); (c) Mg-Al (80 wt.%) and Wood’s metal alloy (20 wt.%); (d) Mg-Al (100 wt.%) without additives.
Sustainability 14 04496 g003aSustainability 14 04496 g003bSustainability 14 04496 g003c
Figure 4. Microscope photographs of the ball-milled powder samples: (ac) Mg-Al (80 wt.%) and KCl (20 wt.%) particles under ×2, ×5, and ×20 magnifications; (df) Mg-Al (80 wt.%), Wood’s metal alloy (10 wt.%), and KCl (10 wt.%) particles under ×2, ×5, and x20 magnifications; (gi) Mg-Al (80 wt.%) and Wood’s metal alloy (20 wt.%) particles under ×2, ×5, and ×20 magnifications; (jl) Mg-Al (100 wt.%) particles under ×2, ×5, and ×20 magnifications; (mo) metal scrap particles under ×2, ×5, and ×20 magnifications.
Sustainability 14 04496 g004aSustainability 14 04496 g004b
Figure 5. Particle size distributions (histograms and cumulative curves) for different samples: (a) Mg-Al (80 wt.%) and KCl (20 wt.%); (b) Mg-Al (80 wt.%), Wood’s metal alloy (10 wt.%), and KCl (10 wt.%); (c) Mg-Al (80 wt.%) and Wood’s metal alloy (20 wt.%); (d) Mg-Al (100 wt.%) without additives; (e) metal scrap.
Sustainability 14 04496 g005aSustainability 14 04496 g005bSustainability 14 04496 g005c
Figure 6. BSE images of ball-milled powder samples: (a) Mg-Al (80 wt.%) and KCl (20 wt.%); (b) Mg-Al (80 wt.%), Wood’s alloy (10 wt.%), and KCl (10 wt.%); (c) Mg-Al (80 wt.%) and Wood’s alloy (20 wt.%); (d) Mg-Al (100 wt.%) without additives.
Sustainability 14 04496 g006aSustainability 14 04496 g006bSustainability 14 04496 g006c
Figure 7. Hydrogen evolution kinetic curves for the Mg-Al (80 wt.%) and KCl (20 wt.%) powder: 1—15 °C, 2—25 °C, and 3—35 °C.
Sustainability 14 04496 g007
Figure 8. Hydrogen evolution kinetic curves for the Mg-Al (80 wt.%) and Wood’s alloy (20 wt.%) powder: 1—15 °C, 2—25 °C, and 3—35 °C.
Sustainability 14 04496 g008
Figure 9. Hydrogen evolution kinetic curves for the Mg-Al (80 wt.%), Wood’s alloy (10 wt.%), and KCl (10 wt.%) powder: 1—15 °C, 2—25 °C, and 3—35 °C.
Sustainability 14 04496 g009
Figure 10. Hydrogen evolution kinetic curves for the Mg-Al (100 wt.%) powder: 1—15 °C, 2—25 °C, and 3—35 °C.
Sustainability 14 04496 g010
Figure 11. XRD patterns of ball-milled powder samples.
Sustainability 14 04496 g011
Figure 12. XRD patterns of the solid reaction products for different powder samples: (a) Mg-Al (80 wt.%) and KCl (20 wt.%); (b) Mg-Al (80 wt.%), Wood’s metal alloy (10 wt.%), and KCl (10 wt.%); (c) Mg-Al (80 wt.%) and Wood’s metal alloy (20 wt.%); (d) Mg-Al (100 wt.%) without additives.
Sustainability 14 04496 g012aSustainability 14 04496 g012b
Figure 13. BSE images of the reaction products for different samples: (a,b) Mg-Al (80 wt.%) and KCl (20 wt.%); (c,d) Mg-Al (80 wt.%), Wood’s alloy (10 wt.%), and KCl (10 wt.%); (e,f) Mg-Al (80 wt.%) and Wood’s alloy (20 wt.%); (g,h) Mg-Al (100 wt.%) without additives.
Sustainability 14 04496 g013aSustainability 14 04496 g013b
Figure 14. Arrhenius plots for different samples: 1—Mg-Al (80 wt.%) and KCl (20 wt.%); 2—Mg-Al (80 wt.%), Wood’s alloy (10 wt.%), and KCl (10 wt.%); 3—Mg-Al (80 wt.%) and Wood’s alloy (20 wt.%); 4—Mg-Al (100 wt.%) without additives.
Sustainability 14 04496 g014
Table 1. Experimental conditions and results of preceding studies.
Reactive MaterialBall-Milling Time, hPowder Particle Size, μmAqueous MediaTemperature, °CReaction Time, min.H2 Yield,%Source
Al (~75 μm), NaCl
(NaCl to Al
mole ratio 2–7)
15~100 nmDistilled water55–90~20100[47]
Al (~75 μm), NaCl
(NaCl to Al
mole ratio 1)
55–70<65
Al (~100 μm), NaCl
(NaCl to Al
mole ratio 0.1–1.5)
20~50 nmDistilled water70~4070–90 (mole ratios 0.5–1)[48]
Al (227 μm), NaCl (50 wt.%)7–1921–22 μmDistilled water80~60
or less
~100[45]
Al (227 μm), NaCl (25 wt.%)-~50 or less
Al (227 μm), NaCl (75 wt.%)-~20
or less
100
Al (227 μm), KCl (50 wt.%)16–17 μm
Mg (150–750 μm), NaCl (50 wt.%)3
7
15
277 μm
65 μm
46 μm
Distilled water80~60
or less
~16
~55
~62
[43]
Mg (150–750 μm), KCl (25 wt.%)3
7
15
-~48
~49
~60
Mg (150–750 μm), KCl (50 wt.%)15->90
Mg (150–750 μm), KCl (75 wt.%)15-100
Table 2. Activation energy and reaction constant values for different experiments.
Sample CompositionReaction Rate
Constant (k), s−1
Reaction
Parameter (n)
Activation
Energy, kJ/mol
Mg-Al and KCl2.4·10−4 (15 °C)
2.6·10−4 (25 °C)
2.9·10−4 (35 °C)
0.26 (15 °C)
0.21 (25 °C)
0.17 (35 °C)
7.0 ± 0.8
Mg-Al, Wood’s metal and KCl1.00·103 (15 °C)
1.42·103 (25 °C)
2.27·103 (35 °C)
0.35 (15 °C)
0.28 (25 °C)
0.24 (35 °C)
30.6 ± 2.9
Mg-Al and Wood’s metal2.33·10−3 (15 °C)
4.12·10−3 (25 °C)
8.73·10−3 (35 °C)
0.83 (15 °C)
0.66 (25 °C)
0.62 (35 °C)
48.6 ± 4.8
Mg-Al3.85·10−3 (15 °C)
6.00·10−3 (25 °C)
10.02·10−3 (35 °C)
0.59 (15 °C)
0.46 (25 °C)
0.40 (35 °C)
35.9 ± 2.5
Table 3. Hydrogen production yields for different experiments.
Sample CompositionTested
Temperature, °C
Maximum H2 Evolution
Rate, mL/min./g
H2 Yield,%
Mg-Al and KCl1536.137.6 ± 4.5
Mg-Al and KCl2569.141.4 ± 2.9
Mg-Al and KCl3583.045.6 ± 4.4
Mg-Al, Wood’s metal, and KCl1528.043.3 ± 1.5
Mg-Al, Wood’s metal, and KCl2538.150.4 ± 1.2
Mg-Al, Wood’s metal, and KCl3550.056.0 ± 1.2
Mg-Al and Wood’s metal157.242.4 ± 6.3
Mg-Al and Wood’s metal259.857.7 ± 5.9
Mg-Al and Wood’s metal3511.573.5 ± 10.0
Mg-Al1510.356.0 ± 1.1
Mg-Al2514.564.0 ± 5.1
Mg-Al3521.470.6 ± 2.5
Publisher’s Note: MDPI stays neutral with regard to jurisdictional claims in published maps and institutional affiliations.

