Article

Effect of Decreasing the Interception of Solar Illuminance by Vegetation on Ground Temperature in Degraded Grasslands

College of Tourism and Geographic Science, Jilin Normal University, Siping 136000, China
*
Author to whom correspondence should be addressed.
Sustainability 2022, 14(8), 4488; https://doi.org/10.3390/su14084488
Submission received: 15 March 2022 / Revised: 5 April 2022 / Accepted: 5 April 2022 / Published: 9 April 2022
(This article belongs to the Topic Climate Change and Environmental Sustainability)

Abstract

:
Reduced vegetation cover caused by grassland degradation results in the interception of solar illuminance significantly decreasing, then leading to an increase in ground temperature, which has a significant impact on biological growth and regional climate. Based on the field experiment, we explore the interception of solar illuminance by grasslands with three degrees of degradation and its effect on the soil temperature. Solar illuminance at various heights and times was measured to obtain the interception by vegetation, which included reduction by physical shielding and consumption by the plants’ life activities. Solar illuminance in the subareas sprayed with herbicide was merely reduced by physical shielding, and the difference in solar illuminance interception between normally growing grasslands and fatal grasslands was used for the plants’ life activities. This method described above was almost the first to be used for the exploration of the functional allocation of solar illuminance interception. The percentage of solar illuminance interception was largest in the non-degraded grassland (80–95% at different times), including a 50–60% reduction on account of physical shielding and a 20–45% consumption by the grass’s life activities. Light interception by grassland vegetation directly reduced the grassland temperature. The increment of ground temperature reaches 4–13 °C when a non-degraded grassland turns into a severely degraded grassland.

1. Introduction

A grassland, as one of the main types of terrestrial ecosystems located between the humid forest region and arid desert region, is a unique natural landscape in an inland semiarid and subhumid climate [1]. Grasslands in the world account for 41% of the global land area (52.5 million square kilometers). Grassland vegetation, as one of the most widely distributed vegetation types on Earth, is significantly affected by global climate change [2,3,4,5,6,7]; however, it also regulates the climate. Monteith reviewed the grassland microclimate of the United States and summarized a vertical change in microclimate from the canopy of grassland vegetation to the ground [8,9,10,11]. Whitman concluded that grassland litters increase the soil–water availability and reduce soil temperature. Old et al. discussed the importance of grassland temperature to microclimate in a study of the true grassland microclimate of North America [12]. Facelli explored the changes in surface temperature of burned or mowed grasslands and related causes [13]. Zhou studied the changes in surface temperature of the burned Songnen meadow steppe, where litters were burned away and the ground turned grey, changing the albedo of the underlying surface [1]. The average ground temperature of the burned land was 7 °C higher than that of the unburned land during the period that followed [14].
Grasslands in China cover an area of 400 million hectares (more than 40% of the land area), making it the third largest grassland country in the world. Compared with the Qinghai–Tibetan alpine steppe and southern grasslands, the northern temperate grassland covering the largest area of about 167 million hectares is the main part of China’s natural grasslands. It is the production base of China’s traditional animal husbandry, running from Heilongjiang in the east to Xinjiang in the west, distributed in a northeast–southwest zonation between the northwestern desert and southeastern agricultural region in western and northern China. However, recent decades have witnessed serious land reclamation in China, including 199,000 hectares of Hulunbuir grassland alone. This excessive reclamation has led to an extensive degradation of grasslands [15,16,17]. Due to human factors such as overgrazing [3,18] and heavy mowing and natural factors such as long-term drought, wind erosion, water erosion, sandstorm, and rodent and insect pests, nearly 140 million hectares or 50.24% of grasslands have been degraded in this region. Grassland degradation is a widespread concern of society and government [19] and has been extensively studied by some scientists [20,21,22]. Studies have shown that vegetation becomes low and sparse, its coverage decreases, biodiversity is reduced, dominant species change, grassland productivity declines, and grazing capacity is reduced on degraded grassland. In addition to vegetation, grassland degradation also has an impact on climate [20]. Degraded grassland suffers serious water and soil losses, arid climate, and soil desertification and salinization. Grassland degradation reduces vegetation coverage and ground litters, leading to the change of land cover [23,24]. The vegetation of degraded grasslands becomes low and sparse, and the ground is covered by fewer litters, which directly change the ground albedo [25] and the ground heat balance, thus affecting soil and air temperatures [26].
Studies on the Songnen grassland have shown that the maximum soil temperature changes dramatically, while the minimum does not vary significantly and the average temperature in the growing season remains 3–4 °C higher for degraded grasslands (at 5 cm) compared with non-degraded grasslands [27]. Grassland degradation causes an increase in the average temperature, with a more significant effect on increasing the maximum daytime temperature than the minimum nighttime temperature [28]. With the grassland vegetation degradation, the day-and-night temperature difference further increases, and the larger increase in the maximum daytime temperature has a negative impact on grassland vegetation and further aggravates its degradation [29]. Grassland degradation has a greater effect on the increase of ground temperature than that of air temperature, and its effects on the maximum and minimum ground temperatures in different layers are different. However, the greater effect of grassland degradation on the increase in ground temperature than air temperature causes increased difference between these temperatures [21].
The vegetation in degraded grasslands is sparse and ground albedo increases, causing a decrease in the radiation reaching the ground [21]. However, with the reduction of vegetation coverage, the energy stored and consumed by vegetation is reduced and directly reaches the ground and enters the nearby atmosphere, thus changing the ground and air temperatures. Under such complex changes, quantifying a series of changes in the ground and vegetation heat balance induced by grassland degradation will be of significance to the regional ecological effect and actual production practice.
Grassland degradation has a great influence on soil temperature; hence, this study aims to quantify a series of changes in ground and vegetation heat balance induced by grassland degradation that could be of significance to the regional ecological effect and actual production practice. The associated science questions are: (1) the interception of solar illuminance by vegetation in three types of grasslands, specifically including the vertical decomposition and function distribution of the interception of solar illuminance, (2) the effect of the interception of solar illuminance by vegetation on soil temperature in three types of grasslands, and (3) how the direct change (increment) of ground temperature is caused by grassland degradation.

2. Materials and Methods
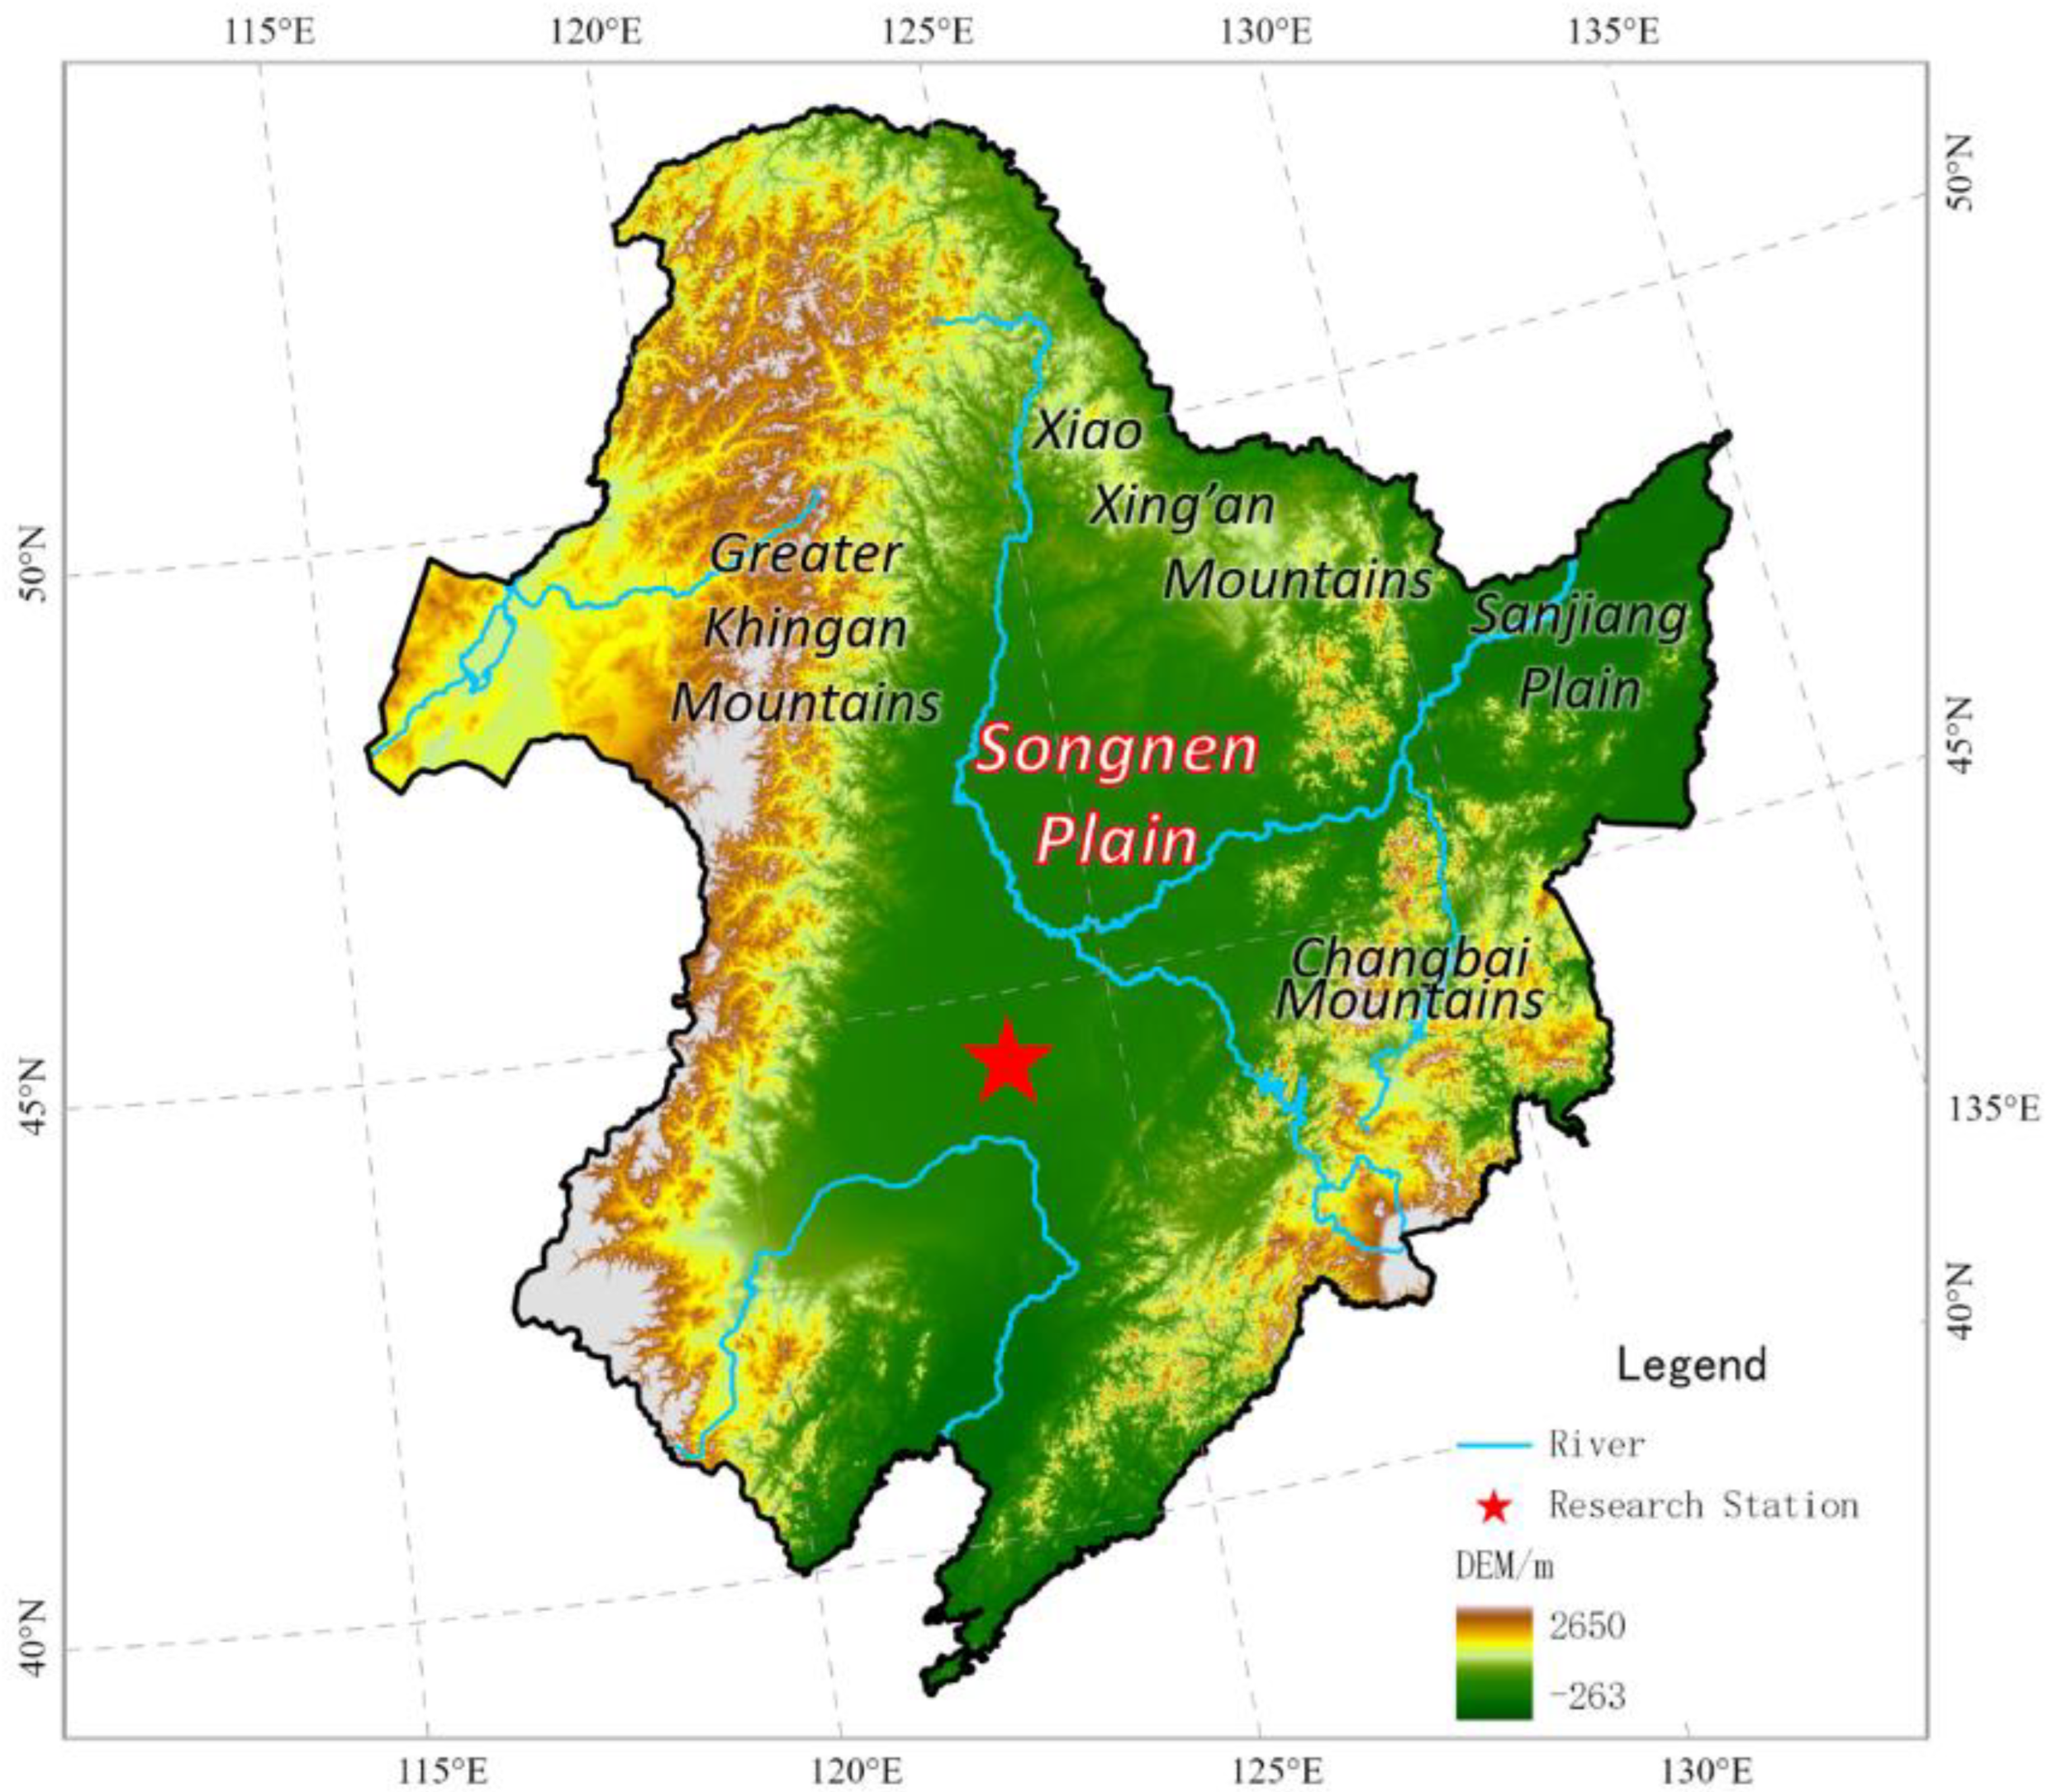
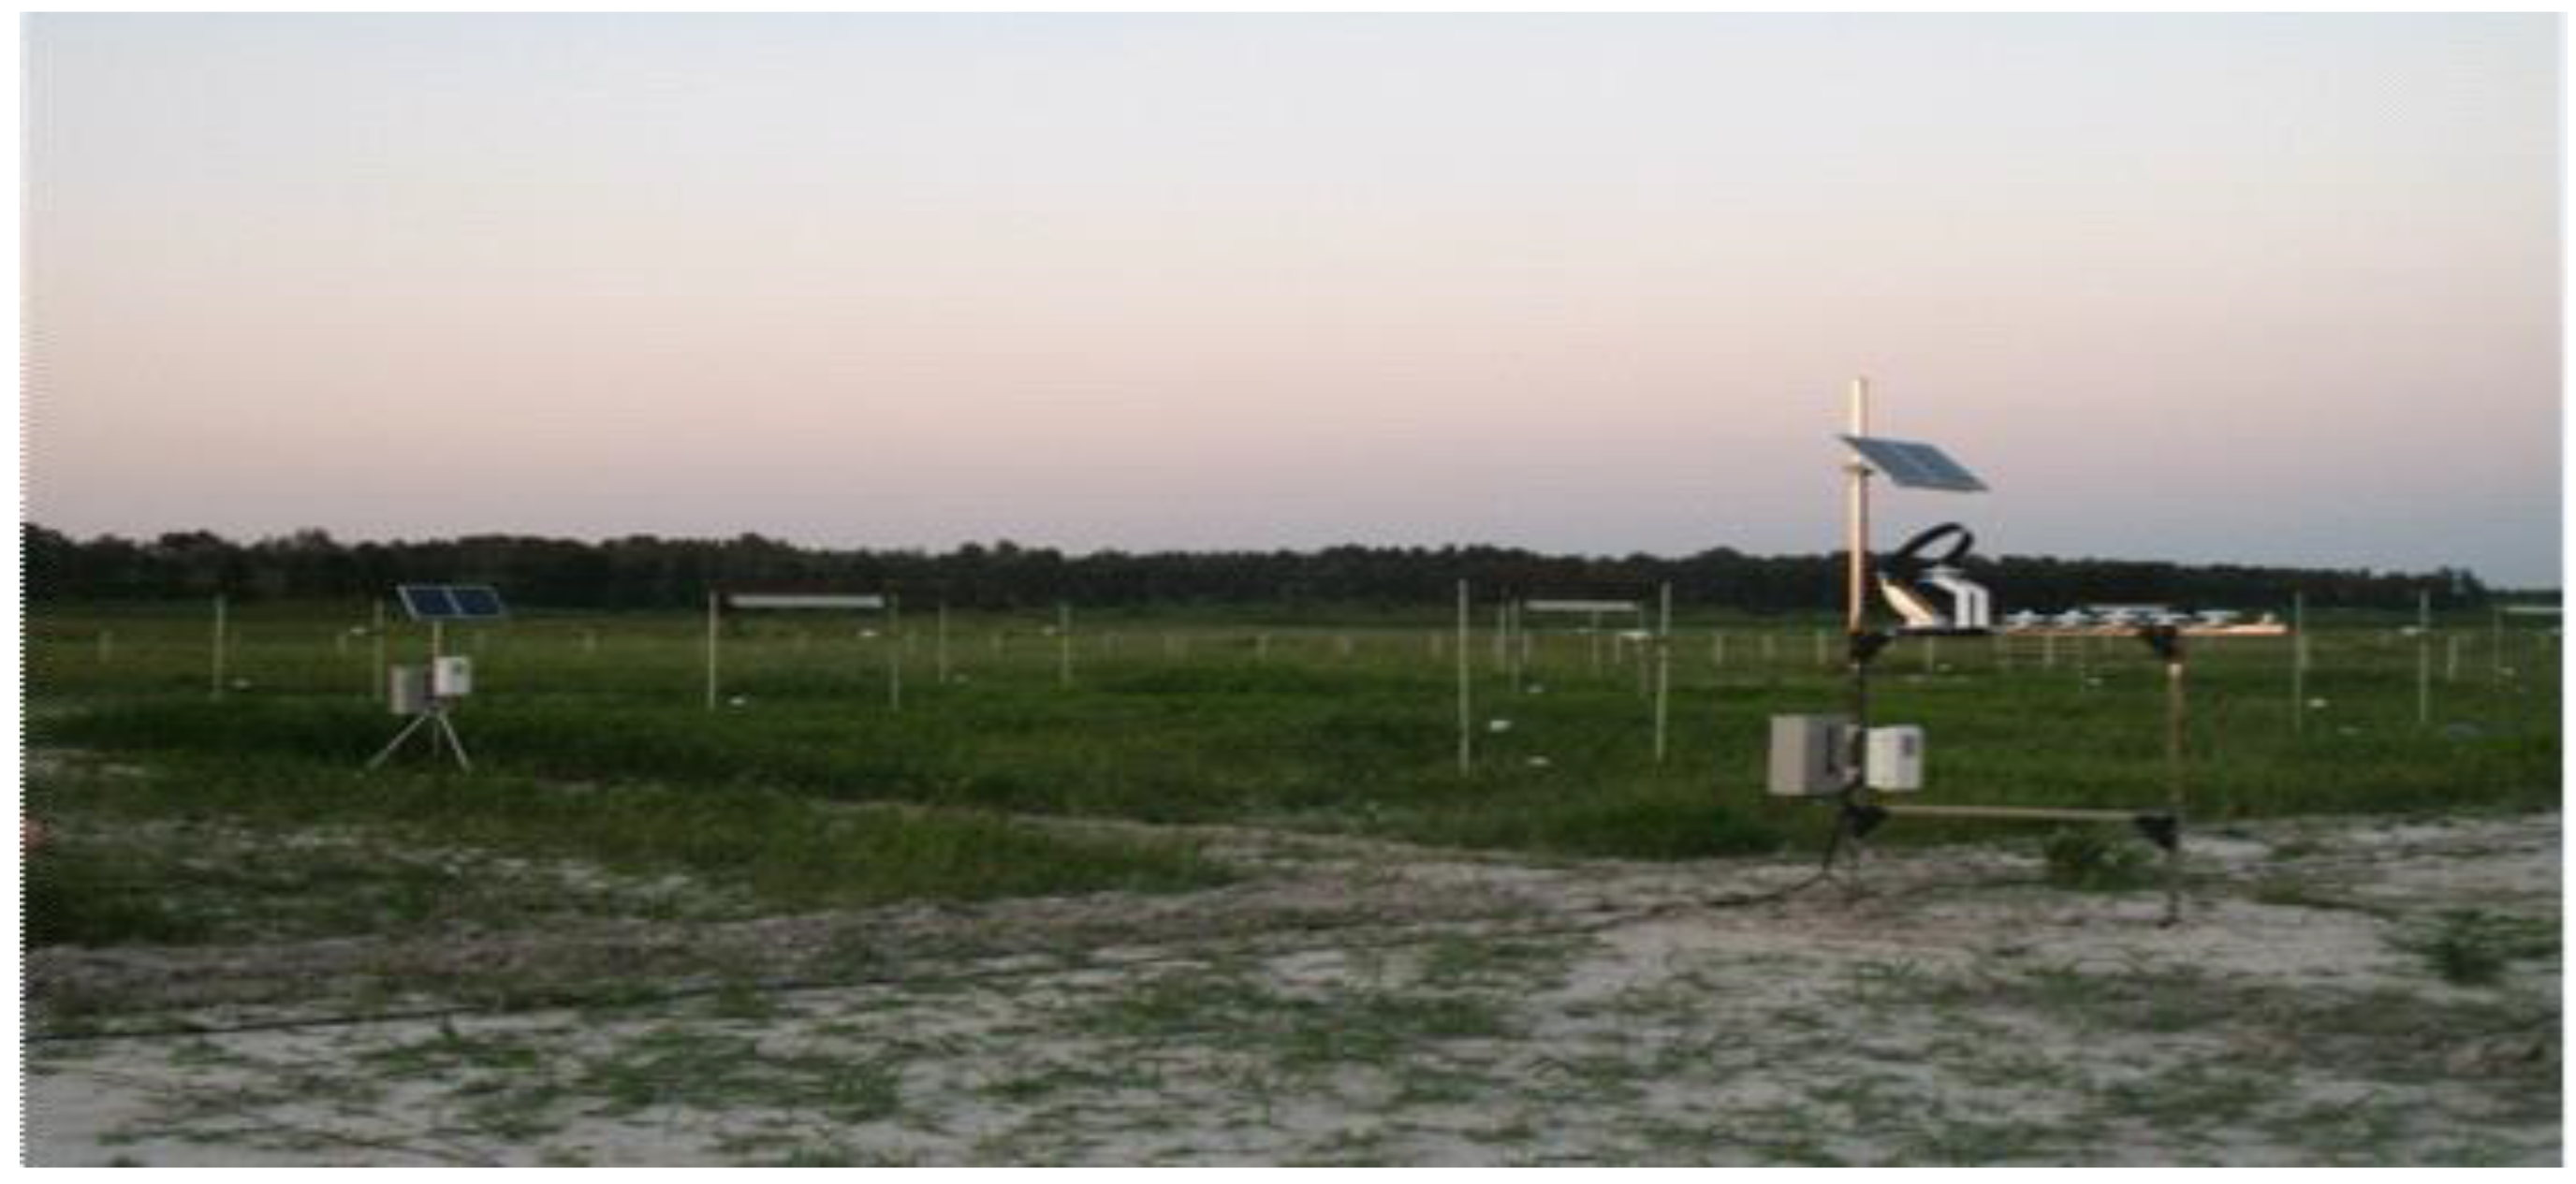
2.1. Study Site

This study was conducted at the Changling Ecological Research Station for Grassland Farming, Northeast Institute of Geology and Agroecology, Chinese Academy of Sciences (123°31′ E, 44°33′ N; 145 m), which is located on the Songnen Plain in Northeast China (Figure 1). The region is mainly plains covered by the zonate dunes, the zonal soil of chernozems, and the main vegetation type is Leymus chinensis meadow. It has a continental monsoon climate, with an average annual temperature of 4.9 °C and an average annual precipitation of 428 mm, 70% of which is mostly during June to September.

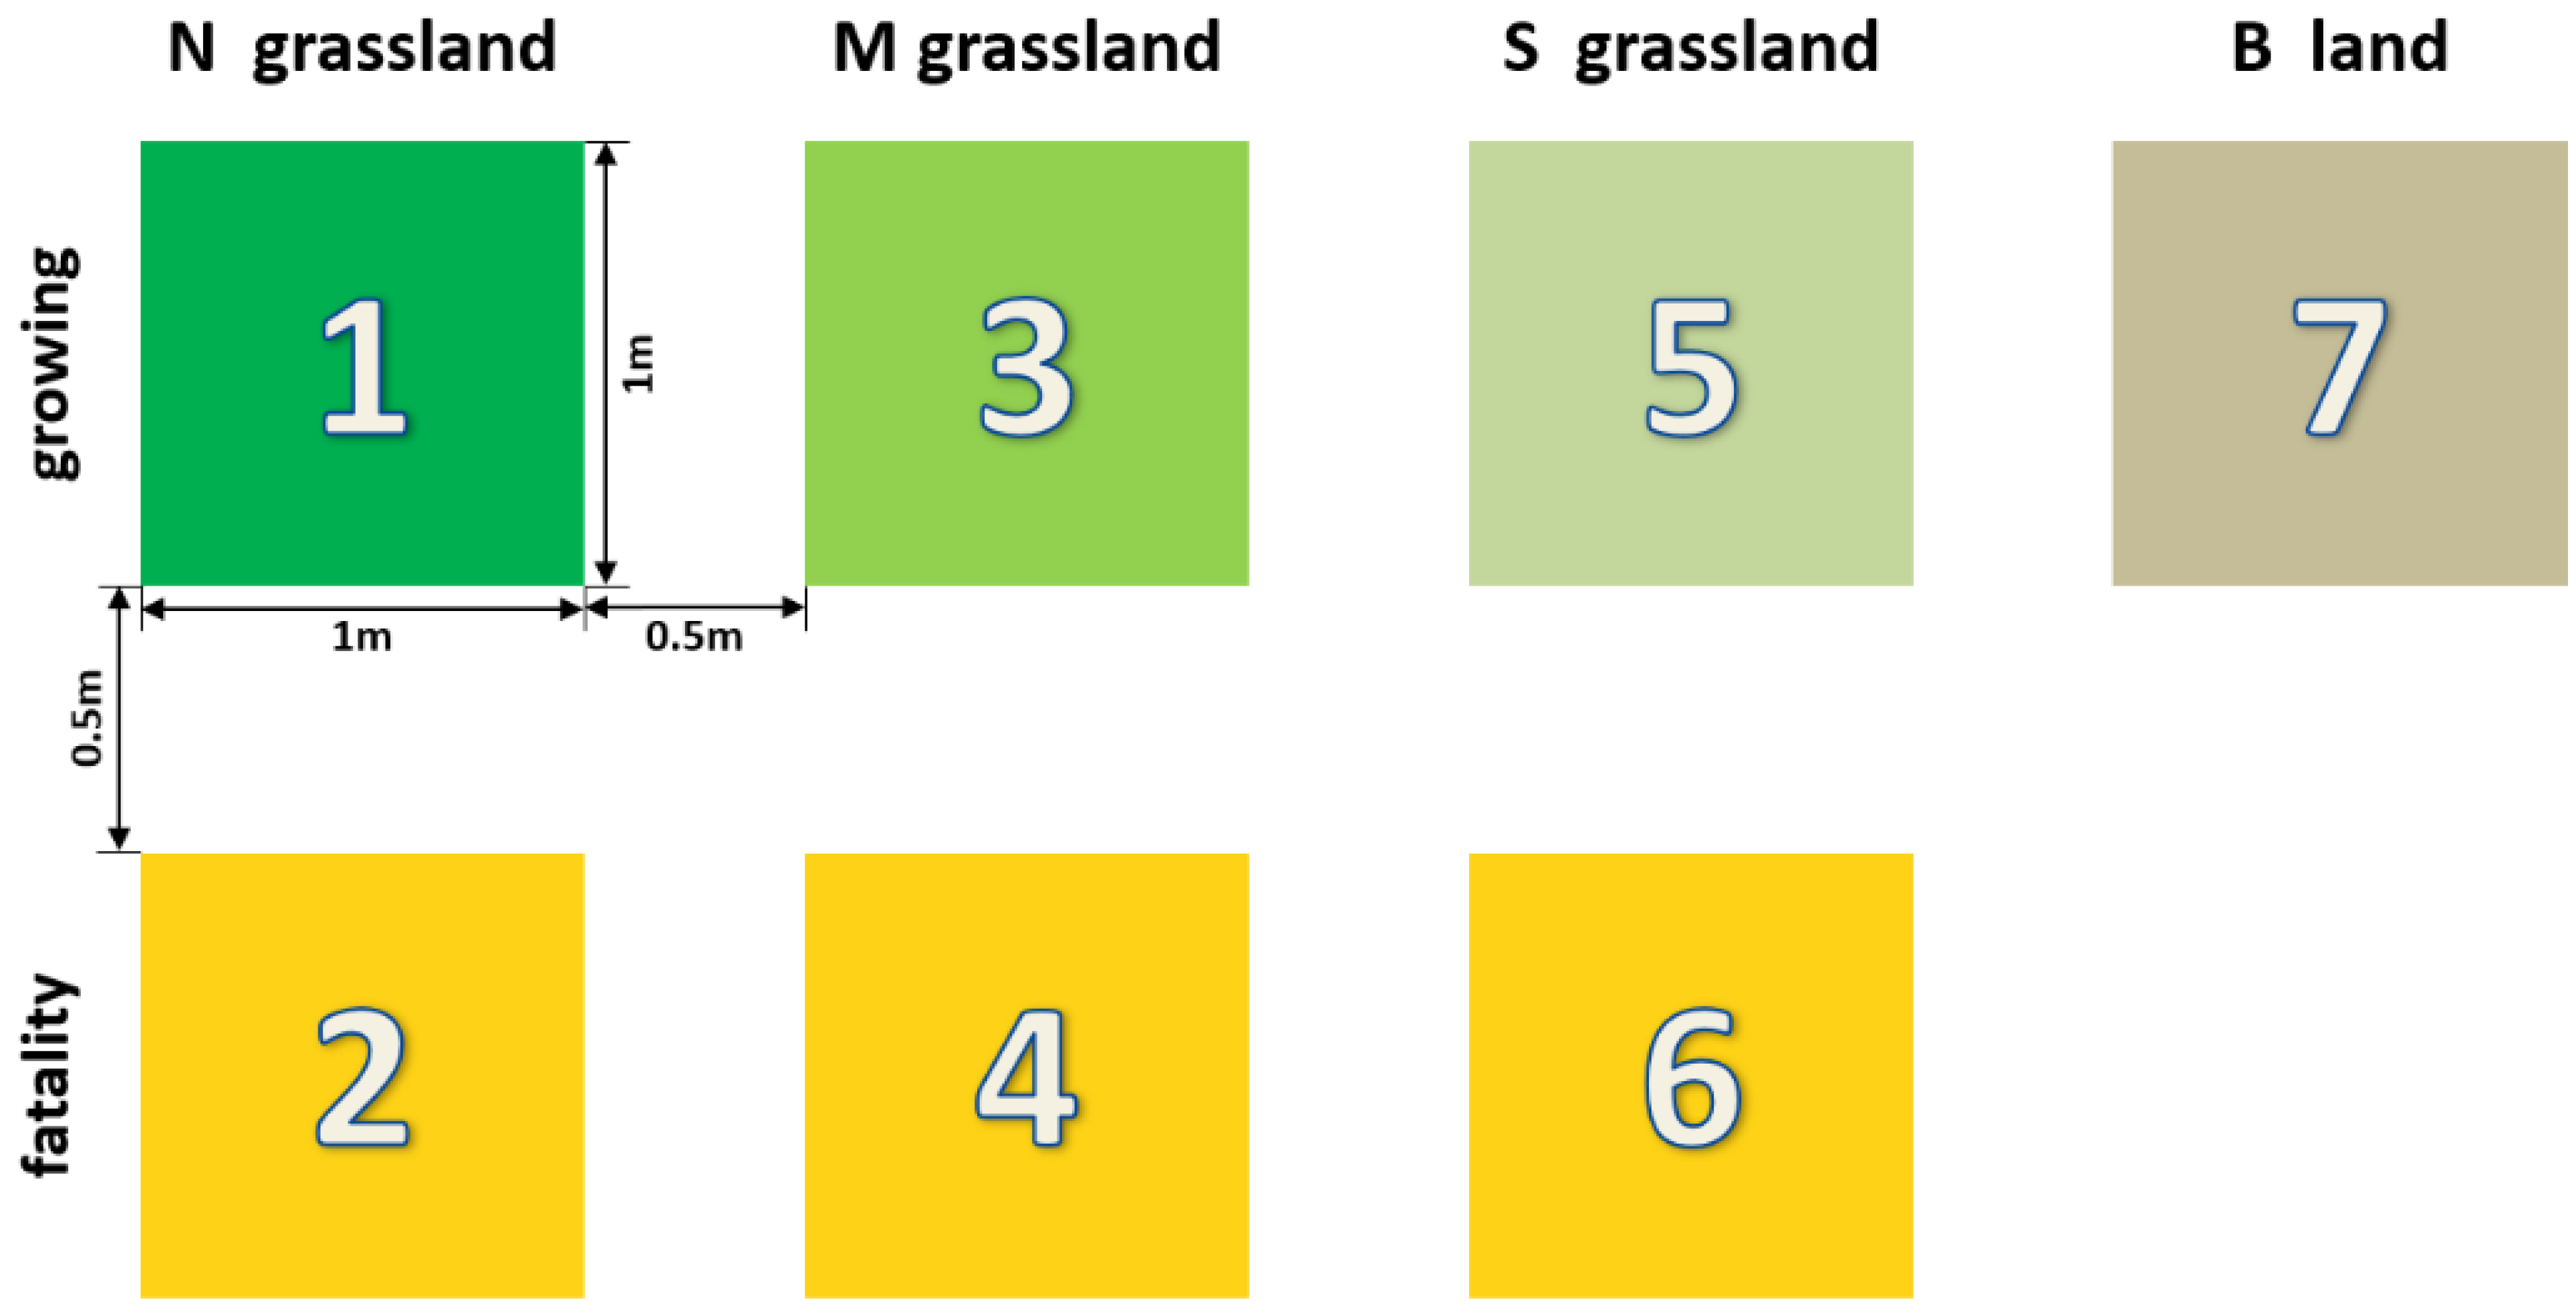
2.2. Experimental Design

As shown in Figure 2, a non-degraded sample plot was selected outside the long-term experimental Leymus chinensis grassland (Figure 3) for the study on temperature increase of degraded grasslands, which was surrounded by a fence. Seven subareas were arranged in the sample plot, each covering an area of 1 × 1 m2, with an interval of 0.5 m between each two subareas to ensure that there was no interaction between subsequent experimental treatments. Three types of grasslands were simulated by controlling the spacing and height of plants, including two non-degraded grasslands at a height of about 80 cm, two severely degraded grasslands at a height of about 30 cm, two mildly degraded grasslands at a height of about 10 cm, and one bare land. Leaf area indices (LAIs) of non-degraded grasslands and degraded grasslands were measured before the experiment. Experimental subareas were named No. 1 Subarea to No. 7 Subarea from left to right. The grass in No. 2 Subarea (non-degraded grassland), No. 4 Subarea (degraded grassland), and No. 6 Subarea (mildly degraded grassland) was sprayed with herbicide while remaining upright. After 3 days of complete fatality, the grass was sprayed with green paint to ensure that it had the same physical shielding effect as the normally growing grass (there are different effects of vegetation on light refraction between fatal yellow grass and the normally growing green grass), ensuring that herbicide and paint do not touch the adjacent subareas and the ground (Figure 2). The total seven subareas were observed for three days on sunny and calm days with no rain. Indicators, including the solar illuminance and temperature at each layer of the grasslands, were measured at 9:00, 13:00, and 17:00; moreover, each measurement was rapidly repeated three times. After the experiment, samples were taken and weighed to obtain the biomass of each layer. The planned measurement indicators are shown in Table 1. The measurements were rapidly repeated three times a day for three days and averages were taken.

2.3. Measurement and Sampling

The experiment was conducted on 20 August 2016, and the solar illuminance and temperature at each layer of the grasslands were measured at 9:00, 13:00, and 17:00. Solar illuminance was measured using Aploe illuminance meter, and temperature was measured using Aploe temperature meter. Measurements were taken from the canopy to the ground in each of the seven subareas and were rapidly repeated three times. The above steps were repeated on 21 and 22 August, and the measured values were recorded according to the indicator measurement in Table 1. After the last measurement, grass in the subareas was collected by layers according to the measurement table, sealed in pre-weighed envelopes, marked, dried at 65 °C in laboratory for 48 h, and then weighed and dry weights were recorded.

2.4. Data Analysis

The nine repeats of all measurement indicators were averaged. Three repeats in one day were to avoid the error caused by the non-synchronous measurement time, and three days of repeats were to avoid the particularities of individual weather conditions. Results were calculated according to the measurements of solar illuminance of No. 1 Subarea, No. 3 Subarea, and No. 5 Subarea.
For non-degraded grasslands, Li-j cm = Li cm–Lj cm, PLi-j cm = Li-j cm/L0 cm, where i-j cm represents each layer, and i represents the location of bottom of the layer (0, 20, 40, and 60, respectively); j represents the location of top of the layer (20, 40, 60, and 80, respectively). Li cm and Lj cm represent the solar illuminance at the bottom and top of the layer, respectively, Li-j cm represents the amount of solar illuminance intercepted by vegetation at this layer, and PLi-j cm represents the percentage of solar illuminance intercepted at i-j cm layer in the total illuminance received at the top of grass canopy (L0 cm).
For degraded grassland, Li-j cm = Li cm–Lj cm, PLi-j cm = Li-j cm/L0 cm, where i-j cm represents each layer, and i represents the location of bottom of the layer (0, 10, and 20, respectively); j represents the location of top of the layer (10, 20, and 30, respectively). Li cm and Lj cm represent the solar illuminance at the top and bottom of the layer, respectively, Li-j cm represents the amount of solar illuminance intercepted by vegetation at this layer, and PLi-j cm represents the percentage of illuminance intercepted at i-j cm layer in total illuminance received at the top of grass canopy (L0 cm).
Severely degraded grassland has only the 0–10 cm layer, and L0–10 cm = L0 cm–L10 cm, PL0–10 cm = L0–10 cm/L0.
Solar illuminance interception amount at each layer was calculated according to the measurement of illuminance at No. 2 Subarea, No. 4 Subarea, and No. 6 Subarea by the above method, and the illuminance loss by physical shielding was obtained: L’i-j cm = L’i cm–L’ j cm, PL’i-j cm = L’i-j cm/L’0 cm (L’0 cm = L0 cm). PL’i-j cm means the percentage of solar illuminance intercepted at i-j cm layer in the total illuminance received at the top of grass canopy (L’0 cm), namely percentage of illuminance loss by physical shielding accounts for total illuminance received at the top of vegetation canopy at i-j cm layer in corresponding No. 1 Subarea, No. 3 Subarea, and No. 5 Subarea.
Then, the solar illuminance loss by life activities at i-j cm layer was obtained: Di-j cm = L’i-j cm–Li-j cm. The percentage of solar illuminance consumed by life activities at i-j cm layer in the total solar illuminance received at the top of vegetation canopy was: PDi-j cm = P’Li-j cm–PLi-j cm.
Mean of measured temperature data was compared using Duncan’s t-test, and correlation analysis was performed on the result and the obtained solar illuminance data with statistical significance level set to p = 0.05. All data were analyzed using SAS8.0 software.

3. Results

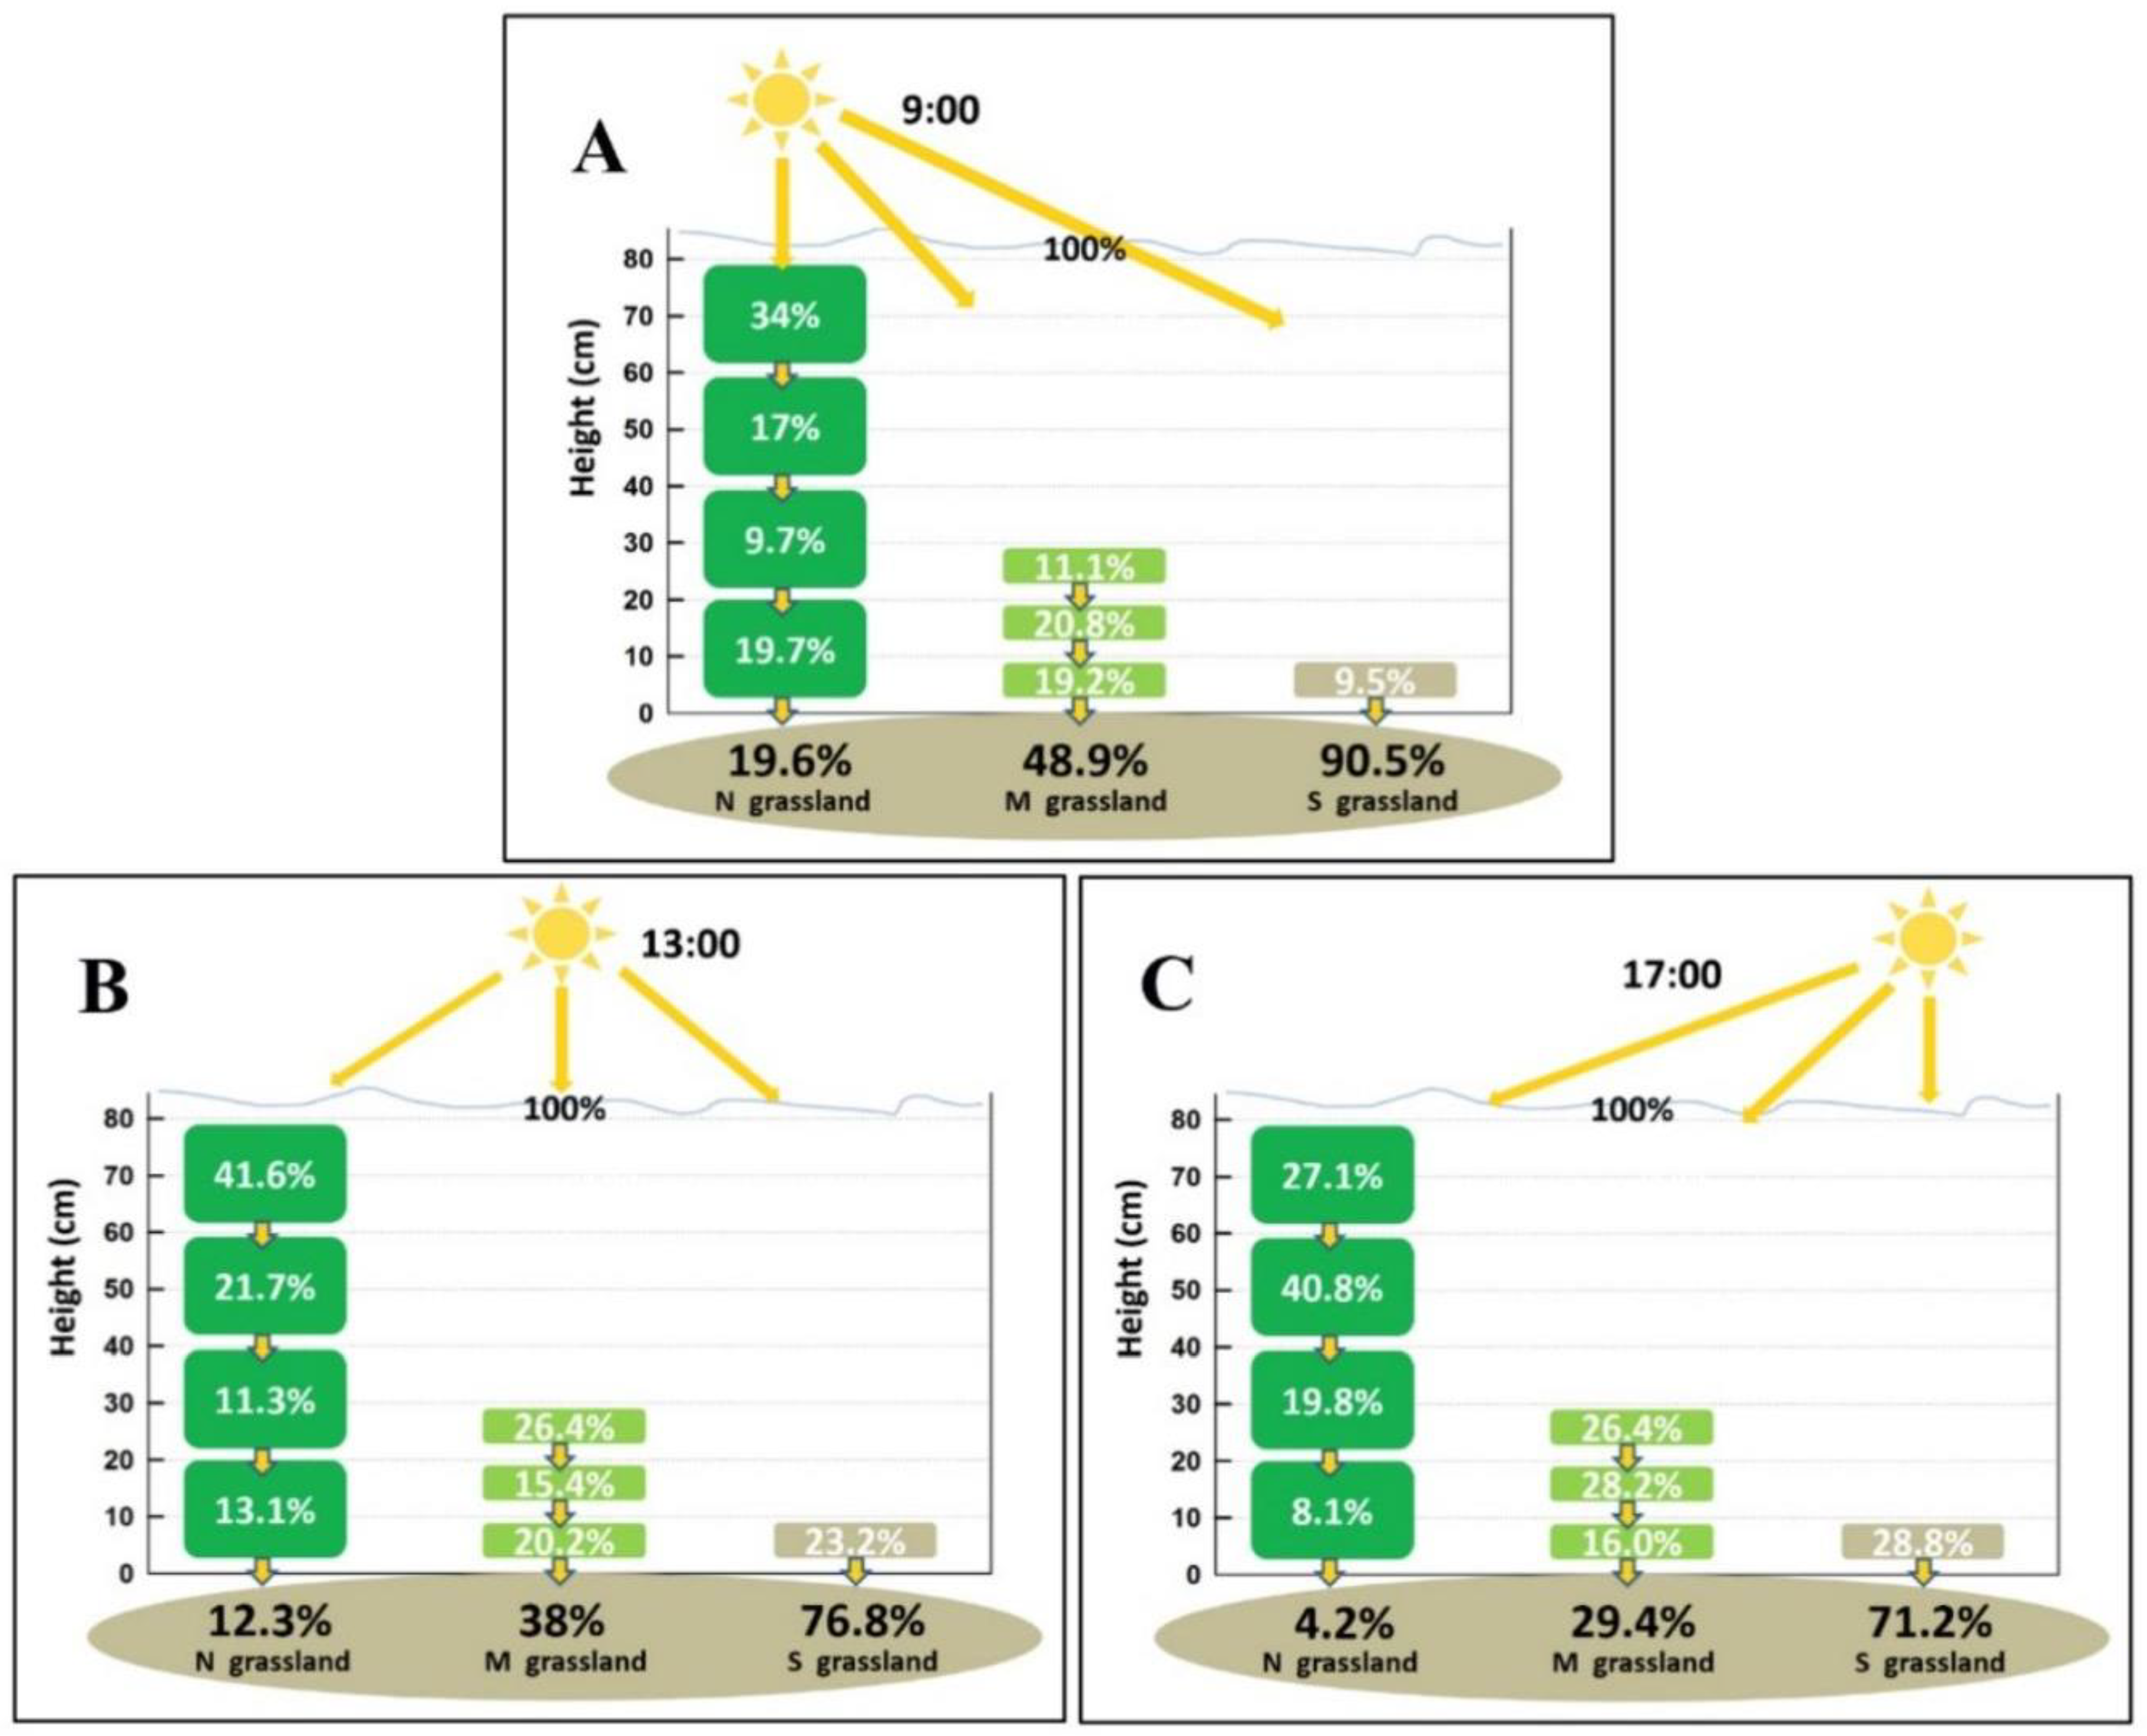
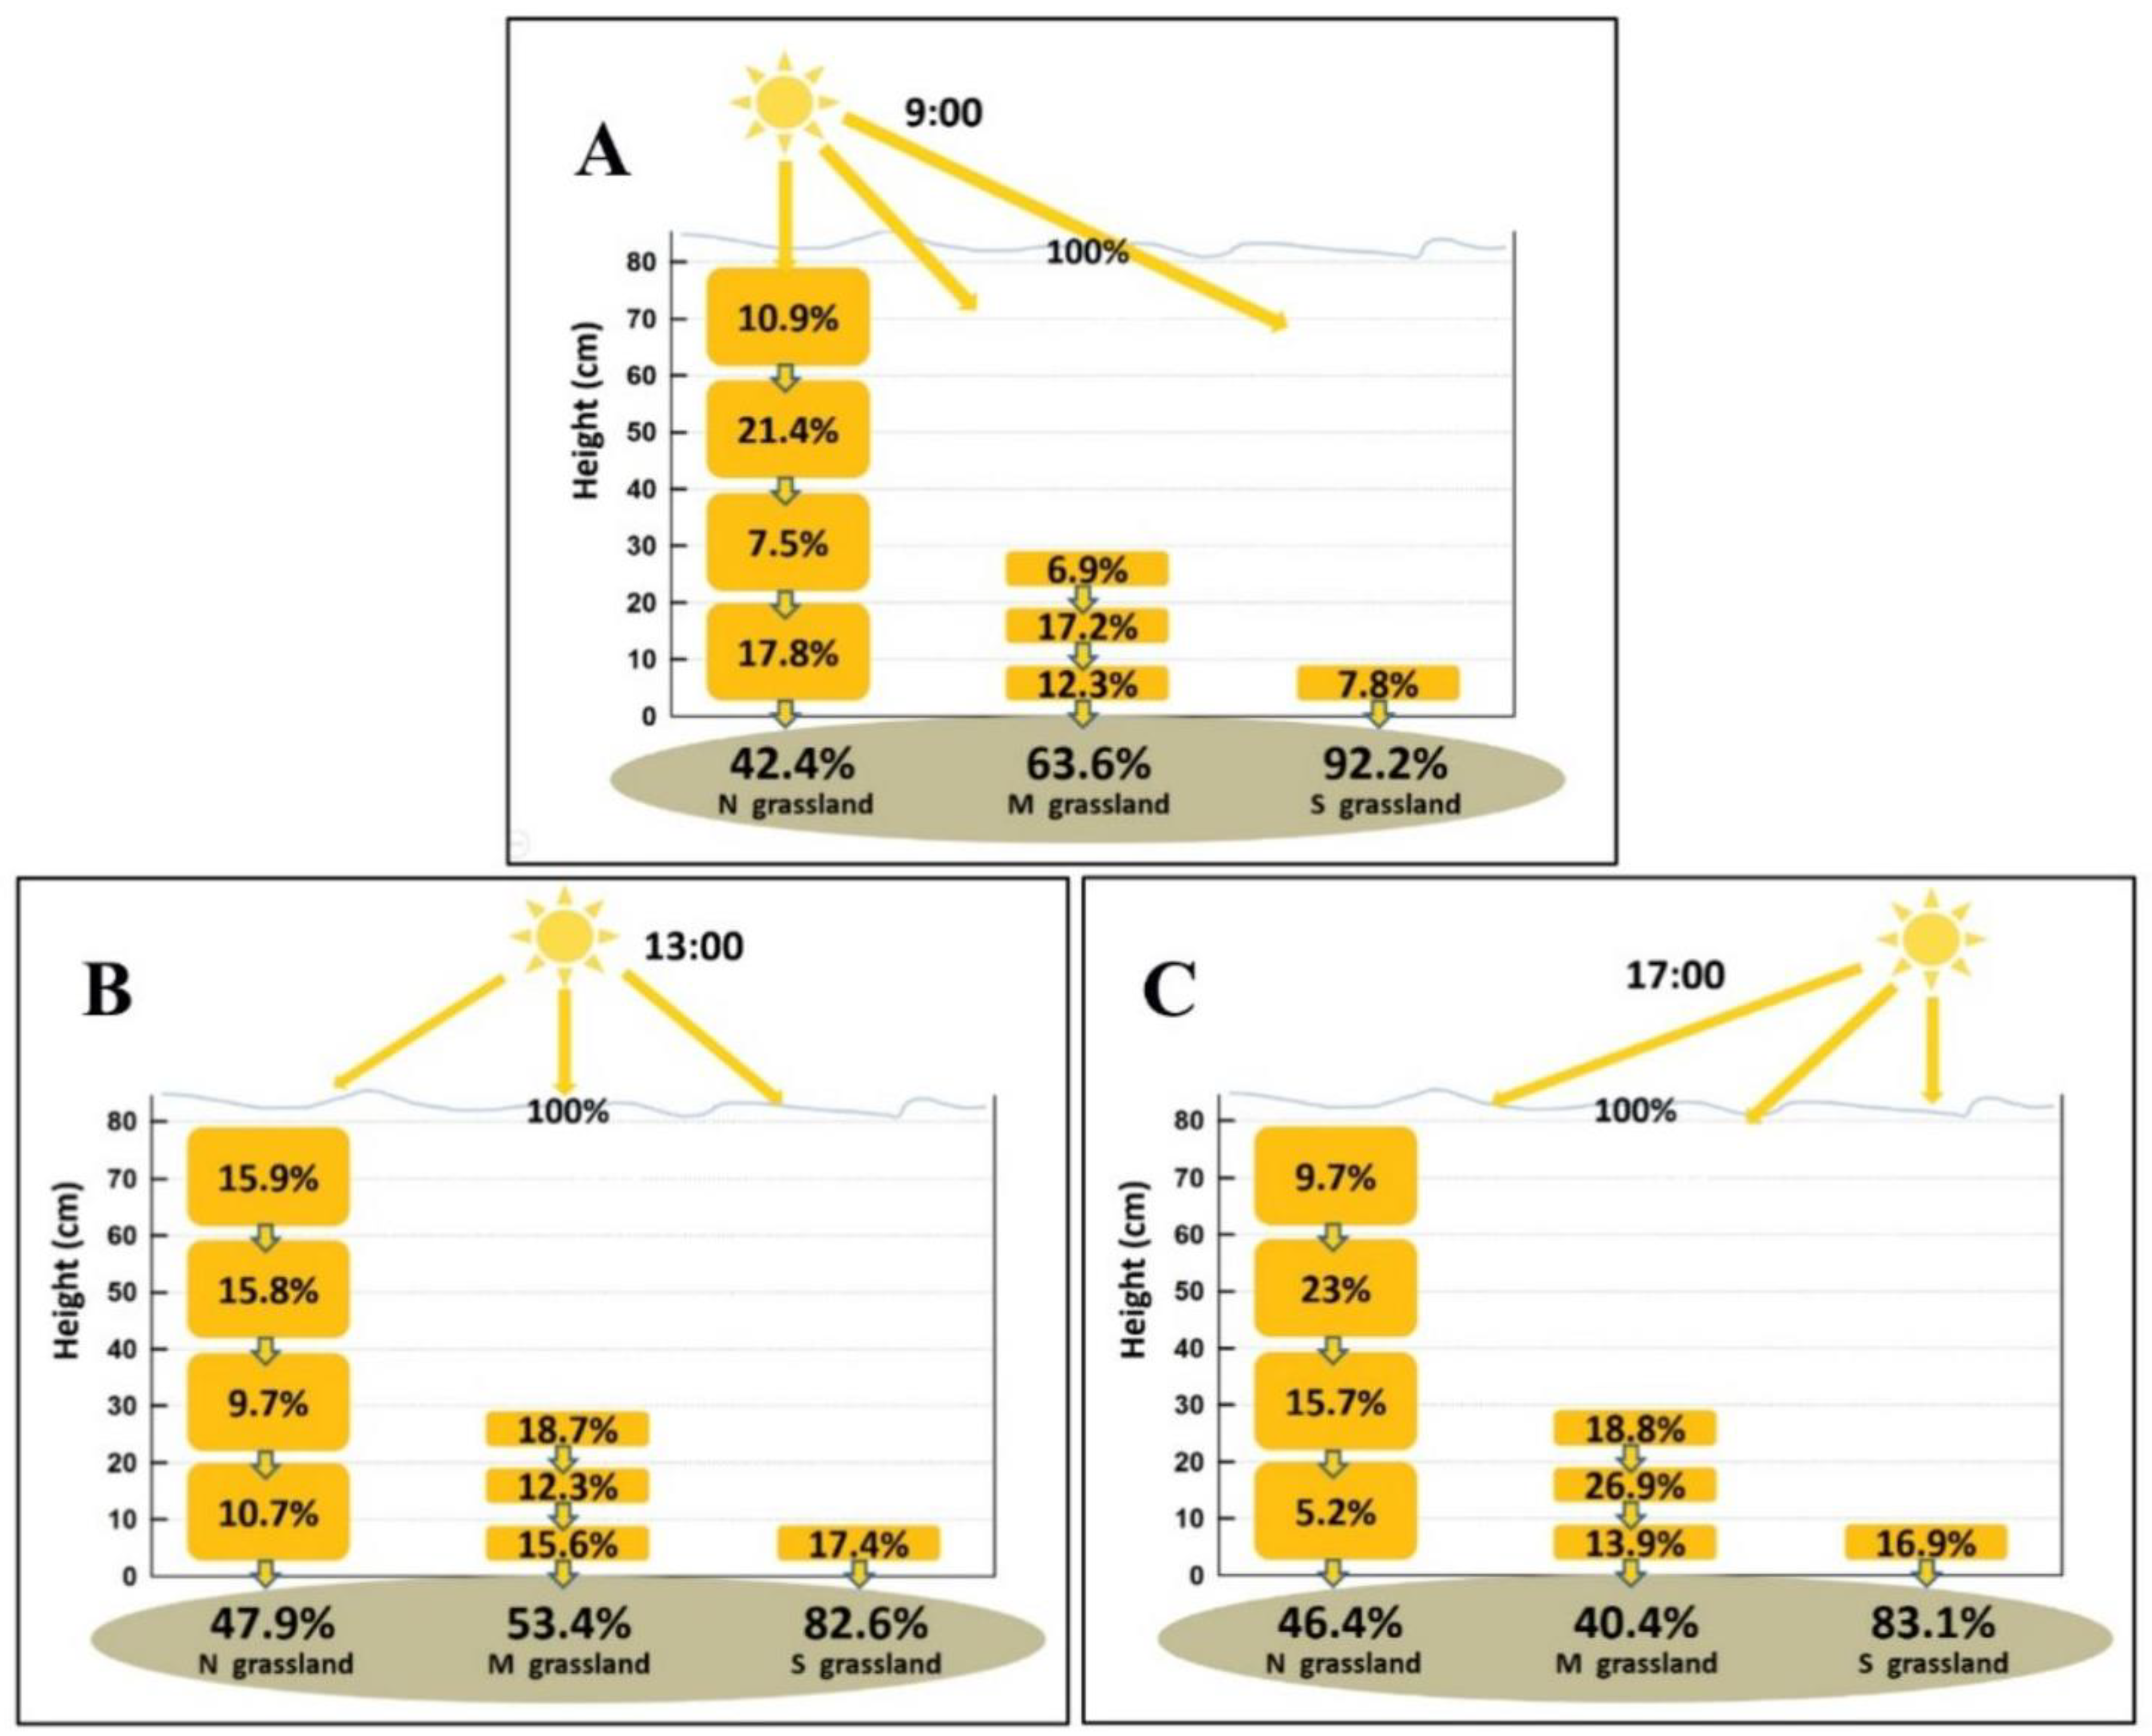
3.1. Interception of Solar Illuminance by Vegetation in Three Types of Grasslands

3.1.1. Vertical Decomposition of Interception of Solar Illuminance by Vegetation

As shown in Figure 4, the leaf area indices (LAI) of the non-degraded grassland, mildly degraded grassland, severely degraded grassland, and bare land in the study subareas were 2.1, 1.29, 0.7, and 0, respectively.
The biomass at each layer of the non-degraded grassland, mildly degraded grassland, and severely degraded grassland in the study subareas is shown in Figure 5. Results showed that there was a significant difference in the total biomass of the different degraded grasslands (sum of the biomass at each layer), of which the total biomass of the non-degraded grassland was 292 g/m2, the total biomass of the mildly degraded grassland was 150 g/m2 (about 50% of that of non-degraded grassland), and the total biomass of the severely degraded grassland was 80 g/m2 (approximate to 50% of that of the mildly degraded grassland). The biomass at the top of the grassland vegetation was lower than that at the bottom, and the difference was significant. The vertically distributed biomass of the non-degraded grassland tapered off from the bottom up, of which the biomass was 93 g/m2 at the 0–20 cm layer, 82 g/m2 at the 20–40 cm layer, 72 g/m2 at the 40–60 cm layer, and 45 g/m2 at the 60–80 cm layer, suggesting that the reduction of biomass at the top increased. For the mildly degraded grassland, the biomass was 61 g/m2 at the 0–10 cm layer, 55 g/m2 at the 10–20 cm layer, and 34 g/m2 at the 20–30 cm layer, suggesting that the biomass changed slightly more than that of the non-degraded grassland. For the severely degraded grassland, the biomass at the 0–10 cm layer was 80 g/m2, which was higher than a third of the biomass at the 0–10 cm layer of the mildly degraded grassland. Different vertical distributions of the biomass of grasslands lead to different interceptions of solar illuminance at each layer.
Radiation loss from the canopy of grassland vegetation to the ground varied with vegetation degradation degree. More severely degraded grasslands had less interception. As shown in Table 2, grasslands received the same solar radiation at the same time, while at different times, the solar illuminance measured was sorted by 13:00 (2600 molm−2s−1) > 9:00 (about 1000 molm−2s−1) > 17:00 (about 600 molm−2s−1). In addition to subareas sprayed with herbicide, the illuminance received at the top of the vegetation was similar to that received by normally growing grasslands not sprayed with herbicide, which also verified the feasibility of the measurement method in this experiment.
At 9:00, percentages of solar illuminance intercepted by non-degraded grassland, mildly degraded grassland, and severely degraded grassland were 80.4%, 51.1%, and 9.5%, respectively (Figure 6A). The solar illuminance interception amount was the largest at the top (60–80 cm) of the non-degraded grassland, accounting for 34% of the total solar illuminance. This was because sunlight entered the thick grass from the air, and the plants begin to block out the solar illuminance and use it for their life activities at this layer. In vertical distribution, the solar illuminance was better blocked out at the top of the plants. Solar illuminance intercepted at the top entered the lower layer; despite a large amount of solar illuminance intercepted at the top, the biomass at the top (the leaf apex) of the plants was relatively small, and thus the solar illuminance interception amount at the middle and upper layers also reached 17%. When the solar illuminance entered the lower layer (20–40 cm), less than 10% was intercepted, since most of the solar illuminance had been intercepted at the upper layer. At the bottom of the grass, due to actions such as respiration of roots, the plants’ life activities were stronger and more light energy was consumed, and about 20% of solar illuminance was intercepted. Finally, 19.6% of solar illuminance reached the ground. The mildly degraded grassland is low and sparse with the top of 20–30 cm layer, so the solar illuminance could mostly be blocked out at the middle (10–20 cm) and lower (0–10 cm) layers, where the life activities of plants were stronger, and thus more light energy was consumed (20.8 and 19.2%, respectively); finally, 48.9% of solar illuminance reached the surface. The solar illuminance interception amount of the severely degraded grassland was 9.5%.
At 13:00, the percentages of solar illuminance intercepted by the non-degraded grassland, mildly degraded grassland, and severely degraded grassland were 87.7%, 62%, and 23.2%, respectively (Figure 6B). Similar to that at 9:00, the solar illuminance interception amount of the non-degraded grassland at 13:00 was the largest at the top (60–80 cm), accounting for 41.6% of the solar illuminance received at the top of vegetation, which was higher than that at 9:00. This was because sunlight entered the canopy at about 90 degrees in the vertical direction, and the plants could block out the sunlight better than that from the east in the morning. The solar illuminance interception at the 40–60 cm layer and 20–40 cm layer reached 21.7% and 11.3%, higher than that at 9:00. The solar illuminance interception amount at the bottom of grass was 13.1% and that reaching the ground was 12.3%. The solar illuminance interception amount of the mildly degraded grassland at 13:00 was different from that at 9:00; more than 26.4% was intercepted at the top, 15.4 and 20.2% were intercepted at the middle and bottom layers, and the remaining 38% reached the ground. The solar illuminance interception amount of the severely degraded grassland was 23.2%.
At 17:00, the percentages of solar illuminance interception of the non-degraded grassland, mildly degraded grassland, and severely degraded grassland were 95.8%, 70.6%, and 28.8%, respectively (Figure 6C). The total percentages of solar illuminance interception of the different degraded grasslands were all higher than those at 9:00 and 13:00, because the sun’s rays were weak in the evening and the solar illuminance received at the top of vegetation was small; when being blocked out and consumed by vegetation, even smaller illuminance reached the ground. For the non-degraded grassland, the solar illuminance interception amount was the largest (40.8%) at the middle and upper layers, followed by the top layer (27.1% of the amount received at the top), the middle and lower layer (19.8%), and the bottom layer (8.1%), and only 4.2% reached the ground. For the mildly degraded grassland, the solar illuminance interception amount was higher at the upper and middle layers (26.4 and 16%, respectively), and the remaining 29.4% reached the ground. The solar illuminance interception amount of the severely degraded grassland was 28.8%.
Further analysis on the measurements of the three subareas sprayed with herbicide (Table 2) showed that at 9:00 the percentages of solar illuminance interception of the non-degraded grassland, mildly degraded grassland, and severely degraded grassland were 57.6%, 36.4%, and 7.8%, respectively (Figure 7A). For the non-degraded grassland, the solar illuminance interception amount was largest at the 40–60 cm layer (22.9%), followed by the bottom layer (17.8%), and then the top and 20–40 cm layers, resulting in 42.4% finally reaching the ground. For the mildly degraded grassland, the solar illuminance interception amount was largest at the middle layer (17.2%), followed by the bottom layer (12.3%) and top layer (6.9%), and the remaining 63.6% reached the ground. The solar illuminance interception amount of the severely degraded grassland was only 7.8%.
At 13:00, the percentages of solar illuminance interception of the non-degraded grassland, mildly degraded grassland, and severely degraded grassland were 52.1%, 46.6%, and 17.4%, respectively (Figure 7B). The percentages of solar illuminance interception of the different degraded grasslands were all higher than those at 9:00, except that of the mildly degraded grassland. For the non-degraded grassland, the solar illuminance interception amount was the largest at the upper layers (15.9% and 15.8% of the total solar illuminance), the percentages at lower layers were about two thirds of the data above, and finally, nearly half of the solar radiation reached the ground. For the mildly degraded grassland, the solar illuminance interception amount at the upper, middle, and lower layers was about 12–18% for all, and the remaining roughly 50% reached the ground as well. The solar illuminance interception amount of the severely degraded grassland was only 17.4%.
At 17:00, the percentages of solar illuminance interception of the non-degraded grassland, mildly degraded grassland, and severely degraded grassland were 53.6%, 59.6%, and 16.9%, respectively (Figure 7C). The percentages of solar illuminance interception of the different degraded grasslands were all approximately equal those at 13:00, except that of the mildly degraded grassland. For the non-degraded grassland, the solar illuminance interception amount gradually increased from the middle to the sides (bottom and top), and 46.4% reached the ground. A similar pattern occurred in the mildly degraded grassland. The solar illuminance interception amount of the severely degraded grassland was only 16.9%.

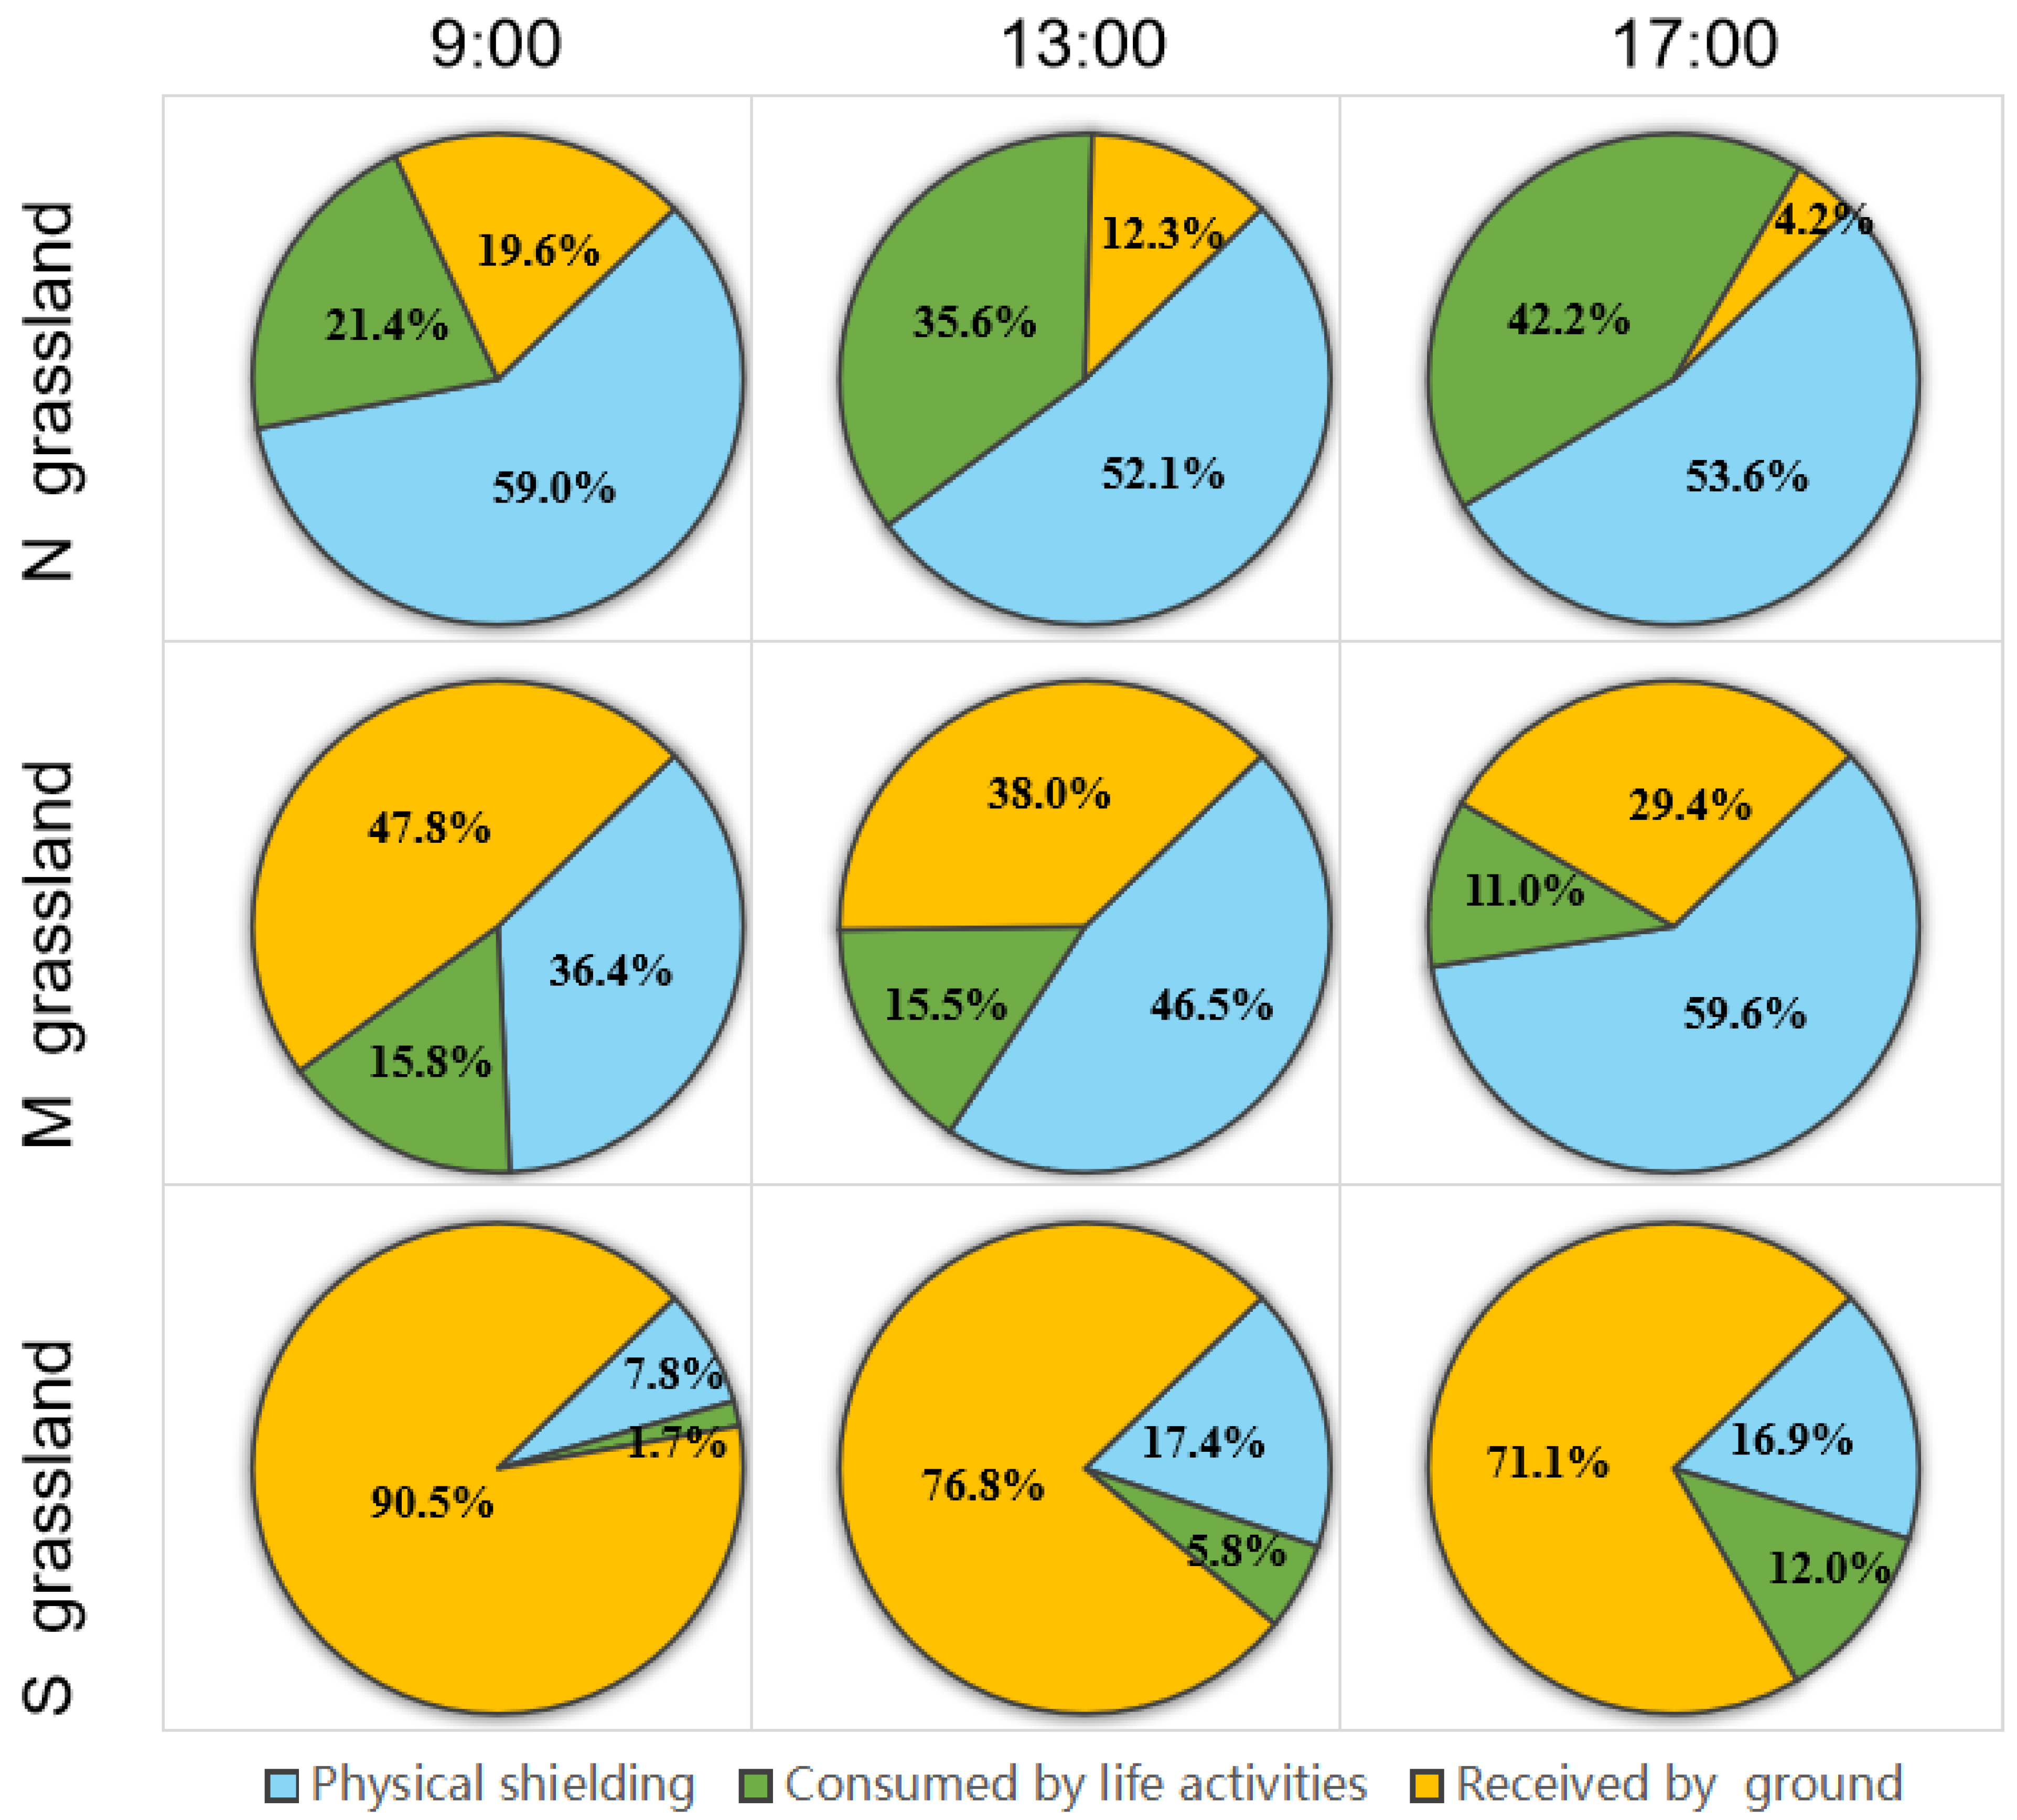
3.1.2. Function Distribution of Interception of Solar Illuminance by Vegetation in Grassland

The solar illuminance interception by grassland includes the reduction of solar illuminance by physical shielding and the consumption of solar illuminance energy by the plants’ life activities. When grass stops growing, the solar illuminance energy consumed by life activities reaches zero. Therefore, three subareas (No. 2, No. 4, and No. 6) sprayed with herbicide were designed in this experiment, where the light energy consumed by the plants’ life activities was eliminated and, only the solar illuminance reduced by physical shielding was preserved. The difference between the illuminance intercepted by normally growing grasslands and that intercepted by grasslands sprayed with herbicide was the part used for the plants’ life activities.
The solar illuminance at the top of the vegetation was set to 100%. For the different degraded grasslands, the solar illuminance received by the vegetation was sorted by 13:00 > 9:00 > 17:00. At each monitoring time, the percentage of solar illuminance intercepted by the vegetation was sorted by non-degraded grassland > mildly degraded grassland > severely degraded grassland.
At 9:00, as a whole, the reduction of solar illuminance by physical shielding was more than twice of the consumption of light energy by the plants’ life activities in each grassland type below. In the non-degraded grassland, about 80% of the solar illuminance was intercepted, including 59% by physical shielding and 21.4% by life activities, and the remaining less than 20% was received by the ground. For the mildly degraded grassland, less proportions than that in the non-degraded grassland were intercepted in total, including 36.4% by physical shielding and 15.8% by life activities; meanwhile, the remaining (approximately half) top solar illuminance was received by the ground. Just about one-tenth of the solar illuminance was intercepted in the severely degraded grassland, including 7.8% by physical shielding and 1.7% by life activities, and the remaining 90.5% was received by the ground (Figure 8).
At 13:00, on the general trend, the ratio of reduction of the solar illuminance by physical shielding and the consumption of light energy by the plants’ life activities were less than that at 9:00 in each grassland type, except for the mildly degraded grassland. There was a great difference in the function distribution of grasslands with different degradation degrees, of which the light energy consumed by the life activities accounted for the largest proportion of the total loss in the non-degraded grassland (Figure 8). In total, 87.7% solar illuminance was intercepted by the vegetation in the non-degraded grassland, including 52.1% by physical shielding and 35.6% by life activities, and the remaining 12.3% was received by the ground. In total, 62% was intercepted by the vegetation in the mildly degraded grassland, including 46.5% by physical shielding and 15.5% by life activities, and the remaining 38% was received by the ground. Only 23.2% was intercepted by the vegetation in the severely degraded grassland, including 17.4% by physical shielding and 5.8% by life activities. All three percentages above are higher than that at 9:00 because of the angle at which the light entered.
At 17:00, in the non-degraded grassland, there was a maximum interception percentage (more than 95%) in each of the grassland types and times, and the reduction of solar illuminance by physical shielding was slightly larger than the plants’ life activities consumption. With regard to the mildly degraded grassland, the greatest disparity of effect between physical shielding and life activities occurred in the moderately degraded grasslands, reaching about 6:1. In the severely degraded grassland, although there was less than 30% interception at 17:00, it was still greater than that at 9:00 and 13:00 due to the added consumption of light energy by the plants’ life activities (Figure 8).

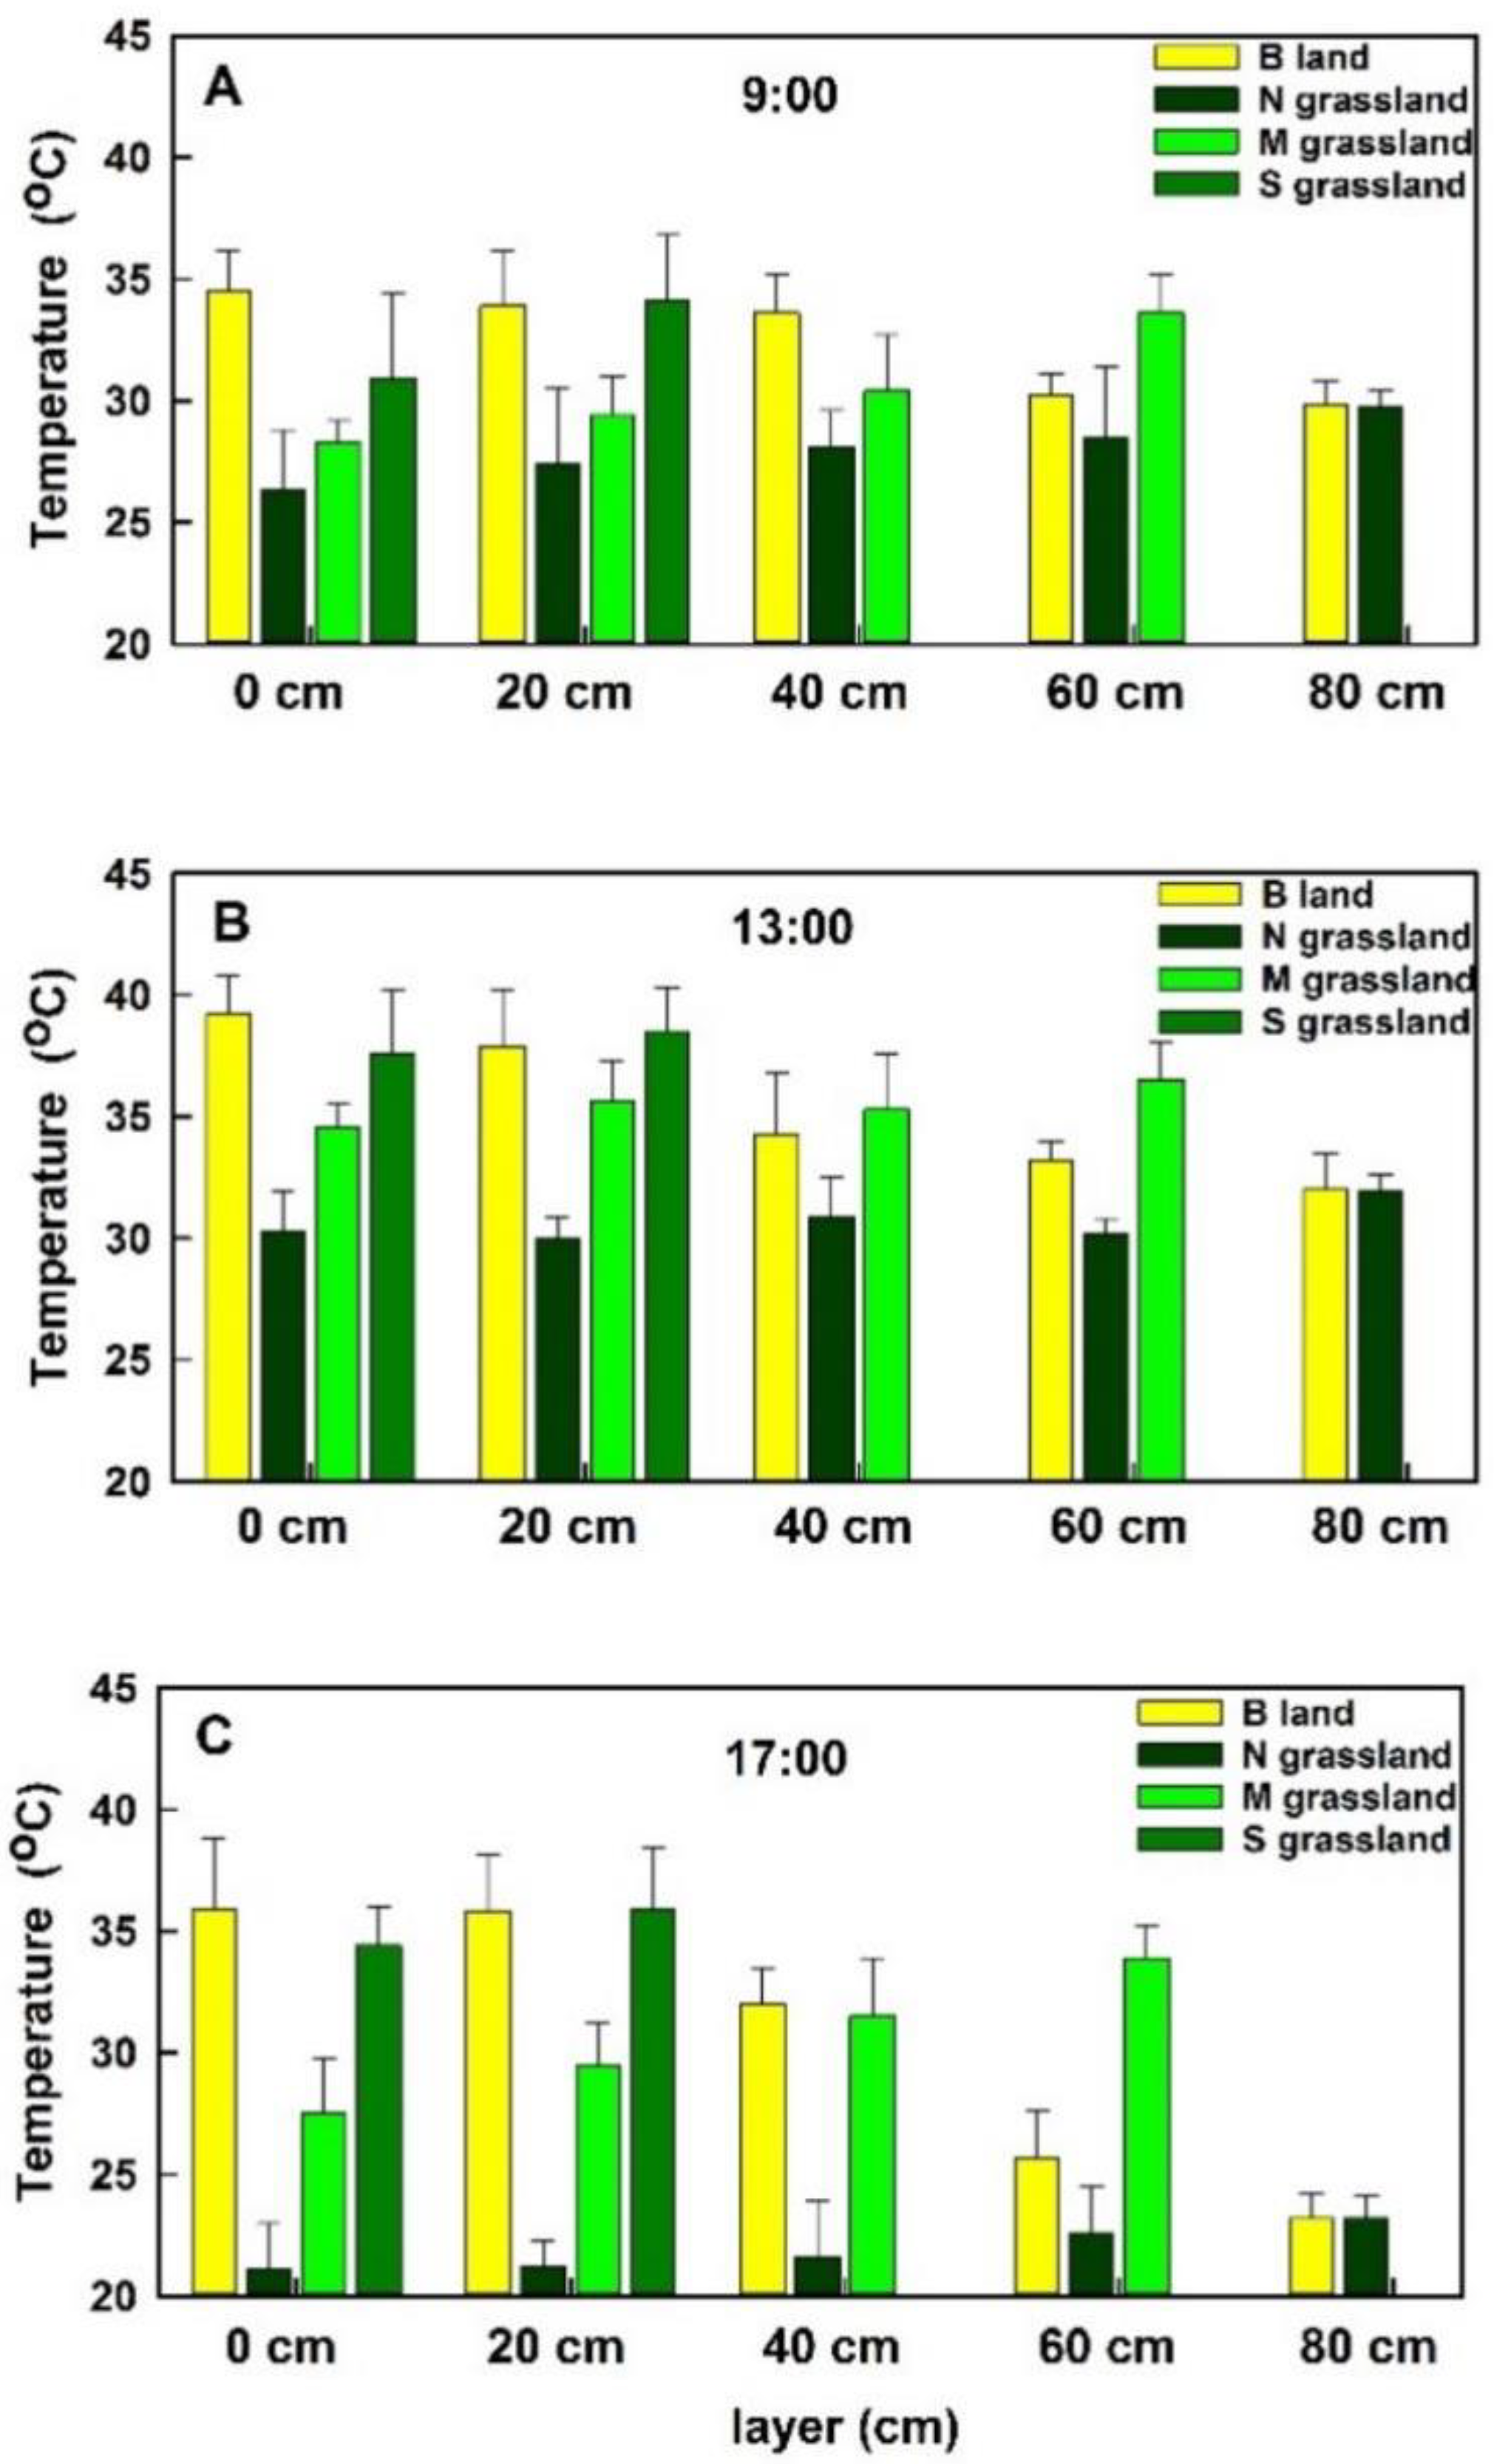
3.2. Effect of Interception of Solar Illuminance by Vegetation on Soil Temperature in Three Types of Grasslands

First, the temperature of the bare land was the highest on the ground and gradually decreased upward. At 9:00, the temperatures of the bare land were 34.5 °C, 33.9 °C, 33.6 °C, 30.2 °C, and 29.8 °C on the surface, 20 cm, 40 cm, 60 cm, and 80 cm above the ground, respectively (Figure 9). At 13:00, the temperature changed from 39.2 °C on the ground to 32 °C at the top layer in the bare land. At 17:00, the temperature changed from 35.9 °C to 23.2 °C. The solar illuminance interception by the vegetation in the grassland directly reduced the grassland temperature. Figure 9 shows that, compared with the bare land, the temperature of each layer in the different degraded grasslands was reduced to varying degrees.
Temperature reduction was the most significant in the non-degraded grassland, and the temperature of each layer decreased to varying degrees compared with the bare land, the temperature on the ground (0 cm) reducing most significantly. For example, at 13:00, the temperature on the ground of the non-degraded grassland decreased by nearly 10 °C compared with that on the bare land, followed by that at the 20 cm, 40 cm, and 60 cm layers; this was directly related to the enormous solar illuminance interception (Figure 9). Temperature reduction of the mildly degraded grassland was less significant than that of non-degraded grassland, and the temperature reduction at 13:00 was more inconspicuous than that at 9:00 and 17:00. Compared with bare land, the temperature reduction on the ground of the mildly degraded grassland was the most significant, with the temperature reduced by 7–8 °C at 9:00 and 17:00; temperature reduction was the second most significant at the 10 and 20 cm layers, reaching 3 °C (13:00). The temperature reduction of the severely degraded grassland (with low and sparse vegetation) was similar to the bare land, but the ground temperature was significantly lower than that of the bare land, with a difference of 2–4 °C at different times. This suggests that vegetation cover has a great effect on reducing the ground temperature.

3.3. Increasing Ground Temperatures in Degraded Grasslands

Vegetation cover reduces the amount of solar radiation received by the ground, thus reducing the ground temperature. Figure 10 shows the correlation between the solar illuminance and temperature at each layer of the grasslands at different times (9:00, 13:00, 17:00) in a day, including the data of five layers of the non-degraded grassland (0 cm, 20 cm, 40 cm, 60 cm, and 80 cm), four layers of the mildly degraded grassland (0 cm, 10 cm, 20 cm, and 30 cm), and two layers of the severely degraded grassland (0 and 10 cm) (n = 11).
The correlation between grass temperature and solar illuminance was the closest at 9:00, with a fitting degree of 0.91, followed by that at 13:00 with a fitting degree of 0.65 and that at 17:00 with a fitting degree of 0.60 (Figure 10). From the slope of the fitting line, the grass temperature changed most obviously with the change of solar illuminance at 17:00, followed by that at 9:00 and that at 13:00. To sum up, ground temperatures at different times in a day were related to solar illuminance, proving that the solar illuminance interception by the grassland vegetation is an important influencing factor for temperature.
The vegetation cover reduced the solar illuminance received by the soil surface. Data analysis showed that the difference in ground temperature between the non-degraded grassland and bare land at different times reached 8.2–14.8 °C (Table 3). In recent years, serious grassland degradation has induced various ecological problems, including changes in soil temperature [8]. Fewer solar illuminance interceptions result in increased temperature of the soil surface. Table 3 shows the evidence that the ground temperature of degraded grasslands was significantly higher than that of non-degraded grasslands. The differences in ground temperature between the mildly degraded grassland and non-degraded grassland were 2 °C (9:00), 4.3 °C (13:00), and 6.4 °C (17:00), and the differences in ground temperature between the severely degraded grassland and non-degraded grassland were 4.6 °C (9:00), 7.3 °C (13:00), and 13.3 °C (17:00).
The results demonstrate that the more degeneration of grassland, the higher the ground temperature, which breaks the balance between the downward transfer of ground heat and the upward exchange with atmosphere and changes the energy distribution of the atmosphere–vegetation–soil system.

4. Discussion

The vegetation in degraded grasslands is low and sparse, so ground albedo increases, which decreases the radiation reaching the underlying surface. However, a study on the Songnen grassland showed that soil temperature of degraded grasslands rose dramatically compared with non-degraded grasslands [27]. This is because vegetation as an important medium layer is often neglected. Vegetation stores and consumes energy. Results of this study showed that 80–90% of solar illuminance was intercepted by the non-degraded grassland, of which most of the solar radiation was intercepted by vegetation with only a small part reaching the ground. Therefore, the temperature of the soil surface covered with vegetation was significantly lower than that of the bare land receiving the solar radiation directly. After grassland degradation, solar illuminance interception is reduced and light reaches the ground, leading to high ground temperature, which explains the temperature rise of the degraded grassland.
In this study, the solar illuminance and temperature of each layer of grasslands were contrasted in different degrees of grassland degradation. The degree of grassland degradation represents the discrepancy of vegetation coverage, leading to a distinct ability to intercept solar illuminance. Despite the canopy height of the severely degraded grassland in the experiment arrangement only being 10 cm (with sparse), its ground temperature was still 2–4 °C below that of bare land, demonstrating that the presence or absence of vegetation cover has a crucial influence on ground temperature. Ground temperature is extremely sensitive to vegetation coverage and its variation caused by physiological processes and regional ecological environment.
The solar illuminance interception by grassland vegetation includes the reduction of solar illuminance by physical shielding and the consumption of solar energy by the plants’ life activities. Once grassland vegetation stops growing, light energy consumed by its life activities reaches zero. In this experiment, the solar illuminance in the subareas sprayed with herbicide was merely reduced by physical shielding, and the difference in solar illuminance interception between the normally growing grasslands and fatal grasslands was used for the plants’ life activities. The above method is almost the first exploration of the functional allocation of solar illuminance interception in grasslands.
In degraded grasslands, the vegetation coverage decreases and solar illuminance interception by vegetation weakens. Solar illuminance directly reaches the ground and the nearby atmosphere, causing the changes in ground and air temperatures. Changes in the ground temperature directly cause the changes in the downward transfer of energy and the long-wave radiation from the soil surface to the atmosphere. Therefore, under the complex energy and temperature changes of a grassland regional climate, discussion on the heat balance mode and energy distribution of soil, atmosphere, and vegetation will be of significance to regional climate adjustment and ecological restoration.
This study found that grassland degradation has a greater impact on soil temperature than above-ground temperature, that is, air temperature, indicating that ground temperature is a more sensitive meteorological factor than air temperature in grassland ecosystems; at the same time, soil serves as the root system of vegetation, which has an important impact on plant growth, reproduction, overwintering, and other life activities, so ground temperature can be used as an important indicator for studying grassland ecosystems and evaluating their ecological value. This study can be used as the basis for large-scale spatial pattern research to guide production practices [4,18,30]. Research needs to strengthen the application of spatial information such as remote sensing and GIS in the future, so as to provide a strong scientific basis for the restoration and reconstruction of degraded grasslands.

5. Conclusions

This study showed that solar energy is lost from the canopy of vegetation to the soil surface in grasslands and also varies with the degradation degrees of grasslands. The solar illuminance received at the top of grassland vegetation at different times in a day was sorted by 13:00 (about 2600 molm−2s−1) > 9:00 (about 1000 molm−2s−1) > 17:00 (about 600 molm−2s−1). At 9:00, the percentage of the solar illuminance interception in the non-degraded grassland, mildly degraded grassland, and severely degraded grassland was 80.4%, 51.1%, and 9.5%, respectively. At 13:00 and 17:00, the order of interception percentage remained non-degraded grassland > mildly degraded grassland > severely degraded grassland. In terms of time, the gradient of interception percentage manifested as 17:00 > 13:00 > 9:00. In addition, the solar illuminance interception by vegetation in grasslands showed that the vertical characteristics take the data of each layer into consideration.
There are two parts of loss in the process of sunlight reaching the ground: reduction from blockage by plants (the greater one) and the energy’s participation in life activities. There was a significant difference in the function distribution of grasslands with different degradation degrees. The percentage of the solar illuminance reduced by physical shielding was sorted by non-degraded grassland > mildly degraded grassland > severely degraded grassland. For example, at 9:00, 80.4% of the solar illuminance was intercepted in the non-degraded grassland, including 59% by physical shielding and 21.4% by life activities, and the remaining 19.6% was received by the ground. The percentage of the solar illuminance reduced by physical shielding was sorted by 17:00 > 13:00 > 9:00, generally.
The solar illuminance interception of grassland vegetation directly reduced the grassland temperature, and the temperature in different degraded grasslands was reduced to varying degrees, compared with the bare land. The temperature reduction of the non-degraded grassland was the most significant (nearly 10 degrees higher than that of the bare land at 0 cm). Regarding time, the temperature reduction at 13:00 was more significant than that at 9:00 and 17:00. The difference in ground temperature between the mildly degraded grassland and non-degraded grassland was 2–7 °C, and the difference in ground temperature between the severely degraded grassland and non-degraded grassland was 4–14 °C. The severely degraded grassland with low and sparse vegetation was similar to the bare land, but the ground temperature was still 2–4 °C lower than that of the bare land, suggesting that vegetation cover has an important effect on reducing the ground temperature. The solar illuminance and temperature showed a statistical correlation (the maximum correlation coefficient reached 0.91 at 9:00).
In conclusion, grassland degradation has a serious negative impact on the ground temperature, which breaks the balance between heat’s downward transfer and upward exchange with the atmosphere and changes the energy distribution of the atmosphere–vegetation–soil system.

Author Contributions

Conceptualization, H.Z. and H.D.; methodology, H.Z. and J.F.; validation, H.Z., D.G., J.F. and Y.L.; analysis, H.Z. and J.F.; writing, H.Z., D.G., J.F. and Y.L.; review, H.Z. and H.D.; supervision, H.D.; funding acquisition, H.D. All authors have read and agreed to the published version of the manuscript.

Funding

This research was funded by the National Natural Science Foundation of China, grant number 41871022.

Institutional Review Board Statement

Not applicable.

Informed Consent Statement

Not applicable.

Data Availability Statement

Not applicable.

Conflicts of Interest

The authors declare no conflict of interest.

References

  1. Zhou, D.W.; Ripley, E.A. Environmental changes following burning in a Songnen grassland, China. J. Arid. Environ. 1997, 36, 53–65. [Google Scholar]
  2. Linderholm, H.W. Growing season changes in the last century. Agric. For. Meteorol. 2006, 137, 1–14. [Google Scholar] [CrossRef]
  3. Hao, L.; Wang, S.; Cui, X.; Zhai, Y. Spatiotemporal Dynamics of Vegetation Net Primary Productivity and Its Response to Climate Change in Inner Mongolia from 2002 to 2019. Sustainability 2021, 13, 13310. [Google Scholar] [CrossRef]
  4. Yu, G.; Piao, S.; Zhang, Y.; Liu, L.; Peng, J.; Niu, S. Moving toward a new era of ecosystem science. Geogr. Sustain. 2021, 2, 151–162. [Google Scholar] [CrossRef]
  5. Basto, S.; Thompson, K.; Phoenix, G.; Sloan, V.; Leake, J.; Rees, M. Long-term nitrogen deposition depletes grassland seed banks. Nat. Commun. 2015, 6, 1–6. [Google Scholar] [CrossRef] [PubMed] [Green Version]
  6. Fay, P.; Prober, S.; Harpole, W.; Knops, J.M.; Jin, V.L.; Klein, J.; Moore, J.L.; Bakker, J.D.; Borer, E.T.; Yang, L.H.; et al. Grassland productivity limited by multiple nutrients. Nat. Plants 2015, 1, 15080. [Google Scholar] [CrossRef]
  7. Shawerika, M.R.; Zavaletanona, S.; Chiarielloelsa, R. Grassland Responses to Global Environmental Changes Suppressed by Elevated CO2. Science 2002, 45, 1987–1990. [Google Scholar]
  8. Monteith, L.K. Trapping and Thermal Release of Irradiation Electrons from Polyethylene Terephthalate Films. J. Appl. Phys. 1966, 37, 2633–2639. [Google Scholar] [CrossRef]
  9. Wu, D.H.; Zhao, X.; Liang, S.L.; Zhou, T.; Huang, K.C.; Tang, B.J.; Zhao, W.Q. Time-lag effects of global vegetation responses to climate change. Glob. Chang. Biol. 2015, 21, 3520–3531. [Google Scholar] [CrossRef]
  10. Knapp, A.K.; Fay, P.A.; Blair, J.M.; Collins, S.L.; Smith, M.D.; Carlisle, J.D.; Harper, C.W.; Danner, B.T.; Lett, M.S.; McCarron, J.K. Rainfall Variability, Carbon Cycling, and Plant Species Diversity in a Mesic Grassland. Science 2002, 298, 2202–2205. [Google Scholar] [CrossRef] [Green Version]
  11. Du, H.S.; Wu, Z.Y. Quantitative Evaluation of Agro-Meteorological Disasters in China. Bangladesh J. Bot. 2017, 46, 1105–1115. [Google Scholar]
  12. Old, S.M. Microclimate, Fire, and Plant Production in an Illinois Prairie. Ecol. Monogr. 1969, 39, 355–384. [Google Scholar] [CrossRef]
  13. Facelli, J.; Pickett, S.T.A. Indirect Effects of Litter on Woody Seedlings Subject to Herb Competition. Oikos 1991, 62, 129–138. [Google Scholar] [CrossRef]
  14. Facelli, J.; Pickett, S.T.A. Plant litter: Its dynamics and effects on plant community structure. Bot. Rev. 1991, 57, 1–32. [Google Scholar] [CrossRef]
  15. Wang, L.; Liu, H.; Ketzer, B.; Horn, R.; Bernhofer, C. Effect of grazing intensity on evapotranspiration in the semiarid grasslands of Inner Mongolia, China. J. Arid Environ. 2012, 83, 15–24. [Google Scholar] [CrossRef]
  16. Wang, Q.; Riemann, D.; Vogt, S.; Glaser, R. Impacts of land cover changes on climate trends in Jiangxi province China. Int. J. Biometeorol. 2014, 58, 645–660. [Google Scholar] [CrossRef]
  17. Zhan, Q.; Zhao, W.; Yang, M.; Xiong, D. A long-term record (1995–2019) of the dynamics of land desertification in the middle reaches of Yarlung Zangbo River basin derived from Landsat data. Geogr. Sustain. 2021, 2, 12–21. [Google Scholar] [CrossRef]
  18. Ketzer, B.; Liu, H.; Bernhofer, C. Surface characteristics of grasslands in Inner Mongolia as detected by micrometeorological measurements. Int. J. Biometeorol. 2008, 52, 563–574. [Google Scholar] [CrossRef]
  19. Zhang, G.; Tao, J.; Dong, J.W.; Xu, X. Spatiotemporal variations in thermal growing seasons due to climate change in Eastern Inner Mongolia during the period 1960–2010. Resour. Sci. 2011, 33, 2323–2332. [Google Scholar]
  20. Shen, X.; Liu, B.; Zhou, D. Using GIMMS NDVI time series to estimate the impacts of grassland vegetation cover on surface air temperatures in the temperate grassland region of China. Remote Sens. Lett. 2016, 7, 229–238. [Google Scholar] [CrossRef]
  21. Shen, X.; Liu, B.; Jiang, M.; Lu, X. Marshland Loss Warms Local Land Surface Temperature in China. Geophys. Res. Lett. 2020, 47, e2020GL087648. [Google Scholar] [CrossRef] [Green Version]
  22. Teuling, A.; Seneviratne, S.; Stöckli, R.; Reichstein, M.; Moors, E.; Ciais, P.; Luyssaert, S.; Hurk, B.V.D.; Ammann, C.; Bernhofer, C.; et al. Contrasting response of European forest and grassland energy exchange to heatwaves. Nat. Geosci. 2010, 3, 722–727. [Google Scholar] [CrossRef]
  23. Piao, S.; Mohammat, A.; Fang, J.; Cai, Q.; Feng, J. NDVI-based increase in growth of temperate grasslands and its responses to climate changes in China. Glob. Environ. Chang. 2006, 16, 340–348. [Google Scholar] [CrossRef]
  24. Fang, J.; Piao, S.; He, J.; Ma, W. Increasing terrestrial vegetation activity in China, 1982–1999. Sci. China Ser. C Life Sci. 2004, 47, 229–240. [Google Scholar] [CrossRef]
  25. Mariotto, I.; Gutschick, V.P. Non-Lambertian Corrected Albedo and Vegetation Index for Estimating Land Evapotranspiration in a Heterogeneous Semi-Arid Landscape. Remote Sens. 2010, 2, 926–938. [Google Scholar] [CrossRef]
  26. Zhang, H.; Liu, B.; Zhou, D.; Wu, Z.; Wang, T. Asymmetric Soil Warming under Global Climate Change. Int. J. Environ. Res. Public Health 2019, 16, 1504. [Google Scholar] [CrossRef] [Green Version]
  27. Song, Y.; Zhou, D.; Zhang, H.; Li, G.; Jin, Y.; Li, Q. Effects of vegetation height and density on soil temperature variations. Chin. Sci. Bull. 2013, 58, 907–912. [Google Scholar] [CrossRef] [Green Version]
  28. Karl, T.R.; Kukla, G.; Razuvayev, V.N.; Changery, M.J.; Quayle, R.G.; Heim, R.R.; Easterling, D.R.; Bin Fu, C. Global warming: Evidence for asymmetric diurnal temperature change. Geophys. Res. Lett. 1991, 18, 2253–2256. [Google Scholar] [CrossRef]
  29. Zhang, H.; Wang, E.; Zhou, D.; Luo, Z.; Zhang, Z. Rising soil temperature in China and its potential ecological impact. Sci. Rep. 2016, 6, 35530. [Google Scholar] [CrossRef]
  30. Du, B.; Zheng, Y.; Liu, J.; Mao, D. Threatened plants in China’s sanjiang plain: Hotspot distributions and gap analysis. Sustainability 2018, 10, 194. [Google Scholar] [CrossRef] [Green Version]
Figure 1. Geographical location of Songnen Plain and distribution of Changling Ecological Research Station.
Sustainability 14 04488 g001
Figure 2. Seven subareas’ layout.
Sustainability 14 04488 g002
Figure 3. Long-term monitoring layout. The instruments used are heat flux recorder, pyranometer recorder, soil temperature and humidity probe, air temperature and humidity probe, and evaporation pan.
Sustainability 14 04488 g003
Figure 4. Grassland degradation degree treatments and leaf area indices. N grassland represents non-degraded grassland; M grassland represents mildly degraded grassland; S grassland represents severely degraded grassland; B land represents bare land.
Sustainability 14 04488 g004
Figure 5. Biomass at each layer of grasslands with different degradation degrees. The numbers in the towers represent the biomass of each layer. N grassland represents non-degraded grassland; M grassland represents mildly degraded grassland; S grassland represents severely degraded grassland.
Sustainability 14 04488 g005
Figure 6. Percentage of solar illuminance interception at each layer of normally growing grasslands with different degradation degrees at 9:00 (A), 13:00 (B), and 17:00 (C). The numbers in the rectangles represent the percentages of intercepted solar illuminance in each layer. N grassland represents non-degraded grassland; M grassland represents mildly degraded grassland; S grassland represents severely degraded grassland.
Sustainability 14 04488 g006
Figure 7. Percentage of solar illuminance interception at each layer of different degraded grasslands sprayed with herbicide at 9:00 (A), 13:00 (B), and 17:00 (C). The numbers in the rectangles represent the percentages of intercepted solar illuminance in each layer. N grassland represents non-degraded grassland; M grassland represents mildly degraded grassland; S grassland represents severely degraded grassland.
Sustainability 14 04488 g007
Figure 8. Function distribution of solar illuminance intercepted by grasslands with different degradation degrees. N grassland represents non-degraded grassland; M grassland represents mildly degraded grassland; S grassland represents severely degraded grassland.
Sustainability 14 04488 g008
Figure 9. Temperature at each layer of grasslands with different degradation degrees at 9:00 (A), 13:00 (B), and 17:00 (C). Bars above the columns represent the standard deviation between 9 replicates. B land represents bare land; N grassland represents non-degraded grassland; M grassland represents mildly degraded grassland; S grassland represents severely degraded grassland.
Sustainability 14 04488 g009
Figure 10. Relationship between solar illuminance and grass temperature at different times at 9:00 (A), 13:00 (B), and 17:00 (C).
Sustainability 14 04488 g010
Table 1. Schedule prepared for measurement indicators. NA = not available.
IndicatorsLayerNo. 1
Subarea
No. 2
Subarea
No. 3
Subarea
No. 4
Subarea
No. 5
Subarea
No. 6
Subarea
No. 7
Subarea
Illuminance
(LUX)
0 cm
10 cmNANA NA
20 cm NANANA
30 cmNANA NANANA
40 cm NANANANANA
60 cm NANANANANA
80 cm NANANANANA
Temperature
(℃)
0 cm
10 cmNANA NA
20 cm NANANA
30 cmNANA NANANA
40 cm NANANANANA
60 cm NANANANANA
80 cm NANANANANA
Biomass
(g)
0 cm
10 cmNANA NA
20 cm NANANA
30 cmNANA NANANA
40 cm NANANANANA
60 cm NANANANANA
80 cm NANANANANA
Table 2. Solar illuminance loss of normally growing grasslands (G) and grasslands sprayed with herbicide (F) (molm−2s−1).
TypesLayer9:0013:0017:00
Top 80 cm (molm−2s−1)9522664617
TreatmentsGFGFGF
Non-degraded grassland60–80 cm323218110842416760
40–60 cm162104579421252142
20–40 cm927130025812297
0–20 cm1881693492865032
Mildly degraded grassland20–30 cm10666703497163116
10–20 cm208164410327174166
0–10 cm1831175394159986
Severely degraded grassland0–10 cm9075617463178104
Table 3. Ground temperatures of normal growing grasslands with different degradation degrees (°C).
Type9:0013:0017:00
Bare land34.539.235.9
Severely degraded grassland30.937.634.4
Mildly degraded grassland28.334.627.5
Non-degraded grassland26.330.321.1
Publisher’s Note: MDPI stays neutral with regard to jurisdictional claims in published maps and institutional affiliations.

