
Categorical Evaluation of Scientific Research Efficiency in Chinese Universities: Basic and Applied Research


Abstract
:1. Introduction
2. Literature Review
3. Research Design
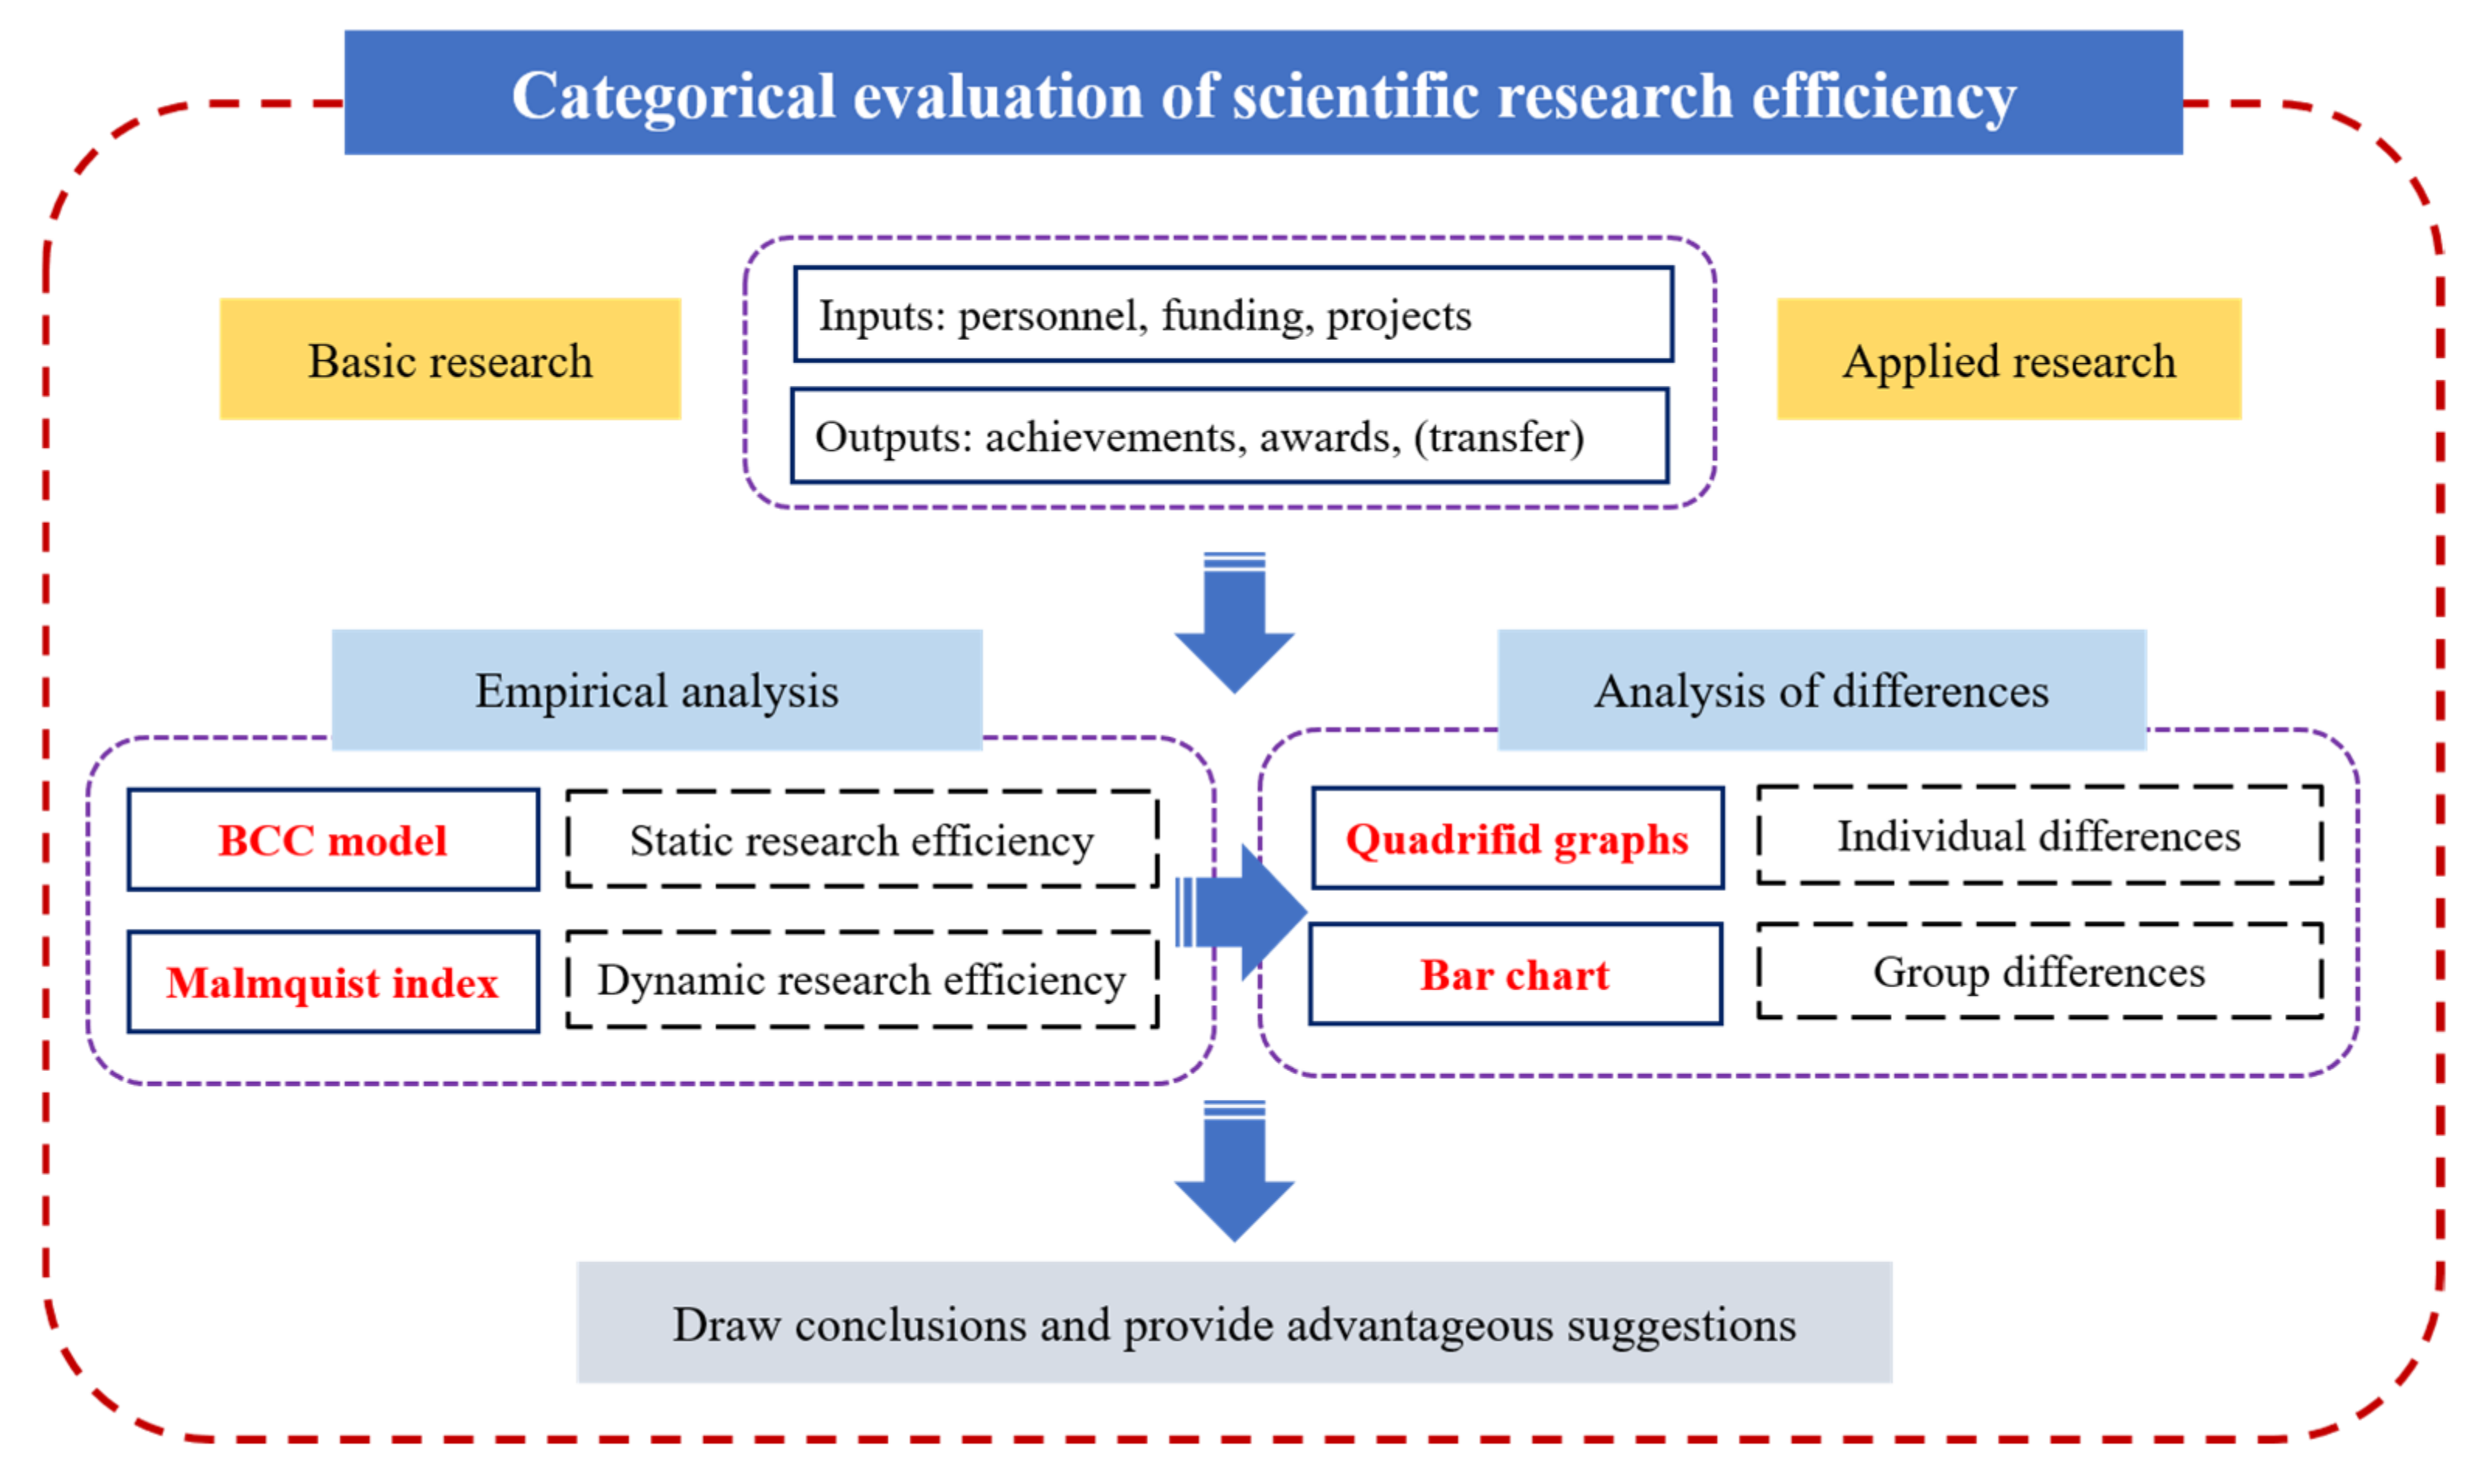
3.1. Research Ideas
3.2. Samples and Data
3.3. Research Model
3.3.1. BCC Model
3.3.2. Malmquist Index
4. Evaluation Index Construction
4.1. Evaluation Index Construction of Basic Research Efficiency
4.2. Evaluation Index Construction of Applied Research Efficiency
5. Empirical Analysis Results
5.1. Efficiency Evaluation of Basic Research in Universities
5.2. Efficiency Evaluation of Applied Research in Universities
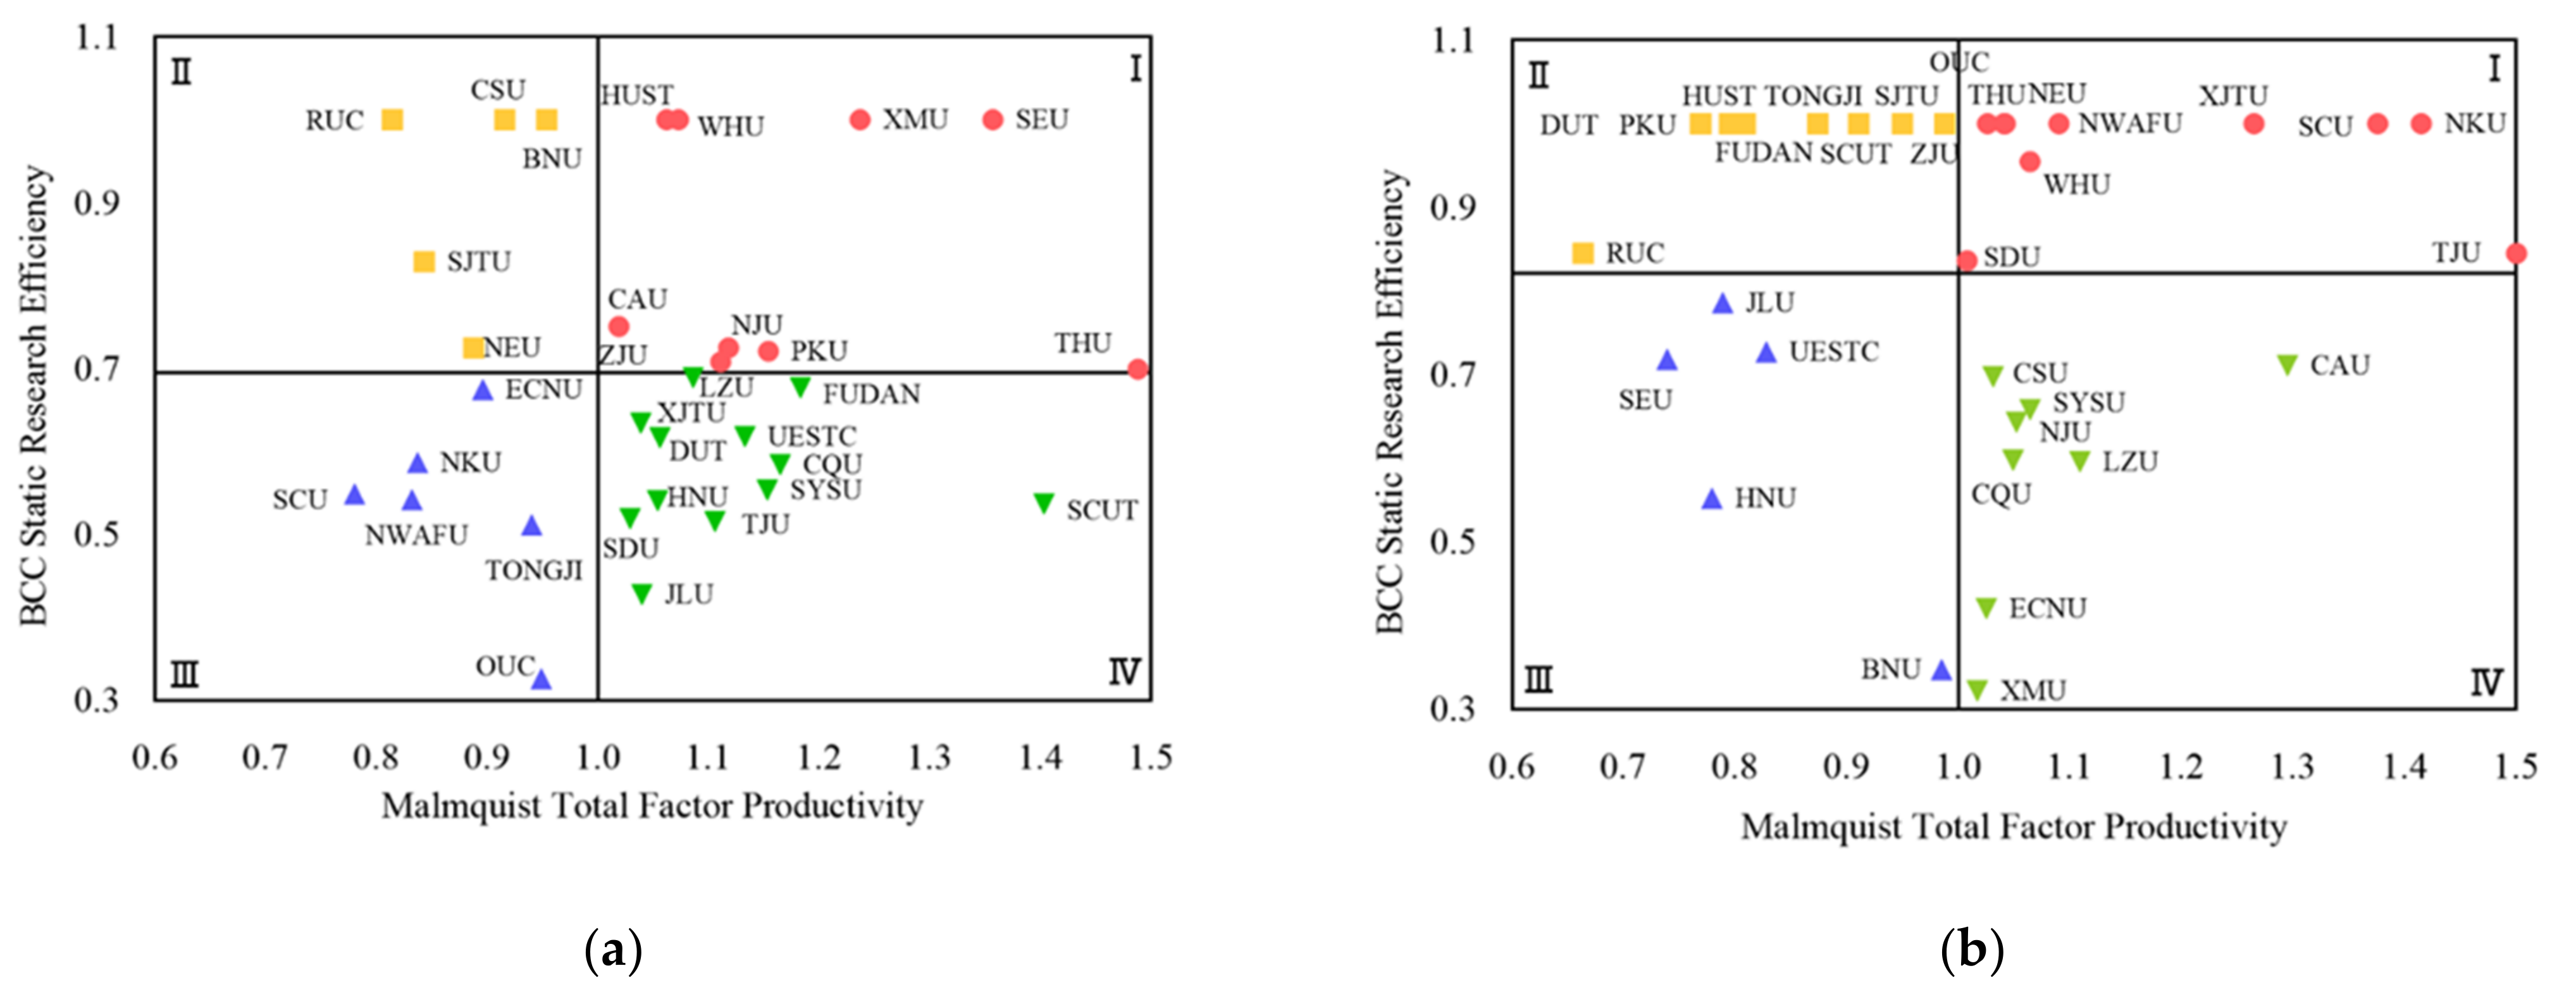
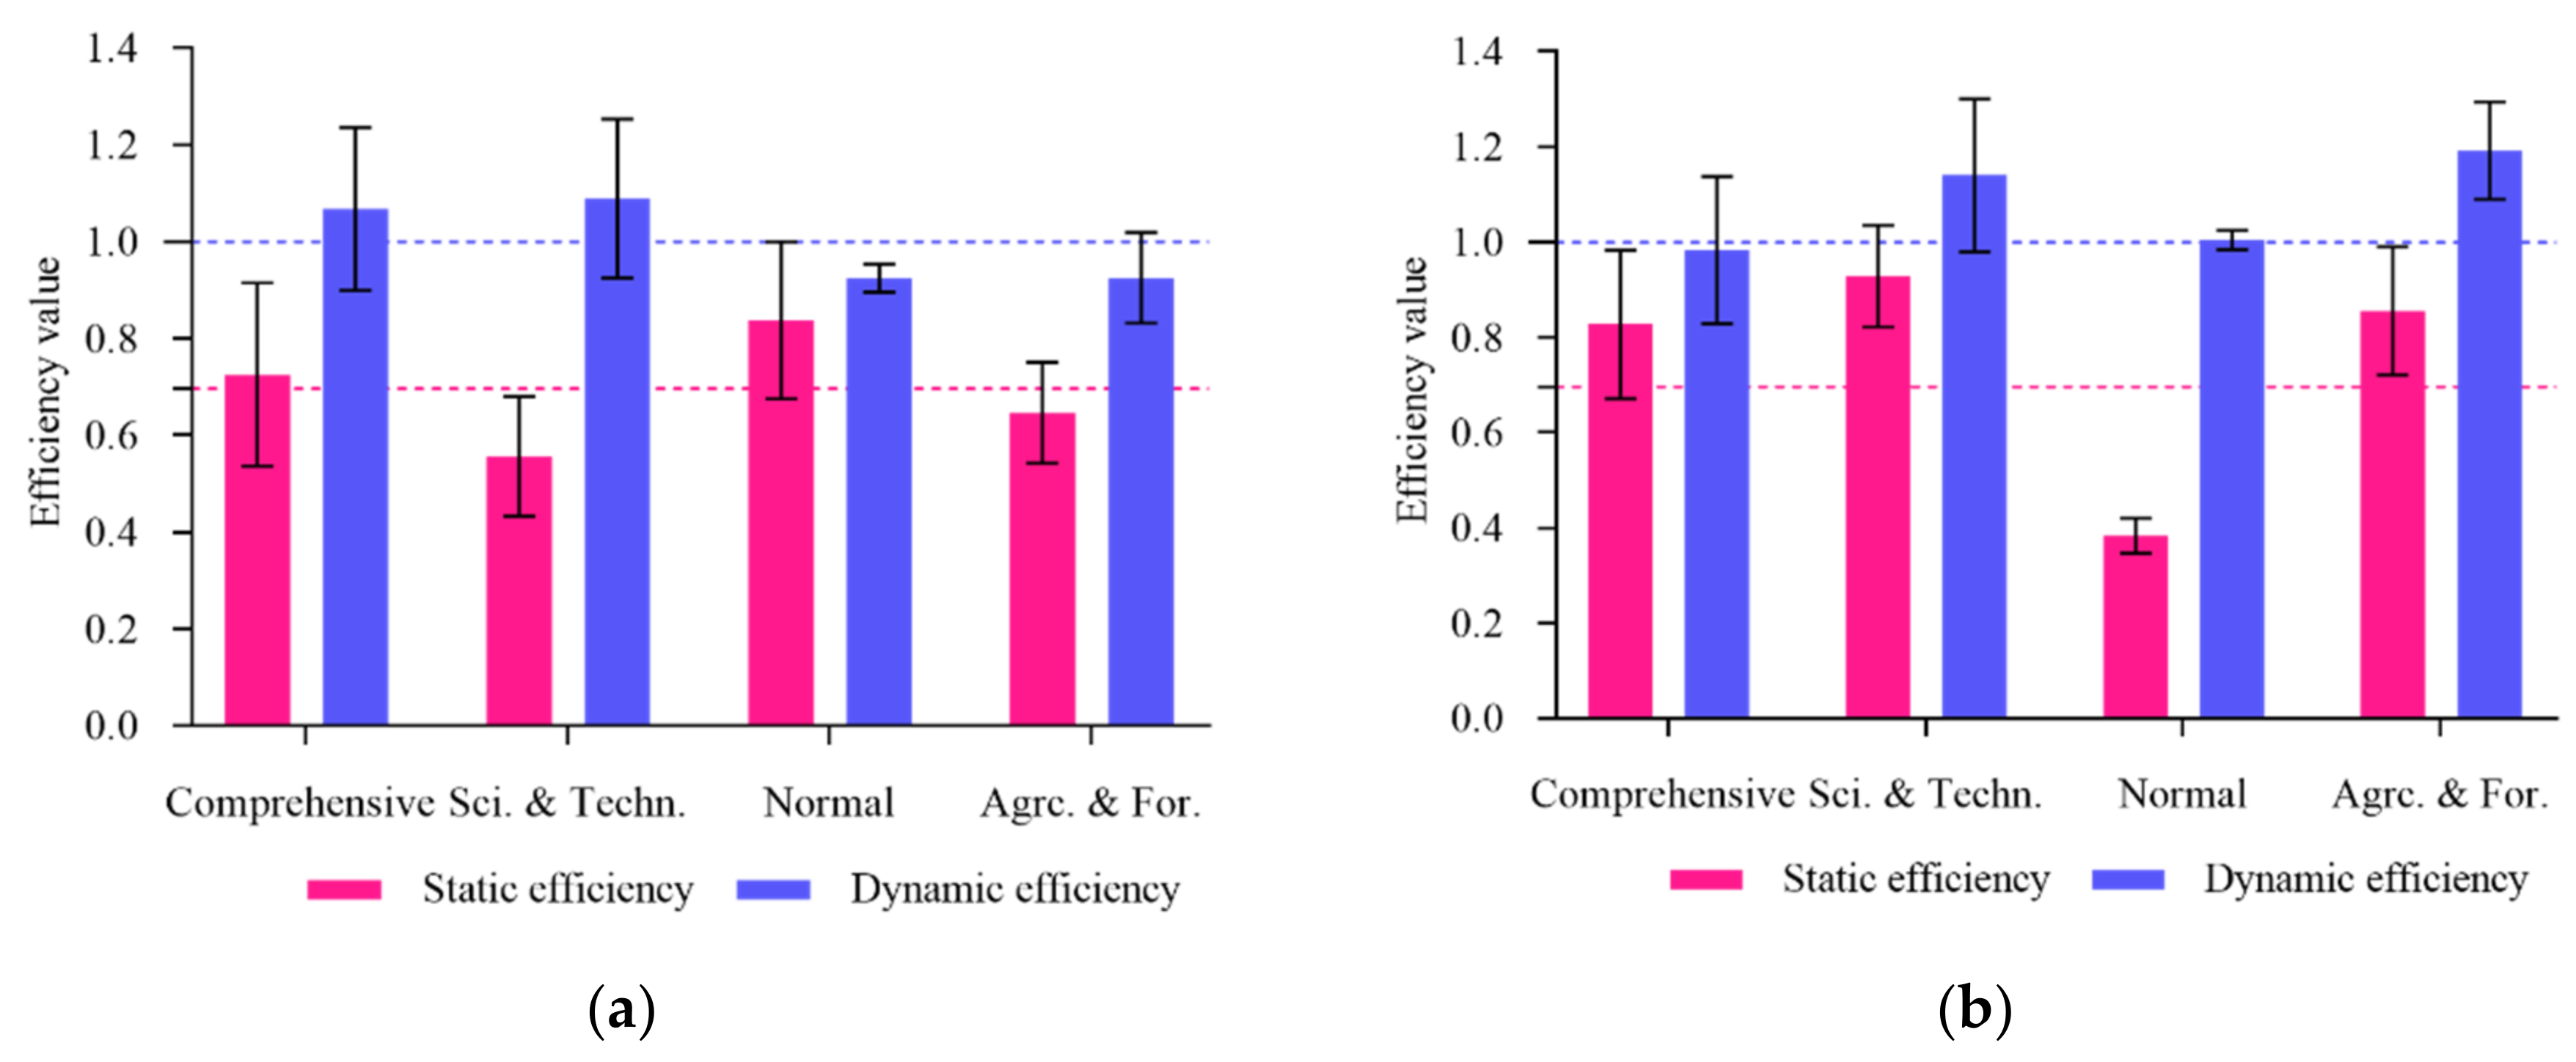
5.3. Analysis of Differences between Sample Universities
5.3.1. Individual Differences
5.3.2. Group Differences
6. Conclusions and Suggestions
6.1. Research Conclusions
6.2. Suggestions
7. Discussion
Author Contributions
Funding
Institutional Review Board Statement
Informed Consent Statement
Data Availability Statement
Acknowledgments
Conflicts of Interest
References
- National Government of the People’s Republic of China. Outline of the 14th Five-Year Plan for National Economic and Social Development of the People’s Republic of China and the Vision for 2035; The Xinhua News Agency: Beijing, China, 2022.
- Kempkes, G.; Pohl, C. The efficiency of German universities—Some evidence from nonparametric and parametric methods. Appl. Econ. 2010, 42, 2063–2079. [Google Scholar] [CrossRef] [Green Version]
- Rhaiem, M.; Amara, N. Determinants of research efficiency in Canadian business schools: Evidence from scholar-level data. Scientometrics 2020, 125, 53–99. [Google Scholar] [CrossRef]
- Amara, N.; Rhaiem, M.; Halilem, N. Assessing the research efficiency of Canadian scholars in the management field: Evidence from the DEA and fsQCA. J. Bus. Res. 2020, 115, 296–306. [Google Scholar] [CrossRef]
- Shamohammadi, M.; Oh, D.H. Measuring the efficiency changes of private universities of Korea: A two-stage network data envelopment analysis. Technol. Forecast. Soc. Change 2019, 148, 119730. [Google Scholar] [CrossRef]
- Expósito-García, A.; Velasco-Morente, F. How efficient are universities at publishing research? A data envelopment analysis of Spanish state universities. Prof. De La Inf. 2018, 27, 1108–1115. [Google Scholar] [CrossRef] [Green Version]
- Xu, X.; Zhi, Y. Research on regional differences and influencing factors of scientific research efficiency in universities under the background of “Double First-Class”. Sci. Manag. Res. 2021, 39, 50–57. [Google Scholar]
- Jiang, J.; Lee, S.; Rah, M. Assessing the research efficiency of Chinese higher education institutions by data envelopment analysis. Asia Pac. Educ. Rev. 2020, 21, 423–440. [Google Scholar] [CrossRef]
- Xue, W.; Li, H.; Ali, R.; Rehman, R.U.; Fernandez-Sanchez, G. Assessing the Static and Dynamic Efficiency of Scientific Research of HEIs China: Three Stage DEA-Malmquist Index Approach. Sustainability 2021, 13, 8207. [Google Scholar] [CrossRef]
- Su, W.; Wang, D.; Xu, L.; Zeng, S.; Zhang, C. A Nonradial Super Efficiency DEA Framework Using a MCDM to Measure the Research Efficiency of Disciplines at Chinese Universities. IEEE Access 2020, 8, 86388–86399. [Google Scholar] [CrossRef]
- Wang, L.; Wang, T. Research on the Scientific Research Efficiency of Provincial Universities Based on the DEA Model. Mob. Inf. Syst. 2021. [Google Scholar] [CrossRef]
- Zong, X.; Fu, C. The research efficiency of “Double First-Class” universities and its changes: Based on super-efficiency DEA and Malmquist index decomposition. J. Chongqing Univ. 2020, 26, 93–106. [Google Scholar]
- Chen, X.; Shu, X. The scientific and technological innovation performance of Chinese “World-Class” universities and its in-fluencing factors. IEEE Access 2021, 9, 84639–84650. [Google Scholar] [CrossRef]
- Xiong, X.; Yang, G.-L.; Guan, Z.-C. Assessing R&D efficiency using a two-stage dynamic DEA model: A case study of research institutes in the Chinese Academy of Sciences. J. Informetr. 2018, 12, 784–805. [Google Scholar]
- Chen, H.; He, P.; Zhang, C.X.; Liu, Q. Efficiency of technological innovation in China’s high tech industry based on DEA method. J. Interdiscip. Math. 2017, 20, 1493–1496. [Google Scholar] [CrossRef]
- Avkiran, N.K. Investigating technical and scale efficiencies of Australian universities through data envelopment analysis. Socio-Econ. Plan. Sci. 2001, 35, 57–80. [Google Scholar] [CrossRef]
- Wu, J.; Zhang, G.; Zhu, Q.; Zhou, Z. An efficiency analysis of higher education institutions in China from a regional perspective considering the external environmental impact. Scientometrics 2020, 122, 57–70. [Google Scholar] [CrossRef]
- Tian, L.; Hang, X. The input-output efficiency of scientific researches of universities in different regions and the determination factors analysis: An empirical research based on DEA-Tobit model. Res. Technol. Manag. 2018, 13, 45–58. [Google Scholar]
- Liu, X.; Zuo, X. The Analysis of Regional Features and Influence Factors on the Research Efficiency of Chinese Universities—An Empirical Study Based on the Three Stage DEA. J. Natl. Acad. Educ. Adm. 2015, 5, 77–83. [Google Scholar]
- Cai, H.; Liang, L.; Tang, J.; Wang, Q.; Wei, L.; Xie, J. An empirical study on the efficiency and influencing factors of the Photovoltaic industry in China and an analysis of its influencing factors. Sustainability 2019, 11, 6693. [Google Scholar] [CrossRef] [Green Version]
- Chen, K.H.; Kou, M.T.; Fu, X.L. Evaluation of multi-period regional R&D efficiency: An application of dynamic DEA to China’s regional R&D systems. Omega-Int. J. Manag. Sci. 2018, 74, 103–114. [Google Scholar]
- Wang, D.; Shi, Y.; Yu, Q. Research on Transformation Efficiency of Scientific and Technological Achievements of “Double First-Class” Project Universities in Northeast China. Heilongjiang Res. High. Educ. 2022, 1, 44–49. [Google Scholar]
- Abramo, G.; Cicero, T.; d’Angelo, C.A. A field-standardized application of DEA to national-scale research assessment of universities. J. Informetr. 2011, 5, 618–628. [Google Scholar] [CrossRef] [Green Version]
- Johnes, J. Data envelopment analysis and its application to the measurement of efficiency in higher education. Econ. Educ. Rev. 2006, 25, 273–288. [Google Scholar] [CrossRef] [Green Version]
- Feng, Y.; Zhang, H.; Chiu, Y.; Chang, T. Innovation efficiency and the impact of the institutional quality: A cross-country analysis using the two-stage meta-frontier dynamic network DEA model. Scientometrics 2021, 126, 3091–3129. [Google Scholar] [CrossRef]
- Charnes, A.; Cooper, W.W.; Rhodes, E. Measuring the efficiency of decision making units. Eur. J. Oper. Res. 1978, 2, 429–444. [Google Scholar] [CrossRef]
- Banker, R.D.; Charnes, A.; Cooper, W.W. Some models for estimating technical and scale inefficiencies in data envelopment analysis. Manag. Sci. 1984, 30, 1078–1092. [Google Scholar] [CrossRef] [Green Version]
- Pastor, J.T.; Lovell, C. Circularity of the Malmquist productivity index. Econ. Theory 2007, 33, 591–599. [Google Scholar] [CrossRef]
- Wang, X.; Hu, H. Sustainable Evaluation of Social Science Research in Higher Education Institutions Based on Data Envelopment Analysis. Sustainability 2017, 9, 644. [Google Scholar] [CrossRef] [Green Version]
- Zhong, W.; Yuan, W.; Li, S.X.; Huang, Z. The performance evaluation of regional R&D investments in China: An application of DEA based on the first official China economic census data. Omega 2011, 39, 447–455. [Google Scholar]
- Sun, Z.; Xu, X. Technology Distance to Frontier and the Innovative Effect of Scientific Research—Which One Plays More Important Role, Basic Research or Applied Research. Chin. Ind. Econ. 2017, 3, 5–19. [Google Scholar]
- Li, Z.; Wang, S. Industrial Innovation Effects of Basic Research and Applied Research. Wuhan Univ. J. 2021, 74, 91–104. [Google Scholar]
- Bertoletti, A.; Johnes, G. Efficiency in university-industry collaboration: An analysis of UK higher education institutions. Scientometrics 2021, 126, 7679–7714. [Google Scholar] [CrossRef]
- Zheng, B.; Chen, W.; Zhao, H. The Spatial and Temporal Characteristics of Industry-University Research Collaboration Efficiency in Chinese Mainland Universities. Sustainability 2021, 13, 13180. [Google Scholar] [CrossRef]
- Cao, X.; Li, C. Evolutionary Game Simulation of Knowledge Transfer in Industry-University-Research Cooperative Innovation Network under Different Network Scales. Sci. Rep. 2020, 10, 4027. [Google Scholar] [CrossRef] [Green Version]
- Tian, Q.; Zhang, Z.; Ren, X.; Zhang, X. “Input-Output-Policy” Analysis on Basic Research of Scientific and Technological Powers and Its Enlightenment to China. Bull. Chin. Acad. Sci. 2019, 34, 1406–1420. [Google Scholar]
- Zhu, Y. The allocation pattern of innovation-oriented national basic research funds and its enlightenment. Forum Sci. Technol. China 2018, 2, 15–22. [Google Scholar]
- Sauer, J.; Paul, C.J.M. The empirical identification of heterogeneous technologies and technical change. Appl. Econ. 2013, 45, 1461–1479. [Google Scholar] [CrossRef]
- Kim, D.; Song, Q.; Liu, J.; Liu, Q.; Grimm, A. Building world class universities in China: Exploring faculty’s perceptions, interpretations of and struggles with global forces in higher education. Comp. A J. Comp. Int. Educ. 2018, 48, 92–109. [Google Scholar] [CrossRef]
- Yan, H.; Zhao, L.; Liu, Y.; Tian, Q. An empirical study on the impact of tutor identity on fund acquisition of science researchers in China. Stud. Sci. Sci. 2022, 38, 852–859. [Google Scholar]

| First-Level Indicators | Second-Level Indicators | 2015 (2012) | 2016 (2013) | 2017 (2014) | Average Annual Rate | |
|---|---|---|---|---|---|---|
| Inputs | Personnel | Personnel input in that year | 18,479 | 20,050 | 21,371 | 7.54% |
| Fundings | R&D expenditure of that year | 713,494 | 845,472 | 884,517 | 11.54% | |
| Projects | Research projects approved in that year | 33,789 | 35,410 | 38,791 | 7.17% | |
| Outputs | Scientific and technological achievements | SCI/SSCI papers | 172,870 | 191,626 | 211,090 | 10.50% |
| Scientific works | 1161 | 1266 | 1276 | 4.92% | ||
| Number of National invention patent authorization | 13,070 | 16,843 | 19,055 | 21.00% | ||
| Number of national projects accepted | 951 | 966 | 1041 | 4.67% | ||
| Achievement awards | Number of national awards | 188 | 208 | 220 | 8.20% |
| First-Level Indicators | Second-Level Indicators | 2015 (2013) | 2016 (2014) | 2017 (2015) | Average Annual Rate | |
|---|---|---|---|---|---|---|
| Inputs | Personnel | Personnel input in that year | 18,040 | 17,605 | 18,777 | 4.25% |
| Fundings | R&D expenditure of that year | 1,044,220 | 1,088,860 | 1,210,942 | 7.74% | |
| Projects | Research projects approved in that year | 35,522 | 37,173 | 39,214 | 5.07% | |
| Outputs | Scientific and technological achievements | EI/CSSCI/Chinese Core Journals papers | 209,036 | 209,122 | 218,049 | 2.15% |
| Number of research reports adopted | 1558 | 1692 | 1763 | 6.40% | ||
| Number of national utility model patent authorization | 5087 | 5675 | 6062 | 9.19% | ||
| Number of national projects accepted | 436 | 534 | 461 | 4.40% | ||
| Achievement awards | Number of national awards | 104 | 115 | 109 | 2.68% | |
| Technology transfer | Number of technology transfer contracts | 2611 | 1917 | 1637 | −20.59% | |
| Income of technology transfer that year | 107,639 | 84,035 | 85,554 | −10.06% |
| Universities | BCC Model | Malmquist Index | Universities | BCC Model | Malmquist Index | ||||||||
|---|---|---|---|---|---|---|---|---|---|---|---|---|---|
| Crste | Vrste | Scale | Tfpch | Techch | Effch | Crste | Vrste | Scale | Tfpch | Techch | Effch | ||
| PKU | 0.721 | 1 | 0.721 | 1.154 | 1.257 | 0.918 | XMU | 1 | 1 | 1 | 1.237 | 1.237 | 1 |
| RUC | 1 | 1 | 1 | 0.814 | 0.814 | 1 | SDU | 0.519 | 0.796 | 0.652 | 1.029 | 1.301 | 0.791 |
| THU | 0.699 | 1 | 0.699 | 1.488 | 1.511 | 0.985 | OUC | 0.326 | 0.847 | 0.385 | 0.949 | 1.179 | 0.805 |
| CAU | 0.751 | 0.99 | 0.728 | 1.019 | 1.141 | 0.893 | WHU | 1 | 1 | 1 | 1.073 | 1.226 | 0.875 |
| BNU | 1 | 1 | 1 | 0.954 | 1.073 | 0.889 | HUST | 1 | 1 | 1 | 1.062 | 1.293 | 0.821 |
| NKU | 0.587 | 1 | 0.587 | 0.837 | 0.817 | 1.025 | HNU | 0.541 | 0.582 | 0.929 | 1.054 | 1.305 | 0.808 |
| TJU | 0.516 | 0.772 | 0.668 | 1.106 | 1.345 | 0.822 | CSU | 1 | 1 | 1 | 0.916 | 1.102 | 0.831 |
| DUT | 0.617 | 0.983 | 0.628 | 1.056 | 1.266 | 0.834 | SYSU | 0.554 | 0.75 | 0.738 | 1.153 | 1.294 | 0.891 |
| NEU | 0.725 | 1 | 0.725 | 0.888 | 1.113 | 0.798 | SCUT | 0.537 | 0.737 | 0.729 | 1.403 | 1.643 | 0.854 |
| JLU | 0.428 | 0.635 | 0.67 | 1.040 | 1.323 | 0.786 | CQU | 0.584 | 0.663 | 0.881 | 1.165 | 1.523 | 0.765 |
| FUDAN | 0.677 | 0.952 | 0.711 | 1.183 | 1.276 | 0.927 | SCU | 0.549 | 1 | 0.549 | 0.780 | 1.08 | 0.722 |
| TONGJI | 0.512 | 0.925 | 0.553 | 0.940 | 1.41 | 0.667 | UESTC | 0.618 | 0.947 | 0.653 | 1.133 | 1.455 | 0.779 |
| SJTU | 0.829 | 1 | 0.829 | 0.843 | 1.158 | 0.728 | XJTU | 0.634 | 1 | 0.634 | 1.039 | 1.294 | 0.803 |
| ECNU | 0.675 | 0.951 | 0.71 | 0.896 | 0.862 | 1.04 | NWAFU | 0.542 | 0.922 | 0.588 | 0.832 | 1.145 | 0.727 |
| NJU | 0.725 | 1 | 0.725 | 1.118 | 1.396 | 0.801 | LZU | 0.689 | 0.713 | 0.967 | 1.086 | 1.369 | 0.793 |
| SEU | 1 | 1 | 1 | 1.357 | 1.357 | 1 | Average | 0.695 | 0.911 | 0.761 | 1.054 | 1.250 | 0.849 |
| ZJU | 0.708 | 1 | 0.708 | 1.111 | 1.436 | 0.774 | |||||||
| Universities | BCC Model | Malmquist Index | Universities | BCC Model | Malmquist Index | ||||||||
|---|---|---|---|---|---|---|---|---|---|---|---|---|---|
| Crste | Vrste | Scale | Tfpch | Techch | Effch | Crste | Vrste | Scale | Tfpch | Techch | Effch | ||
| PKU | 1 | 1 | 1 | 0.769 | 0.62 | 1.241 | XMU | 0.322 | 0.482 | 0.669 | 1.017 | 0.833 | 1.221 |
| RUC | 0.845 | 1 | 0.845 | 0.664 | 0.664 | 1 | SDU | 0.836 | 0.909 | 0.92 | 1.008 | 0.845 | 1.193 |
| THU | 1 | 1 | 1 | 1.026 | 1.026 | 1 | OUC | 1 | 1 | 1 | 1.042 | 0.679 | 1.535 |
| CAU | 0.711 | 0.878 | 0.81 | 1.295 | 0.736 | 1.76 | WHU | 0.955 | 1 | 0.955 | 1.064 | 0.784 | 1.357 |
| BNU | 0.347 | 0.588 | 0.59 | 0.985 | 0.69 | 1.428 | HUST | 1 | 1 | 1 | 0.795 | 0.795 | 1 |
| NKU | 1 | 1 | 1 | 1.376 | 0.833 | 1.652 | HNU | 0.552 | 0.656 | 0.842 | 0.779 | 0.792 | 0.983 |
| TJU | 0.845 | 1 | 0.845 | 2.254 | 1.786 | 1.262 | CSU | 0.697 | 0.781 | 0.892 | 1.031 | 0.641 | 1.608 |
| DUT | 1 | 1 | 1 | 0.769 | 0.783 | 0.982 | SYSU | 0.658 | 0.983 | 0.669 | 1.064 | 0.926 | 1.149 |
| NEU | 1 | 1 | 1 | 1.041 | 0.962 | 1.082 | SCUT | 1 | 1 | 1 | 0.911 | 0.911 | 1 |
| JLU | 0.786 | 1 | 0.786 | 0.789 | 0.91 | 0.867 | CQU | 0.598 | 1 | 0.598 | 1.049 | 0.875 | 1.199 |
| FUDAN | 1 | 1 | 1 | 0.809 | 0.784 | 1.032 | SCU | 1 | 1 | 1 | 1.415 | 0.905 | 1.563 |
| TONGJI | 1 | 1 | 1 | 0.874 | 0.797 | 1.096 | UESTC | 0.727 | 0.949 | 0.766 | 0.828 | 0.638 | 1.298 |
| SJTU | 1 | 1 | 1 | 0.950 | 0.859 | 1.106 | XJTU | 1 | 1 | 1 | 1.265 | 0.946 | 1.337 |
| ECNU | 0.42 | 0.614 | 0.684 | 1.025 | 0.91 | 1.126 | NWAFU | 1 | 1 | 1 | 1.090 | 0.758 | 1.438 |
| NJU | 0.643 | 1 | 0.643 | 1.052 | 0.75 | 1.402 | LZU | 0.596 | 0.65 | 0.917 | 1.109 | 1.083 | 1.024 |
| SEU | 0.718 | 0.833 | 0.862 | 0.739 | 0.651 | 1.135 | Average | 0.821 | 0.916 | 0.884 | 1.027 | 0.844 | 1.227 |
| ZJU | 1 | 1 | 1 | 0.988 | 0.828 | 1.193 | |||||||
Publisher’s Note: MDPI stays neutral with regard to jurisdictional claims in published maps and institutional affiliations. |
© 2022 by the authors. Licensee MDPI, Basel, Switzerland. This article is an open access article distributed under the terms and conditions of the Creative Commons Attribution (CC BY) license (https://creativecommons.org/licenses/by/4.0/).
Share and Cite
Shi, Y.; Wang, D.; Zhang, Z. Categorical Evaluation of Scientific Research Efficiency in Chinese Universities: Basic and Applied Research. Sustainability 2022, 14, 4402. https://doi.org/10.3390/su14084402
Shi Y, Wang D, Zhang Z. Categorical Evaluation of Scientific Research Efficiency in Chinese Universities: Basic and Applied Research. Sustainability. 2022; 14(8):4402. https://doi.org/10.3390/su14084402
Chicago/Turabian StyleShi, Yukun, Duchun Wang, and Zimeng Zhang. 2022. "Categorical Evaluation of Scientific Research Efficiency in Chinese Universities: Basic and Applied Research" Sustainability 14, no. 8: 4402. https://doi.org/10.3390/su14084402
APA StyleShi, Y., Wang, D., & Zhang, Z. (2022). Categorical Evaluation of Scientific Research Efficiency in Chinese Universities: Basic and Applied Research. Sustainability, 14(8), 4402. https://doi.org/10.3390/su14084402