1. Introduction
The purpose of this exploratory study is to investigate what associations Norwegian citizens have with the Sustainable Development Goals (SDGs) through a three-tier analysis of both their knowledge of, and attitudes towards, these goals. In order to make the SDGs the actionable part of the United Nations’ 2030 Agenda for Sustainable Development, they need to be known and supported both at the nation-state level (through various institutions and stakeholders) and at the individual level. Norway is a pertinent case to study in this context, given its important governmental support to the SDG initiative and awareness-raising campaigns.
“Sustainability” and “sustainable development” have become, since the Brundtland Report in 1987 and the following Agenda 21 United Nations report in 1992 [
1], broad and complex terms with increasing use in national and international politics. The launch of the United Nations’ Agenda 2030 in September 2015 advanced this discourse to incorporate nature and natural resources and marked a historic integration of economic, social and environmental dimensions of sustainability.
The actionable part of “Transforming our World: the 2030 Agenda for Sustainable Development” [
2] are the Sustainable Development Goals (SDGs) [
3]. The 17 SDGs and associated 169 targets represent an ambitious, existential and global plan of action to adopt “(…) for people, planet and prosperity” [
3]. (The 17 SDGs are: (1) No poverty; (2) Zero hunger; (3) Good health and well-being; (4) Quality education; (5) Gender equality; (6) Clean water and sanitation; (7) Affordable and clean energy; (8) Decent work and economic growth; (9) Industry, innovation and infrastructure; (10) Reduced inequalities; (11) Sustainable cities and communities; (12) Responsible consumption and production; (13) Climate action; (14) Life below water; (15) Life on land; (16) Peace, justice and strong institutions and; (17) Partnerships for the goals).
Since 2015, the United Nations, through its various entities, has produced several guidance documents, frameworks, and tools that aim to translate the SDGs from theory to practice. Principal among these is the Roadmap [
4] that offers a set of high-level tools, approaches, and methods for local and regional governments to localize the SDGs to their situations. A key theme throughout the guidelines is the importance of participatory decision making with stakeholders and capacity development. For citizens, businesses and planners to make progress toward the Global Goals, they need to be familiar with the SDG framework and its goals and targets. Thus, the first step of “localizing” the SDGs is raising awareness.
A recent review on citizen awareness and perceptions towards sustainability by Radzi et al. [
5] showed that education and a sense of community (local communities of citizens and business communities) are important to foster awareness on sustainability. Non-governmental organizations have also played a key role in raising awareness and holding institutions and businesses responsible for actions towards sustainability [
6]. See also research on controversy surrounding fashion sustainability [
7].
In addition to awareness and the perceived need for sustainability there is also the need for a common understanding of who is responsible to address and fulfil the UN Sustainable Development Goals. The study by Crotty and Hall [
8] in Russia shows that the dramatic social and economic change in the transition after the collapse of the Soviet Union had a measured effect on the “mentality” of Russians in regard to the environment and responsibility for sustainable development. The Russian respondents indicated that this mentality is formed by lack of interest and lack of education “resulting in a harmful combination of situational, personal and educational obstacles to sustainable development” [
8].
However, perhaps the most prominent example of localizing the SDGs in Norway is explicit in the report from the Ministry of Local Government and Modernisation, “National expectations for regional and municipal planning 2019–2023”. [
11] This public governmental document clearly conveys that the 17 SDGs “shall provide the main direction for Norway’s policy to address the greatest challenges of our time. It is therefore important that the sustainable development goals are incorporated as part of the basis for social and land use planning.” (Foreword, p. 3).
The role of education in awareness of sustainable development is central in many studies [
5,
12,
13]. Norway is a country with strong educational institutions for citizens of all ages. For example, Norway ranks above the OECD average in organized learning before primary school [
14]. National statistics for 2020 show that 35.4% of the Norwegian population over age 16 have some form of higher education of four years or more (Statistics Norway,
https://data.ssb.no/api/v0/en/table/11293/ (accessed on 23 February 2022)). Considering previous studies that correlate awareness of sustainability with higher education [
5], we expect Norwegian citizens to have a high awareness of sustainability and the SDGs.
Surveys from various countries around the world show strong evidence of heterogeneity of public views on the meaning and significance of the different SDGs [
15]. A review of citizens in 12 countries by Bain et al. [
16] used mental maps to illustrate public perception of the SDGs regarding social, economic and environmental sustainability categories. The results show perceived tensions among the SDGs by the respondents across countries. The complexity of communication of sustainability initiatives in different public spheres is a true policy challenge which warrants closer attention to representative country-specific studies [
16].
In China, Guan et al. [
17] surveyed five cities in 2017 to understand public attitudes toward the SDGs. Demographic variables, individual value predispositions and existing SDG-relevant knowledge all influence support of the SDGs. Their findings show that individuals use both their SDG-related knowledge and their value predispositions in their support of the SDGs, and that the former has the ability to reverse adverse effects from the latter. More recently, Zheng et al. [
18] have underscored the importance of understanding and harnessing the power of culture for meaningful action towards the ambitions of the SDGs. In addition, a relevant perspective is developed by Dellmuth et al. [
19] on the elite–citizen gap in international organization legitimacy, where clear differences in perceived legitimacy of different international organizations, including the United Nations, occur between societal elites and citizens.
Can the SDGs prescribed and promoted by government elites and authorities affect the perceptions of the SDGs by Norwegians? This is one of the questions we pose in the present exploratory study. We do this through an open-ended question distributed to a representative sample of the Norwegian population, to find out what citizens really think about the SDGs. The results will constitute important guidelines for different stakeholders in awareness-raising efforts.
What do citizens in Norway think about the SDGs? To our knowledge, no comprehensive survey of public perceptions and attitudes regarding the SDGs has been conducted in Norway. While recognition of the 17 Goals and knowledge of the associated 169 targets among Norwegian civil society would be prime indicators of Norway’s public “readiness” for sustainable development, the lack of awareness of the Global Goals and/or negative associations to the SDGs would indicate certain barriers to the implementation of the SDGs; a result which could hinder the government’s efforts to make the SDGs a guiding principle in regional and local planning.
With a point of departure in the above review of previous research on SDG issues and in the situation in Norway, characterized by comprehensive awareness raising of the SDGs, we investigate the following research questions (RQ):
- RQ1:
What associations do Norwegian citizens have when prompted to freely reflect on the SDGs?
- RQ2:
What do they know (or don’t know) about the SDGs?
- RQ3:
What are their attitudes towards the goals?
Many would say there is a pressing need for broad support of the United Nations Sustainable Development Goals (SDGs), among politicians and different stakeholders, but we argue that this support is also needed among “ordinary citizens” if progress is to be made towards sustainability. Thus, the aim of the present paper is to investigate to what extent the SDGs are known among a representative sample of Norwegian citizens and what attitudes are associated with them. We aim to provide rich data with nuanced answers to this issue through an innovative method of fielding an open-ended question, asking what the respondents think of when they hear or read the expression “United Nations Sustainable Development Goals”.
In order to understand and explain the heterogeneous content of the 4046 answers provided by our survey fielded in 2020, we use a research design of three different and complementary analytical approaches. First, we undertake a semi-automated topic analysis through structural topic modelling; then we assume a qualitative and manual content analysis, and finally the data are submitted to an analysis of demographic variables. Taken together, our analysis provides a comprehensive view of the citizens’ associations with the SDGs.
As far as we know, no previous study on SDG issues based on answers to an open-ended question has been undertaken. The choice of using an open-ended question instead of closed-ended ones with given answer alternatives is based on relevant experiences obtained in earlier research [
20,
21,
22]. One pertinent reason for this option is that the use of closed-ended questions may suffer from some bias, as they may emphasise aspects that are different from what the respondents themselves would have emphasised, if given a choice. Thus, we address this challenge with an open-ended survey question where the respondents can freely formulate their views and motivations in their own words [
23]. The answers to such open questions are heterogeneous and require extensive and thorough analytical work. However, the obvious advantage is that they bring in aspects and perspectives coloured by the respondents’ own framings, and thus provide nuanced and particularly rich data.
In order to answer our research questions, we conducted a national representative survey at the Norwegian Citizen Panel/DIGSSCORE (NCP) through an open-ended question on the understanding of the SDGs.
Our study is first and foremost exploratory. However, given the political focus and awareness campaigns on the SDGs in Norway, we assume to find a generally high knowledge of sustainability and a prevalence of positive connotations related to the SDGs.
The paper continues with a description of our materials and methods, before we present our results from the three approaches introduced above. Then follows a discussion of these considering the posed research questions, and a conclusion focusing on a selection of highlights displayed by the study.
2. Materials and Methods
The materials consist of 4046 answers to an open-ended question, formulated as follows:
What comes to mind when you read or hear the expression ‘UN Sustainability Development Goals?’ This was fielded during the autumn of 2020, through survey round 19 at the Norwegian Citizen Panel/DIGSSCORE (NCP), a representative research-purpose internet panel, with over 6000 active participants. The NCP is an infrastructure for advanced social science data collection and multidisciplinary research at the University of Bergen (
https://digsscore.uib.no (accessed on 23 February 2022)).
The 4046 answers collected in this survey, with a total of 49,803 words, varied both in form and content. Average response length was 12 words, with a median length of 8 words and a mode of 1 word. The longest response contained 238 words. The translations into English, in the present paper, have been kept as close as possible to the Norwegian original. However, in the semi-automated machine analysis undertaken by the structural topic modelling (STM) [
24,
25], the original Norwegian data were used. Thus, the results were also provided in Norwegian. A selection of the most representative answers, as statistically evaluated, was then translated into English for the practical reasons of English language publishing.
The large and heterogeneous dataset provided by the survey was subject to a combination of a quantitative topic analysis, a qualitative discursive content analysis and an analysis of background/demographic variables.
The first step, aiming at investigating topic prevalence, was to profit from recent developments in machine learning based on a quantitative analysis of textual data allowing for an inductive search for distinct topics in the text corpus. Topic modelling through structural topic modelling (STM) generates topics using a clustering algorithm based on the co-occurrence of words across documents and multiple membership is possible; each response is typically estimated by the model to belong to several topics to different degrees.
We define “topic prevalence” as the degree to which a single response belongs to a given topic, based on the words it contains (for more details, [
21]). We estimated our topic model through the STM-package [
24] in the programming language R. This topic model does not include covariates and is thus a correlated topic model [
25,
26]. We chose to run and manually evaluate models from the topic model in the range from six to ten topics, with three runs for each topic. These ranges are in line with lessons drawn from previous studies [
20,
21,
22]. Then follows a process of careful manual reading of all the runs. We evaluated the first model run with eight topics as best. This run corresponded best to the initial impression of the material, was the best expression of the diversity of topics and will be used here for further analysis.
The second step was an in-depth analysis of manual content coding. Even though the machine division in eight topics corresponded well to our general impression of the data, it became obvious that various nuances were not “captured” by the topic model, in particular both positive and negative evaluations of the SDGs. This invited us to study these evaluations through a more in-depth investigation of the answers, as shown in the manual content coding below (see
Section 3.2). As Grundmann [
27] points out, it is often a challenge that quantitative methods such as the STM may overlook linguistic phenomena that are crucial for the creation of meaning. Since our study is an exploratory one, we found it essential to apprehend the content of the data as fully as possible.
The third step was to examine how individuals background characteristics and attitudes were related to the expression of negative or positive sentiments towards SDGs, by drawing on a set of background variables included in the Norwegian Citizens Panel (NCP). Our variables consist of demographic characteristics that have been shown to matter for answers to open-ended questions on issues related to climate change [
21] and to individuals’ political attitudes, which, based on political science research on public attitudes towards international matters and organizations [
19,
28,
29,
30], we expect influence perceptions towards SDGs (see also [
17] about the importance of demographic variables for support of SDGs). The variables are:
Highest level of education: The education variable takes three values: No education/elementary school, Upper secondary education and University/University college. We have recoded this variable to take two values: “Not higher education” and “Higher education”.
Gender: This is a categorical variable with the values Female and Male.
Age: This is a categorical variable measuring age cohort. The variable takes three values: born 1959 or earlier, 1960–1989 and 1990 or later.
Place of living: This is a categorical variable measuring individuals’ place of living at the region level. The variable takes six values: Nord-Norge (northern Norway), Trøndelag (central Norway), Østlandet (eastern Norway), Oslo (the capital), Vestlandet (western Norway) and Sørlandet (southern Norway).
Party preference: A categorical variable asking which political party citizens would vote for if there was an election tomorrow. The variable takes 12 values: The Conservative Party, The Progress Party, the Green Party, the Liberal Party, the Socialist Left Party, the Red Party, the Labour Party, the Centre Party, the Christian Democrats, other parties, would not vote, would cast a blank vote and not entitled to vote.
We include the party preference variable as a
proxy for individual’s political attitudes along a socio-economic left-right axis and the GAL-TAN scale, which contrast green, alternative and liberal (GAL) values with traditional, authoritarian and nationalist (TAN) values [
29,
31] on contemporary issues such as immigration, gender equality, ecological concerns, and national sovereignty [
19].
To locate Norwegian citizens preferences on the two attitude dimensions a brief summary of the parties’ positions on the left-right and GAL-TAN scale follows. On the left-right scale, the Red Party, the Socialist Left Party, and the Labour Party are identified as left-wing parties, with the Red Party furthest to left and the social democratic Labour party closest to the centre. The Centre Party, the Christian Democrats and the Liberal Party are commonly identified as centrist parties. In contemporary Norwegian politics the Centre Party is left-leaning, while the Christian Democrats and the Liberal Party is right-leaning (The Liberal Party joined Erna Solberg’s conservative coalition government in 2018 and the Christian Democratic Party joined in 2019. The Conservative coalition government was replaced by a centre-left coalition government consisting of the Labour Party and the Centre Party after the general elections in 2021). The Conservative Party and The Progress Party are identified as right-wing parties, with the Progress Party furthest to the right [
32].
While no readily available measures exist that locate Norwegian parties on the GAL-TAN scale, we are confident in locating the Progress Party, which is commonly defined as a right-wing populist party [
33,
34], as a party expressing TAN-values. In terms of national sovereignty values, the PopuList [
35] classifies the Progress Party, the Centre Party, the Red Party, the Socialist Left and the Christian Democrats as Euroskeptic parties. On environmental and climate issues, the Green Party, the Socialist Left Party, and the Liberal Party are commonly regarded as “green parties”, while the Labour Party, the Conservative Party and the Progress Party have been identified as “reluctant to accept policies that were critical of economic and industrial growth” [
36].
3. Results
In this section we present the results of the three different analytical approaches undertaken: structural topic modelling (
Section 3.1), manual content coding analysis (
Section 3.2), and analysis of demographic variables related to the responses of the public (
Section 3.3).
3.1. Structural Topic Analysis
The structural topic model (STM) analysis [
24,
25] of our data of answers to the open-ended question resulted in a division of eight topics, as shown in
Table 1. The labels given to each topic are provided after our manual reading of the most representative answers.
First, through the topic prevalence, we observe that the topics are (remarkably) evenly distributed, with “Fight against poverty” as the most prevalent one. Second, we see that Topics 1, 5, 6, 7 and 8 are directly related to various SDGs. Topic 2 concerns attitudes/sentiments, Topic 3 difficulty of understanding and Topic 4 awareness of lack of knowledge. For illustrative purposes we give some examples of each topic below, selected among the 15 most representative answers (the translations into English have been kept as close as possible to the Norwegian original):
- Topic 1:
“The UN sustainability development goals constitute the world’s common work plan for eradicating poverty, fighting inequality and stopping climate change within 2030.”
- Topic 2:
“Goals for politicians that do not necessarily lead to great changes. Pin that Norwegian politicians use without any importance.”
- Topic 3:
“The UN sustainability development goals, I do not manage to understand them, have not understood what they mean, very unclear.”
- Topic 4:
“I have heard/read the expression but cannot recall what it means. Have never thought about it, but think it is something important for the future.”
“We should get an explanation of what this word «sustainability»—that is used all the time—means.”
- Topic 5:
“UN’s goals for a sustainable world, with exploitation of local resources in a good way and a good distribution of resources among all the populations of the earth.”
- Topic 6:
“Climate neutral less garbage less travel less consumption less oil green energy charity”
- Topic 7:
“Climate, environment, disarmament, human rights, democracy, freedom of speech”
“Climate and environment conditions, population growth, health and welfare, food distribution, war/peace etc. All points apply on a global basis”
- Topic 8:
“Take care of the resources of the world. Hand over to the next generation in a state at least as good as now.”
We observe that the answers often include content words that go beyond the more or less strict topic labels. This is seen clearly for topic 1 “Fight against poverty”, where other goals than “poverty” may be mentioned, such as “inequality” and “climate change” in the above example. A similar observation holds for topic 7 “Climate/environment in a global perspective” where other goals are often mentioned, as can be seen from the example above (mentioning “disarmament, human rights, democracy, freedom of speech”). The reason why specific content words are interpreted as the most prevalent seems to be the frequency of these specific words. Through frequency analysis we found that “poverty” (‘fattig*’) was represented 562 times in the full corpus, and climate/environment (‘klima/miljø’) was represented 928 and 842 times respectively, while “inequality” (‘ulikhet’), for example, was represented only 136 times. It is thus not surprising that “poverty” and “climate/environment” are interpreted as specific prevalent topics.
3.2. Manual Content Coding
In order to develop the data analysis, we included the in-depth content analysis (as mentioned above) which proved to display distinctions that did not emerge in the topic analysis and that contribute to a comprehensive view of people’s associations with SDGs. The different codes (proposed according to our exploratory focus), their frequency and distribution are shown in
Table 2.
In the right column, we have indicated how the content codes correspond to and/or complement the automatic topic analysis. We note that codes 5 and 6, negative/positive view on SDGs, complement the topics listed by the machine. There are also noteworthy differences of frequency among the eight categories, which we return to below.
The first category, List, comprises by far the most frequent answers (59%) where respondents enumerate one or several of the 17 particular SDGs, without any further comments, such as in the following examples:
“Common effort for climate, fighting poverty and inequalities in society.”
“Practice/method for an improved situation for people in the world. Less poverty and inequalities. Counteract the climate threat.”
This category thus corresponds to the topics 1, 6, 7 and 8 in
Table 1. Unsurprisingly, List is the dominant category (covers 2390 of the 4046 answers). When asked about what they think of when reading or hearing the expression ‘UN SDGs’, we observe that the respondents choose to enumerate the goals they know or have heard about. As mentioned above, a word frequency analysis showed that the goals related to ‘poverty’ and ‘climate’/’environment’ were the most frequently mentioned, as also illustrated in the examples above.
Category 2, SDG mark/pin (1%), also constitutes a direct answer to the survey question. However, due to its relatively modest presence, it is not surprising that the STM analysis did not qualify it as a separate topic. We note that these answers are often coloured by a negative or even ridiculing tone, as in this example:
“A pin on the lapel of bourgeois men aged 50+ who wish to show that they care!”
Even though it is an infrequent category, it contributes to a comprehensive view of people’s associations with SDGs.
Category 3, SDG as an unknown concept (12%), corresponds to topics 3 and 4 (Unclearness and Lack of knowledge, respectively). Here are a few examples, showing some variation in the answers, from not knowing anything to being uncertain:
“Nothing”/“Don’t know”/“I have no relationship to this.”
“Uncertain, don’t know whether I understand it (…).”
Then category 4, SDGs as Fantasy, not very frequent (2%), corresponds to some extent to topic 2, Misgivings:
“Unattainable”
“Climate change and a lot of fantasy wishes about something that is unrealistic to achieve in the world we are living in now.”
“Impossible to attain, a pipe dream”
Category 7, Resources to be taken care of (5%), corresponds to topic 5, Solidarity with respect to resources; also to some extent to topic 8, Concern for future generations, as illustrated by this answer:
“Take care of resources to ensure that the next generations have the same possibilities as we—reduce personal consumption to hinder pressure on raw materials and pollution”
Category 8, Varia (2%), comprises answers that would not fit into any of the other categories.
Then there are the two remaining categories, 5 and 6, Negative or Positive view on SDGs (10% and 9% respectively), that did not obtain the prevalence of separate topics in the STM analysis, but that we find central in relation to research questions 1 and 3, related to people’s associations with and attitudes towards the SDGs. There is important variation within these two categories, both concerning the degree of negative and positive attitudes and the use of more or less coloured words. Here are some selected examples:
Negative answers:
“Expression of nonsense”
“Senseless empty phrase”
“That word «sustainability» has been used so much and so often that I do not have any opinion of what it means in «UN’s SDGs»”
“Dead tired of the word sustainability—everybody uses the word. It has no impact anymore”
Positive answers:
“Important goals”
“Great”
“Extremely important to the future (…)”
“Think it is very good that different countries cooperate towards a common goal.”
3.3. Demographic Variation of Value-Laden Responses in the Public
To explore the basis of support and opposition towards SDGs we zoom in on the characteristics of individuals that provided value laden responses to the open-ended question: responses that we categorize as positive or negative views on SDGs. This “vocal minority” (approximately 20 percent of the responses) expressed evaluative attitudes towards the SDGs without explicitly being asked to do so. As such, these individuals provide a useful source to understand the basis of support and opposition in the public.
Yet, we also recognize that value laden responses are drawn from a larger set of qualitative categories, and that it is also useful to compare positive and negative views on SDGs to the six other qualitative categories that emerged from our manual coding. In
Table S4 and
Table S5 in the
supplementary information (SI) we therefore provide results from a multinomial logistic (MNL) regression analysis that compare characteristics of individuals that expressed positive and negative views on SDGs, with individuals that expressed answers categorized as List, SDG-pin, Unknown concept, SDGs as fantasy, Resources and Varia. Please note that the SDG mark/pin category consist of very few observations (
n = 27), which limits the usefulness of comparing individuals in this response category to individuals in other response categories. We complement our main analysis of the differences between individuals who expressed positive and negative views on SGDs with the results from the MNL regression analysis as we move along.
Our main analysis followed this procedure: From the 4046 answers we kept the 770 responses that we categorize as negative and positive views on SDGs. (
Table S2 in the
SI provides descriptive statistics for the reduced sample. Compared to the full sample of 4046 respondents, males are overrepresented in the reduced sample). Then, we generated a new binary variable named Positive that takes the value 0 if the response is categorized as negative and the value 1 if the response is categorized as positive. To describe the characteristics of the individuals that provided value-laden responses we use an ordinary least squares (OLS) regression model with negative (0) or positive view (1) as a binary outcome variable and a set of variables that measure citizens background and attitudes: age group (individuals born before 1960 as reference category), gender (female as reference category), level of education (higher education as reference category), the part of the country that the individual lives in (with Nord-Norge (northern Norway) as the reference category as this region is furthest away from the political centre (Oslo) and party preferences (the Progress Party as reference category because we expect individuals whose preferences align with the Progress Party are furthest to right on the left–right scale and also are most in line with TAN-values).
Because there are very few observations on some of the party preference categories in the reduced sample, particularly the Christian Democrats (
n = 18) and the Liberal Party (
n = 23), we are careful to not make too much out of differences between each party category, but rather interpret the overall tendencies that emerge from the party preference differences. In Model 1 in
Table S3 in the
SI we report results from an OLS model that only included the demographic variables (gender, age, education, place of living) to compare the results with the model that also included individuals’ political attitudes. Comparing the results from these two models shows that the demographic differences in value-laden responses are less pronounced when we include individuals’ political preferences.
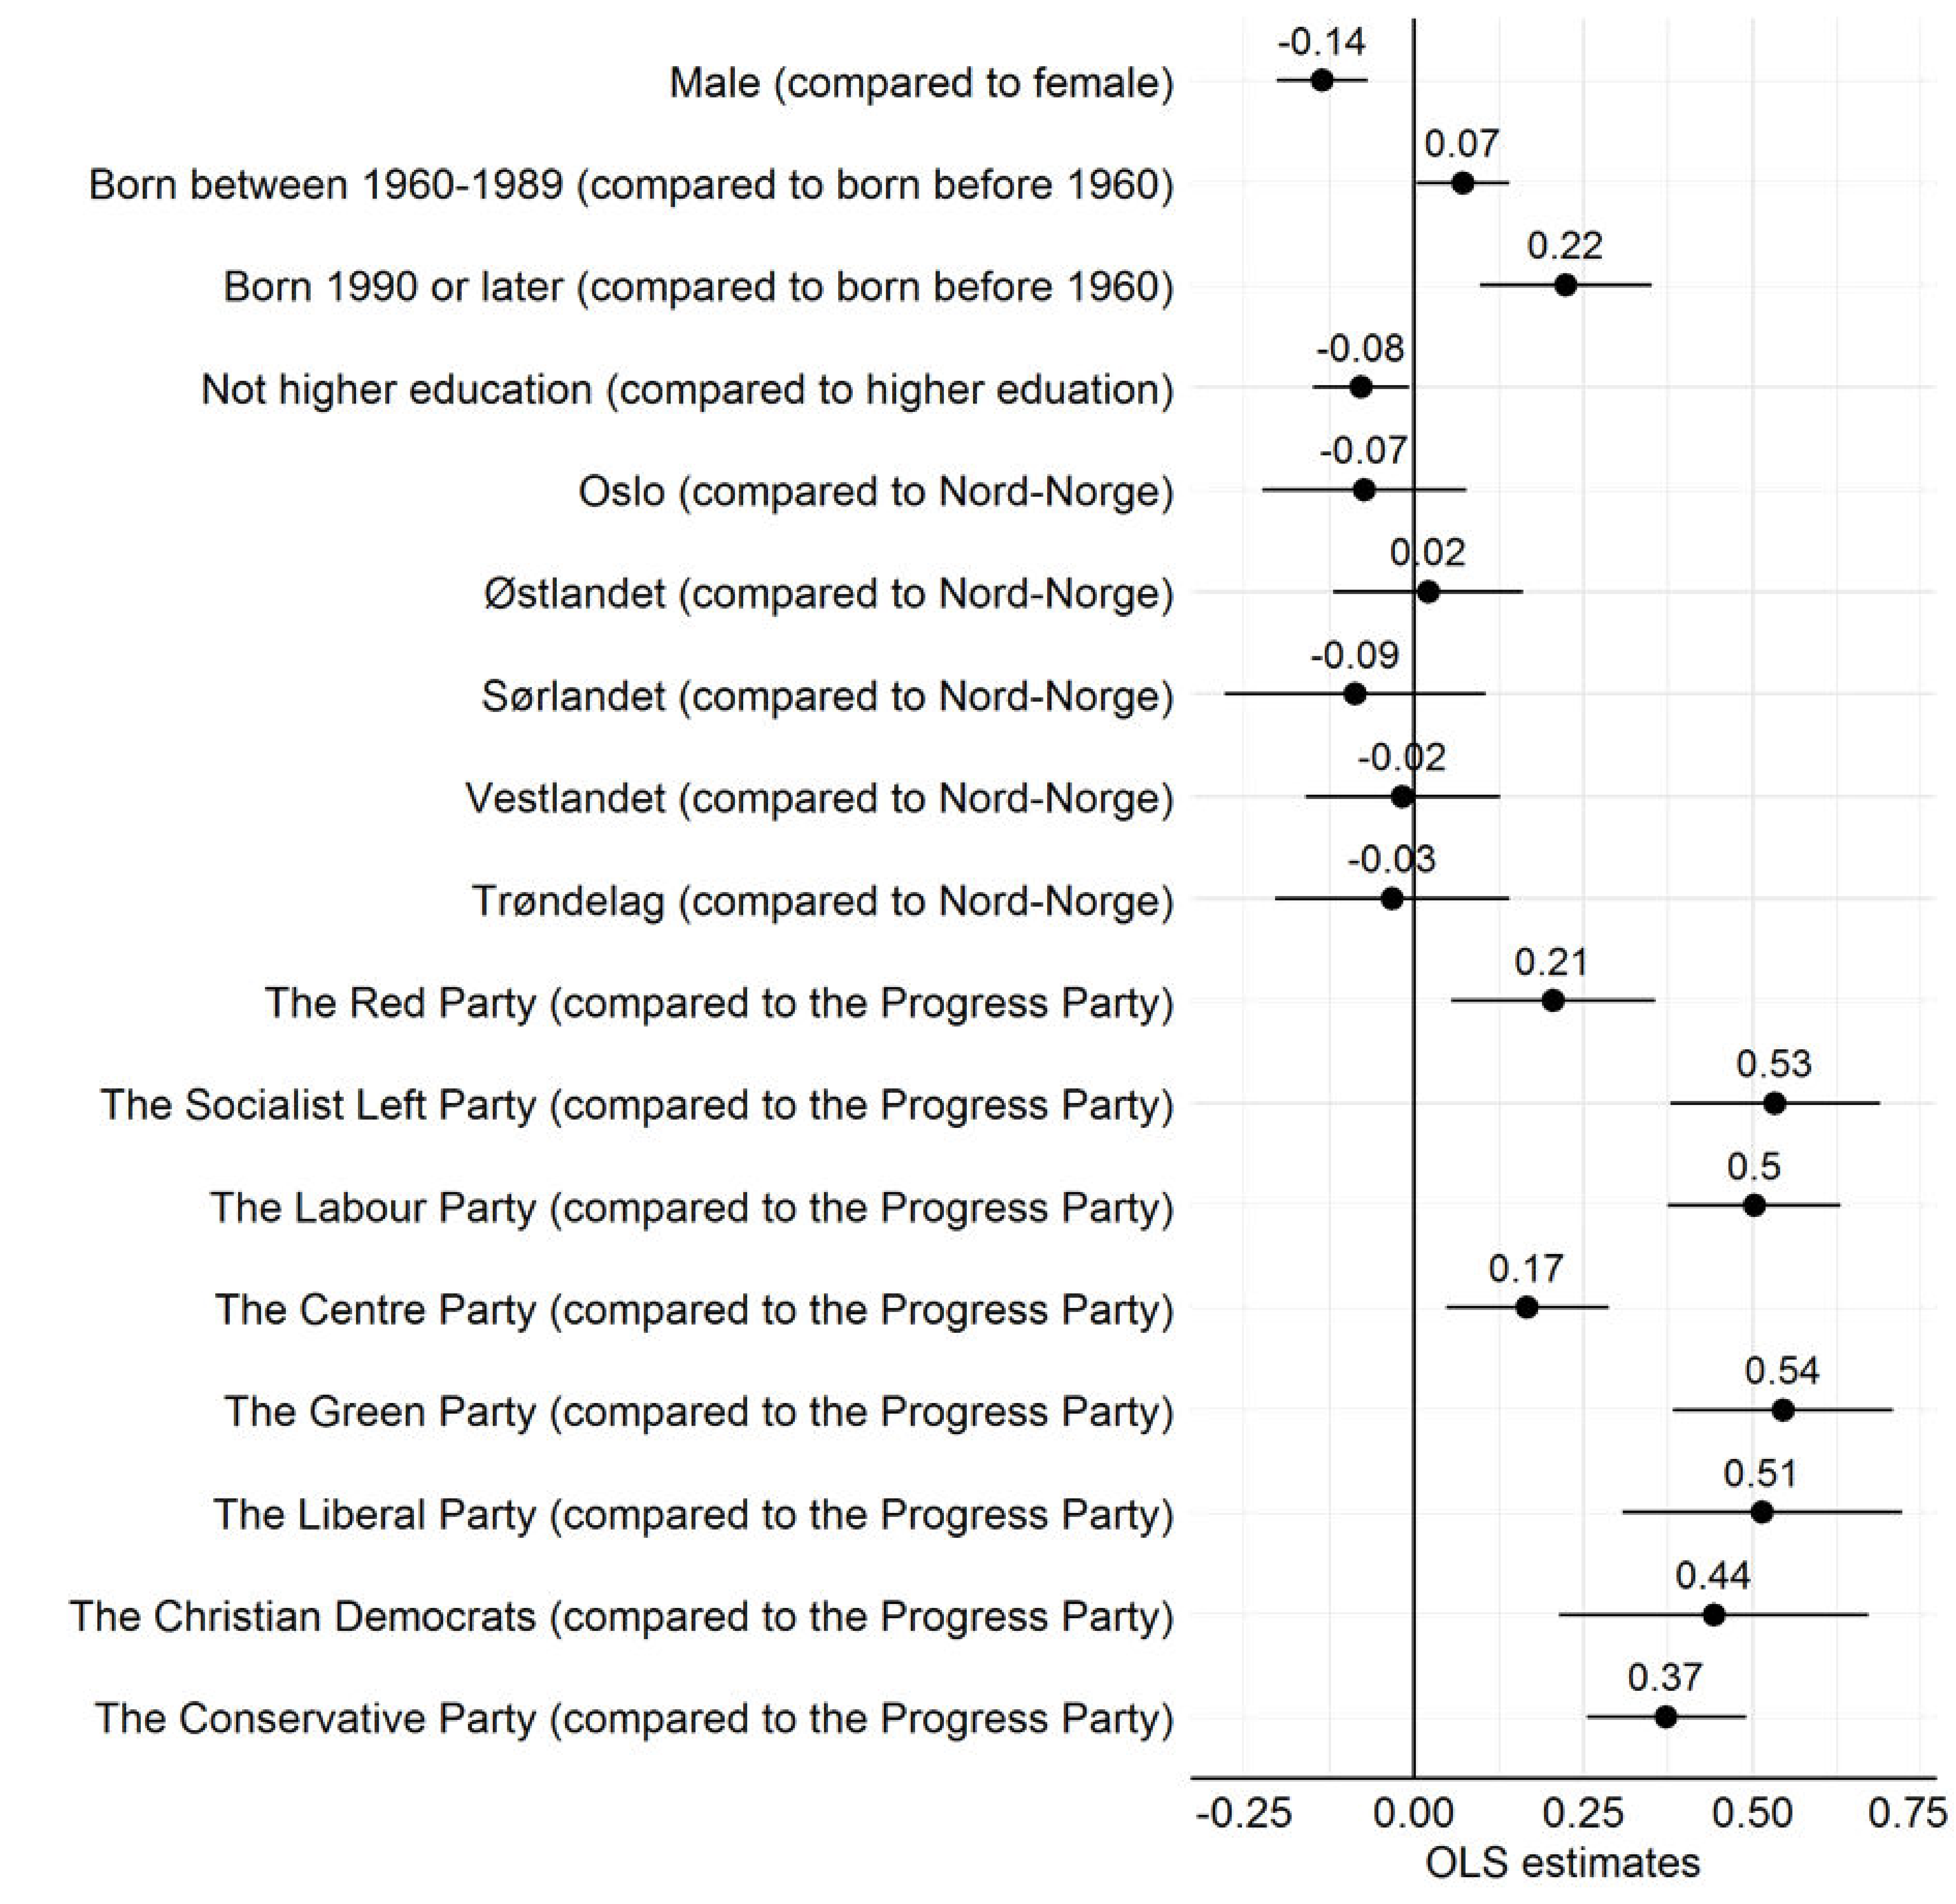
We present the results from our OLS regression graphically in
Figure 1 and refer to Model 2 in
Table S3 in the
SI for the full regression results. Model 3 in
Table S3 in the
SI shows that we obtain substantively similar results when we use a logistic regression model to analyse the same data. The OLS estimates in
Figure 1 shows the difference in the proportion of respondents expressing positive rather than negative views on SDGs between the respective category (e.g., male) and the reference group (e.g., female), while holding the other variables constant.
The results from
Figure 1 provide five main findings. First, compared with female respondents, male respondents are more likely to express a negative than a positive view on SDGs. Approximately 14 percentage points fewer positive than negative responses are written by males. The gender difference is statistically distinguishable from zero. The difference between males and females is also evident in our supplementary analysis where we compare negative and positive views on SDGs to the other response categories. Notably, we find that males are significantly less likely than females to express positive views on SDGs compared with all seven other qualitative categories (See the Male (compared to female) row in
Table S5 in the
SI. The corresponding column in
Table S4 show that males are significantly less likely to write responses classified as List and Unknown compared with positive responses thn females). Taken together, these results suggest that gender is important for understanding attitudes towards SDGs.
Second, younger respondents are more likely to express a positive than a negative view on SDGs than older respondents. Compared with the oldest age group, 22 percentage points more positive than negative responses are written by respondents in the youngest age group and 7 percentage points more positive than negative responses are written by respondents in the middle age group. Both differences are statistically distinguishable from zero. Our supplementary analysis comparing positive and negative views on SDGs to the other qualitative categories shows further age differences. More respondents in the oldest age group express List, Unknown concept, SDGs as fantasy, Resources- and Varia responses than positive responses compared with both respondents in the middle and youngest age groups (See the negative sign on the born 1960–1989 (compared with born earlier than 1960) and born 1990 or later (compared to born earlier than 1960) across all columns (except the SDG-pin-column) in
Table S4 in the
SI. Not all differences are statistically distinguishable from zero).
Third, citizens without higher education are more likely to express a negative view than a positive view on SDGs. Compared with respondents with higher education, approximately 7 percentage points fewer positive than negative responses are written by respondents without higher education. The difference between those without higher education and those with higher education is statistically different from zero. Yet, compared with the gender, age, and party preference differences shown in
Figure 1, the education difference is quite small. Our supplementary analysis comparing positive and negative views on SDGs to the other qualitative categories shows that differences between individuals with and without higher education is greatest when compared with the SDG pin (more individuals with higher education wrote about the SDG pin compared with both positive and negative responses, than individuals without higher education) and the Unknown category (more individuals without higher education wrote about the Unknown category compared with both positive and negative responses, than individuals with higher education).
Fourth, the results in
Figure 1 do not show a clear geographical dimension in respondents’ evaluative views on SDGs. Neither of the five place of living categories are significantly different from zero. Moreover, our supplementary analysis shows that there are very few geographical differences when comparing the other qualitative response categories to positive views (There are two notable exceptions, citizens living in eastern Norway (Østlandet) are less likely to formulate List and Varia responses compared with positive responses, than citizens living in northern Norway (Nord-Norge). See
Table S4 in the
SI). Yet, when we compare the other qualitative categories to negative views, an interesting geographical difference between citizens living in northern Norway (Nord-Norge) and citizens living in the capital (Oslo) emerges in the data. Compared with citizens living in Nord-Norge, citizens from Oslo are less likely to formulate List, SDG pin, Unknown concept, SDGs as fantasy, Resources and Varia responses compared with negative responses (See coefficients for Living in Oslo (compared with northern Norway (Nord-Norge)) in
Table S5 in
SI. We observe a similar pattern for citizens living in eastern Norway (Østlandet)). This finding suggests that those living closest to the political centre are more likely to express negative views than other SDG-associations than those living furthest away from the political centre.
Fifth, there is a clear party preference dimension in respondents’ evaluative responses. Compared with Progress Party voters, voters who prefer any of the other parties are more likely to express positive than negative views on SDGs. All differences are statistically distinguishable from zero. The difference is most pronounced compared with voters preferring the Green Party, the Liberal Party, the Socialist Left Party and the Labour Party, followed by voters preferring the Christian Democrats and the Conservative Party, and least pronounced compared with voters preferring the Red Party and the Centre Party. These results are not consistent with the notion that individuals with different left-right values have different value laden perceptions of SDGs, but rather suggest that people who have different values on the GAL-TAN scale also hold different views on SDGs. The difference in SDG perceptions between voters preferring the Progress Party and voters preferring other parties is also fairly consistent when we compare negative and positive responses to the other qualitative categories in
Tables S4 and S5 in the
SI.
4. Discussion
We will now summarize and discuss the results considering the three research questions (RQ) presented in the introduction. Answers to both RQ1 asking what associations Norwegian citizens have when prompted to freely reflect on the SDGs and RQ2 asking what they know (or do not know) are provided first and foremost through the STM analysis, resulting in eight topics. Among the issues and goals represented by the SDG agenda, the following are identified as the most prevalent: poverty (14%), climate/environment (13%), resources (12%), future generations (12%) and consumption (11%). These results are indicative of a relatively good and proper awareness of what the UN SDGs are about. In the data, we also find lists of many other goals, but they have not been prevalent enough to merit a separate topic. This shows that citizens’ awareness and knowledge of SDGs are concentrated around certain salient goals, and also implies that various SDGs to some extent compete for attention. The Norwegian awareness campaigns seem to have worked to a certain extent. Given that 59% of the respondents in Norway reported some knowledge of the SDGs, as shown by the manual content coding (
Table 2), one could argue a success of these campaigns. However, on the other side, given that Norway is a small and highly educated country, one could also wonder whether it would be reasonable to expect a higher percentage.
Moreover, the STM analysis also displays findings that disturb the awareness image. First, the two topics of Unclearness (13%) and Lack of knowledge (11%) point to both challenges of explaining what the SDGs are and to insufficient communication efforts. However, here it is also relevant to emphasize the complexity of the SDGs and thereby the difficulty of understanding what it is all about. Then there is the topic of Misgivings (12%) that witnesses a manifest feeling of doubt about or reluctance towards the outcome of the SDGs. This result contributes to a questioning of the legitimacy of the goals. The perceptions of legitimacy of the SDGs in Norway are logically connected to the use of SDGs in local and regional governance. Bardal et al. [
10] conducted a survey and interviews with informants in the 356 Norwegian municipality and county councils, pointing at the importance and challenges of guidance for implementation:
“Twenty-eight percent of the respondents from the municipalities thought that lack of guidance from the county councils represented a barrier for implementation to a large or very large degree. Some commented that they were waiting to become part of the county council’s development work and that guidance from the county councils was particularly important for smaller municipalities with few employees dedicated to working with SDG implementation. However, the interviews with the representatives from the county councils suggested that several found it challenging to provide guidance to the municipalities because they were themselves trying to figure out what to do.”
We also know that although the expectations of using the SDGs in local and regional planning are high, the Auditor General in Norway has criticized the lack of a national coordination of the SDGs [
37]. This assessment, to the extent that it is known to the citizens, could have influenced the perception of the SDGs.
Concerning RQ3, asking what attitudes Norwegian citizens have towards the SDGs, it is the findings in the manual content coding that provide relevant answers, particularly through categories 5 (Negative view on SDGs, 10%) and 6 (Positive view on SDGs, 9%). Thus, approximately 20% of the respondents, without referring to specific goals, express clear attitudes towards the SDGs. To the negative view, we can also add the answers in category 4, (SDGs as Fantasy), pointing at the SDGs as something unattainable and unrealistic. Furthermore, there is a touch of negativity in the answers classified in category 2, referring to the SDG pin. This is interesting since politicians and academics use the pin frequently, which may indicate a certain elitist–citizen divide [
19].
These value-laden attitudes, which do not necessarily concern specific goals, mirror to some extent on-going public debates, in particular about the use of the notion of “sustainability”, which through its high frequency in numerous sectors is often regarded as overused or worn out, and also about possible “greenwashing” through the use of “sustainability” in different contexts.
One thing is to establish the existence of different positive and negative attitudes towards the SDGs among the respondents, another is to find out more about the background of the respondents holding such value-laden views. Through different statistical analyses, we found that their attitudes differ quite clearly according to various background variables, in particular with respect to gender, age and political preference, less so with respect to education and geographical situation.
To summarize, we observe that, compared with female respondents, male respondents are more likely to express a negative than a positive view on SDGs; younger respondents are more likely to express a positive than a negative view on SDGs than older respondents; and compared to Progress Party voters (right-wing), voters who prefer any of the other parties are more likely to express positive than negative views on SDGs. Citizens without higher education seem more likely to express a negative view than a positive one; finally, concerning the fifth dimension related to geographical background, the results are inconclusive. However, since one of the findings in this context suggests that those living closest to the political centre are more likely to express negative views than those living furthest away from the political centre, it could be interesting to follow up with a survey on urban versus rural difference (generally, awareness campaigns are more frequent in cities than on the countryside) and to test Dellmuth et al.’s [
19] results on the elite–citizen gap in legitimacy beliefs of international organisations such as the United Nations and the SDGs.
In addition, going beyond the positive–negative comparison, our analysis provided nuanced insights into the characteristics of citizens and their responses to the open-ended question. For instance, we have shown that a gender difference is not only relevant for the positive–negative comparison, but also that males are significantly less likely than females to express positive views on SDGs compared with all seven other qualitative categories (including the awareness-signalling List category and the unaware-signalling Unknown category). This corroborates the impression that females are more likely to emphasize positive aspects of the SDGs than males, but perhaps more interestingly, also illustrates the complexity in the relationship between background characteristics and views on SDGs.
The analysis of our heterogeneous and rich data set has revealed a multitude of associations with and attitudes towards the SDGs that exist among Norwegian citizens. We recognize that this has been possible only through the use of an open-ended question, providing a large and particularly nuanced dataset, stemming from citizens’ freely formulated answers, that are not influenced by answer alternatives commonly set up with closed-ended questions. Another methodological value of the present research is the mix of three different approaches, combining quantitative and qualitative methods, complementing each other and contributing to a comprehensive view of the citizens’ associations with the SDGs. However, we see that there is a need for follow-up studies. For example, it is essential to understand how and where the citizens have acquired the knowledge they possess about sustainability. One way to do this would be to review the SDG courses that are currently available in (higher) education in Norway to then extrapolate how much of our surveyed population have had the opportunity to be “SDG-educated”. As we have seen in previous research (e.g., [
5,
13]), education is primordial, both at lower and higher levels. This type of follow-up studies would also contribute to a better understanding of how and where to increase knowledge and how to reduce misunderstandings and negative perceptions in pursuit of sustainable development.
5. Conclusions
The present study has shown correspondence with earlier studies undertaken on the knowledge about SDGs [
10,
16,
17]. However, through answers to the open-ended question, we have provided new and nuanced data, especially on the public’s attitudes towards the SDGs. In general, our data have shown that the awareness campaigns of the SDGs have been relatively successful in Norway. However, the data have also revealed that the SDGs constitute an unknown concept to 470 (12%) of the 4046 respondents, and that 423 respondents (10%) express a negative, and quite often harsh, attitude towards the goals. Generally, we find that SDG perceptions in Norway are more related to gender, age, and party preference (
Figure 1) than to education level. We believe that these findings, together with the differences with respect to background variables, should be taken into account by politicians, authorities and other stakeholders in their outreach efforts related to the 2030 Agenda, including the SDGs.
Has awareness around the SDGs promoted by government elites and authorities affected the perceptions of the SDGs by Norwegians? For some, notably the 1% of respondents who specifically pointed a negative connotation of wearing the SDG lapel pin, the elite–citizen gap described by Dellmuth et al. [
19] could be vaguely identified.
The rise of the use of the concept “sustainability” in national and international policies warrants a reality check with citizens. We closely examined the open-ended responses of over 4000 diverse citizens in Norway, a rich and highly educated country and one that has fully supported the United Nations Agenda 2030 and the associated SDGs. We can confirm that sustainability is a highly recognized term among Norwegians, but we did not see the expected prevalence of positive connotations in the open-ended questions related to the SDGs. Thus, on the basis of our methods and our understanding of the answers in this exploratory study, we conclude by the following highlights:
4046 answers to open-ended survey question provided rich and nuanced data on SDG associations, showing a good and proper awareness among Norwegian citizens of what the UN SDGs are about.
Their knowledge of SDGs is concentrated around certain salient goals,
“No poverty” and “Climate action” are the goals most frequently mentioned.
12% of Norwegian citizens have no knowledge of the SDGs.
10% of Norwegian citizens consider the SDGs as nonsense.
Our study is limited to one country. Success of the Global Goals, however, is dependent on transformations in many countries in concert. Our insight into citizens’ attitudes in Norway shows mixed feelings about the UN SDGs.Is the great variation in people’s knowledge and understanding of the SDGs, even in a rich, highly educated country with a traditional strong support of the United Nations such as Norway, an impediment to reach the SDGs by 2030? The question is still open.


