
The Causality Analysis of Airports and Regional Economy: Empirical Evidence from Jiangsu Province in China


Abstract
:1. Introduction
2. Literature Review
2.1. Interactions between Aviation and Regional Economy
2.2. Airports Development and Regional Economy in China
2.3. Aims, Objectives and Contributions
- Test the stationarity and cointegration of the economy time series data and airport passenger throughput time series data to determine whether there is a long-term causality relationship in Jiangsu province.
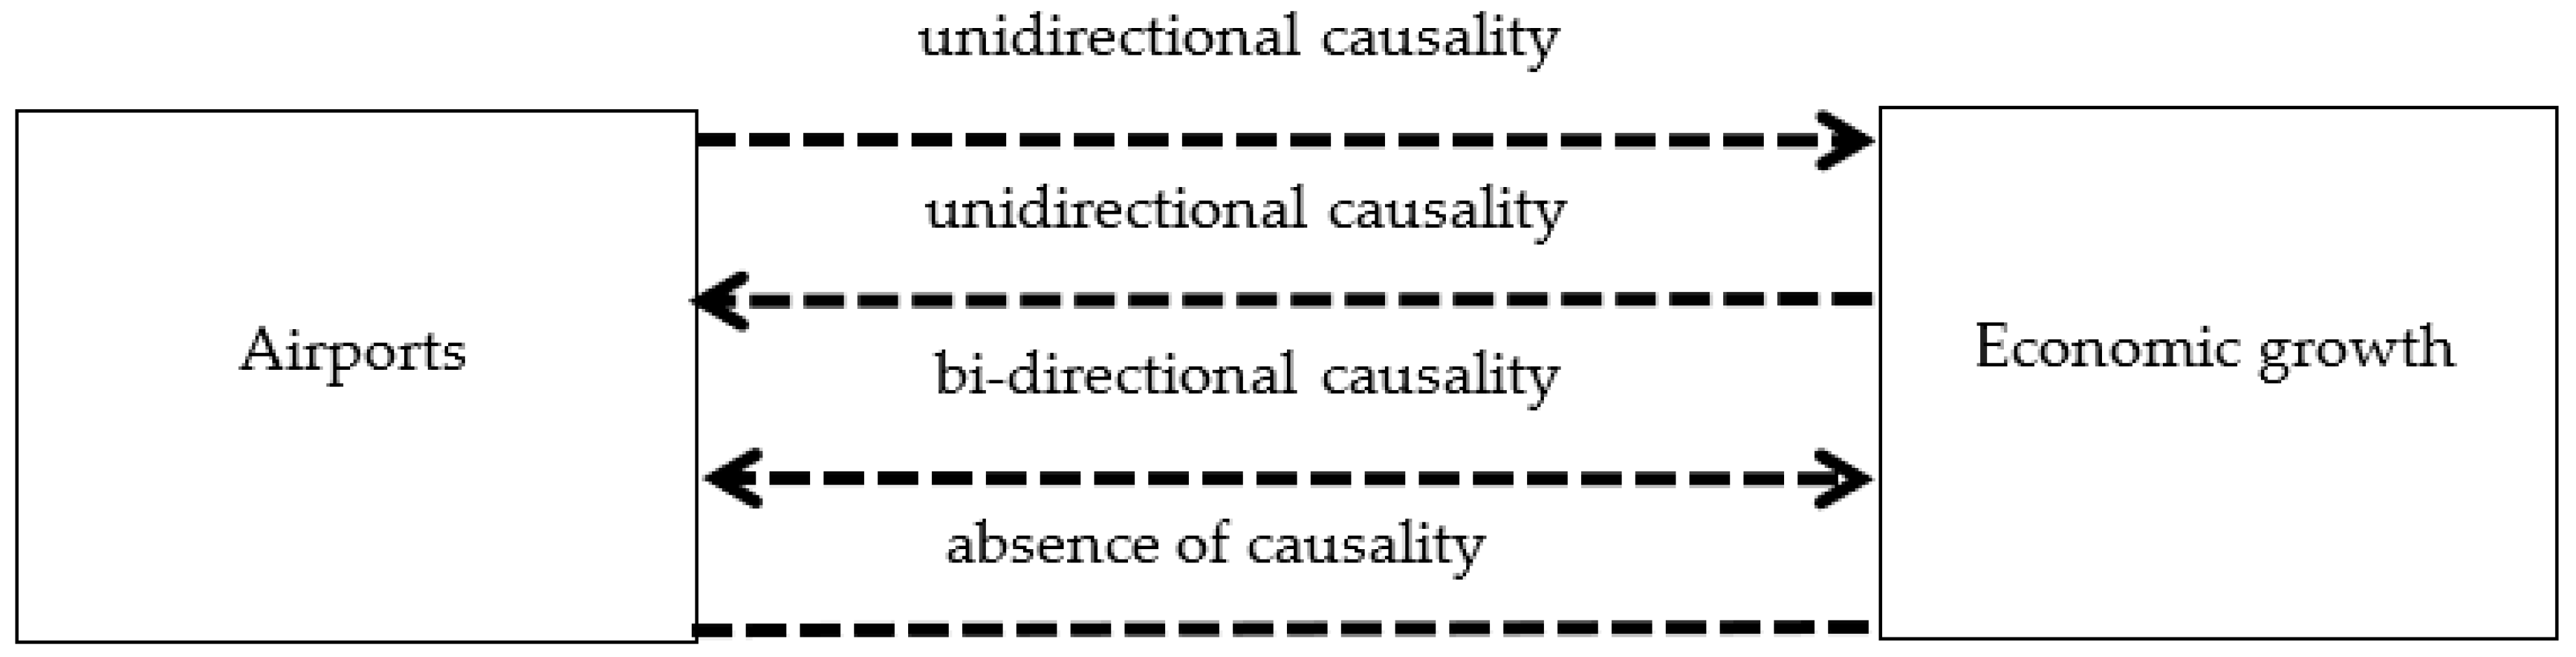
- Test the type of causality between airports development and the regional economy to determine whether there is a correlation over the same period of the study.
- To detect the dynamic reactions between the air passenger volume and regional economy by impulse response and variance decomposition testing.
- It establishes the empirical evidence for determining causal relationships between regional aviation/airports and economic growth in the typical provincial unit in China.
- It also provides evidence and references to the local government for deciding what policies can ensure airports’ viability and improve airports subsidy benefits. Especially in the polycentric urban region, better aviation development policies could realize multiple poles of economic growth.
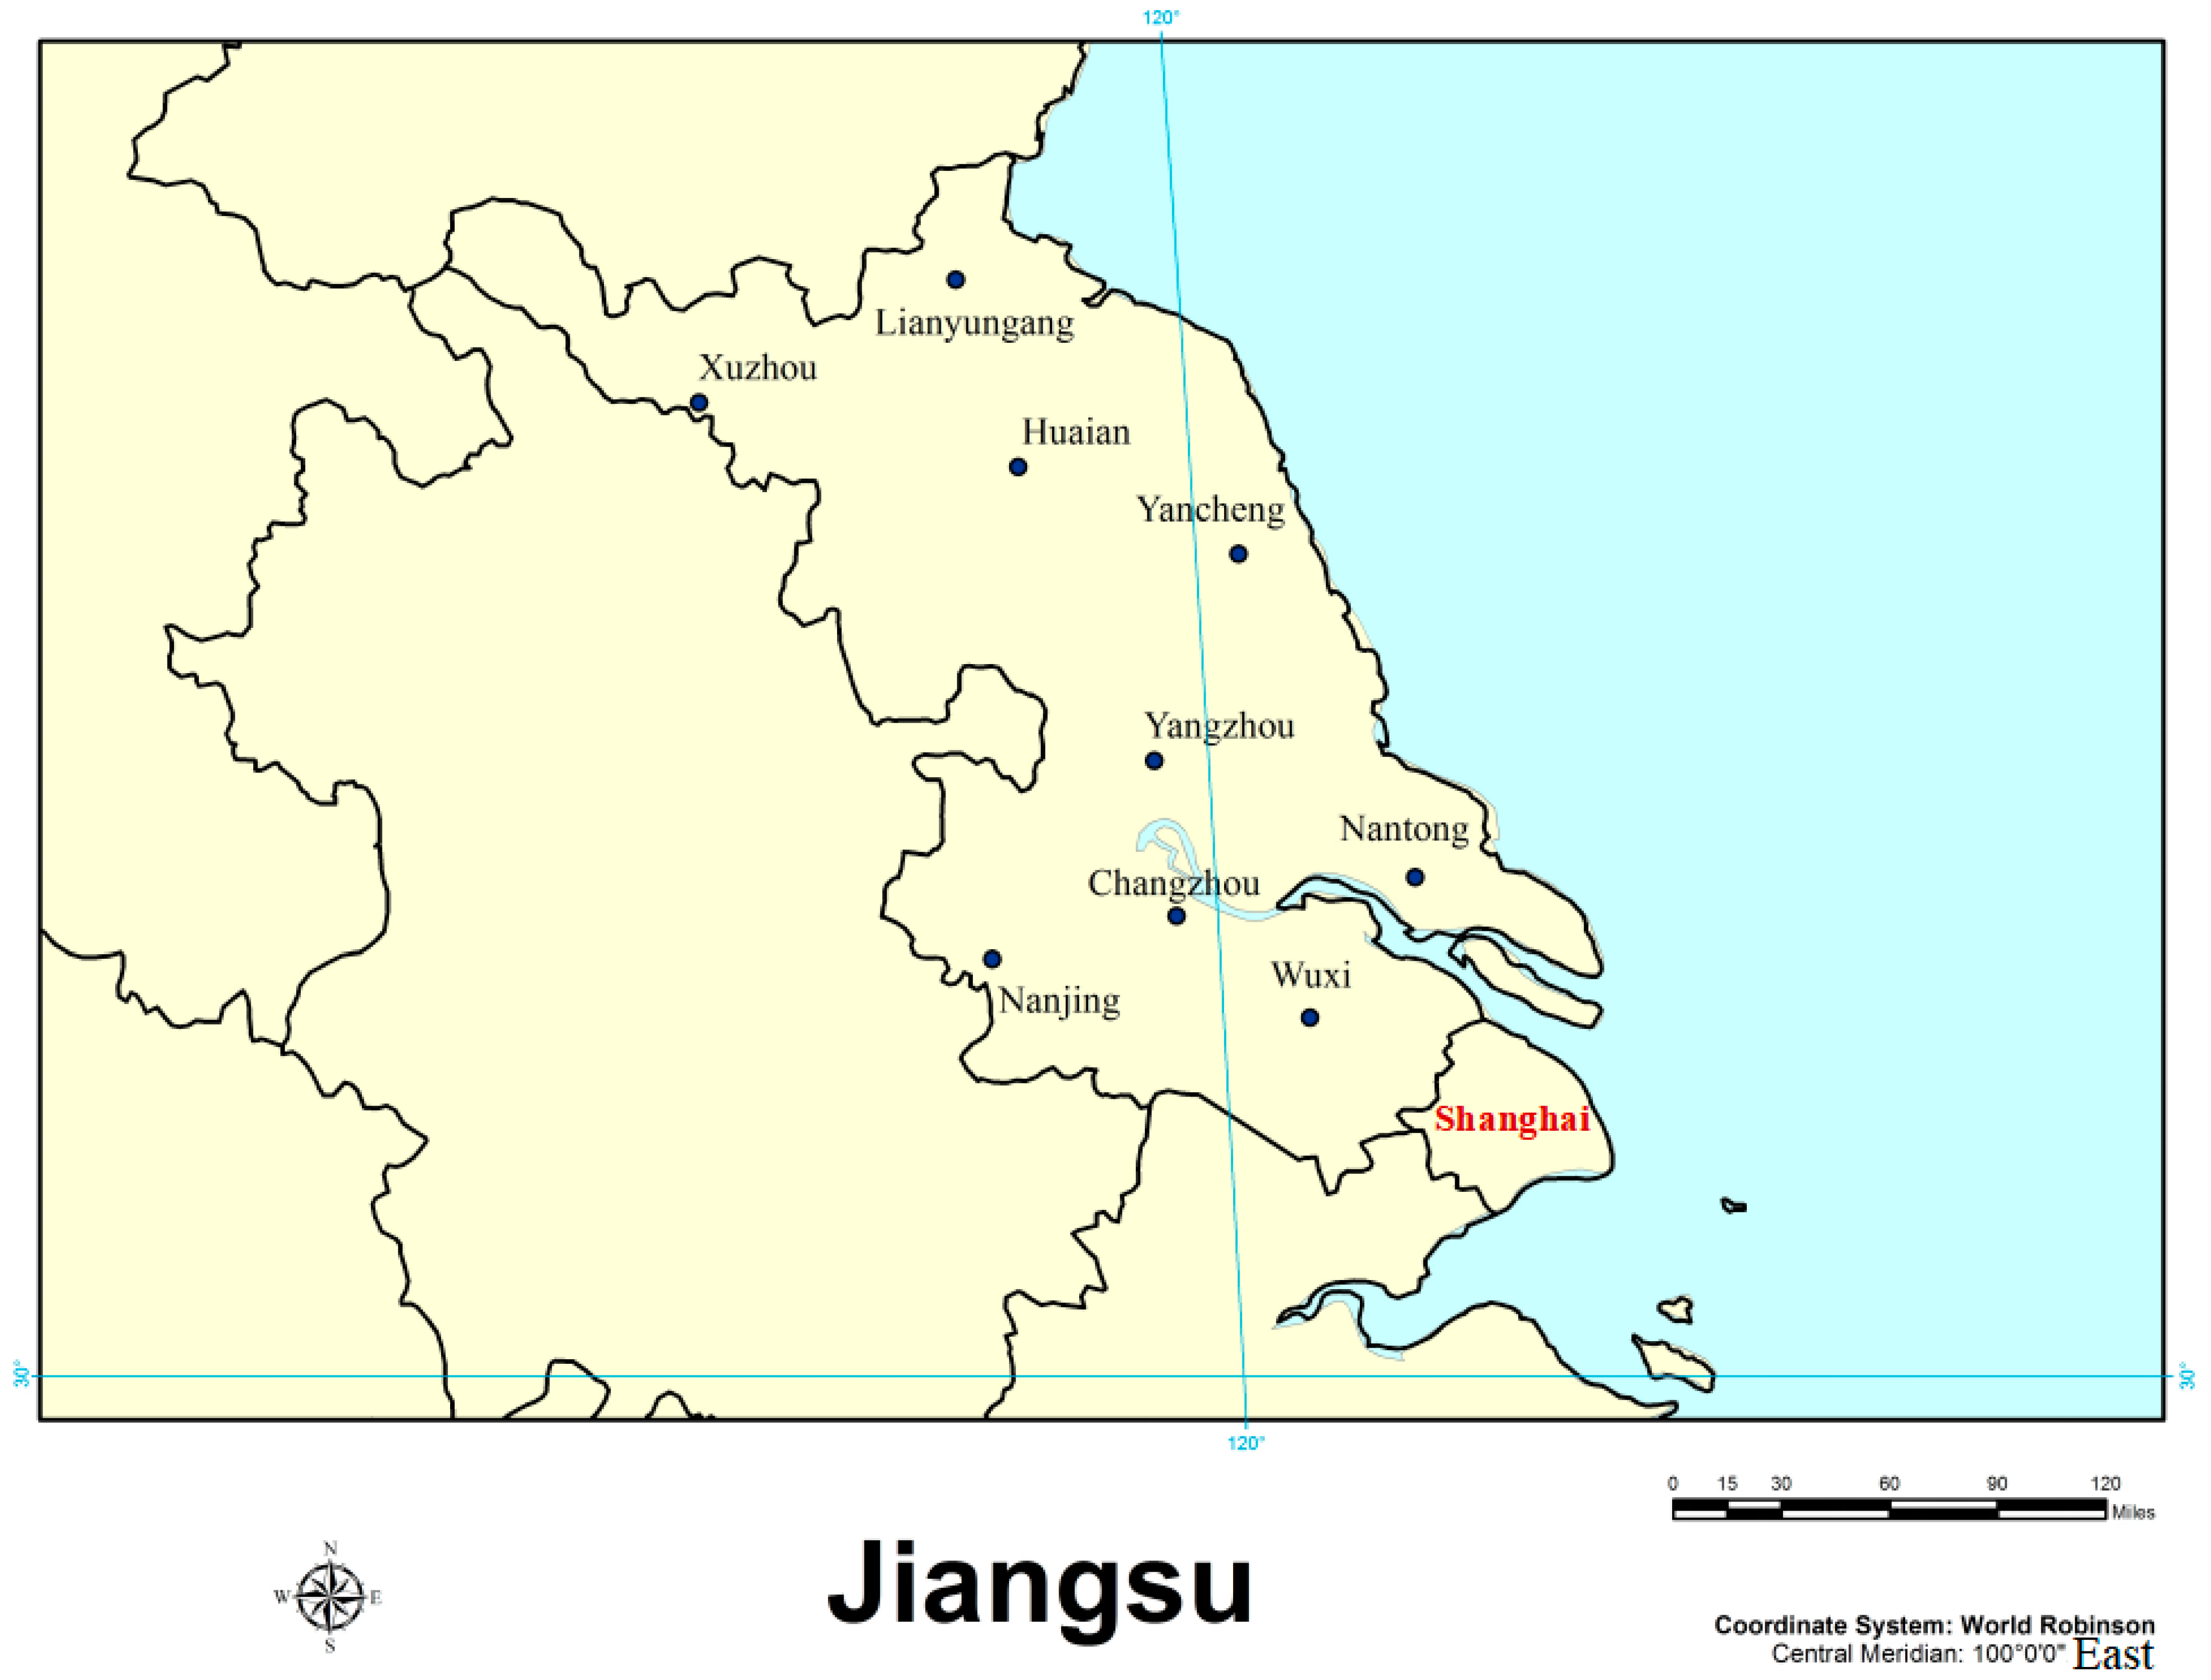
- Jiangsu is the most important province in the Yangtze River delta region. The research results of Jiangsu will give suggestions for economic development strategies to the other provinces for reference.
3. Research Data and Processing
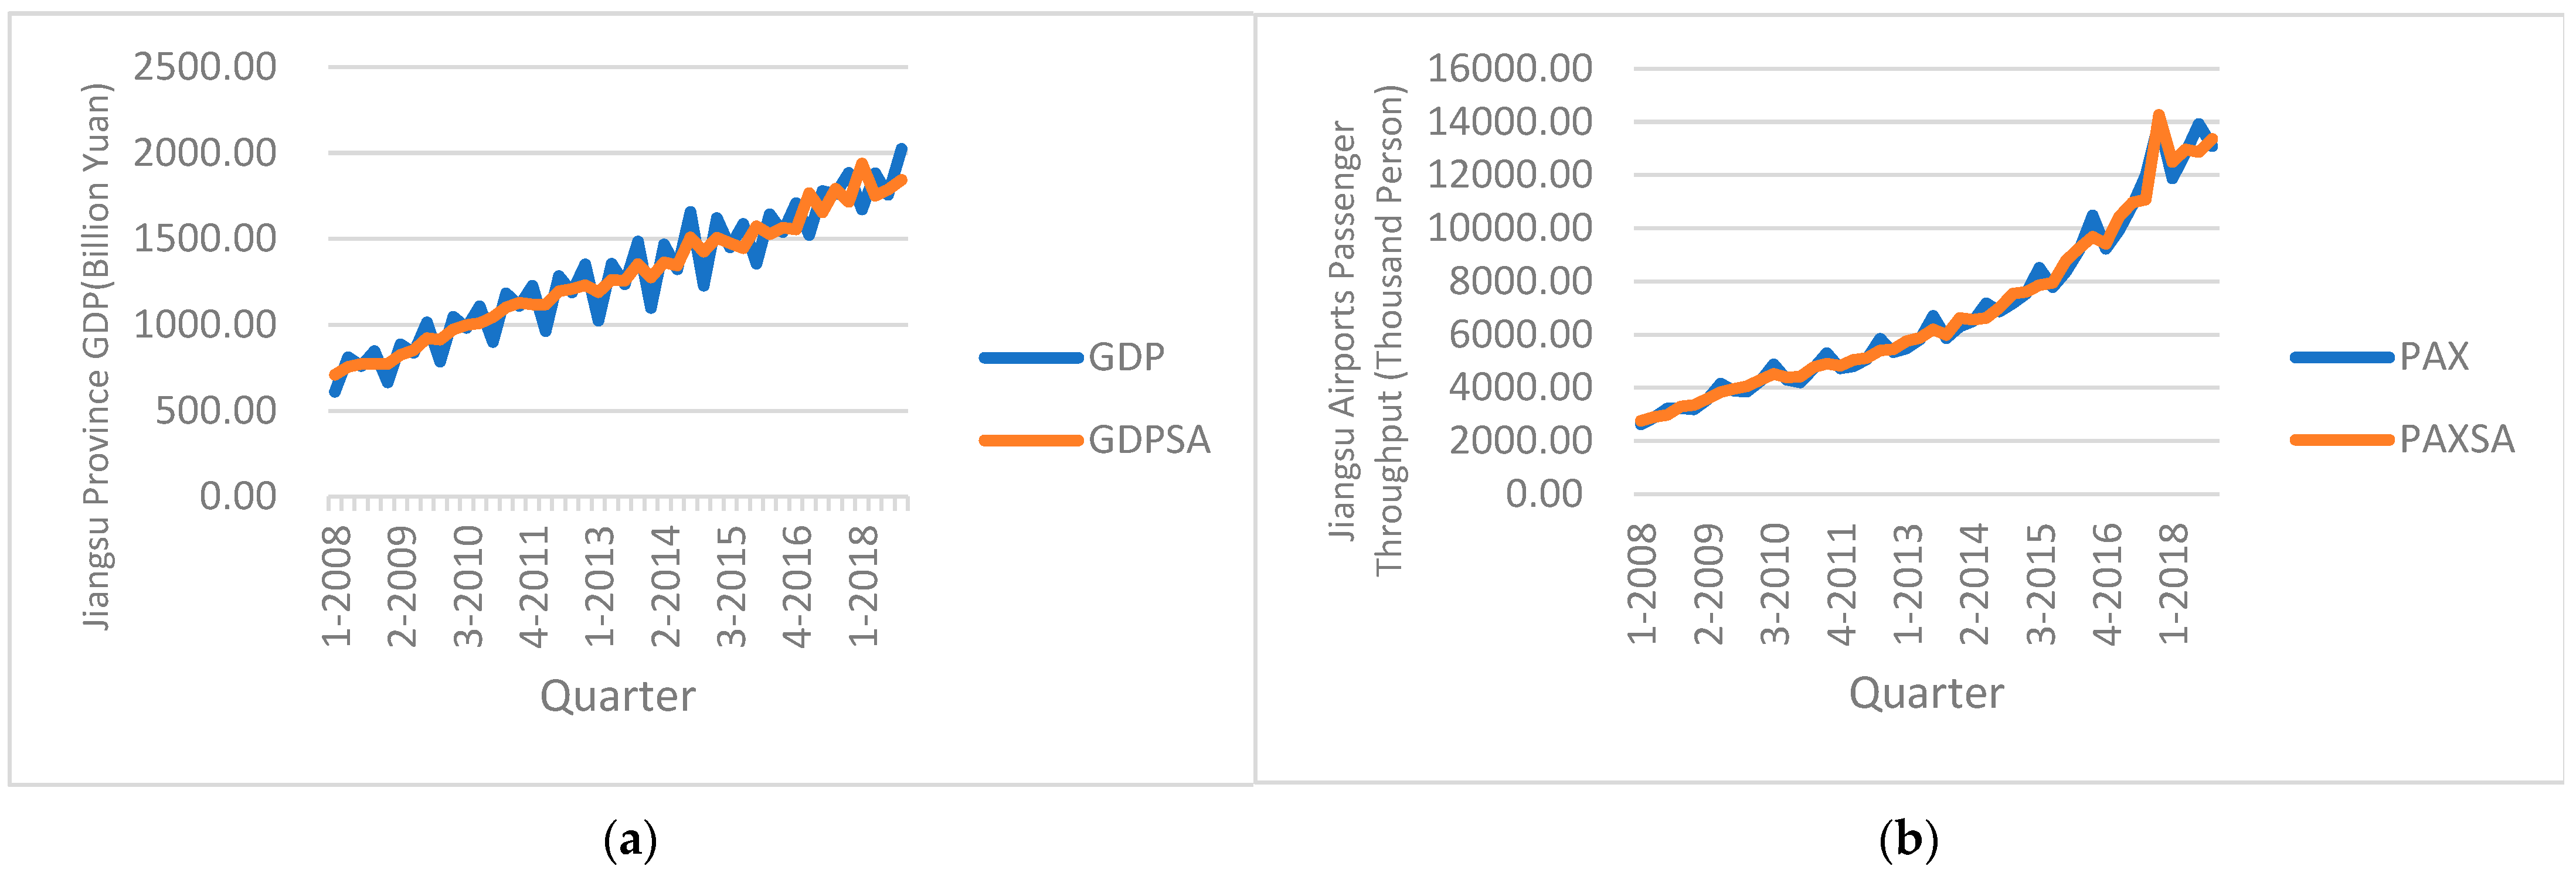
3.1. Research Data and Sources
3.2. Data Processing
3.3. Unit Root Test
4. Model Development
4.1. Vector Autoregression Function (VAR)
4.2. Granger Causality Test
4.3. Impulse Response and Variance Decomposition
- Impulse response
- 2.
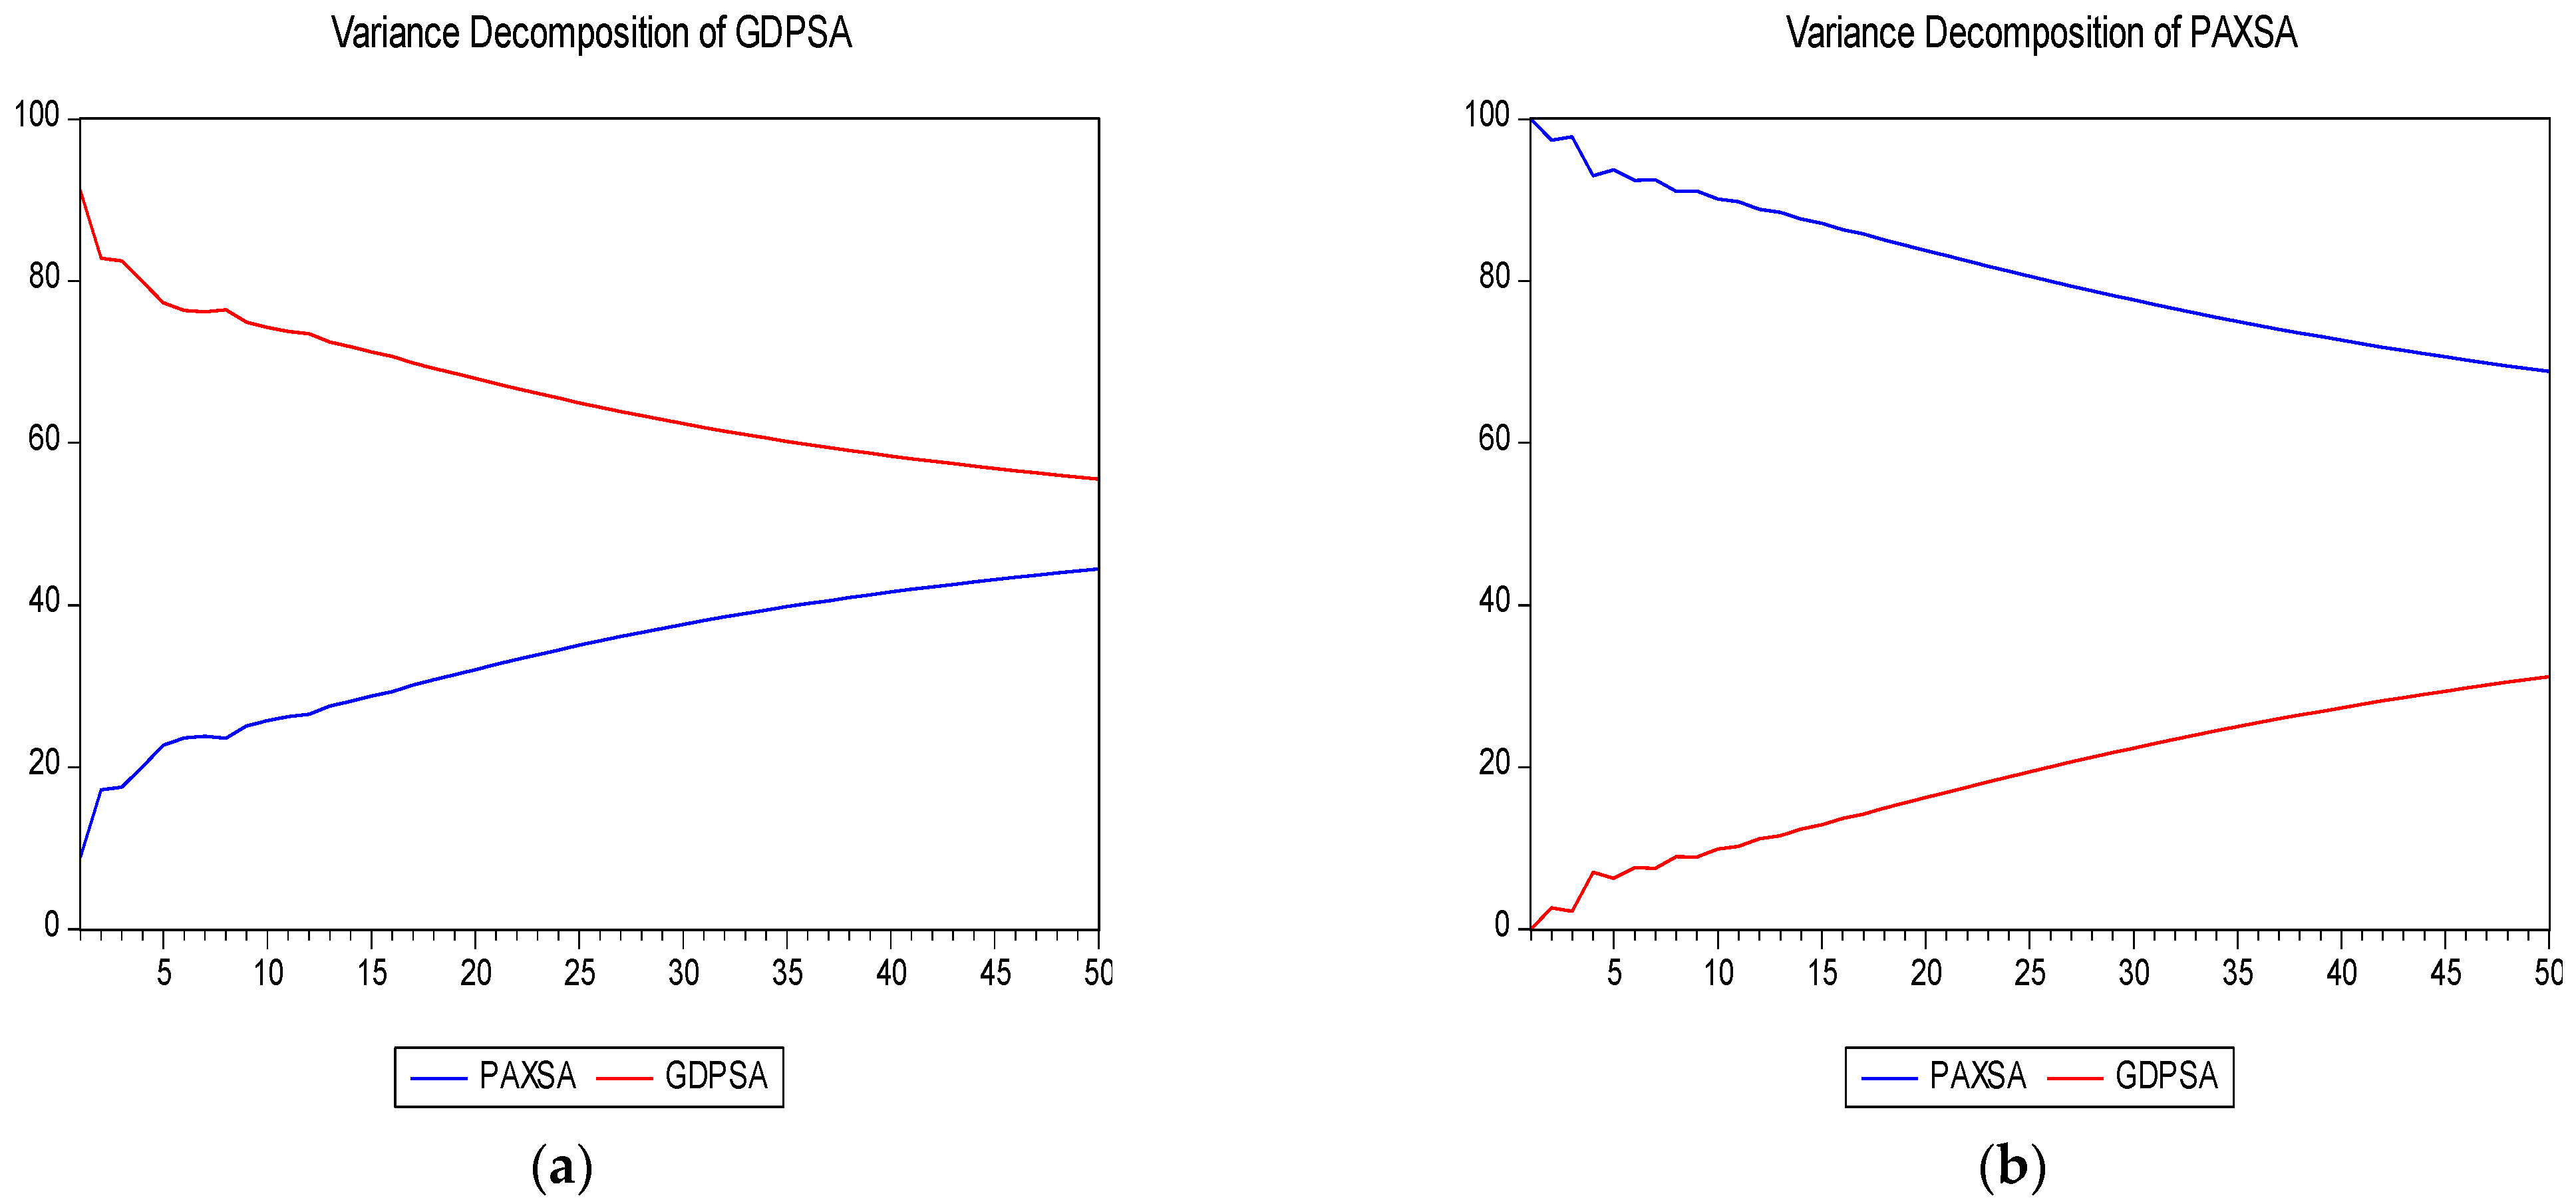
- Variance decomposition
5. Conclusions
Author Contributions
Funding
Institutional Review Board Statement
Informed Consent Statement
Data Availability Statement
Conflicts of Interest
References
- Wu, X.L.; Man, S. Air transportation in China: Temporal and spatial evolution and development forecasts. J. Geogr. Sci. 2018, 10, 1485–1499. [Google Scholar] [CrossRef] [Green Version]
- Allroggen, F.; Malina, R. Do the regional growth effects of air transport differ among airports? J. Air Transp. Manag. 2014, 37, 1–4. [Google Scholar] [CrossRef]
- Percoco, M. Airport activity and local development: Evidence from Italy. Urban Stud. 2010, 47, 2427–2443. [Google Scholar] [CrossRef]
- Brueckner, J.K. Airline Traffic and Urban Economic Development. Urban Stud. 2003, 8, 1455–1469. [Google Scholar] [CrossRef]
- Kasarda, J.D.; Green, J.D. Air cargo as an economic development engine: A note on opportunities and constraints. J. Air Transp. Manag. 2005, 6, 459–462. [Google Scholar] [CrossRef]
- Blonigen, B.A.; Cristea, A.D. Airports and Urban Growth: Evidence from a Quasi-Natural Policy Experiment; National Bureau of Economic Research (NBER): Cambridge, MA, USA, 2012. [Google Scholar]
- Van De Vijver, E.; Derudder, B.; Witlox, F. Exploring causality in trade and air passenger travel relationships: The case of Asia-Pacific 1980–2010. J. Transp. Geogr. 2014, 34, 142–150. [Google Scholar] [CrossRef] [Green Version]
- Richard, F.; Charlotta, M.; Thomas, H. Up in the air: The role of airports for regional economic development. Ann. Reg. Sci. 2015, 54, 197–214. [Google Scholar]
- Baker, D.; Merkert, R.; Kamruzzaman, M. Regional aviation and economic growth: Cointegration and causality analysis in Australia. J. Transp. Geogr. 2015, 43, 140–150. [Google Scholar] [CrossRef]
- Hakim, M.M.; Merkert, R. The causal relationship between air transport and economic growth: Empirical evidence from South Asia. J. Transp. Geogr. 2016, 56, 120–127. [Google Scholar] [CrossRef]
- Yingigba, C.A. Determinants of domestic air travel demand in Nigeria: Cointegration and causality analysis. Geo J. 2019, 84, 1239–1256. [Google Scholar]
- Green, R.K. Airports and economic development. Real Estate Econ. 2007, 35, 91–112. [Google Scholar] [CrossRef]
- Sellner, R.; Nagl, P. Air accessibility and growth-the economic effects of a capacity expansion at Vienna International Airport. J. Air Transp. Manag. 2010, 16, 325–329. [Google Scholar] [CrossRef]
- Mukkala, K.; Tervo, H. Air transportation and regional growth: Which way does the causality run? Environ. Plan. 2013, 45, 1508–1520. [Google Scholar] [CrossRef]
- Hong, J.J. Transport infrastructure and regional economic growth: Evidence from China. Transportation 2011, 38, 737–752. [Google Scholar] [CrossRef]
- Long, J.L.; Shi, P. Study on the relationship between civil aviation transport service and national economic growth in China. Product. Res. 2013, 9, 113–116. [Google Scholar]
- Yang, F. Research on the Influence of Airports on Urban Economic Growth. Master’s Thesis, Shanghai Normal University, Shanghai, China, 2014. [Google Scholar]
- Li, Y.H. Reconfirmation of the relationship between civil aviation transport and economic growth from 2002 to 2012. J. Ind. Tech. Econ. 2015, 6, 10–16. [Google Scholar]
- Shen, H.; Zou, P. The cooperative relationship between civil aviation industry and economic development in China. Res. Econ. Manag. 2016, 12, 98–104. [Google Scholar]
- Hu, Y.; Xiao, J.; Deng, Y.; Xiao, Y.; Wang, S. Domestic air passenger traffic and economic growth in China: Evidence from heterogeneous panel models. J. Air Transp. Manag. 2015, 42, 95–100. [Google Scholar] [CrossRef]
- Lu, L.J.; Li, X.J. Research on the relationship between airspace resources, civil aviation income and national economy. Shanghai J. Econ. 2016, 12, 20–27. [Google Scholar]
- Li, G.D.; Li, X.J. Empirical study on coordinated development of airport industry and national economy in China. J. Civ. Aviat. Univ. China 2016, 5, 56–59. [Google Scholar]
- Ryerson, M.S.; Ge, X. The role of turboprops in China’s growing aviation system. J. Transp. Geogr. 2014, 30, 133–144. [Google Scholar] [CrossRef]
- Transportation Research Board. Airport Economic Impact Methods and Models: A Synthesis of Airport Practice; Airport Cooperative Research Program (ACRP) Synthesis 7: Washington, DC, USA, 2008. [Google Scholar]
- Tianren, Y.; Ying, J.; Yan, L.; Pei, P. Aspirations and realities of polycentric development: Insights from multi-source data into the emerging urban form of Shanghai. Environ. Plan. B 2019, 46, 1264–1280. [Google Scholar]
- Nick, B.; Ivan, T. Central Scotland as a Polycentric Urban Region: Useful Planning Concept or Chimera? Urban Stud. 2002, 38, 697–715. [Google Scholar]


| Economic Impacts | Sources |
|---|---|
| Direct Impact | The direct construction and operation of airports. |
| Indirect Impact | The chain of suppliers of goods and services. |
| Induced Impact | The spending of income by employees created by the direct and indirect effects. |
| Catalytic Impact | The role of airports as a driver of productivity growth and then as an attractor of new firms. |
| Variable | Test Form | PP Test Statistic | 5% Critical Value | Prob. | Conclusions |
|---|---|---|---|---|---|
| GDPSA | Level (No Trend) | −0.3740 | −2.933 | 0.9045 | Accept Hypothesis, non-stationary |
| GDPSA | First difference (No Trend) | −61.9329 | −2.933 | 0.0001 | Refuse Hypothesis, stationary |
| PAXSA | Level (No Trend) | 1.6182 | −2.931 | 0.9994 | Accept Hypothesis, non-stationary |
| PAXSA | First difference (No Trend) | −10.7602 | −2.931 | 0.0000 | Refuse Hypothesis, stationary |
| Lag | LogL | LR | FPE | AIC | SC | HQ |
|---|---|---|---|---|---|---|
| 0 | −618.7136 | NA | 1.03 × 10¹¹ | 31.03568 | 31.12012 | 31.06621 |
| 1 | −535.4174 | 154.0980 | 1.96 × 10⁹ | 27.07087 | 27.32420 | 27.16247 |
| 2 | −519.5074 | 27.84250 | 1.08 × 10⁹ | 26.47537 | 26.89759 * | 26.62803 |
| 3 | −515.1696 | 7.157436 | 1.07 × 10⁹ | 26.45848 | 27.04959 | 26.67220 |
| 4 | −506.9142 | 12.79584 * | 8.71 × 10⁸ * | 26.24571 * | 27.00570 | 26.52050 * |
| PAXSA | GDPSA | PAXSA | GDPSA | ||
|---|---|---|---|---|---|
| GDPSA (-1) | 2.152570 * [1.28129] | 0.105620 [0.67245] | PAXSA (-1) | 0.557930 *** [3.14050] | 0.026976 * [1.62412] |
| GDPSA (-2) | −1.294377 [−0.69824] | 0.357623 ** [2.06344] | PAXSA (-2) | 0.145074 [0.73929] | −0.011172 [−0.60894] |
| GDPSA (-3) | 2.932682 * [1.51387] | −0.039202 [−0.21645] | PAXSA (-3) | 0.329673 * [1.75797] | −0.037794 [−2.15561] |
| GDPSA (-4) | −2.560298 [−1.25295] | 0.513495 ** [2.68784] | PAXSA (-4) | −0.123664 [−0.63563] | 0.028991 * [1.59384] |
| c | 108.0575 [1.8660] | −704.7399 [−1.1378] | |||
| R-squared | 0.98077 | 0.9773 | |||
| Adj. R-squared | 0.97581 | 0.97152 | |||
| F-statistic | 197.67 | 167.29 | |||
| Akaike AIC | 10.799 | 10.934 |
| Null Hypothesis | Lag Order | F-Statistic | Prob. | Conclusions |
|---|---|---|---|---|
| PAXSA does not Granger Cause GDPSA | 1 | 11.0191 | 0.0019 | Rejection Null Hypothesis |
| GDPSA does not Granger Cause PAXSA | 8.96375 | 0.0047 | Rejection Null Hypothesis | |
| PAXSA does not Granger Cause GDPSA | 2 | 2.14138 | 0.1318 | Accept Null Hypothesis |
| GDPSA does not Granger Cause PAXSA | 2.44693 | 0.1004 | Accept Null Hypothesis | |
| PAXSA does not Granger Cause GDPSA | 3 | 2.39876 | 0.0850 | Rejection Null Hypothesis |
| GDPSA does not Granger Cause PAXSA | 2.54990 | 0.0720 | Rejection Null Hypothesis | |
| PAXSA does not Granger Cause GDPSA | 4 | 2.17916 | 0.0946 | Rejection Null Hypothesis |
| GDPSA does not Granger Cause PAXSA | 2.43724 | 0.0679 | Rejection Null Hypothesis | |
| PAXSA does not Granger Cause GDPSA | 5 | 1.80603 | 0.1441 | Accept Null Hypothesis |
| GDPSA does not Granger Cause PAXSA | 2.23480 | 0.0786 | Refuse Null Hypothesis |
Publisher’s Note: MDPI stays neutral with regard to jurisdictional claims in published maps and institutional affiliations. |
© 2022 by the authors. Licensee MDPI, Basel, Switzerland. This article is an open access article distributed under the terms and conditions of the Creative Commons Attribution (CC BY) license (https://creativecommons.org/licenses/by/4.0/).
Share and Cite
Bai, Y.; Wu, C.-L. The Causality Analysis of Airports and Regional Economy: Empirical Evidence from Jiangsu Province in China. Sustainability 2022, 14, 4295. https://doi.org/10.3390/su14074295
Bai Y, Wu C-L. The Causality Analysis of Airports and Regional Economy: Empirical Evidence from Jiangsu Province in China. Sustainability. 2022; 14(7):4295. https://doi.org/10.3390/su14074295
Chicago/Turabian StyleBai, Yang, and Cheng-Lung Wu. 2022. "The Causality Analysis of Airports and Regional Economy: Empirical Evidence from Jiangsu Province in China" Sustainability 14, no. 7: 4295. https://doi.org/10.3390/su14074295
APA StyleBai, Y., & Wu, C.-L. (2022). The Causality Analysis of Airports and Regional Economy: Empirical Evidence from Jiangsu Province in China. Sustainability, 14(7), 4295. https://doi.org/10.3390/su14074295