Article

Characterization of Particulate Matter Species in an Area Impacted by Aggregate and Limestone Mining North of San Antonio, TX, USA

1
School of Earth, Environmental and Marine Sciences, The University of Texas Rio Grande Valley, Brownsville, TX 78520, USA
2
Department of Geosciences, Middle Tennessee State University, Murfreesboro, TN 37132, USA
*
Author to whom correspondence should be addressed.
Sustainability 2022, 14(7), 4288; https://doi.org/10.3390/su14074288
Submission received: 2 March 2022 / Revised: 28 March 2022 / Accepted: 29 March 2022 / Published: 4 April 2022
(This article belongs to the Special Issue Urban Air Pollution: Monitoring, Impact, and Mitigation)

Abstract

:
Aggregate and limestone mining in San Antonio’s Bexar and Comal counties in Texas, USA, has caused considerable health concerns as of late. Aggregate mining actions can result in localized air quality issues in any neighborhood. Furthermore, heavy truck traffic, hauling, and transportation of the mined material contribute to pollution. In this research, PM species were sampled at four locations north of the San Antonio city limits. The data were collected using a TSI Air Quality Sampler that sampled PM1, PM2.5, PM4, PM10, wind speed, wind direction, temperature, and relative humidity. Continuous data with 1 min averages were recorded during the study period from August to September 2019. The instrument was stationed at every location for a period of 7 days each. The four locations were a ranch, an open field, a residential compound, and an elementary school. PM1 and PM2.5 concentration levels were lower compared to PM10 concentrations at all four studied sites. Our results suggest that PM concentrations are primarily impacted by mining activities. PM species were highest at the residential compound due to its proximity to an active mining area, resulting in deleterious health effects for neighbors living in the vicinity of the sampled site.

1. Introduction

Aggregate and limestone mining, albeit beneficial to society, comes at a high environmental cost. Mining locations are typically chosen by taking into consideration the economic costs, thereby impacting the health and well-being of the population living in the immediate vicinity. Excavation procedures, crushing and grinding, heavy truck movement, associated truck and noise increments, and generation of dust are some of the detrimental impacts of this industry [1,2,3,4]. After the excavation and other associated processes, mine tailings can be a blemish in the community, in addition to the fugitive emissions from these tailings due to wind erosion [5].
One of the most rapidly expanding metropolitan areas in the United States is the San Antonio region of Texas (SAR), specifically counties such as Bexar, Comal, Hays, and Travis [6]. Mining operations such as sand, gravel, and crushed stone have taken a foothold in this region in the last few decades. Between San Antonio and Austin, accessible limestone aggregate resources are abundant. Major open-pit mines for limestone aggregate, or “quarries”, have expanded North and West of Highway Interstate -35 (IH-35), also identified as the “quarry row”. Heavy truck traffic transporting the material for aggregate mining also results in vehicular air pollution [7,8].
Air quality concerns in the SAR region relate to an increase in aggregated mining in recent years. Mining is summarized as rock fragmentation during which particulate matter (PM) is emitted. Particles found in the air—dust, smoke, dirt, and soot—are labeled as PM. Inhalation and mobility depend on the size of the particles [9]. Particles less than 2.5µm (PM2.5) travel further into the respiratory system beyond the bronchi where gas exchange occurs [10]. PM2.5 mining contaminants are associated with arsenic (As), mercury (Hg), lead (Pb), and considerable amounts of crystalline silicon dioxide [1,11,12]. Long- and short-term exposure to PM2.5 risks the development of scarred lung tissue (namely silicosis), cardiovascular effects, and other harmful respiratory symptoms [13,14,15]. Additionally, PM smaller than 10µm (PM10) has adverse effects on the respiratory system. PM10 components can contain silica and coal dust, causing silicosis or pneumoconiosis [4,16,17]. Therefore, exposure to such PM species poses serious health concerns and warrants attention.
Hence, to address the pressing issues above, this air pollution study aimed at characterizing particulate matter pollution was conducted in the late summer of 2019 in the Northern San Antonio region. Assessing the differences in particulate matter concentrations between the studied sites and central ambient monitoring sites was another aim of this research endeavor. Additionally, the spatial and temporal variation in PM pollution was studied in this research.

2. Materials and Methods
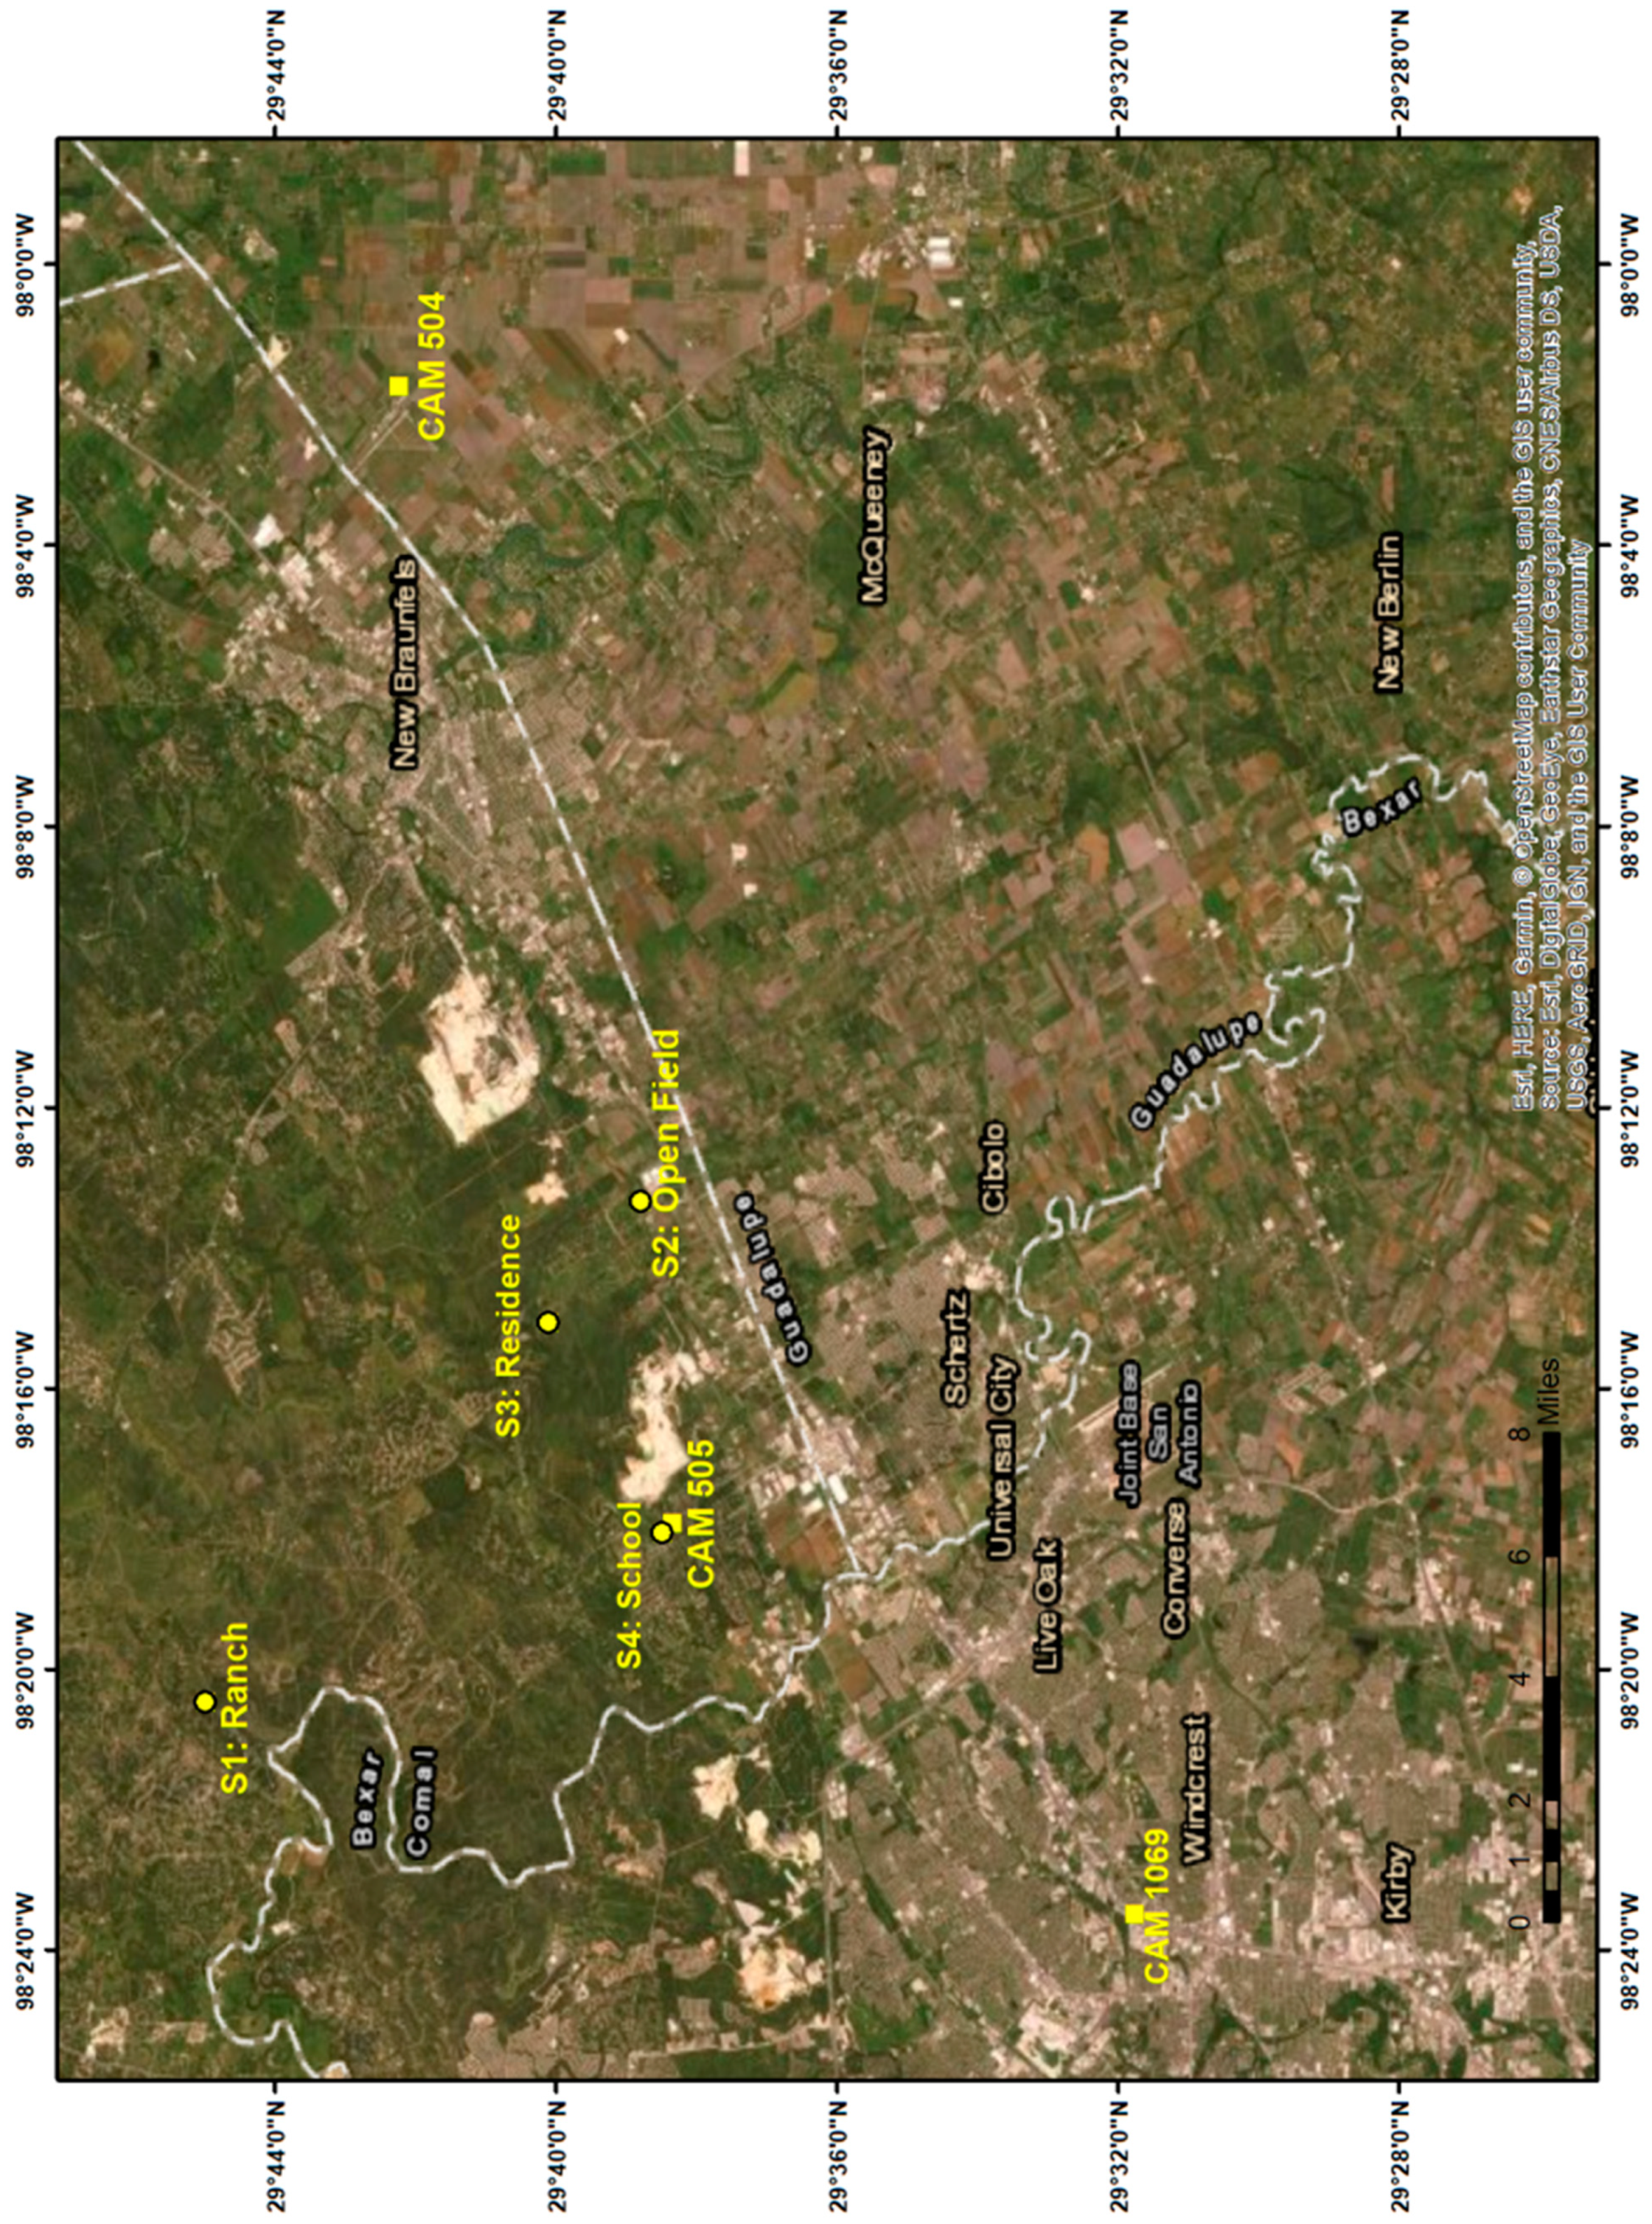
2.1. Site Selection

PM species were sampled at four locations north of San Antonio (S1, S2, S3, and S4). These locations were a ranch, an open field, a residential compound, and an elementary school in order to assess the pollutant concentration gradient in different environments. S1 was located on a ranch surrounded by a forest. S2 was located in an open field and about 43 m from a residential house. S3 was in a residential compound. A mining site was located east of site S3. Site S4 was situated at an elementary school adjacent to a major road: FM 3009. Quarrying and mining activities occurred adjacent to site S4 during the sampling period. Coordinates of each studied air site and Texas Commission on Environmental Quality (TCEQ) continuous air monitoring sites (CAMS) are detailed in Table 1 and illustrated in Figure 1. The following locations are located across San Antonio counties along IH-35, thereby a quintessential area to perform an in-depth air quality analysis characterizing ambient PM species.

2.2. Topography and Meteorology

Northwest of the Edwards Plateau and southeast of the Gulf Coastal Plains, San Antonio is located in south-central Texas. Bexar County experiences a warm semitropical climate with muggy air [18]. Weather patterns exhibit hot summers with a couple of winter days experiencing below-freezing temperatures. The city is approximately 214 m above sea level and situated 225 km from the Gulf of Mexico. The proximity to an ocean basin introduces tropical storms to the area. Rainfall is most common during May and September, coupled with southeast winds [18]. Wind patterns prevailing during the study are demonstrated for the duration of each studied air site and CAMS 1069, with greatest wind speed frequency measured between 0.5 and 2.1 m/s (Figure 2).

2.3. Sampling Methods

Real-time air monitoring was administered with TSI DustTrak Environmental Monitor [19]. The instrument set-up is shown in Figure 3 during data collection in S1 (the ranch). Continuous data of 1 min averages were collected throughout the entire study period from August to September 2019. The instrument was stationed at every location: the ranch, an open field, a residential compound, and an elementary school for a period of 7 days each. The instrument also simultaneously measured concentrations of PM1, PM2.5, PM4, PM10, wind speed, wind direction, temperature, and relative humidity.
Outdoor measurements at each air site were compared to TCEQ CAMS sites in the San Antonio region. Primarily, this study used logged data concentrations from CAMS site C1069 in Bexar County due to its position off the major highway IH-35. CAMS site C504 was positioned in an open field in Comal County, and C505 was posted directly across S4 in Guadalupe County. All CAMS site parameters are described in Table 2. Specifically, the parameters at C1069 involved the monitoring of PM2.5 and resultant wind speed (RWS). Therefore, C1069 was used to compare against the logged PM and wind speed information from the TSI air monitor at all four sites. The study duration at S1 started at 2:45 pm on 3 August and ended at 2:40 pm on 10 August. The study at air site S2 started at 2:45 pm on 17 August until 2:45 pm on 24 August. S3 ensued from 3:15 pm on 24 August till 1:20 pm on 30 August. Lastly, S4 began at 2:15 pm on 30 August and concluded at 12 pm on 11 September (Table 3).

2.4. Statistical Data Analysis

The resulting descriptive statistics were processed in SPSS 25.0 for Windows (SPPS, Inc., Chicago, IL, USA), Microsoft Excel, and R programming software. WRPLOT ViewTM software was configured to produce wind roses. Boxplots were plotted to assess the spatial pattern of the PM species across the various sites and CAMS 1069. Time series were plotted to characterize PM concentrations from TSI DustTrak Environmental Monitor. Statistical significance was indicated as p < 0.05. Spearman’s Rho correlations were computed to signify site-specific temporal relationships with PM pollutant correlations at every air site. The Coefficient of Divergence (COD) was calculated to understand the spatial variation in PM levels between CAMS 1069 and the four sampled sites. COD specifies uniformity between two simultaneously sampled sites and is outlined as
C O D j , k = 1 p i 1 p [ x i j x i , k x i j + x i , k ] 2
where xij is the ith concentration measured at site j over the sampling period; j and k are two simultaneously samples sites; and p is the number of observations [20,21,22]. A low COD value of ˂ 0.20 denotes similar pollutant concentrations between two sites, whereas a value approaching unity indicates a significant difference in the absolute concentrations and subsequent spatial non-uniformity between the two sites.

3. Results

3.1. 1-h and 24-h PM Concentration Analyses

Temporal variations and descriptive statistics of ambient PM species PM1, PM2.5, PM4, PM10, and total mass concentration at the four air sites in San Antonio are presented as hourly concentrations in Table 4 and Figure 4. Additional statistics that involve correlations or comparisons to the CAMS sites are shown in Figure 5, and Table 5 and Table 6.
Collectively, PM1 and PM2.5 levels were low at all four sites in contrast to the PM4 and PM10 levels. Therefore, PM concentrations in Bexar and Comal Counties are primarily impacted by mining activities. For instance, the seven-day average for PM2.5 was about 8.6 µg/m3 at the ranch, and PM10 values were around 15.8 µg/m3. PM species were highest at the residential compound (S3), with mean values of PM1 18.67 µg/m3, PM2.5 19.70 µg/m3, PM4 20.52 µg/m3, and PM10 23.06 µg/m3. This could be attributed to the close proximity that S1 had to an active mining area. The lowest PM variant concentrations was at the ranch surrounded by a medium-growth forest.
The time series in Figure 4 conveys the patterns for hourly PM species and total mass concentration fractions (µg/m3) for each sampled site. The dates are labeled appropriately on each time series to directly portray the temporal variations. The resulting time series aid in understanding the temporal pattern during the sampled period. Ambient data were collected by TSI DustTrak Environmental Monitor to express similar results as the basic hourly statistics listed in Table 4. The time series at S3 had the highest PM10 values, second only to the total mass concentration. During the data collection for S4, the DustTrak Environmental Monitor collected only two hours of data for the date 6 September 2019 but was still included in the study.
Boxplot variations of 24 h and hourly average concentrations of PM2.5 (µg/m3) are devised from the TCEQ C1069 and each of the four studied air sites in Figure 5. Hourly boxplots were plotted for a more precise representation of every hour during the 7-day study period. The hourly data were converted into 24 h PM2.5 concentrations and further compared to the 24 h C1069 data during the duration of each site. The boxplots were created by R programming software and display the mean, median, maximum, minimum, interquartile range, and any outliers.

3.2. Coefficient of Divergence Analysis

Ambient exposure to PM2.5 between CAMS site C1069 and each studied air site was calculated into COD values as shown in Table 5. COD values < 0.20 are identified to have similar concentrations between the two sites. COD values > 0.20 determine significant differences in spatial heterogeneity and concentrations between sites. Therefore, according to Table 5, there are significant differences portrayed between C1069 and S1, S2, S3, and S4 since all the values are > 0.30. The highest COD value is between C1069 and S4 (0.38), the elementary school, indicating a higher level of spatial heterogeneity in pollutant concentration. The lowest COD value is 0.32 between S2 and C1069. These COD values suggest that the PM2.5 concentrations typically obtained from central ambient monitoring sites, such as C1069, may not be an accurate representation of actual exposure at the neighborhood level.

3.3. Spearman’s Correlation Coefficient Analysis

Spearman’s correlation coefficients were also computed to study the temporal relationships between the PM species at each of the sites (S1, S2, S3, and S4) and the nearest respective CAMS sites (C1069, C504, and C505). These correlation coefficients are presented in Table 6 with * indicating correlations as statistically significant at 0.05 level (two-tailed test) and ** representing correlation coefficients significant at 0.01 level (two-tailed test). PM species at S1 and S3 were correlated with CAMS sites parameters: CO, NO, NO2, NOx, PM2.5, OT, and O3; PM species at S2 and S4 were correlated with the available CAMS sites parameters of CO, NO2, PM2.5, OT, and O3.
Across the four samples sites, the various PM species were very strongly correlated with each other with r > 0.942, p < 0.01. This suggests that mining activity is a major contributor to these PM species concentrations. Additionally, the correlation coefficient between NO2 and the PM species at sites S1 and S2 is negative, thereby suggesting that there are no common sources for these two pollutant groups. However, for site S3, NO was weakly correlated at the p < 0.01 level with PM1 (r = 0.281), PM2.5 (r = 0.303), PM4 (r = 0.313), and PM10 (r = 0.271), suggesting the role of possible NO emissions from construction and other mining equipment. Site3 was a residential site with moderate vegetation and located near a quarry; therefore, it may be posited that some natural biogenic sources along with combustion fuel emissions from mining machinery near this site could be attributed to NO.

4. Discussion and Conclusions

As per our knowledge, this study is the first of its type to characterize ambient PM species in the SAR impacted by aggregate and limestone mining. The results confirm that PM concentrations in the San Antonio counties, i.e., Bexar and Comal, are impacted by open-surface mining activities. Primarily, PM1 and PM2.5 concentrations are lower in contrast to PM10 levels. Exposure to high amounts of PM10 components results in short- and long-term health effects [23,24]. The maximum amount of PM species was found in the residential compound sampling area in this study. This could be attributed to its proximity to the open-surface mine.
Spearman’s rho correlation was used to analyze the strong relationships between PM species in each site. Similarly, COD analysis confirmed the PM spatial heterogeneity and concentrations measured were different from the TCEQ monitored CAMS site C1069. Our findings, therefore, accentuate the fact that central ambient monitoring sites at the intra-urban level are not a true representation of exposure patterns due to PM pollution generated by anthropogenic activities, such as mining operations.
Many studies characterizing the environmental impact of mining and quarrying activities have been undertaken throughout the world. A study conducted in Southeast Spain showed that high ambient levels of PM could be attributed to activities such as mining and quarrying [25]. Another study by Khademi et al. from Murcia, Spain, suggested the high environmental and health risk of windblown dust from mining ponds etc. and suggested remedial measures such as plant vegetation to minimize the mining impacts [5]. A North Jordanian study documented high levels of PM10 (120–140 µg/m3) in urban areas surrounding the limestone quarries during the late summer months of July and August [26]. A study from Taiwan analyzing fugitive dust emissions from gravel processing sites showed that PM10 concentrations ranged from 135 to 550 µg/m3 and PM2.5 concentrations ranged from 105 to 470 µg/m3 [27]. Findings from these studies and the present research work demonstrate the importance of taking all the precautions necessary to offset the environmental and health effects of mining activities.
It is also important to mention some of the limitations of our study. Every site was sampled for only one week each during late summer. Future studies in this region should also consider PM sampling during other seasons in addition to extending the sampling time of the study. Furthermore, our study did not measure any elemental composition of the various PM species due to pecuniary challenges. Nevertheless, we believe that studies such as ours are instrumental in addressing the topic of particulate matter air pollution in semi-urban residential environments.
Finally, based on the results from this research work, we posit that all necessary precautions should be undertaken to minimize the effects of fugitive dust emissions from such mining operations in the San Antonio area of Texas, USA. We suggest that the various stakeholders such as the local county officials, mining personnel, and the affected residents should conduct a health impact assessment study due to mining activities and formulate policies that would incorporate the basic principles of sustainable development, thereby mitigating the deleterious health effects and ameliorating the overall concerns of the community at large.

Author Contributions

A.U.R. and J.C. conceived and designed the study; A.L. and A.U.R. implemented the study and supervised the data collection; A.L. and E.M. analyzed the data; E.M. wrote the initial draft of the manuscript; A.U.R. edited and prepared the final draft. All authors provided valuable comments and ideas while drafting the manuscript. All authors read and approved the final draft of the manuscript.

Funding

Funding for this research work was graciously provided by UTRGV under the new faculty startup funds provided to A.U.R.

Institutional Review Board Statement

Not applicable.

Informed Consent Statement

Not applicable.

Data Availability Statement

Available upon request.

Acknowledgments

The authors express their gratitude to undergraduate student Blake Mitchell for help with fieldwork.

Conflicts of Interest

The authors declare no conflict of interest.

References

  1. Csavina, J.; Field, J.; Taylor, M.P.; Gao, S.; Landazuri, A.; Betterton, E.A.; Saez, E.A. A review on the importance of metals and metalloids in atmospheric dust and aerosol from mining operations. Sci. Total Environ. 2012, 433, 58–73. [Google Scholar] [CrossRef] [PubMed] [Green Version]
  2. Karaca, O.; Cameselle, C.; Reddy, K.R. Mine tailing disposal sites: Contamination problems, remedial options, and phytocaps for sustainable remediation. Rev. Environ. Sci. Biotechnol. 2018, 17, 205–228. [Google Scholar] [CrossRef]
  3. Kurth, L.M. Characterization of Atmospheric Particulate Matter in Mountaintop Mining and Non-Mining Areas in West Virginia with Known Health Differences. Ph.D. Thesis, School of Public Health at West Virginia Univeristy, Morgantown, WV, USA, 2013. [Google Scholar] [CrossRef] [Green Version]
  4. Serbula, S.M.; Milosavljevic, J.S.; Radojevic, A.A.; Kalinovic, J.V.; Kalinovic, T.S. Extreme Air Pollution with Contaminants originating from the mining-metallurgical processes. Sci. Total Environ. 2017, 586, 1066–1075. [Google Scholar] [CrossRef] [PubMed]
  5. Khademi, H.; Abbaspour, A.; Martinez-Martinez, S.; Gabarron, M.; Shahrokh, V.; Faz, A.; Acosta, J.A. Provenance and Environmntal Risk of Windblown Materials from Mine Tailing Ponds, Murcia, Spain. Environ. Pollut. 2018, 241, 432–440. [Google Scholar] [CrossRef]
  6. Kreuter, U.P.; Harris, H.G.; Matlock, M.D.; Lacey, R.E. Change in Ecosystem Service Values in the San Antonio Area, Texas. Ecol. Econ. 2001, 39, 333–346. [Google Scholar] [CrossRef]
  7. Belardi, G.; Vignaroli, G.; Plescia, P.; Passeri, L. The Assessment of Particulate Matter Emitted from Stone-Crushing Industry by Correlating Rock Textures with Particles Generated after Comminution and Dispersed in Air Environment. Environ. Sci. Pollut. Res. 2013, 20, 4711–4728. [Google Scholar] [CrossRef]
  8. Petavratzi, E.; Kingman, S.; Lowndes, I. Particulates from Mining Operations: A Review of Sources, Effects and Regulations. Miner. Eng. 2005, 18, 1183–1199. [Google Scholar] [CrossRef]
  9. Hinds, W.C. Aerosol Technology: Properties, Behavior & Measurement of Airborne Particles, 2nd ed.; John Wiley & Sonds, Inc.: New York City, NY, USA, 1999. [Google Scholar]
  10. Godish, T.; Davis, W.T.; Fu, J.S. Air Quality, 5th ed.; CRC Press, Taylor & Francis Group: Boca Raton, FL, USA, 2014; pp. 155–201. [Google Scholar]
  11. Gholampour, A.; Nabizadeh, R.; Hassanvand, M.S.; Taghipour, H.; Rafee, M.; Alizadeh, Z.; Faridi, S.; Mahvi, A.H. Characterization and Source Identification of Trace Elements in Airborne Particulates at Urban and Suburban Atmospheres of Tabriz, Iran. Environ. Sci. Pollut. Res. 2016, 23, 1703–1713. [Google Scholar] [CrossRef]
  12. Kurilić, S.M.; Božilović, Z.; Milošević, R. Contamination and Health Risk Assessment of Trace Elements in PM10 from Mining and Smelting Operations in the Bor Basin, Serbia. Toxicol. Ind. Health 2020, 36, 135–145. [Google Scholar] [CrossRef]
  13. Kim, K.H.; Kabir, E.; Kabir, S. A Review on the Human Health Impact of Airborne Particulate Matter. Environ. Int. 2015, 74, 136–143. [Google Scholar] [CrossRef]
  14. Lira, M.; Kohlman Rabbani, E.; Barkokébas Junior, B.; Lago, E. Risk Evaluation and Exposure Control of Mineral Dust Containing Free Crystalline Silica: A Study Case at a Quarry in the Recife Metropolitan Area. Work 2012, 41, 3109–3116. [Google Scholar] [CrossRef] [PubMed] [Green Version]
  15. Sternberg, T.; Edwards, M. Desert Dust and Health: A Central Asian Review and Steppe Case Study. Int. J. Environ. Res. Public Health 2017, 14, 1342. [Google Scholar] [CrossRef] [PubMed] [Green Version]
  16. Chen, W.; Liu, Y.; Wang, H.; Hnizdo, E.; Sun, Y.; Su, L.; Chen, J. Long-term exposure to silica dust and risk of total and cause-specific mortality in Chinese workers: A cohort study. PLoS Med. 2012, 9, e1001206. [Google Scholar] [CrossRef] [PubMed]
  17. Moya, P.M.; Arce, G.J.; Leiva, C.; Vega, A.S.; Gutierrez, S.; Adaros, H.; Munoz, L.; Pasten, P.A.; Cortes, S. An Integrated Study of Health, Environmental, and Socioeconomic indicators in a mining-impacted community exposed to metal enrichment. Environ. Geochem. Health 2019, 41, 2505–2519. [Google Scholar] [CrossRef]
  18. San Antonio: Geography and Climate. Available online: http://www.city-data.com/us-cities/The-South/San-Antonio-Geography-and-Climate.html (accessed on 10 August 2021).
  19. TSI DustTrak Environmental Monitors. Available online: https://tsi.com/products/environmental-air-monitors/dusttrak-environmental-monitors/ (accessed on 10 August 2021).
  20. Pinto, J.P.; Lefohn, A.S.; Shadwick, D.S. Spatial variability of PM2.5 in urban areas in the United States. J. Air Waste Manag. Assoc. 2004, 54, 440–449. [Google Scholar] [CrossRef] [Green Version]
  21. Raysoni, A.U.; Sarnat, J.A.; Sarnat, S.E.; Garcia, J.H.; Holguin, F.; Luvano, S.F.; Li, W.W. Binational School-Based Monitoring of Traffic-Related Air Pollutants in El Paso, Texas (USA) and Ciudad Juarez, Chihuahua (Mexico). Environ. Pollut. 2011, 159, 2476–2486. [Google Scholar] [CrossRef]
  22. Raysoni, A.U.; Stock, T.H.; Sarnat, J.A.; Montoya Sosa, T.; Ebelt Sarnat, S.; Holguin, F.; Greenwald, R.; Johnson, B.; Li, W.W. Characterization of Traffic-Related Air Pollutant Metrics at Four Schools in El Paso, Texas, USA: Implications for Exposure Assessment and Siting Schools in Urban Areas. Atmos. Environ. 2013, 80, 140–151. [Google Scholar] [CrossRef]
  23. Sarnat, S.E.; Raysoni, A.U.; Li, W.W.; Holguin, F.; Johnson, B.A.; Luevano, S.F.; Garcia, J.H.; Sarnat, J.A. Research|Children’s Health Air Pollution and Acute Respiratory Response in a Panel of Asthmatic. Environ. Health Perspect. 2012, 120, 437–444. [Google Scholar] [CrossRef] [Green Version]
  24. US EPA. Particulate Matter Pollution. 2021. Available online: https://www.epa.gov/pm-pollution/particulate-matter-pm-basics#effects (accessed on 10 February 2022).
  25. Santacatalina, M.; Reche, C.; Minguillon, M.C.; Escrig, A.; Sanfelix, V.; Carratala, A.; Nicolas, J.; Yubero, E.; Crespo, J.; Alastuey, A. Impact of fugitive emissions in ambient PM levels and composition: A case study in Southeast Spain. Sci. Total Environ. 2010, 408, 4999–5009. [Google Scholar] [CrossRef]
  26. Titi, A.; Dweirj, M.; Tarawneh, K. Environmental Effects of the Open Cast Mining, A Case Study: Irbid Area, North Jordan. Am. J. Ind. Bus. Manag. 2015, 5, 404–423. [Google Scholar] [CrossRef] [Green Version]
  27. Chang, C.-T.; Chang, Y.-M.; Lin, W.-Y.; Wu, M.-C. Fugitive Dust Emission Source Profiles and Assessment of Selected Control Strategies for Particulate Matter at Gravel Processing Sites in Taiwan. J. Air Waste Manag. Assoc. 2010, 60, 1262–1268. [Google Scholar] [CrossRef] [PubMed] [Green Version]
Figure 1. Map of the studied air sites and continuous air monitoring sites.
Sustainability 14 04288 g001
Figure 2. Wind roses for studied air sites and TCEQ CAMS 1069 during the study period.
Sustainability 14 04288 g002aSustainability 14 04288 g002b
Figure 3. TSI DustTrak Environmental Monitor at site S1.
Sustainability 14 04288 g003
Figure 4. Time series of hourly PM species and mass concentrations ((µg/m3) for S1 (a), S2 (b), S3 (c), and S4 (d).
Sustainability 14 04288 g004
Figure 5. Boxplots for 24 h and hourly average concentrations of PM2.5 (µg/m3) at CAMS 1069 and the four studied sites. Diamond corresponds to the mean and the asterisks are the outliers.
Sustainability 14 04288 g005
Table 1. Descriptive coordinates (DMS) for the studied air sites and TCEQ CAMS.
SiteCoordinates (DMS)
S129°45′00″ N, 98°20′28″ W
S229°38′48″ N, 98°13′20″ W
S329°40′06″ N, 98°15′04″ W
S429°38′29″ N, 98°18′03″ W
C106929°31′45.96″ N, 98°23′29.05″ W
C50429°42′15.00″ N, 98°01′44.00″ W
C50529°38′21.00″ N, 98°17′55.00″ W
Table 2. San Antonio TCEQ CAMS site monitored parameters.
San AntonioC1069C504C505
COx
NOx
NO2x
NOxx
O3 xx
Relative Wind Speedx
Relative Wind Directionx
Outdoor Temperaturex
Relative Humidityx
PM2.5x
Table 3. General description of the study duration.
Site LocationDate StartTime StartDate EndTime End
Site1 (S1)3 August 201920:4010 August 201914:40
Site2 (S2)17 August 201914:4524 August 201914:45
Site3 (S3)24 August 201915:1530 August 201913:20
Site4 (S4)30 August 201914:1511 September 201912:00
Table 4. Hourly basic statistics for various PM species (µg/m3) at the four air sites.
PM1PM2.5PM4PM10
Site 1
N163163163163
Mean7.338.058.6110.07
StDev4.144.294.444.73
Min0.731.021.381.92
Max21.2322.2823.0824.87
Site 2
N170170170170
Mean11.9313.1514.1516.01
StDev6.066.907.728.97
Min1.231.431.673.48
Max36.7739.1741.2744.92
Site 3
N145145145145
Mean18.6719.7020.5223.06
StDev8.909.209.389.77
Min3.574.154.988.50
Max48.3849.8250.7852.58
Site 4
N192192192192
Mean11.6812.1112.7015.42
StDev5.946.116.549.85
Min1.201.401.783.13
Max41.2744.4250.9589.37
Table 5. COD values for TCEQ C1069 in the different air sites.
PM2.5C1069
S10.35
S20.32
S30.37
S40.38
Table 6. Spearman’s correlation coefficients between the PM species at sites S1–S4 and other pollutants at various CAMS sites.
PollutantSiteS1 C1069 C504C505
OTPM1PM2.5PM4PM10TCCONONO2NOxPM2.5OTO3O3
OTS11
PM10.496 **1
PM2.50.464 **0.995 **1
PM40.448 **0.988 **0.998 **1
PM100.503 **0.970 **0.979 **0.985 **1
TC0.568 **0.942 **0.947 **0.952 **0.988 **1
COC1069−0.205 **−0.256 **−0.259 **−0.254 **−0.242 **−0.226 **1
NO−0.637 **−0.294 **−0.276 **−0.258 **−0.281 **−0.313 **0.319 **1
NO2−0.439 **−0.336 **−0.336 **−0.321 **−0.325 **−0.326 **0.486 **0.714 **1
NOx−0.478 **−0.335 **−0.331 **−0.315 **−0.322 **−0.326 **0.426 **0.804 **0.979 **1
PM2.5−0.0310.168 *0.218 **0.247 **0.240 **0.202 *0.0830.1320.0200.0811
OT−0.166 *0.215 **0.230 **0.223 **0.158 *0.085−0.509 **−0.154−0.459 **−0.344 **0.0311
O3C504−0.0550.1360.1360.1200.0660.017−0.456 **−0.379 **−0.557 **−0.505 **−0.162 *0.867 **1
O3C505−0.0160.167 *0.167 *0.1490.0980.051−0.448 **−0.404 **−0.566 **−0.524 **−0.1530.848 **0.980 **1
PollutantSiteS2 C1069 C504C504
OTPM1PM20.5PM4PM10TCCO NO2 PM20.5OTO3O3
OTS21
PM1−0.1081
PM2.5−0.1030.994 **1
PM4−0.1030.983 **0.996 **1
PM10−0.0940.957 **0.980 **0.992 **1
TC−0.0750.942 **0.967 **0.981 **0.996 **1
COC1069−0.298 **−0.113−0.117−0.126−0.142−0.1531
NO2−0.255 **−0.088−0.048−0.036−0.008−0.0100.575 ** 1
PM2.50.0970.503 **0.529 **0.547 **0.554 **0.549 **0.167 * 0.110 1
OT−0.286 **0.294 **0.277 **0.272 **0.252 **0.229 **−0.517 ** −0.450 ** 0.0121
O3C504−0.218 **0.1380.1250.1290.1270.123−0.577 ** −0.548 ** −0.1270.874 **1
O3C505−0.211 **0.0970.0790.0820.0760.072−0.563 ** −0.566 ** −0.1500.842 **0.954 **1
PollutantSiteS3 C1069 C504C505
OTPM1PM20.5PM4PM10TCCONONO2NOxPM20.5OTO3O3
OTS31
PM1 −0.285 **1
PM2.5 −0.309 **0.997 **1
PM4 −0.325 **0.992 **0.998 **1
PM10 −0.299 **0.942 **0.954 **0.967 **1
TC −0.236 **0.897 **0.909 **0.926 **0.986 **1
COC1069−0.0110.1540.1360.1220.0660.0261
NO −0.726 **0.281 **0.303 **0.313 **0.271 **0.218 *0.286 **1
NO2 −0.2100.2310.2140.2080.1690.1450.377 **0.542 **1
NOx −0.383 **0.243 *0.234 *0.232 *0.1920.1450.395 **0.785 **0.893 **1
PM2.5 −0.0040.218 **0.207 *0.196 *0.1510.1270.200 *−0.079−0.114−0.227 *1
OT −0.0690.280 **0.299 **0.312 **0.331 **0.333 **−0.371 **−0.081−0.038−0.038−0.0131
O3C504−0.1150.259 **0.279 **0.293 **0.312 **0.309 **−0.356 **−0.0520.000−0.0010.0340.948 **1
O3C505−0.0460.249 **0.265 **0.275 **0.288 **0.288 **−0.360 **−0.143−0.086−0.1200.0660.951 **0.973 **1
PollutantSiteS4 C1069 C504C505
OTPM1PM20.5PM4PM10TCCO NO2 PM20.5OTO3O3
OTS41
PM10.0261
PM2.50.0240.999 **1
PM40.0290.995 **0.998 **1
PM100.0950.943 **0.951 **0.966 **1
TC0.151 *0.890 **0.899 **0.918 **0.983 **1
CO −0.154 *0.339 **0.328 **0.315 **0.269 **0.263 **1
NO2−0.591 **0.1130.1090.0970.010−0.0370.670 ** 1
PM2.5−0.1170.547 **0.541 **0.536 **0.498 **0.474 **0.487 ** 0.310 ** 1
OT0.196 **−0.006−0.002−0.0010.0170.020−0.409 ** −0.404 ** 0.0451
O3C5040.227 **0.212 **0.216 **0.224 **0.262 **0.274 **−0.409 ** −0.469 ** 0.0420.844 **1
O3C5050.254 **0.372 **0.374 **0.379 **0.405 **0.408 **−0.270 ** −0.441 ** 0.169 **0.802 **0.943 **1
* Correlation is significant at 0.05 level (2 tailed test). ** Correlation is significant at 0.01 level (2 tailed test). OT = Outdoor temperature. O3 = Ozone. NO2 = Nitrogen Dioxide. NO = Nitric Oxide. NOX = Nitrogen Oxides. CO = Carbon Monoxide. TC = Total PM concentration.
Publisher’s Note: MDPI stays neutral with regard to jurisdictional claims in published maps and institutional affiliations.

