Article

Evaluation of Industrial Green Transformation in the Process of Urbanization: Regional Difference Analysis in China

School of Economics, Ocean University of China, Qingdao 266100, China
*
Author to whom correspondence should be addressed.
Sustainability 2022, 14(7), 4280; https://doi.org/10.3390/su14074280
Submission received: 11 March 2022 / Revised: 29 March 2022 / Accepted: 1 April 2022 / Published: 4 April 2022
(This article belongs to the Section Economic and Business Aspects of Sustainability)

Abstract

:
Population mobility and the expansion of construction land in industrial development promote urbanization, and the sustainable development of cities creates requirements for the green transformation of industry. This paper uses the directional distance function (DDF) and the global Malmquist–Luenberger (GML) index method—including urbanization factors—to calculate the industrial green transformation (IGT) index in China, and to analyze its evolution and spatial distribution characteristics. The results show that ignoring the urbanization factor will lead to the overestimation of the IGT. The growth of the index has multiple stages, and it shows a decreasing order in the middle, east and west regions. Overall, the distribution of the index spreads out over time, and the gap widens. In terms of spatial correlation, high values are mostly concentrated in the eastern region and low values are mostly concentrated in the western region, and the gap in the eastern region is larger than those in the central and western regions. Therefore, in addition to the transformation of industrial production into a circular economy model, it is also necessary to promote the circulation of technical talent between regions in the development of urbanization, reducing the unbalanced development between regions and comprehensively promoting the green transformation of industry.

1. Introduction

The comprehensive green transformation of economic and social development leads the way in high-quality development in the new era. However, from the perspective of the progress of production technology in China’s industrial sector, it is manifested as a preference for the use of energy—especially fossil energy—and labor, while saving capital [1,2]. This high consumption of energy, as well as the resulting environmental pollution and ecological damage, has led to requirements being put forward for the development of a green industrial transformation. The driving force for the green transformation of industrialization lies in the benefits of reducing energy consumption, saving costs, improving utilization efficiency, reducing emissions, and breaking green trade barriers. These benefits are greater than the costs incurred from investment in energy-saving technology and equipment, investment in environmental protection and governance, and economic losses in other fields [3]. In this regard, in practice, China’s multi-regional historical cases show that the modes of high resource allocation efficiency and investment scale, and low resource endowment plays a significant role [4]. In addition, through the construction of industrial parks, environmental and economic competitiveness performance can be improved and green transformation can be promoted. Theoretical studies have also found that, in the use of renewable energy technologies for energy transformation, compared with solar photovoltaics, wind energy is more conducive to green industrial development in terms of climate change mitigation and cost [5].
Many scholars are also working hard to explore effective means of industrial green transformation. For cities that rely on abundant resources, compared with technology introduction, technological innovation is an important path to support the green transformation of industries, and the interaction between the two has obvious heterogeneity for different types of resource-based cities [6]. Environmental regulation is another important means of transformation. Under the influence of the threshold effect, environmental regulation and industrial green transformation have a nonlinear U-shaped relationship, and environmental decentralization will also play a role [7,8]. Moreover, environmental regulation can lead to industrial green transformation by the effects of first offsetting and then compensating for technological innovation [9]. Furthermore, energy intensity and carbon intensity constraint policies, as well as mismatched renewable energy consumption, pose challenges to industrial total factor growth and green transformation [10,11].
Regarding the efficiency of China’s green growth, regional gaps are narrowing, but the level of spatial efficiency decreases sequentially from east to west; green growth in the eastern and central regions is active, but is weak in the northeast region [12]. In order to promote the green transformation of industries, many regions in China have adopted different measures in resource allocation, environmental regulation and technological innovation, resulting in different performances of the green transformation of industries in different regions. The eastern region implemented the industrial green transformation-driven model of the coordinated development of investment scale, environmental regulation and independent innovation. The central region mainly adopted the method of improving resource allocation efficiency and catching up with technology by undertaking technology transfer from the eastern region. The western region attracts foreign investment through low-intensity environmental regulation and technology introduction to promote green transformation [4]. In addition, different economic strengths and policies in regions have also resulted in differences in the effect of green transition. For example, it is less difficult to build eco-industrial parks in provincial capitals, and a better emission reduction effect can be obtained [13], and the ‘Air Pollution Control and Prevention Action Plan’ can receive better promotion in more developed regions [14]. Moreover, many studies focus on the green economic development of urban agglomerations, such as the green development efficiency of the Beijing-Tianjin-Hebei region [15], the environmental total factor productivity of the Yangtze River Economic Belt [16], and the green total factor productivity in the Pan-Pearl River Delta region [17]. Although the efficiency of urban green development shows a decreasing order from east to west from the perspective of the city scale, the larger the scale, the higher the efficiency of green development [18].
It is worth mentioning that there is a symbiotic relationship between industrialization and urbanization. For example, some studies combine industrialization and urbanization to analyze the interaction with carbon emissions [19]. Although, initially, industrialization promoted urbanization, the development requirements for green urbanization at the current stage are forcing the green transformation of industry. The existing research focuses on the joint effects of urbanization and industrialization on economic and environmental phenomena, or the impact of industrialization on urbanization. However, urbanization also stimulates industrial expansion, affecting environmental pollution emissions and the industrial structure. On the one hand, the scale and structural effects of urbanization have an aggravating effect on the emission of industrial pollutants, while the intensification effect has a reducing effect [20]. Regarding the relationship between urbanization and carbon emissions, or urbanization and smog, there are mainly two views: a linear and positive view, and an inverted U-shaped view [21,22,23]. For the performance of urbanization in China, land urbanization and permanent population urbanization are mainly manifested in increasing carbon emissions [24,25]. Moreover, this impact of China’s land and population urbanization on industrial carbon emissions and air pollutants has regional differences and spatial spillover effects in the eastern, central and western regions. The effect is larger and positive in the east, and relatively small and negative in the center and west [26,27,28]. In addition, views on the impact of urbanization on energy consumption vary (they can be both positive and negative), whereas theories of ecological modernization and urban environmental transformation argue that the net effect is unclear [23]. On the other hand, urbanization is conducive to the transformation of the industrial structure to a rational and sophisticated form, and improves the negative impact on the ecological environment through the intermediary role of the industrial structure [29,30,31].
In order to explore an effective approach to industrial green transformation, it is necessary to assess the development level. That is, an accurate assessment of industrial green transformation is needed, which is the main purpose of this paper. In addition, considering the close connection between urbanization and industrialization, as well as the impact of urbanization on the industrial structure and environmental pollution related to the realization of industrial green transformation, we evaluate the level of industrial green transformation in the process of urbanization. For the description of industrial green transformation, in addition to the transformation’s efficiency, industrial scale and structure should also be considered [32,33]. In terms of method, in addition to the traditional comprehensive index evaluation method, the data envelopment analysis (DEA) method is often used to evaluate the performance of industrial green transformation, such as in the super-efficiency DEA model [34,35] and in the three-stage DEA model [36]. There are also methods that combine hybrid models with window analysis for dynamic analysis [37], and model methods that combine network and eco-efficiency [38]. The multi-criteria decision analysis (MCDA) method also provides a tool for the evaluation of green industrial development. This method uses a total weighted score to evaluate industrial development by selecting multiple related criteria [39]. This paper tends to choose the DEA method to examine the operation of the industrial economic production system. Using input and output data, the internal operating mechanism is analyzed through exponential decomposition, which opens the black box of economic operation.
Based on the existing literature, this paper mainly makes the following novel contributions. (1) In the evaluation of industrial green transformation, considering the close connection between industrialization and urbanization, the urbanization factor is included as the evaluation index. When assessing green transition, the existing literature only delineates research objects into different types of city scales. In this case, in order to coordinate industrial green transformation with urbanization development, it is more practical to place green transformation assessment in the context of urbanization. (2) In order to incorporate urbanization factors, this paper adjusts the model, and analyzes the internal reasons for regional differences in industrial green transition through exponential decomposition. The existing literature is evaluated by a comprehensive evaluation method of the construction of an index system, so as to analyze the contribution of index factors. This paper focuses on the operational efficiency and structure of the production system. In addition to the examination of the impact of urbanization, it also analyzes the effect of technology on green transformation through exponential decomposition.
To sum up the above, this paper puts the evaluation of China’s industrial green transformation in the context of the urbanization process for extended research. Moreover, we take into account both land urbanization and population urbanization to examine the transformation status. In order to describe the industrial green transformation from the perspectives of efficiency and structure, we use the directional distance function (DDF) method combined with the global Malmquist–Luenberger (GML) index. Then, the industrial green transformation (IGT) index is obtained in the form of a structural ratio. Additionally, the model used will be adjusted to incorporate urbanization factors. Furthermore, this paper explores the spatial effect under the influence of urbanization, and analyzes the evolution of the regional spatial structure of the development of industrial green transformation.

2. Materials and Methods

2.1. Directional Distance Function and Global Malmquist–Luenberger Index Methods

Due to the scarcity of resources, economic development pays attention to efficiency issues. Based on the relationship between the input and output, the DEA model is used to evaluate the development benefits of the evaluated object. The non-radial SBM model includes a consideration of relaxation improvement, and has become a widely used efficiency measurement method. However, for the coexisting expected output and undesired output, in order to distinguish the output, it is necessary to define the evaluated decision-making unit’s (DMU) projection direction to the frontier surface. Therefore, Chung et al. (1997) proposed a direction distance function model (DDF) [40]. The model obtains the index, which represents the change in total factor productivity growth. This method may have no feasible solution during the calculation. For this, Oh (2010) proposed the GML; this method uses a common frontier constructed from data from all of the periods [41]. The model of this paper is established on the basis of this idea.
In order to measure the performance of industrial green transformation in the process of urbanization, we regard each province as a DMU. The urbanization of land and population is represented by c j ( j = 1 , 2 ) . For a period t ( t = 1 , 2 , , T ) , each DMU has m inputs, represented by x i ( i = 1 , 2 , , m ) , as well as p expected outputs, y r ( r = 1 , 2 , , p ) and q undesired outputs, b s ( s = 1 , 2 , , q ) . For the kth ( k = 1 , 2 , , K ) DMU, the adjusted DDF model is established as follows:
min θ k = 1 1 m i = 1 m β g x i / x i k 1 + 1 p + q ( r = 1 p β g y r / y r k + s = 1 q β g b s / b s k ) s . t . { X λ + β g x x k Y λ β g y y k B λ β g b b k C λ ( 1 + β ) c k λ 0
where Equation (1) is adjusted based on the general form of the non-directional distance function model [42]. The fourth constraint is set for urbanization factors, and its form is similar to the original setting. That is because the original model is no longer a pure economic system but treats the economy and ecological environment as a whole system, and introduces environmental factors. Therefore, in the overall system of the economy, ecology and society, this model includes the urbanization factor. Moreover, it has similar properties to the expected output; thus, it is formally the same as the expected output constraint. In addition, we set the direction function as g = ( g x , g y , g b ) = ( x k , y k , b k ) . β is expressed as the degree of inefficiency of the evaluated DMU with respect to the frontier surface. We converted the objective function equivalently to solve max β , and used this as the result of the solution of the DDF. The formula is
G M L t t + 1 = 1 + D G ( x t , y t , b t ) 1 + D G ( x t + 1 , y t + 1 , b t + 1 )
G M L t t + 1 = 1 + D t ( x t , y t , b t ) 1 + D t + 1 ( x t + 1 , y t + 1 , b t + 1 ) × [ 1 + D G ( x t , y t , b t ) 1 + D t ( x t , y t , b t ) × 1 + D t + 1 ( x t + 1 , y t + 1 , b t + 1 ) 1 + D G ( x t + 1 , y t + 1 , b t + 1 ) ] = E C t t + 1 × T C t t + 1
where D ( · ) is DDF, EC is efficiency change, and TC is technology change. If, for a certain DMU, the GML value is 1 for consecutive years, use the super-efficiency model to recalculate it. The contribution of the green total factor productivity to industrial economic growth is taken as the green transformation evaluation index [43]. That is, the ratio of the GML growth rate to industrial economic growth rate is used to reflect the dynamic development of industrial green transformation, which is recorded as IGT.

2.2. Spatial–Temporal Evolution and Regional Difference Analysis Method

2.2.1. Kernel Density Estimation

When the specific form of the density function is unknown, the kernel density estimation starts from the data itself, without using the prior knowledge of the distribution, and simulates the probability distribution curve. According to the change of the peak position and width of the kernel density curve, it can be used to describe the change trajectory of economic activity over time. The kernel density function is expressed as
f ^ h ( x ) = 1 n h i = 1 n K ( x x i h )
where K ( · ) is the kernel function and h is the bandwidth.

2.2.2. σ Convergence

σ convergence is used to judge whether the dispersion of economic variables has a downward trend in time. If σ gradually decreases, it indicates that there is an σ convergence phenomenon in economic variables. The expression is
σ t = 1 n i = 1 n ( x i t x ¯ t ) 2

2.2.3. Spatial Correlation

Global spatial autocorrelation is used to measure the degree of interaction between data in geographic space. This paper uses the global Moran’s I index based on the adjacency spatial weight matrix and inverse distance spatial weight matrix to analyze the spatial characteristics of IGT, which is expressed as
I = n i = 1 n j i n w i j ( x i x ¯ ) ( x j x ¯ ) ( i = 1 n j i n w i j ) i = 1 n ( x i x ¯ ) 2
where w i j represents the spatial weight. Take I = 0, which expresses spatial randomness, as the critical value. I < 0 indicates that there is a negative spatial correlation, and there are differences in space. On the other hand, I > 0 indicates that there is a positive spatial correlation, and the economic factors studied show an agglomeration phenomenon.
The local spatial autocorrelation can analyze the spatial heterogeneity masked by the global scope, which is mainly described by the local Moran’s I index. The expression is
I i = ( x i x ¯ ) j i n w i j ( x j x ¯ ) S 2 , S 2 = j i n ( x j x ¯ ) 2 n 1
where x needs to be brought into the IGT. If I i > 0 , it indicates that both the local and neighboring region have high or low values. I i < 0 , it indicates that they have different performances.

2.3. Variable Selection and Data Sources

When the data are available, this paper selects the time span of 2006–2017. Taking the industrial green development of 30 provinces in China (excluding Tibet) as the research object, we built a green transformation evaluation index system as follows:
(1)
Input indicator: We selected capital, labor and energy as the input factors. First, the capital investment takes the industrial capital stock as a representative index. We estimated the index using the perpetual inventory method, and the expression is K i t = K i t 1 ( 1 δ ) + I i t [44]. Taking 2005 as the base year, the initial industrial capital stock is represented by dividing the industrial fixed asset investment in the current year by 10%. The industrial fixed asset investment is the sum of fixed asset investment in mining, manufacturing, and the production and supply of electricity, gas and water. We used 6% of the non-agricultural depreciation rate as a fixed depreciation rate [45]. Taking into account the factors of price changes, the investment is represented by the fixed asset investment converted at the constant price of the base year of the fixed asset investment index. Second, the labor input indicator is measured by the total number of employed persons in the industrial fields of each province. Third, the energy input is measured by the total energy consumption of each province. As there are no direct data, the data statistics ranges on industrial capital, labor and energy in this paper are all based on the industry categories covered in China Industry Statistical Yearbook, including mining, manufacturing, production, and the supply of electricity, gas and water.
(2)
Output indicators: First, the expected output is measured by the industrial added value. Taking the previous year as the base period, the industrial added value is converted at a constant price with the GDP index of the secondary industry. Second, the undesired output is measured by the environmental pollution index, which is constructed by the entropy method. This index is composed of three secondary indicators: total industrial wastewater discharge, total industrial waste gas discharge, and general industrial solid waste generation. The larger the indicator value is, the more polluting wastes are produced.
(3)
Urbanization indicator: The measurement indicators of urbanization are selected from the two aspects of land and population. The urban area is used to represent the urbanization of land, and the urban population is used to represent the degree of urbanization of the population.
Regarding the indicator data, it is based on the capital, labor input, and economic and polluting outputs adopted by Chung et al. (1997) [40]. Energy input was later introduced in consideration of resource constraints [37]. This paper retains the selection of data from previous studies. In addition, for each province, the method constructs the technology frontier based on the data of all years, and the data of different years will have different distances from the frontier. The shorter the distance, the better the production performance. Moreover, the method can observe time changes.
The data for the above indicators are all from the China Statistical Yearbook (2007–2018), China Energy Statistical Yearbook (2007–2018), China Environmental Statistical Yearbook (2007–2018), Urban Construction Statistical Yearbook (2007–2018), and the statistical yearbooks of various provinces. The missing data are supplemented by interpolation.

3. Results

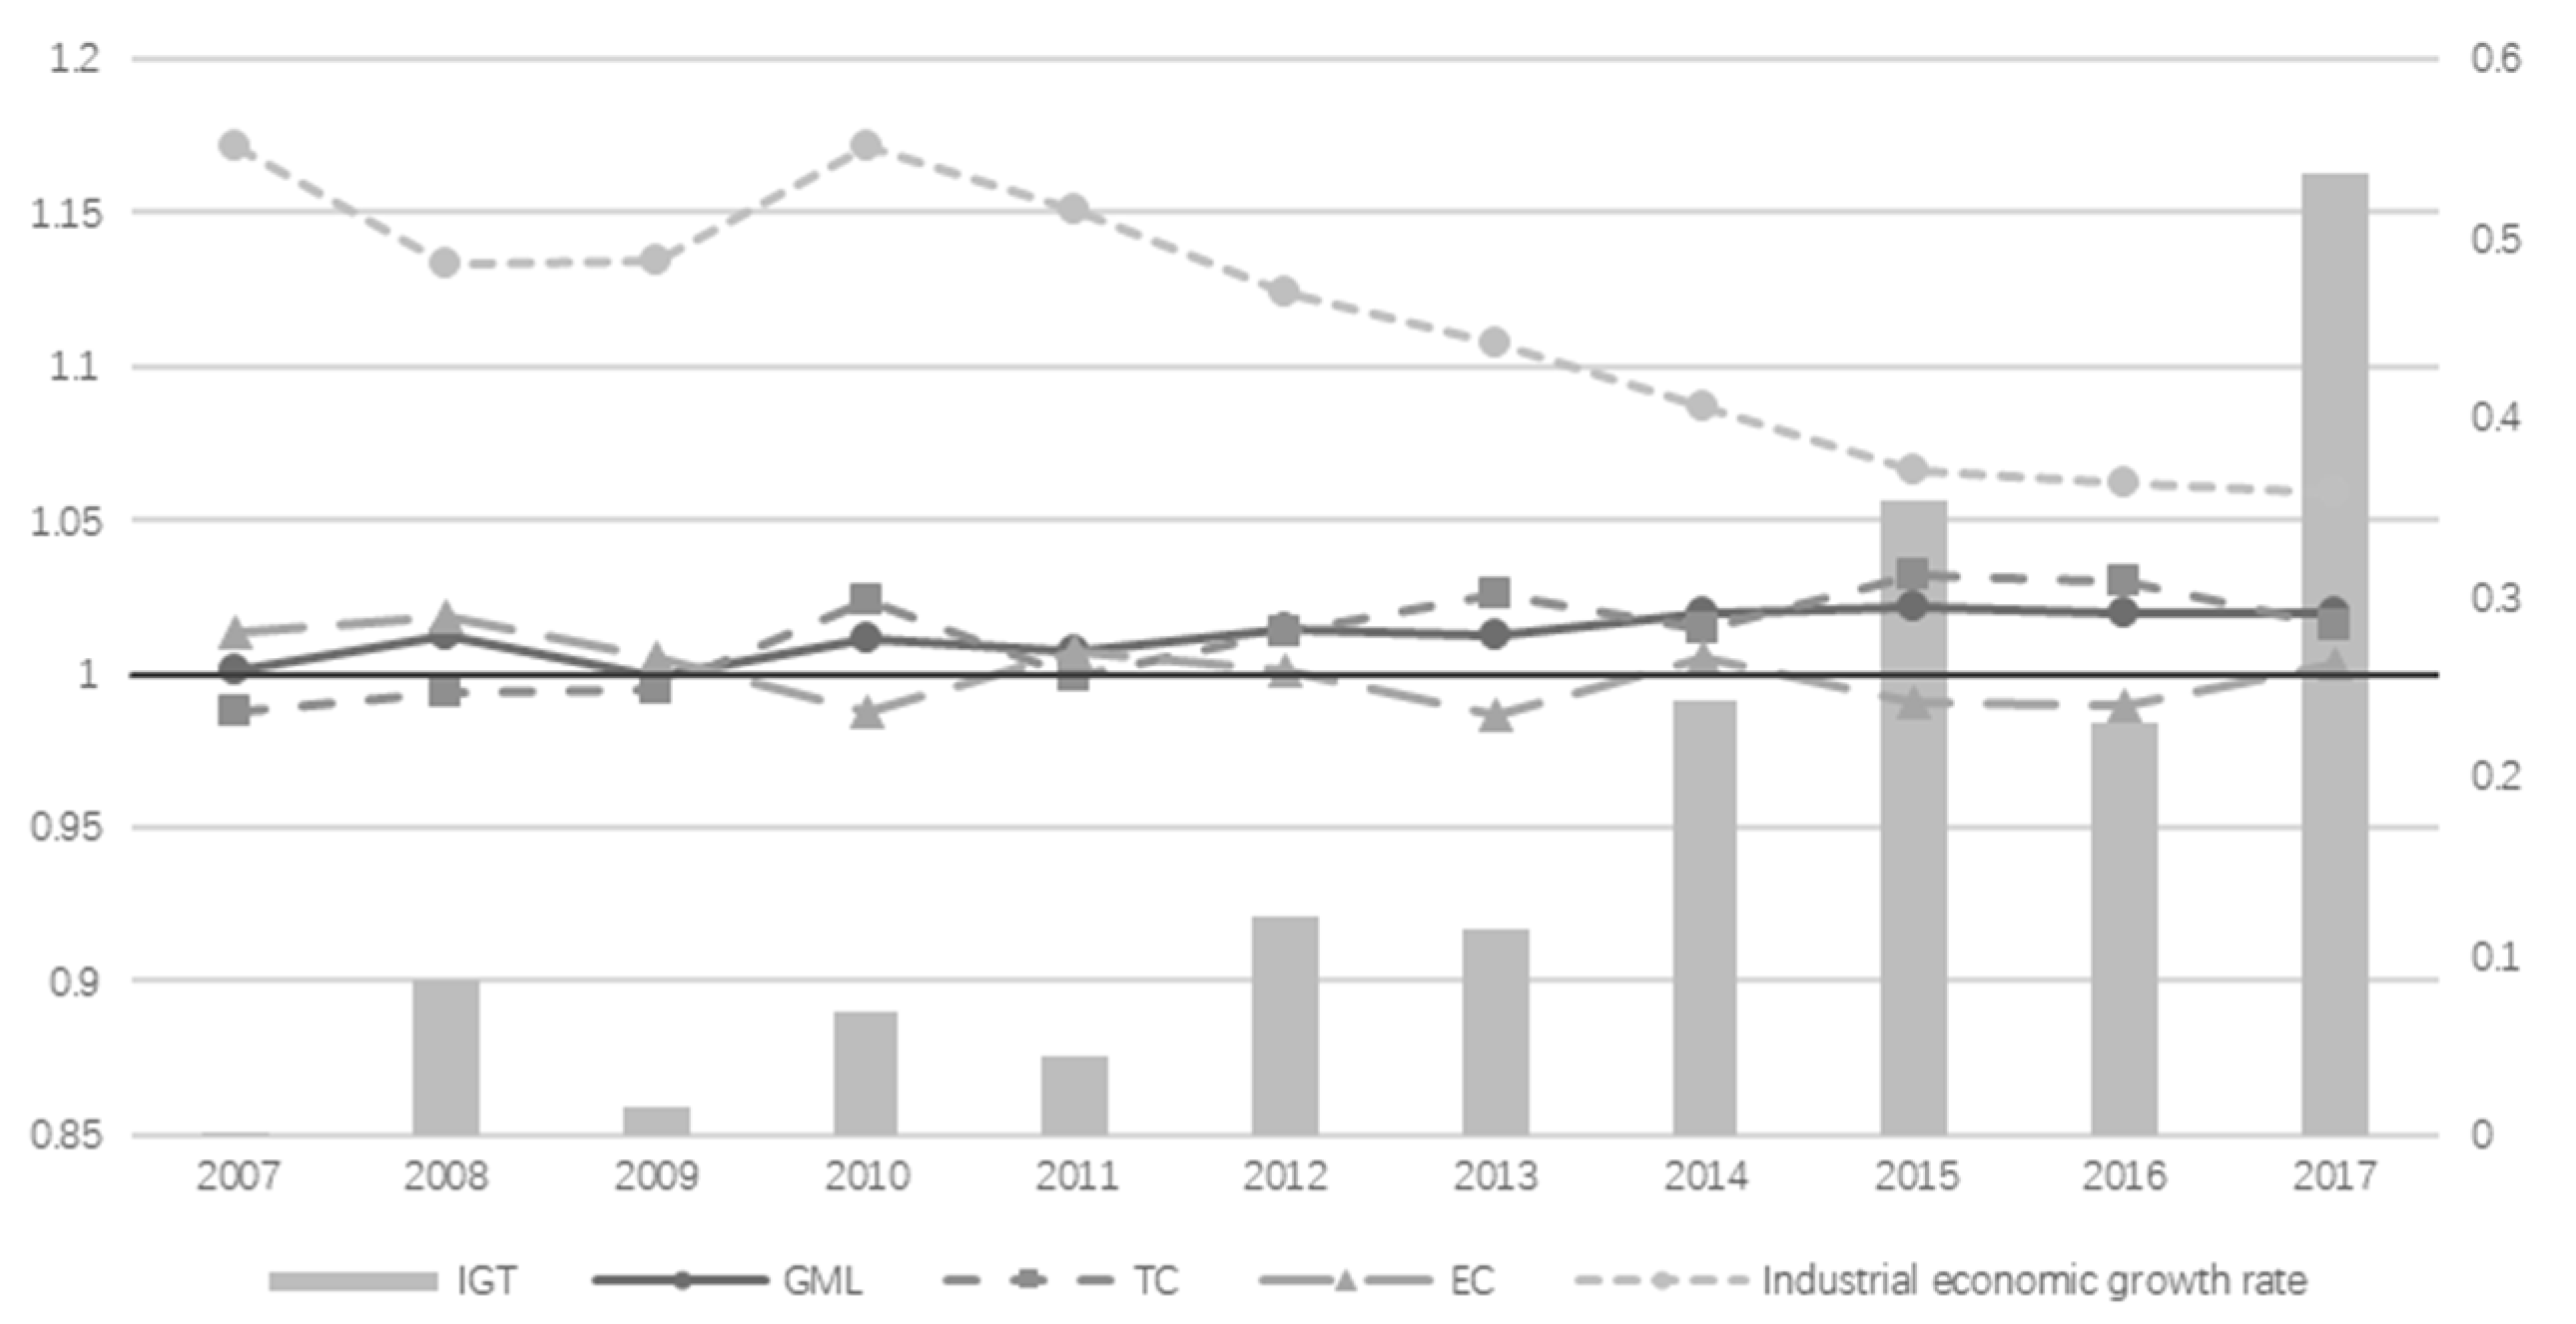
3.1. Analysis of the IGT Index in the Process of Urbanization

If the urbanization factor is not taken into account, the data in Table 1 show that the level of GML is overestimated; thus, the IGT is overestimated. The GML index measures changes in industrial green total factor productivity, and can understand the status of green development efficiency before solving the industrial green transition. When the urbanization factor is not considered, the GML index basically continues to change within a small range, which makes the green development of the industrial economy look not very smooth. Under the background of the urbanization process, the GML index is basically greater than 1 and has an increasing trend. It shows that with the continuous improvement of the level of urbanization, the green growth level of the industrial economy has increased year by year, and the growth rate has continued to increase. Therefore, it is necessary to consider the urbanization factor, which can indicate the actual development status of the promotion of the green transformation of the industry, and proves the effect of efforts. Figure 1 shows that in the process of urbanization, China’s IGT from 2007 to 2017 showed a rising trend as a whole, and that it has obvious stage characteristics. From 2007 to 2013, the industrial green transition index was mostly below the level of 0.15, and the fluctuation range was small. In 2014, the level of industrial green transition increased by leaps and bounds. The transition level remained above the 0.2 level from 2014 to 2017, and showed a large fluctuation range.
As the growth rate of the industrial economy dropped from 17.2% to 5.9% and the GML index maintained a slight increase, the growth of the green total factor productivity has played an important role in the green transformation of the declining industrial economic growth rate. Moreover, the industrial structure has been significantly optimized under the guidance of green development. Technological progress has provided strong support for the growth of green total factor productivity. The TC index has remained above the level of 1 since 2012, whereas the EC index has become lower and sometimes below the level of 1. Technological improvements suitable for industrial development have become the output force of economic development. The energy-saving and emission-reduction effects of technological innovation are also constantly emerging, and make up for the negative effects of insufficient efficiency.
Dividing the 30 provinces into eastern, central and western regions, Figure 2 shows that the industrial green transition index in each region generally rose to the upper right from 2007 to 2017. This corresponds to the national stage characteristics. From 2007 to 2014, each region had slightly fluctuating growth revolving around the national curve. However, between 2015 and 2017, its change had a huge fluctuation difference.
Except for 2008 and 2017, the performance of industrial green development in the central region has always remained higher than the national average level. In 2015, it even increased significantly and exceeded the national, eastern and western regions by more than two times. This is mainly due to the cliff-like decline in industrial employment in Heilongjiang, and because the saving of factors on the production input side raised green total factor productivity. In 2017, capital and energy investment in Jilin and Heilongjiang increased, and the urban population and area decreased. This led to lower green total factor productivity, resulting in a significant decline in the green transition index, which was at its lowest level among all regions during the same period.
The performance of IGT in the eastern region is not as good as that in the central region. Nearly 30% of the years were lower than the national average, especially in 2015, during which the index value was negative. This is due to the increase in industrial employment in Hebei and the reduction in the urban area, and the increase in energy consumption in Shanghai and the decrease in urban population. As a result, green total factor productivity declined. However, in 2017, the IGT of Hebei and Shanghai changed from negative to positive, which caused the performance of the eastern region to improve significantly.
The western region performed the worst, except in 2008, 2011 and 2016, which were lower than the national average. However, its fluctuation direction was in line with the national trend.
For the differences in the development of industrial green transformation levels in the eastern, central and western regions, the analysis is mainly from two aspects of urbanization and technological progress. On the one hand, the regional differences in China’s urbanization have shifted from north–south to coastal–inland, and the correlation between the population density and urbanization rate has been increasing, while population density has decreased sequentially from east to west [46]. Compared with the central and western regions, the eastern region has a higher coordination between urbanization and economic development [47]. The urbanization development level of a high administrative level is better than that of a low administrative level [48]. Large urban agglomerations and economic circles are mainly located in the eastern coastal areas, such that the green transformation industries of the east have development advantages. However, there is an inverted U-shaped relationship between urbanization and CO2 emissions in the central and western regions, while the eastern cities increase monotonically with urbanization [49], which provides the possibility for the green transformation of the eastern industry to be inferior to that of the central region. On the other hand, technology plays a key role in industrial green transformation, which can explain the results from the perspectives of TC and EC through exponential decomposition. Although the technical change levels of the three areas fluctuated, they showed an upward trend before 2015, and a slight downward trend since then. Among them, in the rising stage, the technical change level is the best in the middle and the worst in the west, while in the falling stage, there is an overall reversal of the change. In terms of technical efficiency, the efficiency of the central region was the lowest before 2015, and the efficiency trends of the eastern and western regions were the same. After 2015, the technical efficiency of the central region increased to a level which was higher than that of the other regions. Unlike production technology, digital technology can be used to monitor production for the promotion of industrial green transformation. The use of big data to analyze economic behavior and effects can provide data support for decision makers to adjust production technology in time [50].
Based on the above analysis, it can be seen that the results of regional differences in industrial green transformation reflect the fact that the urbanization process can provide a large amount of technical talent, funding and policy support for the promotion of industrial green transformation. However, if the technology utilization efficiency and the realization of technology application transformation are ignored in the system operation, especially the latter, it will not be able to smoothly promote the green transformation of the industry.

3.2. Analysis of Spatial–Temporal Evolution and Regional Differences

3.2.1. Kernel Density Estimation Analysis

As shown in Figure 3, the peak of the kernel density curve of the IGT gradually moves from negative to positive to the right over time. Additionally, the overall data distribution shows a trend of widening gaps. From a national perspective, the period from 2007 to 2017 is divided into two stages. In the process of the continuous range in the improvement of the green transformation performance of the industrial economy, the peak movement in the second half is smaller than that in the first half. Moreover, the peak height changes from falling to rising, and the width of the curve becomes narrow.
The overall rightward shift of the peaks of the kernel density curves in the eastern and western regions is similar. Moreover, the peak heights generally slide from high to low, with the width becoming larger. Except for 2013 in the eastern region, the peaks in 2007–2009, 2009–2015, and 2015–2017 shifted to the right in all of the stages. At the same stage, the height of the wave crest decreased, and the width expanded. That is, the level of IGT in the eastern region continued to grow, and the disparity within the region gradually widened. The moving stages of the peaks of the kernel density curve in the western region are staggered with the eastern regions in 2007–2011, 2011–2015, and 2015–2017. However, its height changes less, except for in 2007 and 2017, while its width is larger. That is, the IGT in the western region has long been in a state of development, with a large gap.
The central region kernel density curve is different from those of the eastern and western regions. Its peak shift is smaller, and the overall change in height from rising to falling is also smaller. The width of each curve is similar to the early transition period of the eastern and western regions; that is, although the level of IGT in the central region is relatively balanced, the improvement effect is relatively low.

3.2.2. σ Convergence Analysis

In Figure 4, during the entire time period from 2007 to 2017, the national σ coefficient continued to rise. The regional differences in the IGT became larger, and there was no σ convergence in general. However, the σ coefficient continued to decrease from 2008 to 2011, and the σ converged only during this period. Furthermore, in each region, there is no σ convergence. The gap in the level of industrial green development within the region has widened, especially in the eastern region. The change in the σ coefficient in the western region is relatively stable, and it only increased sharply in 2017. However, the decline in the σ coefficient in the central region from 2015 to 2017 shows that the IGT has shifted to a development trend of σ convergence.

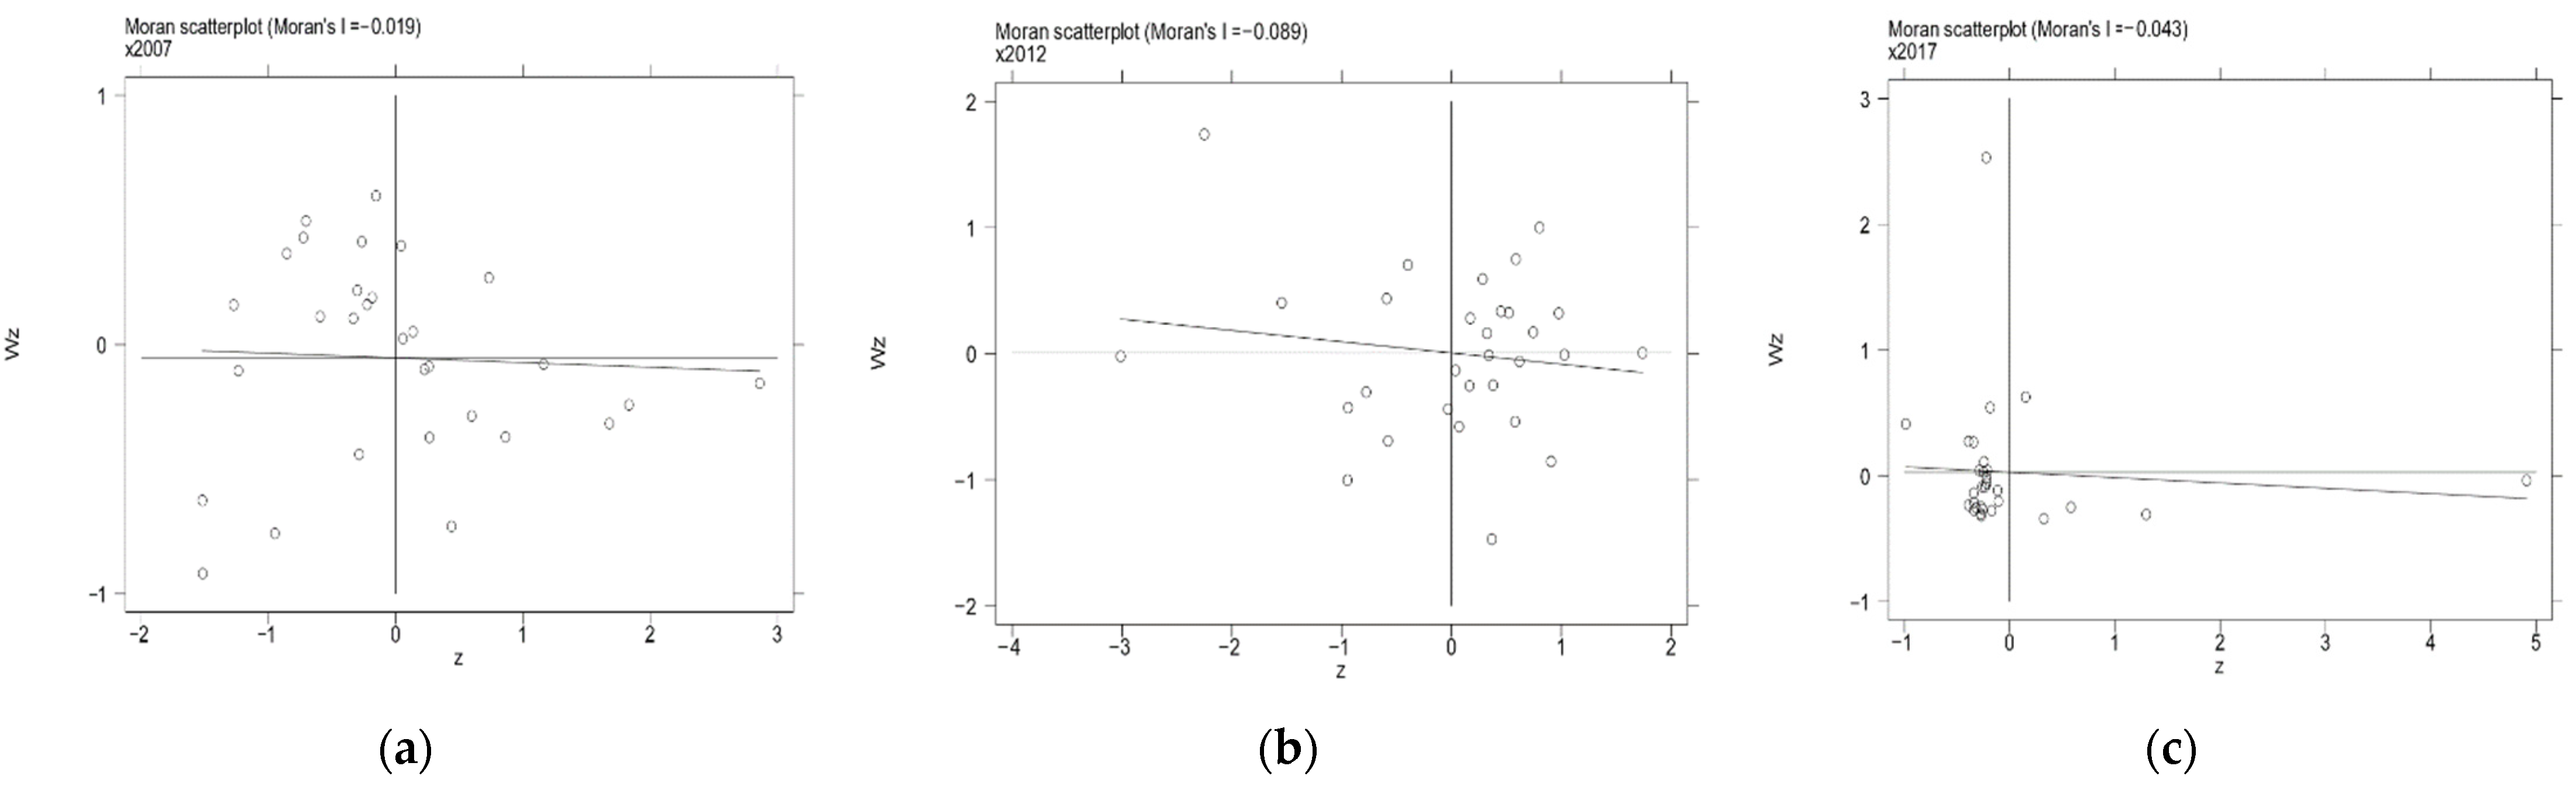
3.2.3. Spatial Correlation Analysis of IGT

The global Moran’s I index of China’s IGT is positive except in three years, showing a positive spatial correlation. However, some years did not pass the p value test, such that the development of the spatial agglomeration effect of industrial green transformation has not yet stabilized. On the one hand, based on the close relationship between urbanization and industrialization, the global spatial correlation analysis of land and population urbanization is also carried out. The Moran’s I index for the urbanization of the land and population across the country is positive, but again does not show significant spatial correlation. On the other hand, combined with the kernel density estimation and σ convergence analysis, the gap in the green transition level of the industrial economy shows a greater trend. Therefore, from the perspective of these two aspects, the development of industrial green transformation has not yet formed a regular spatial effect. This requires further in-depth exploration from the local spatial correlation.
The local spatial relationship of the national IGT is shown in Figure 5. The local Moran’s I index has a negative–positive alternating trend, with consecutive positive values for no more than 2 years. Compared with agglomeration, it is more often manifested as differential dispersion.
The distribution of the Moran’s scatter plot shows that the high–high value areas of the IGT mainly include Shanghai, Jiangsu, Zhejiang, Shandong, Henan and Heilongjiang. On the other hand, the low–low value areas include Anhui, Hubei, Jiangxi, Chongqing, Guizhou, Ningxia, and Xinjiang. The low–high value areas include Beijing and Inner Mongolia, and the high–low value areas include Tianjin, Hebei, Fujian, Hainan, Hunan, Sichuan, and Yunnan. Among them, provinces with large differences in IGT from neighboring provinces are mostly located in the eastern region, and most of the high–high value agglomerations are also located in this region. In particular, Shanghai, Jiangsu, and Zhejiang in the Yangtze River Delta Economic Zone, which have undergone synchronous transformation in the later period, have obvious spatial agglomeration. In addition, in 2010, the ‘Guiding Opinions on Undertaking Industrial Transfer in the Central and Western Regions’ was issued. Therefore, due to the impact of industrial transfer, low–low value agglomerations are mostly located in the central and western regions, and the undertakings of industry and the environment need to be improved.
Taken together, the above three methods present the differences in the time evolution and spatial distribution of the industrial green transition in the eastern, central and western regions. Unlike the high mobility of the population, in the case of a certain land area in each province, the land use area is planned according to its function. Urbanization has led to the continuous expansion of production land, but the goal of green development has put forward requirements for the maintenance of ecological land [51]. For the eastern region, most are provinces with rapid urbanization development, especially as Shanghai and Beijing are the most developed cities; their urbanized land area reached the maximum in the early stage. The urbanized land area in other provinces had less space for growth during the study period. Moreover, even though the urbanized population base in the eastern region is large, it is still rising steadily. For the central region, although the urban land area and population are not as good as those in the eastern region, its development status is different from the non-intersecting trend of the eastern region. Within the region, there is a phenomenon of catching up with each other, so that there is a relatively balanced level of green transition among the provinces. For the western region, the urbanization of the land and population is largely concentrated in the low development level, and the growth is slow. As a large population can provide more technical talents, a large urban land area can provide more sites for infrastructure and more roads can be built to promote the flow and integration of resources. Thus, there is a siphon effect in the eastern region, which makes the transformation within the region very different. The central region is relatively balanced. The western region is a scarcely populated area, making the transformation changes more gentle and spatially dispersed.

4. Conclusions

The coupled and coordinated development of land and population urbanization based on geographic space can not only produce growth effects on the economy but can also promote the improvement of the quality of the ecological environment, thereby promoting the green transformation of the industrial economy. This paper uses the adjusted directional distance function and the GML to measure the IGT in the urbanization process of 30 provinces in China from 2007 to 2017. We analyzed its spatial and temporal evolution trends and the associated characteristics of its spatial distribution, and evaluated the green transformation status of the industrial economy in each province in the process of urbanization development. The following conclusions are drawn from this:
(1)
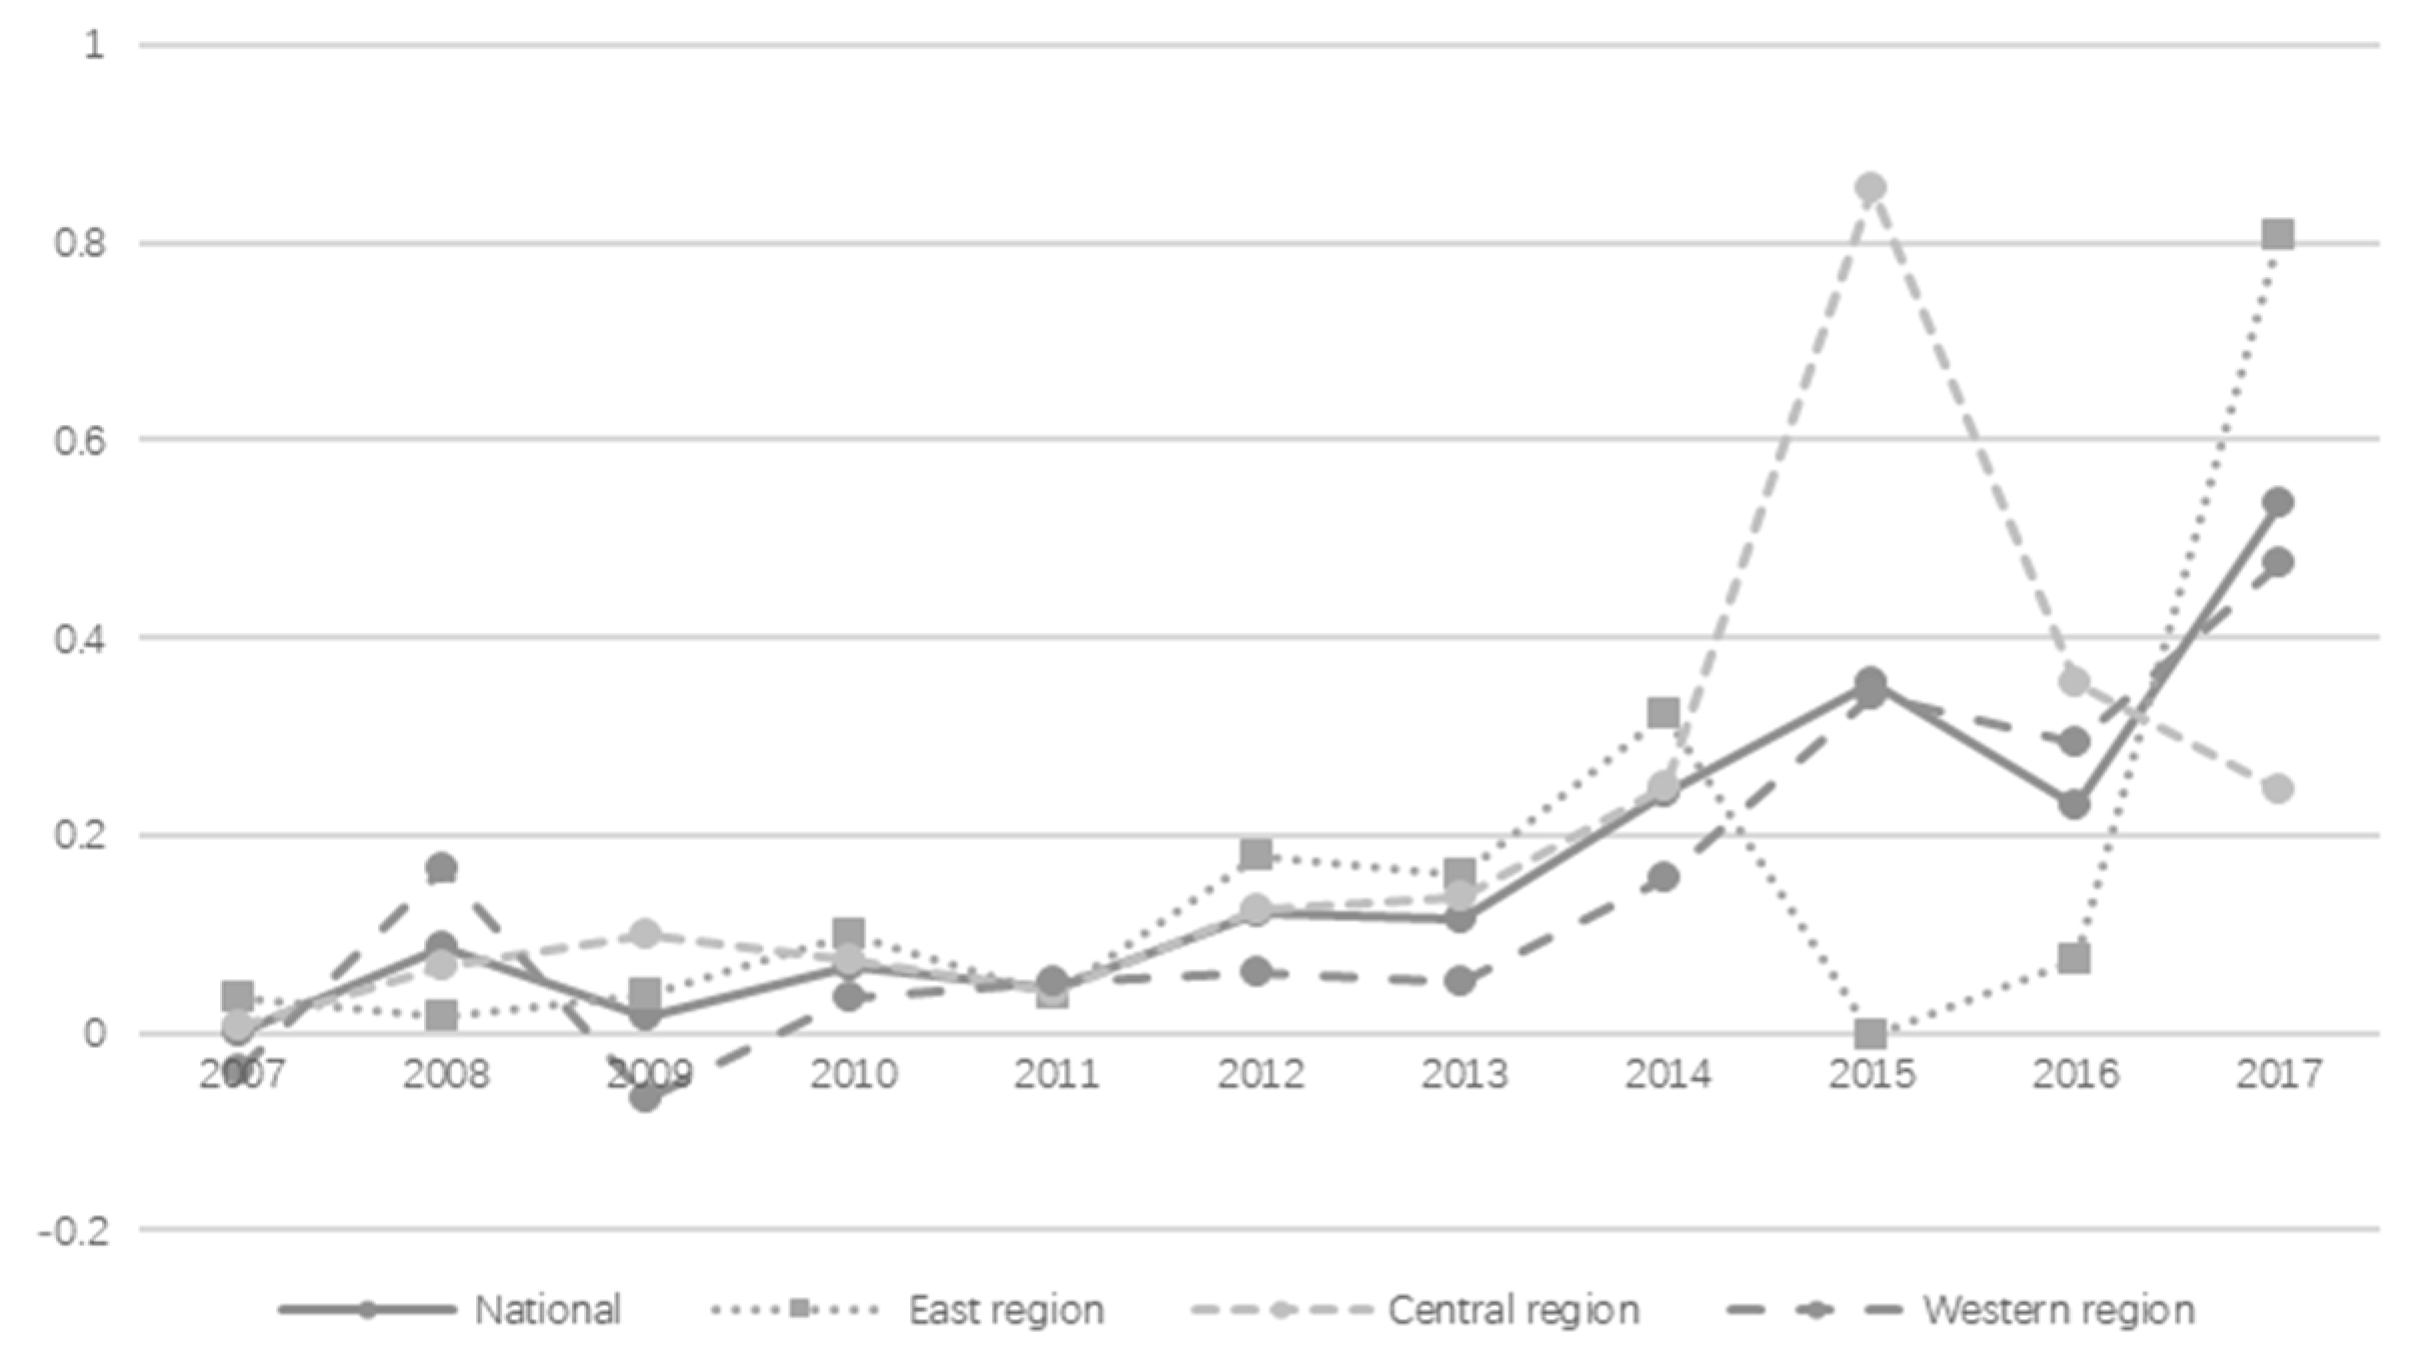
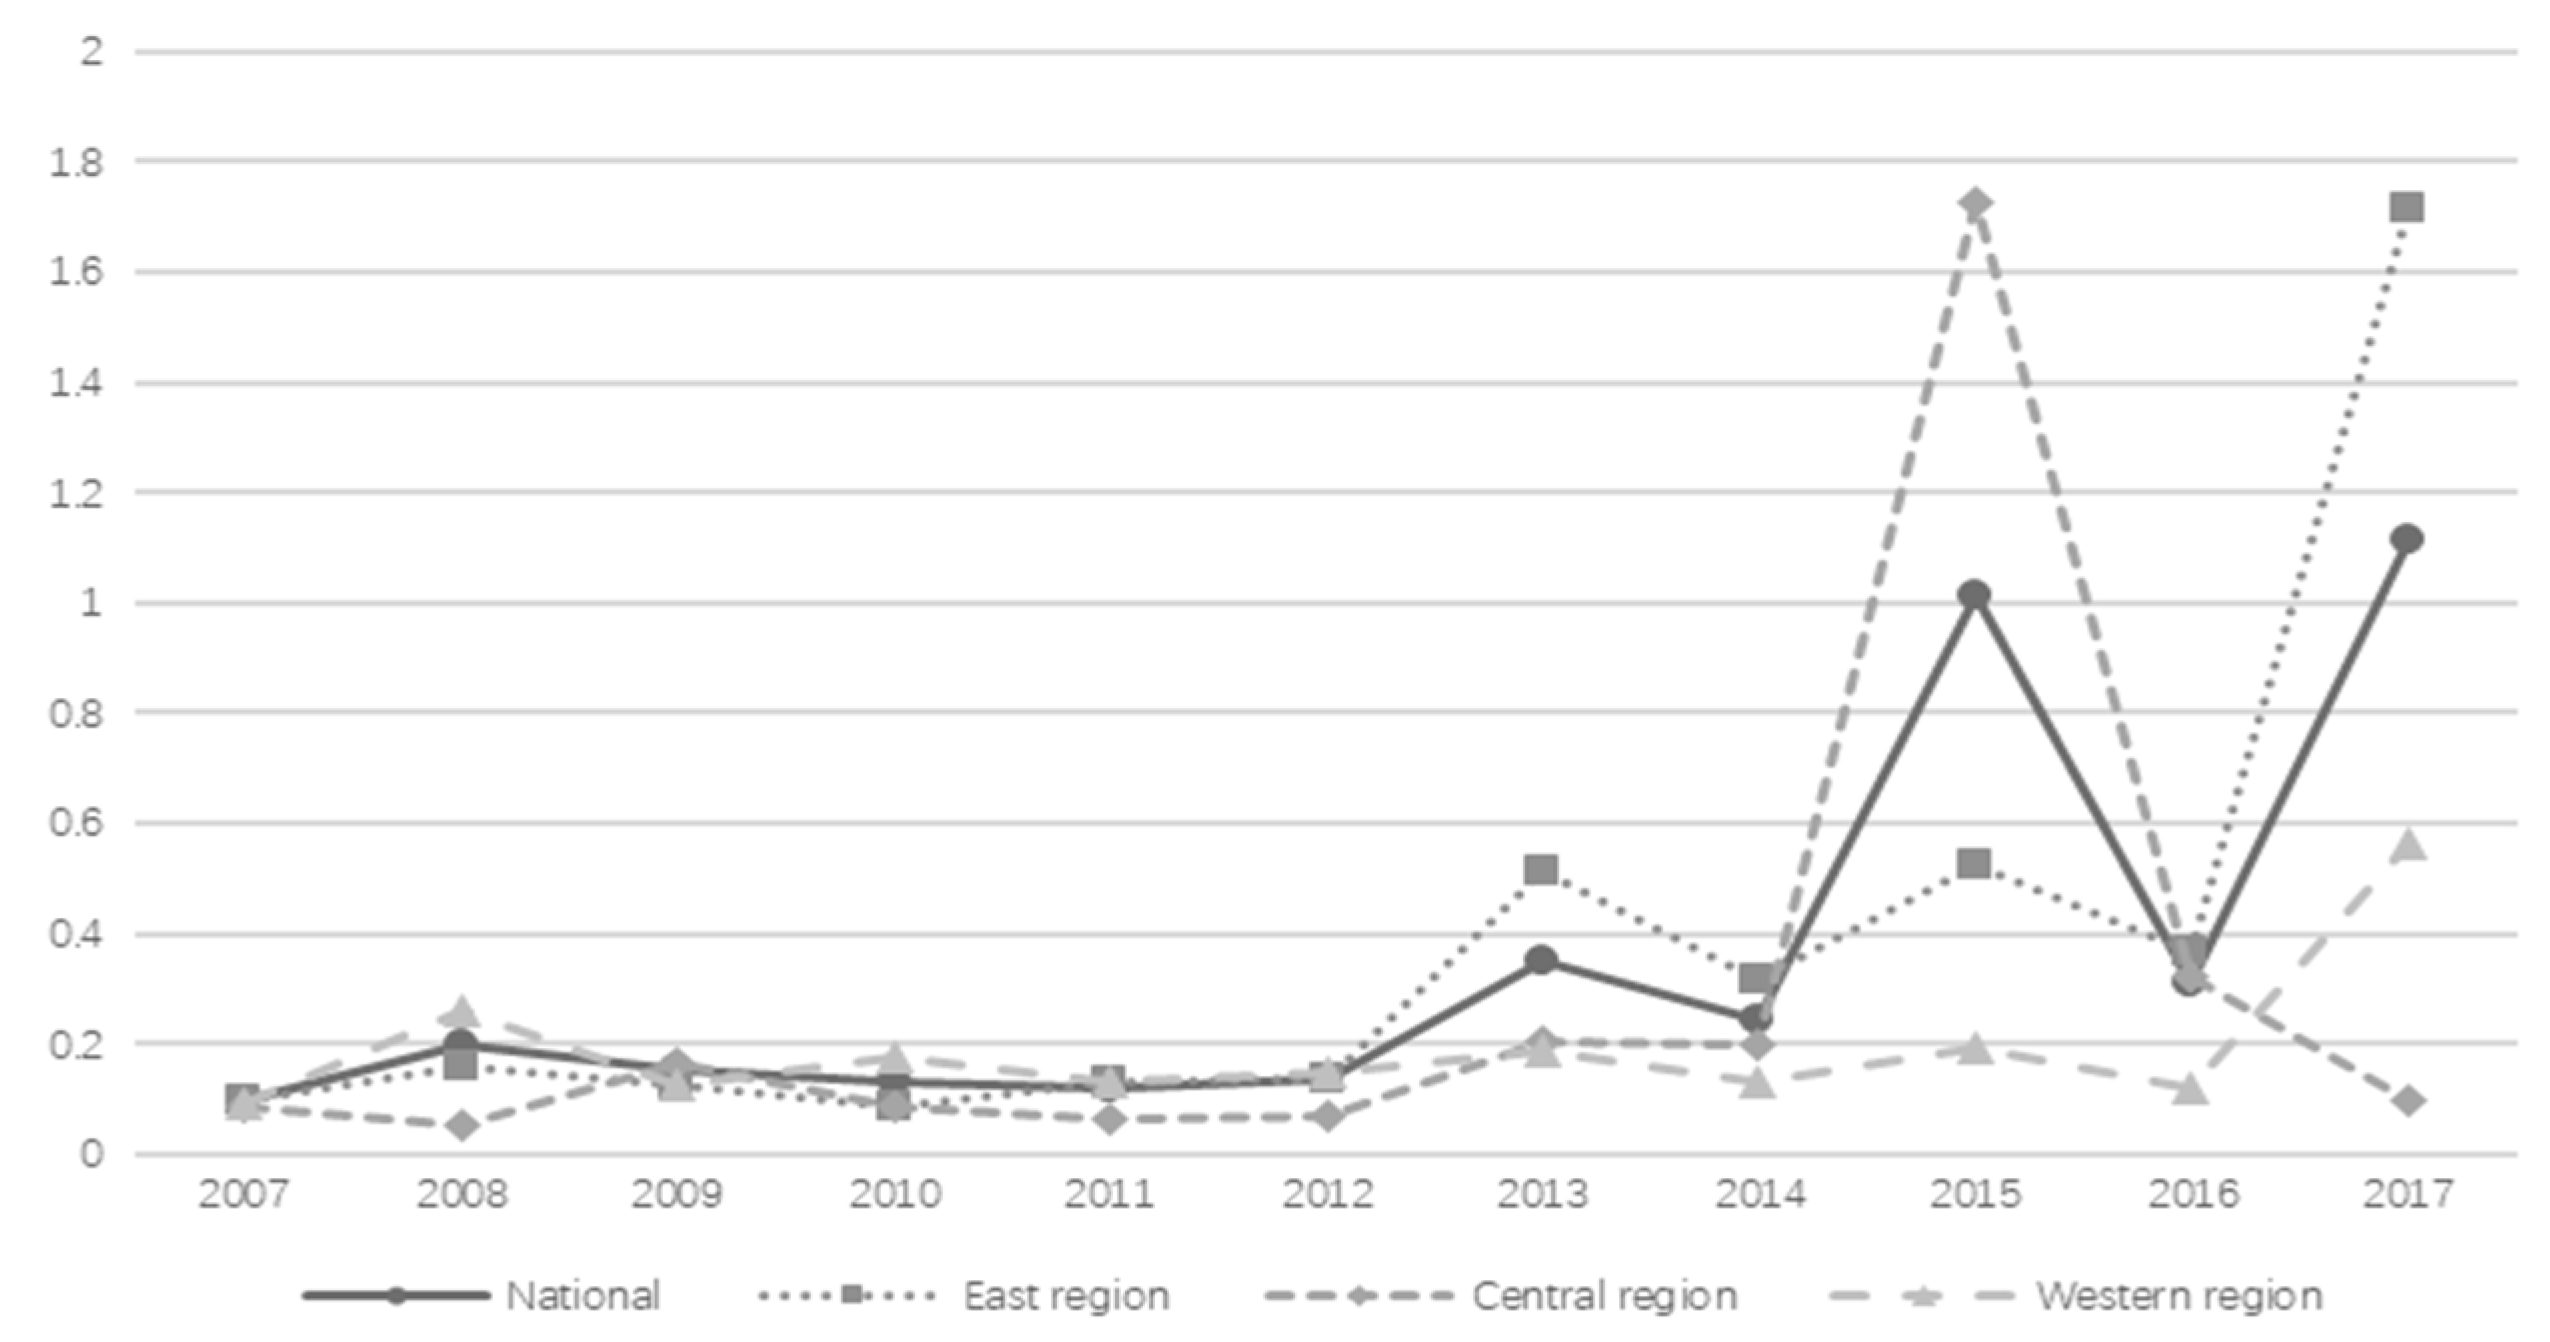
Under the background of the urbanization process, China’s industrial economy’s green transformation performance has been continuously improved. The changes in the IGT are staged, and show a leaping upward trend. In terms of space, the growth effect in the central region is the best, followed by that in the eastern region. The western region lags behind.
(2)
The kernel density curve and σ coefficient show that although the green transformation level of the eastern industry is continuously improving, the internal gap is gradually widening. The west has been in a state of development with a large gap for a long time. Although the level of transformation in the central region is relatively balanced, the improvement effect is relatively low.
(3)
The local Moran’s I index shows more negative spatial correlation, with significant differences in the neighboring provinces. The high values are mostly concentrated in the eastern region, and the differences within the region are obvious. Low values are mostly concentrated in the central and western regions, which are more balanced than those in the east.
The main purpose of this paper was to explore the impact of urbanization on the assessment results of industrial green transition, and whether there are different conclusions regarding regional performance. Without considering the factors of urbanization, the efficiency of China’s industrial green transformation in the eastern coastal areas is the highest, followed by the northern regions being higher than the southern regions [37]. In addition, regarding the decreasing green development efficiency in the eastern, central, and western regions, from the perspective of urban agglomerations the scope of the data is only limited to cities, rather than incorporating the urbanization development status into the evaluation system [18]. In this paper, this was taken into account in the evaluation index, resulting in different evaluation results. This provides a new perspective for researchers to focus on the symbiotic relationship between urbanization and industrialization, and to explore new driving forces and paths for industrialization transformation. Moreover, developed countries have a longer history and richer development experience of industrialization and urbanization than developing countries. For developing countries, it is possible to examine and absorb the effects of industrial green transformation under the process of urbanization in developed countries. Then, we can understand the level of industrial green transformation based on their own urbanization development status, so as to explore more effective transformation paths based on the analysis of influencing factors.
Based on the above analysis conclusions, in order to enhance the coupling and coordinated development of urbanization and industrialization, the policy implications are as follows. Firstly, technological efficiency and technological progress play key roles in promoting the green transformation of the industry. In the production process, technological innovation, application and transformation must be strengthened in order to promote the green transformation. Then, there are obvious regional differences in industrial green transformation, and in order to achieve the balanced development of regional integration, it is necessary to promote the construction of innovative modern industrial clusters and green recycling demonstration parks, and to plan rationally the industrial layout and promote the transfer of industries in the central and western regions. Finally, regarding the development of urbanization, it is necessary to improve the incentive mechanism for various social service guarantees in the eastern region with a high degree of urbanization, and to improve the horizontal and vertical mobility of talents. At the same time, the expansion of urban areas and the population scale in the central and western regions must be promoted, thereby providing support for the improvement of the level of industrial green transformation.
The research of this paper can also highlight the following prospects. In order to promote the industrial green transformation, circular economy is an effective method for sustainable development. Resource utilization efficiency and cleaner production can be improved through recycling and reuse [52]. The relevant resources in the bioeconomy, such as biomethane, provide the possibility for the realization of the circular economy [53]. Considering the industrial symbiosis system and waste recycling, a multi-stage network model can be constructed to evaluate the industrial green transformation, which is more in line with the actual situation of the production system.

Author Contributions

J.-P.Y. and F.-Q.Z. contributed to conceptualization, formal analysis, investigation, methodology, writing—original draft, and writing—review and editing. All authors have read and agreed to the published version of the manuscript.

Funding

This research received no external funding.

Institutional Review Board Statement

Not applicable.

Informed Consent Statement

Not applicable.

Data Availability Statement

Not applicable.

Conflicts of Interest

The authors declare no conflict of interest.

References

  1. Yang, Z.B.; Shao, S.; Yang, L.L.; Miao, Z. Improvement pathway of energy consumption structure in China’s industrial sector: From the perspective of directed technical change. Energy Econ. 2018, 72, 166–176. [Google Scholar] [CrossRef]
  2. Shao, S.A.; Luan, R.R.; Yang, Z.B.; Li, C.Y. Does directed technological change get greener: Empirical evidence from Shanghai’s industrial green development transformation. Ecol. Indic. 2016, 69, 758–770. [Google Scholar] [CrossRef]
  3. Institute of Industrial Economics CASS; Li, P. A study on the green transformation of Chinese industry. China Ind. Econ. 2011, 4, 5–14. [Google Scholar]
  4. Mao, W.X.; Wang, W.P.; Sun, H.F. Driving patterns of industrial green transformation: A multiple regions case learning from China. Sci. Total Environ. 2019, 697, 134134. [Google Scholar] [CrossRef] [PubMed]
  5. Pegels, A.; Lutkenhorst, W. Is Germany’s energy transition a case of successful green industrial policy? Contrasting wind and solar PV. Energy Policy 2014, 74, 522–534. [Google Scholar] [CrossRef] [Green Version]
  6. Xie, W.C.; Yan, T.H.; Xia, S.M.; Chen, F.Z. Innovation or introduction? The impact of technological progress sources on industrial green transformation of resource-based cities in China. Front. Energy Res. 2020, 8, 598141. [Google Scholar] [CrossRef]
  7. Wu, H.T.; Hao, Y.; Ren, S.Y. How do environmental regulation and environmental decentralization affect green total factor energy efficiency: Evidence from China. Energy Econ. 2020, 91, 104880. [Google Scholar] [CrossRef]
  8. Li, H.J.; Li, B. The threshold effect of environmental regulation on the green transition of the industrial economy in China. Econ. Res.-Ekon. Istraživanja 2019, 32, 3128–3143. [Google Scholar] [CrossRef] [Green Version]
  9. Ouyang, X.L.; Li, Q.; Du, K.R. How does environmental regulation promote technological innovations in the industrial sector? Evidence from Chinese provincial panel data. Energy Policy 2020, 139, 111310. [Google Scholar] [CrossRef]
  10. Han, D.R.; Li, T.C.; Feng, S.S.; Shi, Z.Y. Does renewable energy consumption successfully promote the green transformation of China’s industry? Energies 2020, 13, 229. [Google Scholar] [CrossRef] [Green Version]
  11. Shao, S.; Yang, Z.B.; Yang, L.; Ma, S. Can China’s energy intensity constraint policy promote total factor energy efficiency? Evidence from the industrial sector. Energy J. 2019, 40, 101–127. [Google Scholar] [CrossRef]
  12. Lv, X.F.; Lu, X.L.; Fu, G.; Wu, C.Y. A spatial-temporal approach to evaluate the dynamic evolution of green growth in China. Sustainability 2018, 10, 2341. [Google Scholar] [CrossRef] [Green Version]
  13. Song, L.; Zhou, X.L. Does the green industry policy reduce industrial pollution emissions?—Evidence from China’s national eco-industrial park. Sustainability 2021, 13, 6343. [Google Scholar] [CrossRef]
  14. Li, T.H.; Ma, J.H.; Mo, B. Does environmental policy affect green total factor productivity? Quasi-natural experiment based on China’s air pollution control and prevention action plan. Int. J. Environ. Res. Public Health 2021, 18, 8216. [Google Scholar] [CrossRef] [PubMed]
  15. Cui, H.R.; Lui, Z.L. Spatial-temporal pattern and influencing factors of the urban green development efficiency in Jing-Jin-Ji region of China. Pol. J. Environ. Stud. 2021, 30, 1079–1093. [Google Scholar] [CrossRef]
  16. Guo, K.L.; Li, S.X.; Wang, Z.Q.; Shi, J.R.; Bai, J.; Cheng, J.H. Impact of regional green development strategy on environmental total factor productivity: Evidence from the Yangtze River Economic Belt, China. Int. J. Environ. Res. Public Health 2021, 18, 2496. [Google Scholar] [CrossRef]
  17. Liu, T.; Li, Y. Green development of China’s Pan-Pearl River Delta mega-urban agglomeration. Sci. Rep. 2021, 11, 15717. [Google Scholar] [CrossRef] [PubMed]
  18. Zhou, L.; Zhou, C.H.; Che, L.; Wang, B. Spatio-temporal evolution and influencing factors of urban green development efficiency in China. J. Geogr. Sci. 2020, 30, 724–742. [Google Scholar] [CrossRef]
  19. Meng, G.F.; Guo, Z.; Li, J.L. The dynamic linkage among urbanisation, industrialisation and carbon emissions in China: Insights from spatiotemporal effect. Sci. Total Environ. 2021, 760, 144042. [Google Scholar] [CrossRef] [PubMed]
  20. Guo, J.; Xu, Y.Z.; Pu, Z.N. Urbanization and its effects on industrial pollutant emissions: An empirical study of a Chinese case with the spatial panel model. Sustainability 2016, 8, 812. [Google Scholar] [CrossRef] [Green Version]
  21. Sarwar, S.; Alsaggaf, M.I. Role of urbanization and urban income in carbon emissions: Regional analysis of China. Appl. Ecol. Env. Res. 2019, 17, 10303–10311. [Google Scholar] [CrossRef]
  22. Sun, W.; Huang, C.C. How does urbanization affect carbon emission efficiency? Evidence from China. J. Clean. Prod. 2020, 272, 122828. [Google Scholar] [CrossRef]
  23. Liu, X.H. Impact of urbanization on energy consumption and haze in China—A review. Energy Source Part A Recovery Util. Environ. Eff. 2019, 4, 1648601. [Google Scholar] [CrossRef]
  24. Zhang, D.; Wang, Z.Q.; Li, S.C.; Zhang, H.W. Impact of land urbanization on carbon emissions in urban agglomerations of the middle reaches of the Yangtze River. Int. J. Environ. Res. Public Health 2021, 18, 1403. [Google Scholar] [CrossRef] [PubMed]
  25. Zhang, T.F.; Song, Y.; Yang, J. Relationships between urbanization and CO2 emissions in China: An empirical analysis of population migration. PLoS ONE. 2021, 16, e0256335. [Google Scholar] [CrossRef] [PubMed]
  26. Zhang, G.L.; Zhang, N.; Liao, W.M. How do population and land urbanization affect CO2 emissions under gravity center change? A spatial econometric analysis. J. Clean. Prod. 2018, 202, 510–523. [Google Scholar] [CrossRef]
  27. Wang, Y.N.; Luo, X.Y.; Chen, W.; Zhao, M.J.; Wang, B.W. Exploring the spatial effect of urbanization on multi-sectoral CO2 emissions in China. Atmos. Pollut. Res. 2019, 10, 1610–1620. [Google Scholar] [CrossRef]
  28. Xu, S.C.; Miao, Y.M.; Gao, C.; Long, R.Y.; Chen, H.; Zhao, B.; Wang, S.X. Regional differences in impacts of economic growth and urbanization on air pollutants in China based on provincial panel estimation. J. Clean. Prod. 2019, 208, 340–352. [Google Scholar] [CrossRef]
  29. Li, Q.Y.; Zeng, F.E.; Liu, S.H.; Yang, M.A.; Xu, F. The effects of China’s sustainable development policy for resource-based cities on local industrial transformation. Resour. Policy 2020, 71, 101940. [Google Scholar] [CrossRef]
  30. Tang, M.G.; Li, Z.; Hu, F.X.; Wu, B.J. How does land urbanization promote urban eco-efficiency? The mediating effect of industrial structure advancement. J. Clean. Prod. 2020, 272, 122798. [Google Scholar] [CrossRef]
  31. Lin, S.F.; Sun, J.; Marinova, D.; Zhao, D.T. Effects of population and land urbanization on China’s environmental impact: Empirical analysis based on the extended STIRPAT model. Sustainability 2017, 9, 825. [Google Scholar] [CrossRef] [Green Version]
  32. Hou, J.; Teo, T.; Zhou, F.L.; Lim, M.K.; Chen, H. Does industrial green transformation successfully facilitate a decrease in carbon intensity in China? An environmental regulation perspective. J. Clean. Prod. 2018, 184, 1060–1071. [Google Scholar] [CrossRef]
  33. Kuai, P.; Li, W.; Cheng, R.H.; Cheng, G. An application of system dynamics for evaluating planning alternatives to guide a green industrial transformation in a resource-based city. J. Clean. Prod. 2015, 104, 403–412. [Google Scholar] [CrossRef]
  34. Lai, A.L.; Yang, Z.H.; Cui, L.B. Market segmentation impact on industrial transformation: Evidence for environmental protection in China. J. Clean. Prod. 2021, 297, 126607. [Google Scholar] [CrossRef]
  35. Gu, B.B.; Chen, F.; Zhang, K. The policy effect of green finance in promoting industrial transformation and upgrading efficiency in China: Analysis from the perspective of government regulation and public environmental demands. Environ. Sci. Pollut. Res. 2021, 28, 47474–47491. [Google Scholar] [CrossRef] [PubMed]
  36. Feng, M.; Yan, Y.F.; Li, X.H. Measuring the efficiency of industrial green transformation in China. J. Sci. Ind. Res. 2019, 78, 495–498. [Google Scholar]
  37. Fu, J.P.; Xiao, G.R.; Guo, L.L.; Wu, C.Y. Measuring the dynamic efficiency of regional industrial green transformation in China. Sustainability 2018, 10, 628. [Google Scholar] [CrossRef] [Green Version]
  38. Shi, X.Q.; Wang, X.; Chen, P. A network-based approach for analyzing industrial green transformation: A case study of Beijing, China. J. Clean. Prod. 2021, 317, 128281. [Google Scholar] [CrossRef]
  39. Gatto, F.; Daniotti, S.; Re, I. Driving Green Investments by Measuring Innovation Impacts. Multi-Criteria Decision Analysis for Regional Bioeconomy Growth. Sustainability 2021, 13, 1709. [Google Scholar] [CrossRef]
  40. Chung, Y.H.; Färe, R.; Grosskopf, S. Productivity and undesirable outputs: A directional distance function approach. J. Environ. Manag. 1997, 51, 229–240. [Google Scholar] [CrossRef] [Green Version]
  41. Oh, D.H. A global Malmquist-Luenberger productivity index. J. Product. Anal. 2010, 34, 183–197. [Google Scholar] [CrossRef]
  42. Cheng, G.; Zervopooulos, P.D. Estimating the technical efficiency of health care systems: A cross-country comparison using the directional distance function. Eur. J. Oper. Res. 2014, 238, 899–910. [Google Scholar] [CrossRef] [Green Version]
  43. Bin, L.I.; Peng, X.; Ouyang, M.K. Environmental regulation, green total factor productivity and the transformation of China’s industrial development mode—Analysis based on data of China’s 36 industries. China Ind. Econ. 2013, 4, 56–68. [Google Scholar]
  44. Zhang, J.; Wu, G.Y.; Zhang, J.P. The estimation of China’ s provincial capital stock: 1952–2000. Econ. Res. J. 2004, 10, 35–44. [Google Scholar]
  45. Young, A. Gold into base metals: Productivity growth in the People’s Republic of China during the reform period. J. Polit. Econ. 2000, 111, 1220–1261. [Google Scholar] [CrossRef] [Green Version]
  46. Li, J.M.; Yang, Y.; Fan, J.; Jin, F.J.; Zhang, W.Z.; Liu, S.H.; Fu, B.J. Comparative research on regional differences in urbanization and spatial evolution of urban systems between China and India. J. Geogr. Sci. 2018, 28, 1860–1876. [Google Scholar]
  47. Wang, X.X. Empirical Analysis of the Rationality of China’s Urbanization Level on National and Regional Levels. J. Urban Plan Dev. 2017, 143, 04016035. [Google Scholar] [CrossRef]
  48. Zhong, L.N.; Li, X.N.; Law, R.; Sun, S. Developing Sustainable Urbanization Index: Case of China. Sustainability 2020, 12, 4585. [Google Scholar] [CrossRef]
  49. Xu, S.C.; He, Z.X.; Long, R.Y.; Shen, W.X.; Ji, S.B.; Chen, Q.B. Impacts of economic growth and urbanization on CO2 emissions: Regional differences in China based on panel estimation. Reg. Environ. Change 2016, 16, 777–787. [Google Scholar] [CrossRef]
  50. D’Amico, G.; Arbolino, R.; Shi, L.; Yigitcanlar, T.; Ioppolo, G. Digital technologies for urban metabolism efficiency: Lessons from urban agenda partnership on circular economy. Sustainability 2021, 13, 6043. [Google Scholar] [CrossRef]
  51. Wei, C.; Lin, Q.; Yu, L.; Zhang, H.; Ye, S.; Zhang, D. Research on sustainable land use based on production–living–ecological function: A case study of Hubei province, China. Sustainability 2021, 13, 996. [Google Scholar] [CrossRef]
  52. Acerbi, F.; Sassanelli, C.; Terzi, S.; Taisch, M. A systematic literature review on data and information required for circular manufacturing strategies adoption. Sustainability 2021, 13, 2047. [Google Scholar] [CrossRef]
  53. D’Adamo, I.; Gastaldi, M.; Morone, P.; Rosa, P.; Sassanelli, C.; Settembre-Blundo, D.; Shen, Y. Bioeconomy of Sustainability: Drivers, Opportunities and Policy Implications. Sustainability 2022, 14, 200. [Google Scholar] [CrossRef]
Figure 1. Industrial green transformation (IGT) index and related indices.
Sustainability 14 04280 g001
Figure 2. National and regional IGT.
Sustainability 14 04280 g002
Figure 3. National and regional IGT kernel density curve. (a) National kernel density curve; (b) eastern region kernel density curve; (c) central region kernel density curve; (d) western region kernel density curve.
Sustainability 14 04280 g003
Figure 4. National and regional σ coefficients.
Sustainability 14 04280 g004
Figure 5. Moran’s scatter plot of the IGT in each province. (a) Moran’s scatter plot in 2007; (b) Moran’s scatter plot in 2012; (c) Moran’s scatter plot in 2017.
Sustainability 14 04280 g005
Table 1. Global Malmquist–Luenberger (GML) index from 2007 to 2017.
Excluding UrbanizationIncluding Urbanization Excluding UrbanizationIncluding Urbanization
20071.02161.000620131.02411.0124
20081.02091.012220141.02531.0201
20091.02100.999220151.02301.0218
20101.02881.011320161.02061.0195
20111.02631.006820171.02211.0194
20121.02711.0140///
Publisher’s Note: MDPI stays neutral with regard to jurisdictional claims in published maps and institutional affiliations.

