Abstract
Social media platforms such as Facebook have been a crucial web traffic source for content providers. Content providers build websites and apps to publish their content and attract as many readers as possible. More readers mean more influence and revenue through advertisement. As Internet users spend more and more time on social media platforms, content websites also create social media presence, such as Facebook pages, to generate more traffic and thus revenue from advertisements. With so much content competing for limited real estate on social media users’ timelines, social media platforms begin to rank the contents by user engagements of previous posts. Posting content to social media that receives little user interaction will hurt the content providers’ future presence on social media. Content websites need to consider business sustainability when utilizing social media, to ensure that they can respond to short-term financial needs without compromising their ability to meet their future needs. The present study aims to achieve this goal by building a model to predict the advertisement revenue, which is highly correlated with user engagements, of an intended social media post. The study examined combinations of classification methods and data resampling techniques. A content provider can choose the combination that suits their needs by comparing the confusion matrices. For example, the XGBoost model with undersampled data can reduce the total post number by 87%, while still making sure that 49% of the high-performance posts will be posted. If the content provider wants to make sure more high-performance posts are posted, then they can choose the DNN(Deep Neural Network) model with undersampled data to post 66% of high-performance posts, while reducing the number of total posts by 69%. The study shows that predictive models could be helpful for content providers to balance their needs between short-term revenue income and long-term social media presence.
1. Introduction
The Internet has become the primary source for users to obtain news and information. According to the “Taiwan Internet Report 2020” [1] from the Taiwan Network Information Center, among Internet users older than 12 years old, 83.0% have access to the Internet, and 79.3% of them connect to the Internet wirelessly. A proportion of 77.0% of wireless Internet users use a mobile Internet service, while 27.3% use public WIFI service. Furthermore, for the Internet users older than 12 years, most devices used are mobile phones, comprising 82.9%. Content providers play a crucial role in four of the five most-used Internet services in Taiwan, which are instant messengers (95.6%), news (80.3%), forums (80.1%), social media (80.1%), and video streaming (77.0%). Content plays a crucial role in all those applications and can be produced either by professionals (such as news agencies) or regular Internet users. Content is the catalyst to trigger conversations, even for services facilitating communication between people.
Nonetheless, content providers also need to profit from their production to survive, and advertisements are an essential source of income. Advertisement networks act as brokers between content websites and vendors that need to advertise. The most notable example of such services is Google AdSense [2]. Google AdSense scan through the websites registered and serve matched advertisements to the readers on the content websites. When the users see advertisements or click on them, the content websites are paid. However, Internet users nowadays heavily rely on social media platforms to gain information. For example, using news services is one of the top usages of the Internet, according to the “Digital News Report 2016” from the Reuters Institute’s “The Study of Journalism”. However, 51% of Internet users read news from social media, not from the websites or apps hosted by the news service themselves. In particular, 68% of users between 18 and 24 years old regard social media as a primary source of news [3]. Since social media is the primary traffic source for content providers, it is crucial for content websites to know what and how to post on social media to direct the reader to their websites or apps.
As more content websites compete for exposure using their social media accounts, obtaining significant traffic directed from social media is challenging. Some social media platforms have developed ways to rank the content to enhance users’ experience. Facebook, for example, uses “meaningful interaction” to determine if a posting from a Facebook account should reach a specific user [4]. If postings from an account can not attract adequate interactions from its subscribers, then its ability to reach subscribers will decline over time, hurting its revenue from advertisement. Even on the platforms that do not throttle content exposure by algorithm, over-marketing may upset the users and hurt the brand long-term [5]. While it is tempting for content websites to market aggressively using social media for short-term profit, long-term survival is just as critical, if not more so. To achieve business sustainability [6], advertisement revenue prediction can help the content immensely by utilizing social media more efficiently while providing a better user experience. Predictive models can help the content website promote only the content with good potential to generate significant advertisement revenue using social media while improving the user experience. Currently, there are studies regarding social media and advertising [7], content-matched advertisement [2], and the use of data science in digital marketing [8], but there are no studies to date focussing on how content websites use social media to increase advertisement revenue. To explore the potential predictive features for advertisement revenue, we review the possible predictive features of advertisement revenue, not only from studies on social media, but also from studies of web content popularity, such as [9,10].
The research question of the current study is whether the development of advertisement revenue predictive models can help content websites utilize their social media presence to enhance their business sustainability. The study is organized as follows. In Section 2, we describe the research questions of the current study in detail. Related studies are reviewed in Section 3, including studies regarding content popularity, Google AdSense, and techniques to handle imbalanced data. Next, research methods are presented in Section 4, and the results of the research are described in Section 5. Section 6 discusses the paper, and Section 7 concludes the paper and outlines directions for future research. The contribution of this paper is as follows. First, to our knowledge, there has been no research attempting to predict the advertisement income of social media and web content. Second, working with an industrial partner enabled us to obtain real-world data from diverse data sources and is more applicable to the general content industry. Finally, we show that data mining can be used to improve social media posting efficiency.
2. Research Question
The research question of the current study is whether the development of advertisement revenue predictive models can help content websites utilize their social media presence to enhance their business sustainability. As described in Section 1, only a small portion of Internet content created is popular, and while it is tempting for content websites to promote every piece of content aggressively using social media, over-marketing can result in negative reactions from the users and the social media platform. Data science and data mining approaches are increasingly being used in digital marketing [8,11]. Predictive models can be a valuable tool to help content providers promote the content with an excellent chance to be popular to avoid over-marketing on social media. Content websites can then utilize their social media presence more sustainably.
3. Related Studies
In this section, we reviewed the related studies that helped us answer the research questions. First, studies regarding business sustainability were reviewed to highlight the importance of efficient social media usage in marketing practice. A brief introduction of the content-matched advertisement follows, followed by a survey showing that there are currently only a limited number of studies on the topic. Then, we reviewed past studies about social media engagement and web content popularity and looked into a series of potential determinants of advertisement revenue to help predict the advertisement revenue of a piece of content. Finally, the distribution of performance metrics of Internet services, such as engagement and popularity, is highly skewed and proved to be an obstacle in the model training process. We reviewed techniques to resample the datasets to ease the problem of data imbalance.
3.1. Business Sustainability and the Concern of Over-Marketing
“Sustainability” is commonly linked to concepts such as environmental protection and corporate social responsibility [6]. However, when we go back to its origin, sustainability is defined as development that “meets the needs of the present without compromising the ability of future generations to meet their own needs” [12]. In the context of business practices, the definition urges us to examine the short-term and long-term impacts of everyday operations. Following the logic, business sustainability can be defined as “the ability of firms to respond to their short-term financial needs without compromising their (or others’) ability to meet their future needs” [6]. As a crucial business function, marketing is also subject to this consideration.
For example, vendors tend to market aggressively to meet their short-term goals, but the practice could harm a business in the long run [5]. Brands of various industries, such as Coca-Cola and Google, enjoyed positive perceptions from their customers and faced declined approval due to excessive marketing activities. Therefore, a content website must avoid over-marketing, including social media usage. Besides with possible negative reactions from the users, social media platforms such as Facebook are reported to punish those media posts and apps developed by third-party developers with little user interaction by limiting future content exposure [13,14], making it even more important to post content efficiently.
3.2. Content-Matched Internet Advertisements
One of the most popular ways for web content providers to monetize is to put their content on the web and place advertisements along with it. The advertisements are usually served by third-party platforms that act as the middleman for the content website owners and the vendors that need to advertise. Google AdSense [2] is one of the most prominent advertisement networks. Content providers can register their websites with Google and create advertisement “slots” to place advertisements. On the other hand, Google aggregates advertisements demands and materials from their Google Ads service and places advertisements corresponding to the page contents. The assumption is that by placing advertisements that suit the site content well, the users will have a better experience reading the content. The users would better receive the advertisement.
From our investigation, only a few academic studies about Google AdSense are available, and none of them link directly to revenue generation. The most related study is [2], which investigates the relationship between advertisement awareness and the presentation of advertisements within blogs, including presentation elements, location, and color scheme. It concluded that high color contrast could lead to a higher recall of the advertisements, helping revenue generation. The other study [15] tries to clarify the critical success factor for a hit blog to continuously attract its readers using the AIDA (attention, interest, desire, and action) model, but again the study only addresses the issue from a theoretical perspective. Other literature mostly approaches Google AdSense from different perspectives, such as marketing education [16,17] or innovation study [18], which are less related to the research questions of the current study.
3.3. Content Features as Potential Determinants of Content Websites Advertisement Revenue
Since there is no existing study on advertisement revenue generation of content-matched advertisements, we broadened the search criteria to include studies on user engagement on social media and web content popularity. Advertisement revenue received by a web page is calculated from impressions of the advertisement, which is counted when the advertisement shows up on a web page and is clicked on. In the present study, the content was promoted through social media, and the resultant advertisement revenue is the result of a series of user interactions. It is reasonable to expect that the content features that can ignite user interaction will also affect advertisement revenue. The research question of the present study regards the relationship between the social media presence and the content-matched advertisement revenue of a content website. Equipped with raw data with a wide variety of features from an industrial partner, the research team used data science (or data mining) tools to approach the research question. As stated in [8], the primary goal of data science is to extract knowledge from data analysis to answer specific research questions [19] and to identify patterns in the data that are (i) not obvious and (ii) useful for companies [20]. Here, we surveyed related studies regarding social media performance and web popularity to learn about potential features to be used in the predictive models.
3.3.1. Predicting Social Media Performance
To identify social media post features that might contribute to the prediction of advertisement revenues on content websites, we surveyed the studies regarding social media performance. The current studies mainly focus on social medias’ influence on brand building [7,11,21]. Some features are determined before publishing, such as posting time and textual features of the content; some are only available after publishing, such as the user interactions in the first hour. The intention of [11] is similar to the present study, as it also seeks to support a manager’s decision about whether to publish a specific social media post, using the features that are available before publication. The features used are the ones that are available through the “Facebook Insight” tool, such as page total likes, media type, posting time, textual content, and total user interactions. Regression models were used to predict performance metrics from other features. The study concluded that data mining could be a helpful tool to assist decision making on social media usage.
Some studies aim to predict social media performance, but either use features that are only available after publishing [22] or used participant observation to draw insights [23]. Although less related to the goal of the present study, they can still provide some insights for brand builders that wish to leverage the power of social media. In [22], the researchers measured the number of likes, comments, and shares, as well as the time to the initial comment and first hour comment ratio. The study found that the engaging behaviors are related to the characteristics of the organizations that run the social media platform. Furthermore, it is found that the number of comments in the first hour is a good predictor for overall engagements, and while the findings are less useful for the present study, it is helpful to know that, if a social media post engages users, it will perform well soon after it is posted. Authors in [23] studied the behavior of the users on Tesco and Walmart Facebook fan pages using the Netnnogray method [21], which is a participant observation approach. The authors found that the users were cognitively, emotionally, and behaviorally engaged. However, the engagements do not always enhance the brand value. For example, frequent commercially oriented communication can hurt brand value. The insight is consistent with the objective of the present study: to predict user reaction before messages are sent would help maintain a good relationship with the users.
3.3.2. Predicting Web Content Popularity
From our investigation, the number of studies on web content popularity is significantly larger than those on Facebook fan pages and often provides potential features to predict content performance. Raw access data of a website is usually not accessible to the public. In this case, researchers would use metrics related to user interactions, such as the number of comments, rates, or shares [9], which also falls into the category of user engagements. Earlier studies regarding web content popularity tend to focus on the change of popularity over time, using comments [24], views of the video [25], and “diggs” [25] as popularity metrics. The studies found that the relationship distribution of popularity to time is log-linear [25], or a mixture of two log-normal distributions [24]. While the studies on popularity change over time are less related to the present study, there are studies [10] that do incorporate content posting time as predictive features. The inclusion is reasonable because, from observations, temporal features such as hours-in-a-day and days-in-a-week do impact the activity level of the Internet users [25].
Later studies used features that are available before publishing to predict content popularity, which is more related to the goal of the present study. Several studies used textual features in their prediction model. Authors in [26] used TF-IDF (term frequency–inverse document frequency score), results of LDA (latent Dirichlet allocation) topic model, and other features to predict retweets. Authors in [27] attempt to predict the volume of comments of news stories, which used features including TF (term frequency) and semantic features, such as numbers of location-type and person-type entities. Authors in [28] used the number of tweets to represent the popularity of news articles and engineered features such as category score, subjectivity, named entities, and source entity. The research concludes that the impact of subjectivity is limited. On the other hand, [29] stated that expression of strong emotion tends to make content go viral, endorsing the idea that textual content does affect content popularity.
Apart from predictive features, the distribution of performance metrics has crucial implications for the model-building task. Past studies show that popular web contents are few and far between, including video content [30], and online news stories [10]. Authors in [30] used the number of video views as the performance metric and found that only 1% of YouTube videos have more than one million views, while [10] used the number of comments under a news page as the performance metric, and found that the popularity usually shows log-normal distribution. The broader survey by [9] also mentioned the skewness of popularity distribution across various studies. The studies indicate that simple linear regression might not be viable for modeling. Furthermore, if classifiers are to be used, then the dataset is bound to be imbalanced and needs to be preprocessed.
3.4. Processing of an Imbalanced Dataset
When the labels in a dataset for classification are highly imbalanced, classifying all the data records to the larger class can yield exceptional accuracy. However, in this case, the prediction result is meaningless as it is often the smaller class that is more important. For example, fraudulence credit card transactions take only a tiny proportion of all credit card transactions. An algorithm that classifies all the transactions as “normal” will have great accuracy, yet it is useless. In this case, we will have to turn to other metrics to evaluate the prediction model and preprocess the dataset to obtain a better prediction result that suits our needs.
Oversampling and undersampling are standard techniques for balancing datasets. The present study used both methods to see which one produced more desirable results. For undersampling, random sampling [31] was used to reduce the larger class in our data mining task. For oversampling, SMOTE [32] was used to produce synthetic data to make the smaller class larger in our dataset. Compared with replicating the current data records, using SMOTE can prevent the model from significantly overfitting the training data.
4. Materials and Methods
4.1. Data Source
The data in this study were obtained from a marketing company that ran a content website and marketed it through twenty Facebook pages. The company possessed a content-oriented website and posted around 500 articles per week. Their website used Google AdSense advertisements to gain a monetary return, and the Facebook pages were used to promote the content. The company used an automatic posting program to post links of the articles to the Facebook pages randomly, along with the title text and image. The research team was permitted to access the company’s Google Analytics, Google AdSense, and Facebook admin accounts and retrieved raw data from APIs of Google and Facebook. Additional features were obtained by feeding the first 200 words of each article into Google Translation and Google Natural Language Processing API to obtain the category and keywords of the title posted.
4.2. Data Collection
To effectively combine data from various data sources, the research team retrieved data from different sources and designed the sequence of data collection as follows:
- Daily collection of Facebook post IDs: When one posts an article to a Facebook page, Facebook assigns a post ID. An analyst can query the detailed content via Facebook API later. The research team retrieved the latest Facebook post IDs from the Facebook pages and stored them in the database daily.
- Collecting popularity metrics from Facebook: Two days from the publish date, popularity metrics such as impressions and clicks were collected and stored in the database. The two-day delay allows the content to diffuse and reach Facebook users.
- Collecting monetary metrics from Google: Three days from the publish date, each post’s advertisement income was retrieved from Google Analytics/AdSense API. The information was fetched later than the content usage since the income information for each day will not be available from the API before midnight.
- Obtaining article category information and keywords from Google: This can be a separate task and can be performed as soon as an article is available. Google Natural Language Processing was used to obtain keywords and the topic of a title. Since the Google Natural Language Processing API has yet to support Chinese, the Google Translation API was used to translate the Chinese post title into English before obtaining the topic information for the title of an article.
- Obtaining the main image’s size and colors: The features of the main images in posts on social media platforms can influence the users’ engagement. The research team used Python to obtain the resolution information and Google Vision API to obtain the primary color and used them as features in later data mining tasks.
PHP and Python scripts were used to collect data from APIs provided by Google and Facebook and stored them in the MySQL database at a prescheduled time daily. The data were then aggregated into a CSV file suitable for later data mining tasks. Table 1 is the complete list of the variables collected in this study, along with the citation of past studies that used the feature. Please note that keywords (entities) extracted by Google Natural Language API are one-hot encoded in the dataset. A total of 242,069 records were collected from 21 November 2018 to 21 February 2019.

Table 1.
List of features collected.
4.3. Data Analysis
First, we performed descriptive analysis on the dataset to learn about how the features collected are related to performance metrics such as impression, click, and ad revenue. Through charts, crosstabs, and correlation analyses, features with good potential for content revenue prediction were identified.
Second, the research team used linear regression to gauge if it can predict advertisement revenue accurately. The goal of the present study is to help a content provider determine whether it should promote a piece of content by posting it to its social media account. If the model can predict the amount of advertisement revenue, then it will help immensely.
Next, we attempted to use classification methods to help a content provider decide whether it should promote a particular piece of content through its social media account. Posts with the top 10% advertisement revenue were labeled as “high performance”, and the rest were labeled as “normal”. Data resampling was needed to ease the problem of imbalanced datasets. Unprocessed, randomly undersampled, and oversampled versions of the dataset were prepared using SMOTE [32].
Finally, we used three classification methods to predict the performance of social media postings—decision tree, extreme gradient boosting (XGBoost), and deep neuron network (DNN)—using datasets from the previous steps. Different matrices were used to determine whether the prediction models can be used to reduce the number of social media posts while retaining as much advertisement revenue as possible.
5. Results
In this section, we report our findings using the dataset prepared. First, we provide descriptive statistics to obtain some idea about the relationship between predictive features and performance metrics, such as impression and engagement, toward social media posts. Correlation analysis will follow so that variables that are too closely correlated with each other will be examined before we proceed to linear regression and classification methods.
5.1. Descriptive Statistics
Whenever a social media post shows up in a Facebook user’s timeline, it is counted as an “impression”. When the user clicks on the post and is forwarded to a shared web page, it is counted as a click. More impressions mean that the Facebook algorithm recommends the post more, and more clicks mean that the users are willing to learn more about it. Clicks lead users to the content websites’ actual page, which generates advertisement revenue for the content websites when the advertisements are shown or clicked. Therefore, impressions, clicks, and advertisement revenue are critical performance metrics in this subsection, and we aimed to observe their relationship with temporal and contextual features of the social media posts.
5.1.1. Page Performance and Number of Page Subscribers
The number of subscribers of the Facebook pages used in this study varies greatly. The smallest one has just over 6 K subscribers, and the largest one has over 450 K subscribers. Larger Facebook pages generate more impressions, clicks, and advertisement revenue from our data. Still, we would like to observe whether there would be any difference in the performance of individual posts on a per-user, per-post basis. In Figure 1 and Figure 2, we can see that the Facebook pages with the smallest and largest numbers of fans perform better than the ones that have a moderate number of fans. The trend is consistent across impressions, clicks, and advertisement revenue generated.
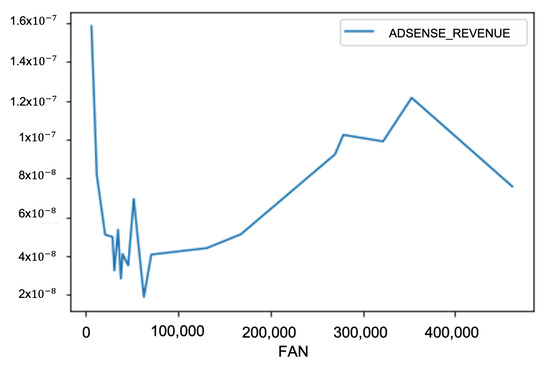
Figure 1.
The average revenue per post, per fan on the Facebook fan pages.
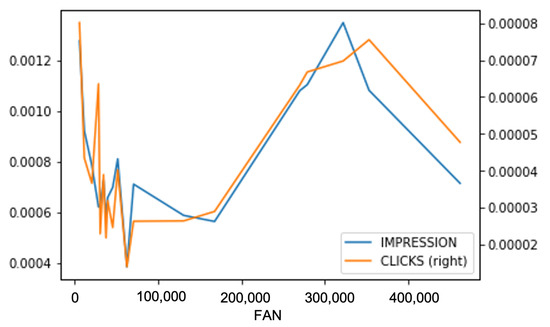
Figure 2.
The average impressions and clicks per post, per fan on the Facebook fan pages.
5.1.2. Page Performance and Temporal Variables
Past studies have shown that temporal features can affect Internet user behavior [27]. During holidays, users have more free time to spend surfing the Internet, which can positively affect the performance of social media postings. On the other hand, people have less time to surf the net on work days. Hence, the expectation of high performance is lower. In Figure 3, the x-axis is the day of the week, with 0 being Monday. Impressions and clicks mostly follow the same trend, except for Monday and Sunday. To highlight this difference, we calculate the ratio of clicks versus impressions and illustrate it in Figure 4.
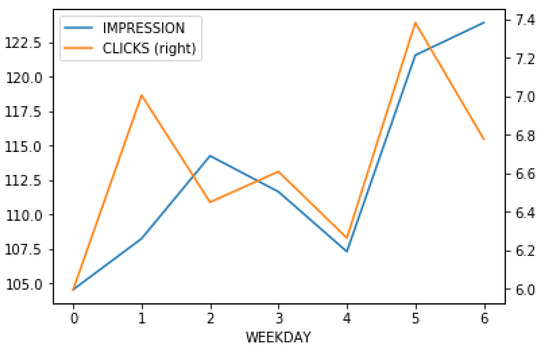
Figure 3.
The average impressions and clicks per post, according to days in a week.
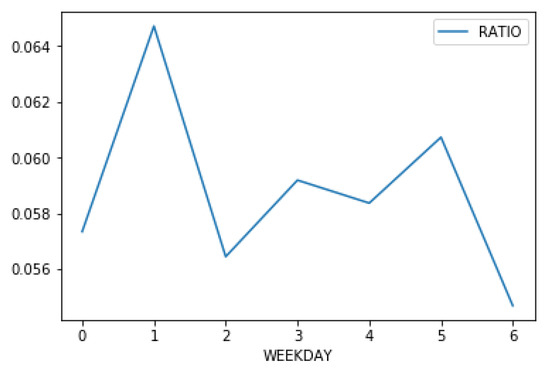
Figure 4.
The ratio of average impressions and clicks of days in a week.
From Figure 4, we know that, on Tuesdays and Saturdays, people tend to click on the social media posts that they are presented with more consistently. On Sundays, although the people seem to browse social media a lot—hence the high impressions number—they are not clicking on the posts frequently. Since advertisement clicks generate much more revenue for the publisher than advertisement impressions, it is not surprising that advertisement revenue rises when people are more willing to click on posts and advertisements. In Figure 5, it shows an interesting pattern that per post revenue is the highest on Saturdays, while users click on the posts they saw on Facebook on Tuesdays at a high rate, they are less likely to click on advertisements, hence the lower per-post revenue.
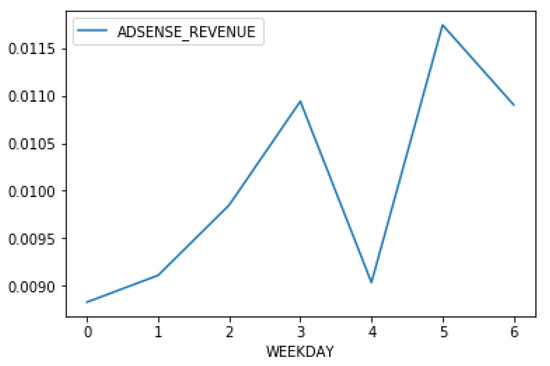
Figure 5.
The average AdSense revenue per post, according to days in a week.
Past studies have also used “hour-in-a-day” as a predictive feature [27]. In the era of mobile Internet, however, the time slots of a user using the Internet heavily has been extended from evening to midnight to include the time of commute. We analyze the correlation between time in a day and the performance metrics to obtain a better idea. Figure 6 shows that around noon and around 11:00 p.m. are the peaks for both impressions and clicks. However, it is interesting that the morning hours perform well, just like the afternoon hours—to our surprise. The click-per-post rate is also higher at around 6:00 p.m. To investigate this further, we illustrate the click-to-impression ratio, as in Figure 7. The two peaks, where the best clicks-to-impression ratio occurs on social media posts, are around 6:00 a.m. and noon. In Figure 8, it shows that the best time for a publisher to earn money through posting social media posts is indeed around noon, with 6:00 a.m. and midnight as a close second and third, respectively. The 6:00 a.m. spot shows that many people browse the Internet early in the day.
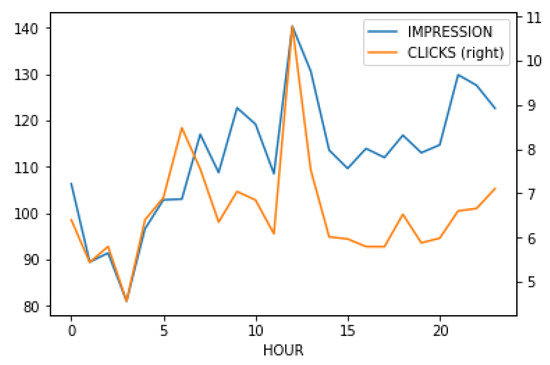
Figure 6.
The average impressions and clicks, according to hours in a day.
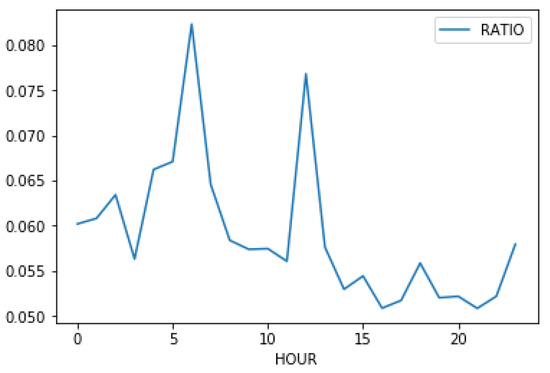
Figure 7.
The ratio of average impressions and clicks, according to hours in a day.
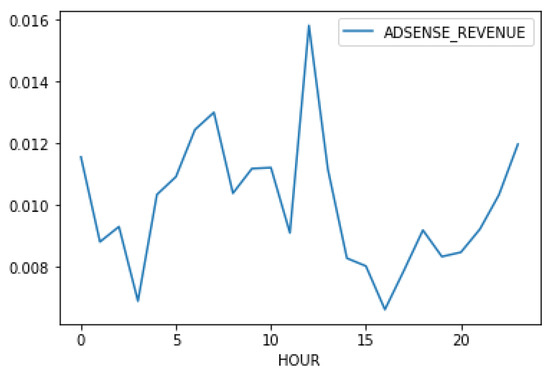
Figure 8.
The average AdSense revenue, according to hours in a day.
To summarize, our analysis of temporal features indicates that, in a day, the optimal times to post social media posts are 6 a.m., noon, and midnight—if the goal is to bring in more revenue. In a week, the best days to post on social media are Thursday, Saturday, and Sunday, with Saturday generating the most revenue per post. It is reasonable to think that a specific combination of time in a day/day in a week will perform exceptionally well. A more thorough temporal analysis will be required to learn more about the details.
5.1.3. Page Performance and Textual Features
Besides temporal analysis, a textual analysis was also performed to understand the correlation between the performance of social media posts and content features. First, we would like to observe the performance of different text categories. For each post, the title and first 200 words of content were fed into Google Natural Language API to obtain its category information. Since the content we used is in Chinese, the text was first fed into Google Translation API to be translated into English before Google could categorize it.
When we look at Figure 9, it is striking that articles in the category of “Adult” perform so much better than the other categories. “Arts and Entertainment”, “Books and Literature”, and “News” are the distant runners up. Figure 9 also shows that there is a significant difference between articles of different categories. It is worth noting that advertisement agencies block most adult-oriented articles, and Google is no exception. Furthermore, there was no inappropriate explicit content published on the Facebook pages in this study.
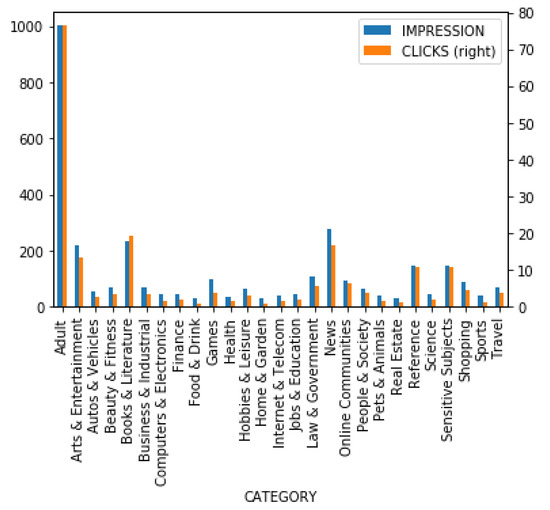
Figure 9.
The average impressions and clicks of posts, according to different categories.
Figure 10 gives us an idea about the click–impression ratio of posts of different categories. The ratio is between 0.03 and 0.08 across categories, and “Books and Literature” has the highest ratio. The other leading categories are “Adult”, “Online Communities”, “References”, and “Sensitive Subjects”. Figure 10 shows that certain social media posts of certain categories do have an advantage over other posts. However, for a user to reach the actual content, it has to be seen first, which is determined by the social media platforms (i.e., Facebook).
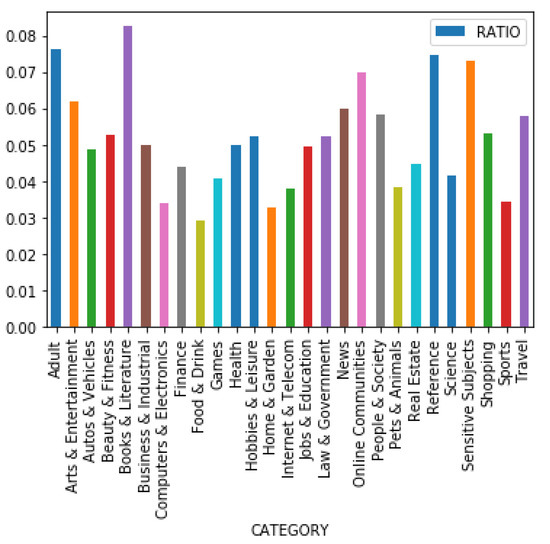
Figure 10.
The ratio of average impressions and posts of different categories.
Here we turn to the analysis of actual revenue generated. Figure 11 shows that there is a significant difference in revenue generated per post. For the category “Adult”, the revenue per post exceeds 0.10, while categories such as “Food and Drink” generate nearly no revenue per post. Coupled with the previous figures, it is clear that the revenue is related to the category of social media posts. As a content-based advertisement platform, Google AdSense posts advertisements related to the content of articles. To generate more revenue, the content publisher not only has to obtain as much traffic as possible, but they also have to publish the “right” content.
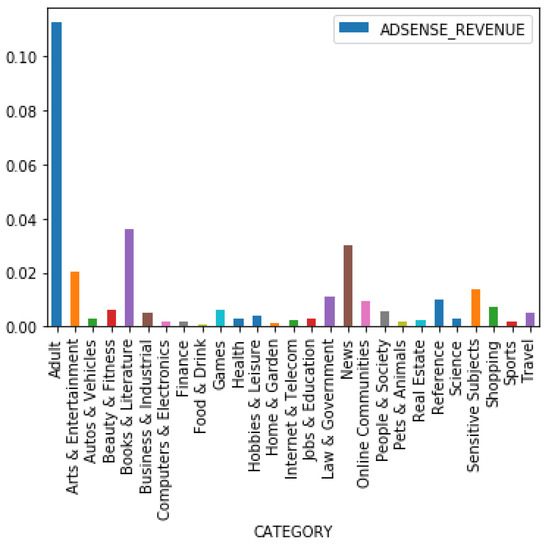
Figure 11.
The average AdSense revenue of posts of different categories.
Other than categorization analysis, we also used Google Natural Language Processing to extract keywords from titles of posts. There are 47,645 keywords extracted from the titles of the social posts, and it is impossible to include all the keywords. To limit the number of keywords used in the study, we only use those that appeared in more than 500 articles when analyzing. Twenty-six keywords were retained for further analysis. We used one-hot-encoded vectors to represent whether one or some of the keywords appeared in the title of a post.
On the other hand, we also aimed to clarify whether any keyword performs exceptionally well in revenue generation. We performed a simple analysis regarding the keywords that generate more than USD 0.9 per article (the same article is posted to all 20 Facebook pages in this study). Among the 42 keywords selected, 16 of them were the names of celebrities. This shows that celebrity gossip is still quite attractive to average users, and the users were willing to click on the advertisements.
5.2. Correlation Analysis
The analysis in the descriptive statistics section gave us some ideas regarding the variables’ influence on performance metrics. The next goal of this study was to build a predictive model to predict the performance of a particular post by variables that the poster can control, such as post time and post content. A correlation analysis helped us explore the relationships between different variables and select suitable features for prediction. For instance, if some variables are highly correlated, then it makes little sense to use one to predict another (the so-called collinearity in classical linear regression analysis). Non-numeric variables are not suitable here, so in Table 2 we show the Pearson correlation of the numeric attributes. In this study, though, almost all the numeric variables were used as performance metrics. We used the correlation table to observe how closely those features correlate to each other.
Table 2.
Pearson correlation of selected variables.
Due to the constraint of the page width, in Table 2, we have to use the shorter versions of variable names. Those variables correspond to the ones that are in Table 2. The performance metrics are quite well related, with no single pair of correlations lower than 0.77. Since the “engaged_user” variable is the combination of clicks and reactions, it is not surprising that the correlations are always better than 0.9 among them. The most crucial performance metric, adsense_revenue, is most correlated with engaged_user and click, because the publisher will receive revenue only when a user clicks on a post. Table 2 shows that popularity metrics are good predictors for advertisement income prediction. When we do not have access to revenue data, popularity can be a viable indicator for advertisement revenue income. On the other hand, it would not be suitable to use multiple popularity metrics as independent variables and advertisement revenue as the dependent variable in a classical linear regression test. There would be severe collinearity problems among them.
5.3. Linear Regression
We attempted to use different data mining methods to build a prediction model to predict social media posts’ financial performance from temporal and textual features. The features used for prediction are listed in Table 3.
Table 3.
List of predictive features used.
Linear regression was the first data mining method used to build a prediction model. As mentioned prior, from past content popularity research, a small amount of content will draw a large proportion of attention from users, while most content will be left unnoticed. The results of the previous studies are consistent with the poor linear regression results in this study. The results are shown in Table 4. The adjusted R2 is too low for both the training model and the test model, indicating that the model does not provide good prediction power. We will turn to other data mining methods in search of better results.
Table 4.
Results of linear regression: temporal and contextual features vs. AdSense revenue.
5.4. Classification
Before we could apply classification methods to our data, the data first needed to be appropriately prepared. First, the performance metrics defined in this study were numeric, and we had to find out the well-performed posts and mark them as so. Second, the labeled and unlabeled instances had vast differences in number, and some data-balancing methods had to be applied. We chose three popular classification methods—decision tree, extreme gradient boosting (XGBoost), and deep neuron network (DNN)—to compare the performance among these predictive models. We use the scikit-learn package for decision tree, the XGBoost library for XGBoost, and the Keras module for DNN in Python to build these classifiers.
5.4.1. Preparing Training and Test Data
To apply classification models to the data, we marked the instances with the top ten percent of AdSense_revenue as class 1 and other instances as class 0. After labeling, we had 24,209 instances of high-performance posts and 217,860 instances of “normal” posts. Then, we split the dataset into a training set and a testing set by using the module “scikit-learn” in Python. The sizes of the train and test sets were 70% and 30%, respectively.
5.4.2. Balancing the Imbalanced Data
The training dataset is highly imbalanced, which could negatively affect the building of the prediction models. To balance the training set, we performed both undersampling on the “normal” posts and oversampling on high-performance instances to produce a more balanced train set. We randomly selected examples from the majority class to delete from the training dataset for undersampling. For oversampling, we used SMOTE [32] to produce synthetic data. The use of SMOTE helped us prevent the potential overfitting problem by performing replication of instances for oversampling. The imbalanced-learn Python library provides the implementations of balancing methods.
5.4.3. Results
We evaluated the performance of the predictive models by comparing the model accuracy to baseline accuracy and by observing the confusion matrix. As discussed in Section 2, the purpose of the predictive model is to determine whether a post has the potential to generate advertisement revenue before it is published, and while accuracy information is essential, the confusion matrix also provides crucial information regarding a model’s contribution to our goal.
Table 5 shows the accuracy information of different combinations of data balance and classification methods produced in Table 5. The method ZeroR serves as a baseline, indicating that, from the perspective of accuracy, all the combinations of data balance and data mining methods could not outperform ZeroR significantly in terms of accuracy. In the case of imbalanced datasets, it is not unusual that classifications methods have difficulty in significantly outperforming ZeroR. The performance of XGBoost classifier was the best, with an accuracy 90.25%, among the three methods, beating ZeroR by 0.51%. The undersampled dataset suffered notably, possibly due to fewer training data entries.
Table 5.
Accuracy for combinations of different combination of classification and data balance methods.
Since the trained models failed to improve the accuracy in any significant way, the next step was to observe the confusion matrix to see that any trained model could contribute to our goal. Confusion matrices of different combinations of data balance and classification methods are summarized in Table 6. Following the preceding discussion, we first look at the result of ZeroR. ZeroR achieves high accuracy due to the highly unbalanced dataset, but it is meaningless, because in using ZeroR, all instances were predicted to be normal. In our case, this means that nothing should be posted to our Facebook fan page. This is when concepts such as precision and recall come in handy. We used them to evaluate other combinations in Table 6. The definitions of precision and recall which we used were the following:
Table 6.
Confusion matrix of data balance and classifiers.
In which TP means true positive, FP means false positive, and FN means false negative.
Better precision means less probability of misclassifying “normal” posts as high-performance ones. Better recall means less probability to misclassify high-performance posts as “normal” posts. In this study, we chose the predictive model that has the right balance on precision and recall. We hoped that the model could identify high-performance posts with reasonable confidence, but we also aimed to post more and did not mind if some of the posts were “normal”.
For the best precision, the combination of oversampling with SMOTE [32] and XGBoost performed well. If the predicted high-performance posts are all posted, then around 12% of high-performance instances (901 out of 7212) and 674 “normal” instances would be published. Combined, around 2% of the 70,291 post candidates would be posted.
The best recall occurs when the DNN classification methods were used in conjunction with the undersampled training set. Around 66% of high-performance instances(4737 out of 7212) would be posted, and 17,175 “normal” instances would be posted. Combined, around 31% of the post candidates would be posted.
Among the classification-data sampling method combination, the combination of undersampling and XGBoost classifier seems to be a good balance. Around 49% of high-performance instances (3564 out of 7212) would be posted, and 5869 “normal” instances would be posted. The total number of posts would be 9433, which means that around 13% of the post candidates would be posted.
To summarize, the content publisher’s business strategies will influence the choice of processing combination. The content publishers should reduce the number of posts when they observe that the reach and engagement of social media posts have decreased gradually. Using the XGBoost classifier with an undersampled training set seems proper when this happens. On the other hand, selecting the combination of an undersampled training set and DNN classification model will retain more revenue when the reach and engagement of social media posts remain stable.
6. Discussion
6.1. Business Sustainability and the Choice of Performance Metric for Social Media Posting Efficiency
From past studies, we learned that the distribution of the Internet content’s performance is more likely to be skewed, which means a small portion of content gains most of the audiences’ attention. The result of the current study is consistent with this assumption, which leads to a dissatisfying accuracy across the tested models, as displayed in Table 5. The models trained using the resampled dataset also produced mediocre or worse accuracy than their original dataset counterparts.
On the other hand, when we look into Table 6 closely, the models using resampled data generally provide more insight for this study’s purpose, which is using social media more efficiently. The models’ trained using resampled data did a much better job identifying more high-performance posts, albeit sometimes leading to visibly lower accuracy than the baseline. They allow the managers of content websites to evaluate different social media strategies—to post more aggressively for increased short-term income, or to post more conservatively to avoid disturbing the users by overmarketing and the punishment from the algorithm of Facebook. In other words, for content website providers to utilize social media with business sustainability in mind, the confusion matrix is the metric to use to provide more options for a social media manager.
6.2. Using Data Science (Data Mining) to Cope with the Changing Rules of Social Media Platforms
Social media platforms update their service from time to time. Facebook, for example, has been reported to change the way they prioritize content [13], and even officially announced a change in the algorithms to prioritize Facebook app exposure [14]. Content websites that leverage social media to attract traffic need to adjust constantly to those changes, yet the social media platforms do not disclose them to the content websites. The result is that the content websites often suffer from a significant drop in social posting performance before they can adjust.
The content website can detect the changes preemptively by using the latest dataset to constantly re-validate the prediction model. If a validation using a recent dataset shows that the current predictive model is not performing as well as expected, then it is a sign of potential rule changes. A retrain of the predictive model can then be performed to see whether the updated model can improve the performance.
7. Conclusions and Future Works
Social media has become one of the primary ways to obtain new information for Internet users. Content publishers, who often rely on advertisement revenues as a source of income, are also starting to use social media to bring more traffic to their websites. This study predicted advertisement revenue for a content website equipped with several Facebook pages, each with many subscribers. Combining data from data sources such as Facebook API and Google API, we built a dataset containing temporal-, textual-, and performance-related features and used it for model training and validation. The procedure enables us to explore how these features could influence social media posts’ performance and proved that data mining methods could be used to improve the efficiency of posting content to social media.
From descriptive statistics analysis, we found that social media posts posted at a specific time tend to generate more clicks and revenue for the publisher. There are time slots when users like to browse the articles but not click on the advertisements. For different categories of content, there were also apparent differences between the clicks and revenue generated per post. These findings indicate that temporal and textual features correlate to the performance metrics in question in this study.
The analysis of the confusion matrices shows that a content provider could use the different combinations of classification and data sampling methods to suit their strategic need at the moment. Linear regression did not yield beneficial results, while classification methods did provide some insights. XGBoost classifier trained without data sampling produced the best accuracy, but the enhancement was marginal. From the analysis of confusion matrices, we found that different combinations of classification and data sampling methods can help content providers to pursue various goals. When the social media platform responds well and gives a good number of impressions to its user, it can afford to use the model that posts more to obtain as much advertisement income as possible. When social media seems to be more strict about content exposure, the content provider can use another model to post less, with more accuracy.
The present study shows that predictive models can help a content provider utilize its social media presence more efficiently. By only posting content that has a better chance of generating user interaction and advertisement revenue, a content provider can balance its short-term and long-term goals. To receive advertisement revenue is crucial, but to prevent punishments from a social media platform due to over-posting is just as important. Due to limitations of time and resources, there are improvements that the research team would like to implement in the future. First, the hyperparameters of the current models can be further adjusted. Second, the use of word embeddings, such as BERT, to replace the current keyword-based features could improve the overall performance of the models.
Author Contributions
Conceptualization, S.-C.L. and Y.-W.C.; methodology, S.-C.L. and Y.-C.C.; investigation, S.-C.L. and Y.-C.C.; resources, Y.H. and Y.-W.C.; writing—original draft preparation, S.-C.L. and Y.-C.C.; writing—review and editing, Y.-W.C. and Y.H.; supervision, Y.H.; project administration, S.-C.L.; funding acquisition, Y.-W.C. and Y.H. All authors have read and agreed to the published version of the manuscript.
Funding
This research received no external funding.
Informed Consent Statement
Not applicable.
Data Availability Statement
Data available on request and subject to permission by the data owner.
Conflicts of Interest
The authors declare no conflict of interest.
References
- Taiwan Internet Report 2020. Available online: https://www.twnic.tw/doc/twrp/202012d.pdf (accessed on 1 November 2021).
- Fox, D.; Smith, A.; Chaparro, B.S.; Shaikh, A.D. Optimizing Presentation of AdSense Ads within Blogs. Proc. Hum. Factors Ergon. Soc. Annu. Meet. 2009, 53, 1267–1271. [Google Scholar] [CrossRef]
- Reuters Institute Digital News Report 2016. Available online: https://reutersinstitute.politics.ox.ac.uk/sites/default/files/research/files/Digital%2520News%2520Report%25202016.pdf (accessed on 12 January 2022).
- Brown, P. Facebook Struggles to Promote ‘Meaningful Interactions’ for Local Publishers, Data Shows. 2018. Available online: https://www.cjr.org/tow_center/facebook-local-news.php (accessed on 12 January 2022).
- Sinha, N.; Foscht, T. Over-marketing and brand suicide. In Reverse Psychology Marketing; Palgrave Macmillan: London, UK, 2007; Chapter 2; pp. 23–50. [Google Scholar]
- Bansal, P.T.; Des Jardine, M.R. Business sustainability: It is about time. Strateg. Organ. 2014, 12, 70–78. [Google Scholar] [CrossRef]
- Alalwan, A.A.; Rana, N.P.; Dwivedi, Y.K.; Algharabat, R.S. Social media in marketing: A review and analysis of the existing literature. Telemat. Inform. 2017, 34, 1177–1190. [Google Scholar] [CrossRef] [Green Version]
- Saura, J.R. Using Data Sciences in Digital Marketing: Framework, methods, and performance metrics. J. Innov. Knowl. 2020, 6, 92–102. [Google Scholar] [CrossRef]
- Tatar, A.; de Amorim, M.D.; Fdida, S.; Antoniadis, P. A survey on predicting the popularity of web content. J. Internet Serv. Appl. 2014, 5, 8. [Google Scholar] [CrossRef] [Green Version]
- Tsagkias, M.; Weerkamp, W.; de Rijke, M. News Comments: Exploring, Modeling, and Online Prediction; ECIR: Stavanger, Norway, 2009. [Google Scholar]
- Moro, S.; Rita, P.; Vala, B. Predicting social media performance metrics and evaluation of the impact on brand building: A data mining approach. J. Bus. Res. 2016, 69, 3341–3351. [Google Scholar] [CrossRef]
- World Commission on Environment and Development (Ed.) Our Common Future; Oxford University Press: London, UK, 1987. [Google Scholar]
- Constine, J. Why Is Facebook Page Reach Decreasing? More Competition Furthermore, Limited Attention. 2014. Available online: https://techcrunch.com/2014/04/03/the-filtered-feed-problem/ (accessed on 13 March 2022).
- Claussen, J.; Kretschmer, T.; Mayrhofer, P. The Effects of Rewarding User Engagement: The Case of Facebook Apps. Inf. Syst. Res. 2013, 24, 186–200. [Google Scholar] [CrossRef] [Green Version]
- Chen, K.S.; Chen, M.H. EC 2.0: Can you get profit by writing blog? An empirical study in Google Adsense. In Proceedings of the Picmet 2010 Technology Management for Global Economic Growth, Phuket, Thailand, 18–22 July 2010; pp. 1–7. [Google Scholar]
- Lavin, M.; Alstine, L.V.; Scott, A.; Oliver, J.; Murphy, J. The Google Online Marketing Challenge: Fostering Student Learning of Search Advertising. J. Advert. Educ. 2009, 13, 38–43. [Google Scholar] [CrossRef]
- Burbidge, R. Can a domain name combined with third-party adverts generated by Google AdSense result in a successful trade mark infringement claim? J. Intellect. Prop. Law Pract. 2017, 12, 543–544. [Google Scholar] [CrossRef]
- Garud, R.; Karunakaran, A. Process-based ideology of participative experimentation to foster identity-challenging innovations: The case of Gmail and AdSense. Strateg. Organ. 2018, 16, 273–303. [Google Scholar] [CrossRef] [Green Version]
- Kelleher, J.D.; Tierney, B. (Eds.) Data Science; MIT Press: Cambridge, MA, USA, 2018. [Google Scholar]
- Linoff, G.S.; Berry, M.J. (Eds.) Data Mining Techniques: For Marketing, Sales, and Customer Relationship Management; Wiley: Hoboken, NJ, USA, 2011. [Google Scholar]
- Kozinets, R.V. The Field behind the Screen: Using Netnography for Marketing Research in Online Communities. J. Mark. Res. 2002, 39, 61–72. [Google Scholar] [CrossRef] [Green Version]
- Mauda, L.; Kalman, Y.M. Characterizing Quantitative Measures of User Engagement on Organizational Facebook Pages. In Proceedings of the 2016 49th Hawaii International Conference on System Sciences (HICSS), Koloa, HI, USA, 5–8 January 2016; pp. 3526–3535. [Google Scholar]
- Peeroo, S.; Samy, M.; Jones, B.P. Customer engagement manifestations on Facebook pages of Tesco and Walmart. In Proceedings of the 2015 International Conference on Computing, Communication and Security (ICCCS), Pointe aux Piments, Mauritius, 4–5 December 2015; pp. 1–8. [Google Scholar]
- Kaltenbrunner, A.; Gómez, V.; López, V. Description and Prediction of Slashdot Activity. In Proceedings of the 2007 Latin American Web Conference (LA-WEB 2007), Santiago, Chile, 31 October–2 November 2007; pp. 57–66. [Google Scholar]
- Szabó, G.; Huberman, B.A. Predicting the popularity of online content. Commun. ACM 2010, 53, 80–88. [Google Scholar] [CrossRef]
- Hong, L.; Dan, O.; Davison, B.D. Predicting popular messages in Twitter. In Proceedings of the 20th International Conference Companion on World Wide Web, New York, NY, USA, 28 March–1 April 2011. [Google Scholar]
- Tsagkias, M.; Weerkamp, W.; de Rijke, M. Predicting the Volume of Comments on Online News Stories. In Proceedings of the 18th ACM Conference on Information and Knowledge Management, Online, 2 November 2009; ACM: New York, NY, USA, 2009; pp. 1765–1768. [Google Scholar] [CrossRef] [Green Version]
- Bandari, R.; Asur, S.; Huberman, B.A. The Pulse of News in Social Media: Forecasting Popularity. arXiv 2012, arXiv:1202.0332. [Google Scholar]
- Berger, J.A.; Milkman, K.L. What Makes Online Content Viral? J. Mark. Res. 2012, 49, 192–205. [Google Scholar] [CrossRef] [Green Version]
- Broxton, T.; Interian, Y.; Vaver, J.; Wattenhofer, M. Catching a Viral Video. J. Intell. Inf. Syst. 2013, 40, 241–259. [Google Scholar] [CrossRef]
- Kubat, M.; Matwin, S. Addressing the Curse of Imbalanced Training Sets: One-Sided Selection; ICML: Baltimore, MD, USA, 1997. [Google Scholar]
- Chawla, N.V.; Bowyer, K.W.; Hall, L.O.; Kegelmeyer, W.P. SMOTE: Synthetic Minority Over-sampling Technique. J. Artif. Int. Res. 2002, 16, 321–357. [Google Scholar] [CrossRef]
Publisher’s Note: MDPI stays neutral with regard to jurisdictional claims in published maps and institutional affiliations. |
© 2022 by the authors. Licensee MDPI, Basel, Switzerland. This article is an open access article distributed under the terms and conditions of the Creative Commons Attribution (CC BY) license (https://creativecommons.org/licenses/by/4.0/).