1. Introduction
There is a rapid increase in the demand of electricity in Saudi Arabia. The population growth, increase in per capita consumption, and massive development projects are the principal drivers in this regard. Distributed generation (DG) is among the incentivized concepts to facilitate coping with the increase in demand. DG is related to “small-scale electric generators that are located next to and connected to the load being served either with or without an electric grid interconnection” [
1].
The rising electricity demand needs to be followed by an increase in electrical system assets and infrastructure improvement, to keep up with the need. The conventional strategy for meeting the increasing demand has been to boost energy production through the addition of large-scale central conventional power plants. However, for economic, environmental, and future capability reasons, DG is attracting greater attention. DG is composed of micro-sources built closer to consumers to facilitate, in the long term, the reduction in distribution and transmission bottlenecks and losses, improve voltage profile, and delay the need for huge investment in large-scale generation system. Therefore, hybrid RESs provide several advantages, including decreasing the levelized cost of energy (LCOE), reducing greenhouse gas (GHG) emissions, and providing electricity to remote rural areas through DG and microgrid. Microgrid strategy is put forward to develop DG in power systems through optimizing the problems of large-scale integration of distributed renewable resources in the system to deliver their full benefits to the system [
2].
The Kingdom of Saudi Arabia plans to cover the ever-increasing energy demand through both conventional and alternative energy sources. Energy diversification is an indispensable national strategic goal. King Abdullah City for Atomic and Renewable Energy (K.A.CARE) was established in 2010 to draw a strategic portfolio for this objective. In 2012, K.A.CARE estimated that the installed capacity needed to be increased more than two-fold to 120 GW, to meet the consumption by 2032 [
3]. They announced ambitious plans to integrate 54 GW of RESs to support the national grid [
4]. The plans have been updated progressively. A short-term target of 9.5 GW of PV by 2023 was announced by the Ministry of Energy and major PV and wind projects are being commissioned since 2017. In addition, regulations have been established for small-scale PV integrations and feed-in-tariffs (FiT) for selling the excess generation to the national grid [
5,
6].
The decision-making process in the energy sector is complex owing to the magnitude of the investments involved and the existence of multiple stakeholders [
2,
7]. This research lays out a simulation analysis of a potential microgrid project at the Islamic University of Madinah (IUM). A prototype system is currently under commission at the Faculty of Engineering for analytical and educational purposes. This can help achieve several goals, such as reducing the financial dependency on annual operational funding from the Ministry of Education, effectively using the empty spaces in the buildings to install DG, and the installed system can be used for educational purposes through modeling, simulation, and analysis of the results, to improve know-how and prepare students to work with RES systems after graduation.
Therefore, the main objective of this work is to optimize and analyze a microgrid system for which the analysis is conducted based on real consumption data obtained from the university’s campus management. Furthermore, real weather measurements were obtained from K.A.CARE for Madinah. Although various studies considered HOMER simulation for microgrid optimization, this research contributes to the body of knowledge by proposing a model that can be used for different universities and governmental or private sector entities to support their financial sustainability. Further, a common practice in the literature is the reliance on load profile and weather parameters provided by HOMER through databases and satellite readings, whereas, in this study, a careful consideration of realistic load profile and measured weather data were carried out. In terms of past HOMER analysis, the renewable calculating tool recently established by the Water and Electricity Regulatory Authority (WERA) was adopted for result validation.
Literature Review
Decision-making in terms of optimal planning of microgrid size and components of the system faces several challenges. Many researchers have considered the modeling and optimization aspects of microgrids with different requirements and parameters. HOMER is a simulation software developed by the National Renewable Energy Laboratory (NREL) to facilitate the decision analysis of hybrid renewable energy systems, including conventional and Ref. [
8]. It helps the optimization of the system capacity and components to minimize the net present cost (NPC) and the LCOE. Bahramara et al. [
9] reviewed state-of-the-art studies that used HOMER for hybrid renewable energy systems. They provided a thorough review of the required data and their use in the literature that has adopted HOMER for hybrid systems planning. They summarized the loads and sources and concluded that PV, wind turbines, conventional dispatchable generators, converters, and batteries are the most common loads and sources modeled. The authors also concluded that developing Asian areas represent the highest volume of hybrid microgrid research models owing to the high population (60% of the world population), 57.8% of which live in rural areas with significant electricity demand. Mahesh and Sandhu [
10] carried out a systematic review of hybrid model studies in the literature, focusing on designing, analyzing, and integrating these systems into the grid.
Khashab and Al Ghamedi [
11] investigated different microgrid models in Yanbu, Saudi Arabia, using HOMER. Their investigation included systems consisting of stand-alone PV, hybrid PV with wind, and hybrid PV with wind and fuel cells. All models resulted in high LCOE (i.e., 0.36, 0.49, and 7.3 USD/kWh, respectively). The focus of the systems was on educational purposes, with economic feasibility not being a deciding factor for the specific study [
11]. Elshurafa et al. [
12] carried out a techno-economic analysis of a PV system on a mosque rooftop in Riyadh. The PV project has an installed capacity of 124 kW and resulted in a 50% reduction in the net metering electricity bill through selling the excess energy generation. Rehman et al. [
13] investigated hybrid microgrid systems and conducted techno-economic analysis for residential demand-side management.
Srivastava and Giri [
14] carried out a HOMER study for a PV grid-connected system for a university in India, optimizing the system at 500 kW to cover the entire load of the university. Jefry and Zmbri [
15] analyzed a microgrid for Universiti Tun Hussein Onn Malaysia University (UTHM), developing a demand–response program to mitigate the university’s consumption by targeting the three highest consuming buildings. Khan et al. [
16] discussed the implementation of a microgrid system connected to the grid in a Malaysian university using HOMER and conducted a size optimization to reduce the NPC for a 50 kW PV system. Tazay et al. [
3] conducted a feasibility study for an autonomous college building at Baha University, Saudi Arabia, adopting Cultural and Jaya Algorithms for RES optimization. Panhwar et al. [
17] studied a microgrid design for the power and optimum utilization of renewable energy sources, for the Institute of Environmental Engineering and Management (IEEM) in Pakistan, comparing the on-grid and off-grid system performance concerning economic criteria. Uwineza et al. [
18] combined the Monte Carlo method with HOMER analysis to evaluate hybrid PV-wind scenarios in the Republic of Korea. They determined an impact of renewable energy penetration percentage on the LCOE. Ekren et al. [
19] designed a hybrid PV-wind system and analyzed its sizing for electric vehicles charging stations in Turkey.
Table 1 presents a sample of the state-of-the-art studies of microgrid systems in the literature in diverse developing countries; extended lists can be found in Bahramara et al. [
9] and Mahesh and Sandhu [
10].
2. Technical Analysis of the Proposed Model
Different studies opted variably regarding microgrid adoption. While some focused on optimizing the techno-economic aspects by obtaining the highest output with the lowest NPC, others chose to ensure coverage of the entire load, regardless of grid connection. In this study, the focus is to determine the optimal size of the microgrid system and renewable energy fraction that helps in achieving the lowest LCOE with partial coverage of the university electricity consumption.
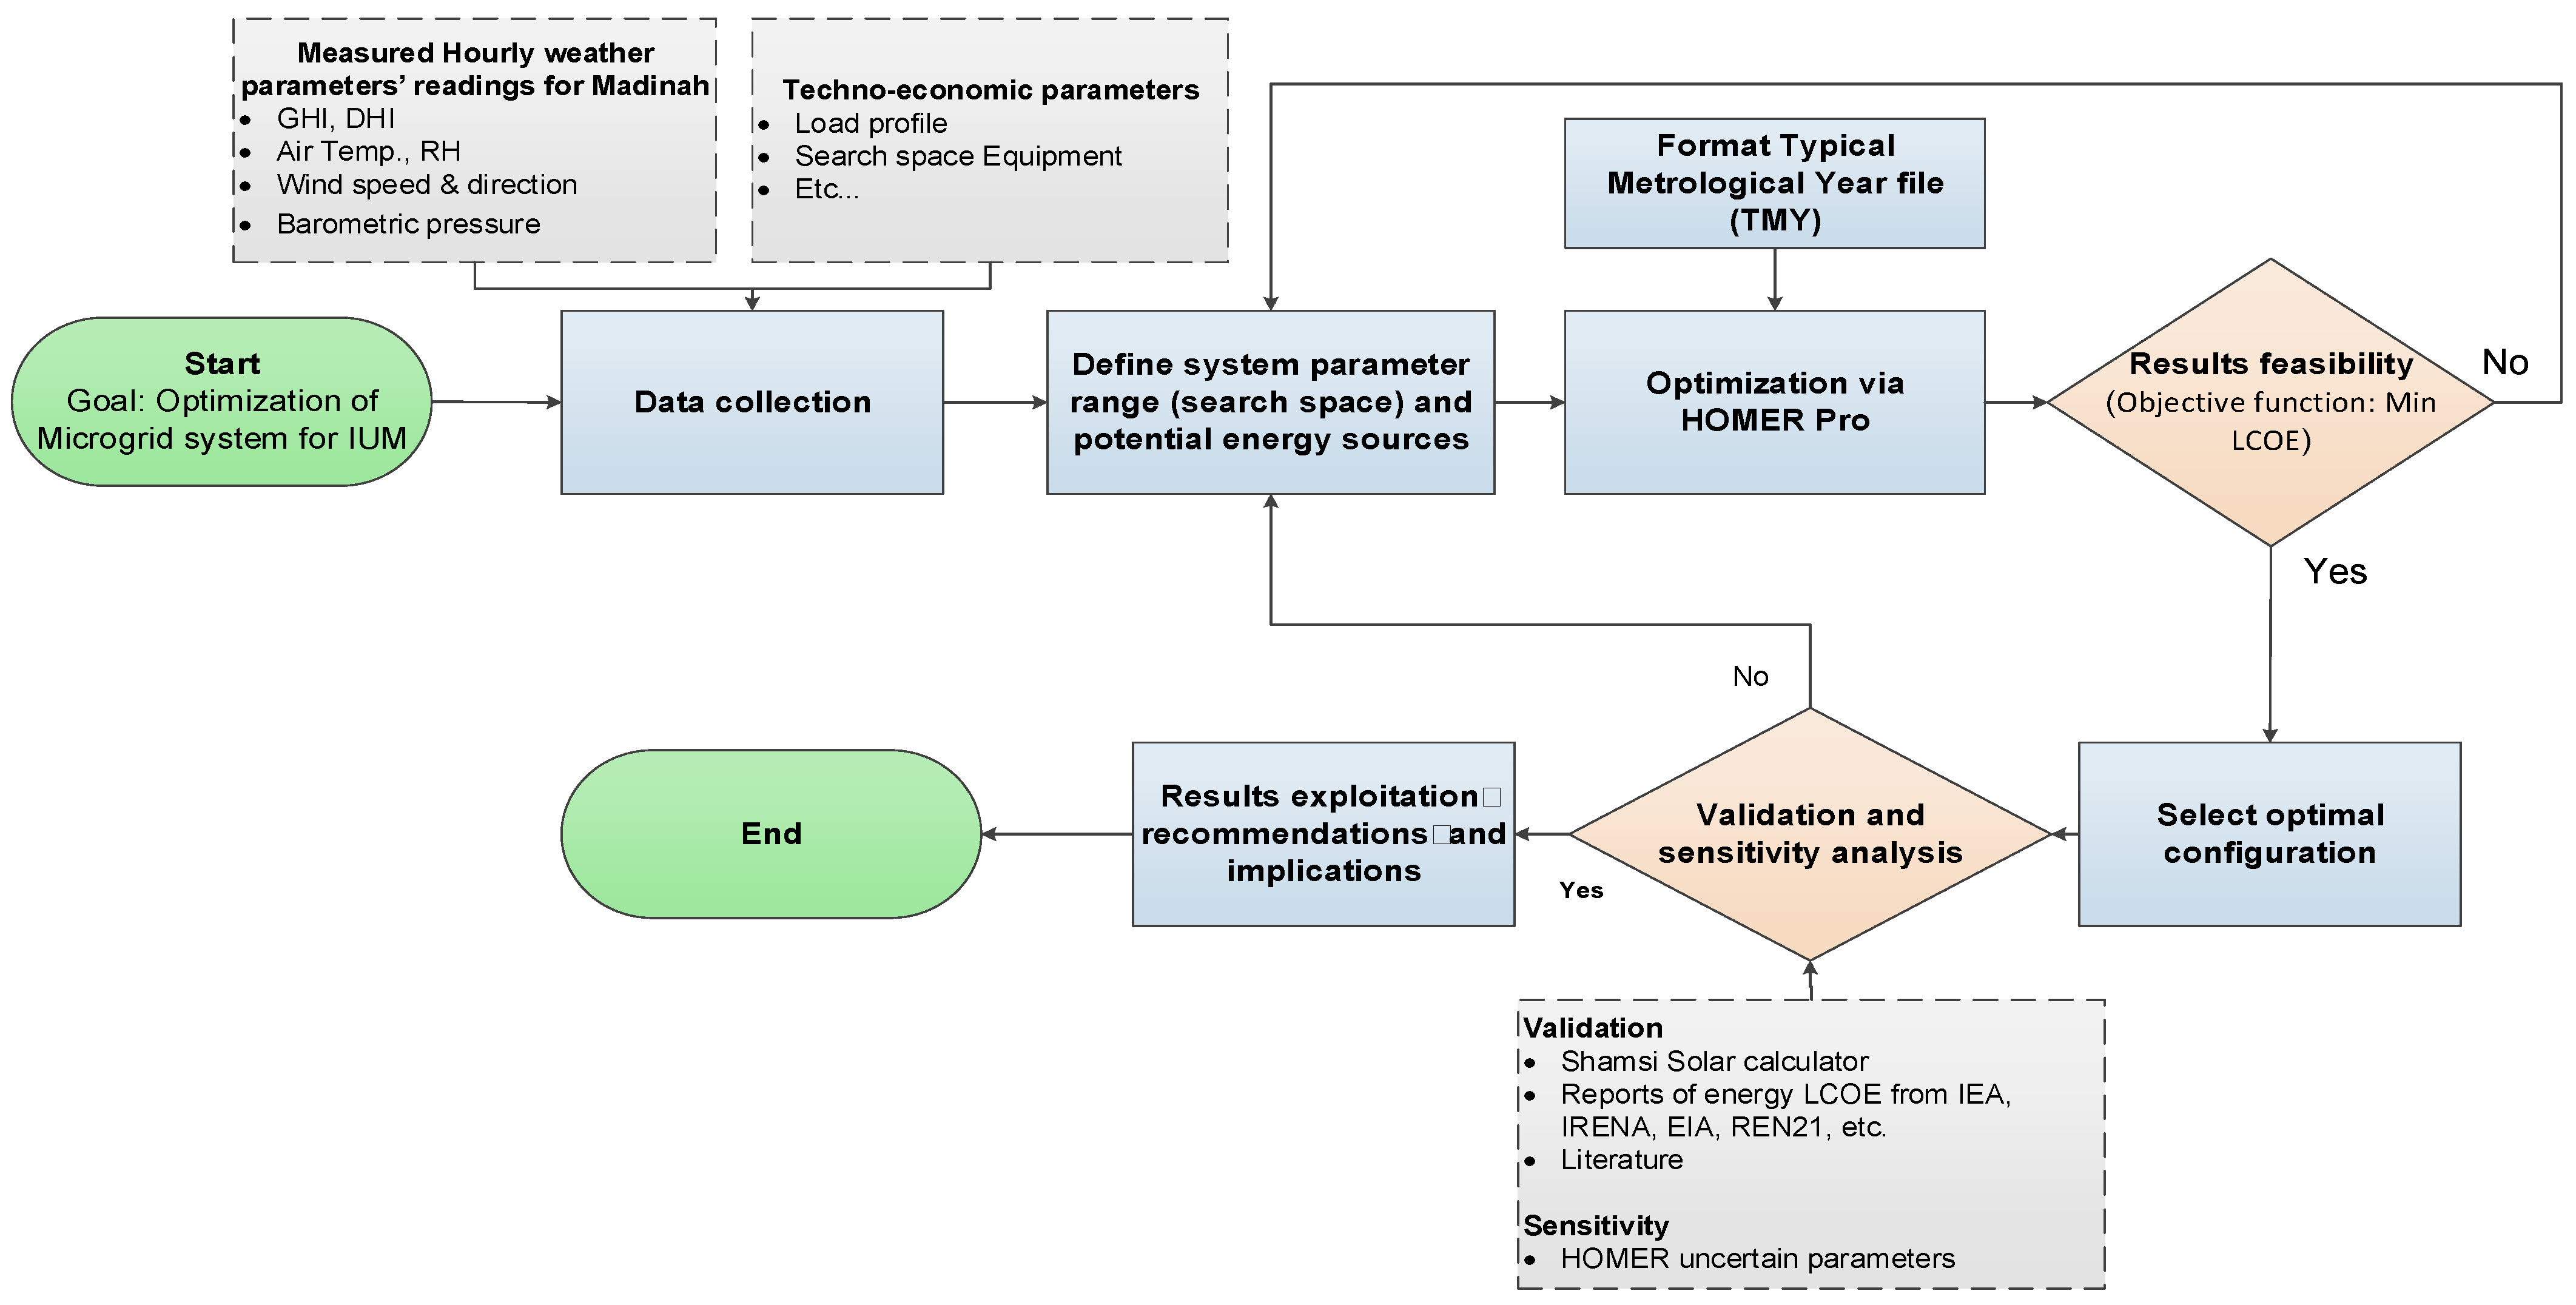
Figure 1 illustrates a flowchart of the methodology. Data collection included load profile, weather data, and equipment characteristics. The proposed range of sizes and estimated costs are then utilized to define the system parameters for optimization. A typical meteorological year (TMY) file is prepared to stimulate accuracy. Result feasibility is determined according to the objective function of minimizing the LCOE, given that the power balance constraint in the system is satisfied. If the system is found feasible, then the optimal configurations are adopted, and the results validated. A solar calculator launched by the Saudi Water and Electricity Regulatory Authority (WERA) in 2021 is utilized for result validation. Additionally, the LCOE values reported in the International Energy Agency (IEA), Energy Information Administration (EIA), International Renewable Energy Agency (IRENA), and the literature are exploited. Sensitivity analysis is thereafter carried out to examine the impact of uncertain parameters on the results, before finalizing them and drawing conclusions and recommendations.
2.1. Potential and Current Status
The monthly average data of daily solar radiation incidence on a horizontal surface are integrated into HOMER through the NASA satellite database. Power supplied by the modules depends on the amount of solar irradiation projecting on them. Aside from the environmental effect on the operation of the PV system, it is important to optimize other components of the system to maximize energy efficiency, including temperature, load conditions, and orientation of the panel, all of which are important factors affecting the PV module performance [
31].
The university is located at the latitude of 24.48° N and the longitude 39.57° E and its load is obtained from the monitoring department at the university’s campus administration, covering monthly consumption for the last three years. The university is adopting several initiatives for energy conservation, which resulted in a 25% reduction in electricity consumption during 2018–2019. The energy conservation policy is predicted to lead to a further reduction of up to 40%.
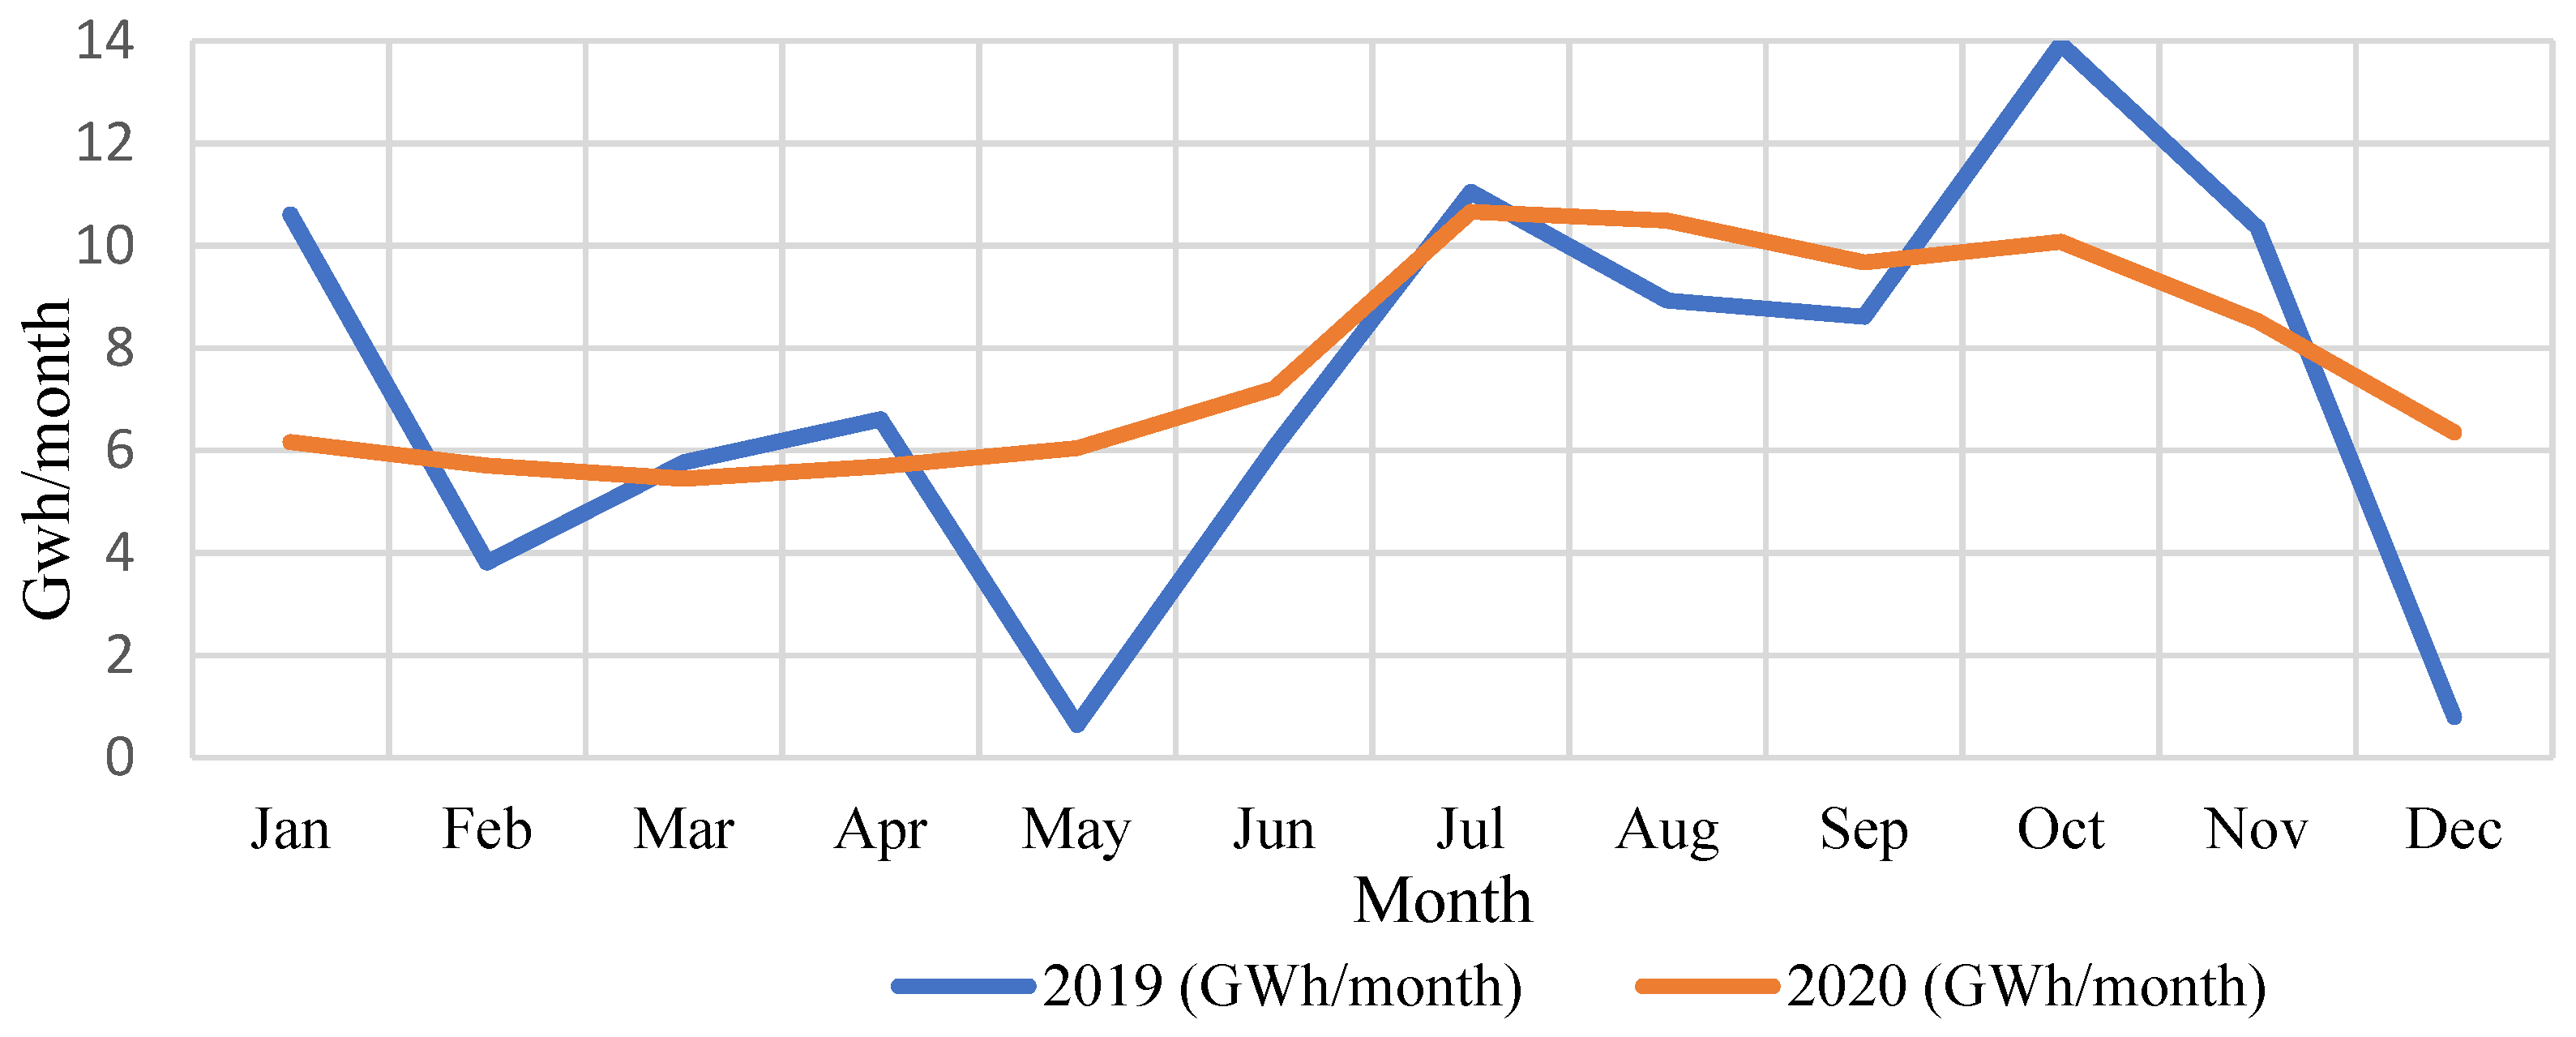
Figure 2 shows the monthly load profile for the last two years.
The academic year ends in May; it can be noticed from
Figure 2 that the load consumption in 2019 is reduced when many students residing inside the campus leave for vacation. However, the hot summer from June to August compensates for that reduction, while school starts again in September, reflecting increased demand. In 2020, load witnessed some abnormality due to the COVID-19 influence, as many students did not leave for their home countries during vacation due to travel restrictions, which reflects in lack of reduction in load consumption in May, as opposed to previous years. Though the schooling was mostly online during 2020, the monthly load consumption average slightly increased from 7.3 GWh in 2019 to 7.7 GWh, due to the students residing on campus.
A microgrid is intended to be installed at the Faculty of Engineering (FoE) as a pilot project for a larger scale system at the university scale. The system includes 7 kW PV panels, PV structure, 8 kW inverter, batteries, cables, and can potentially be extended to include wind turbines, energy storage, and a diesel generator.
Figure 3 depicts the front and side views of the orientation of the 7 kW PV modules. The available space on the roof of the E2 building is approximately 39.3 m
2, considering the existing heating, ventilation, and air conditioning (HVAC) ducts and the spaces from the edges of the roof. The PV panels are installed in two rows, with a total length of 8.5 m and a width of 4.6 m.
2.2. Weather Characteristics
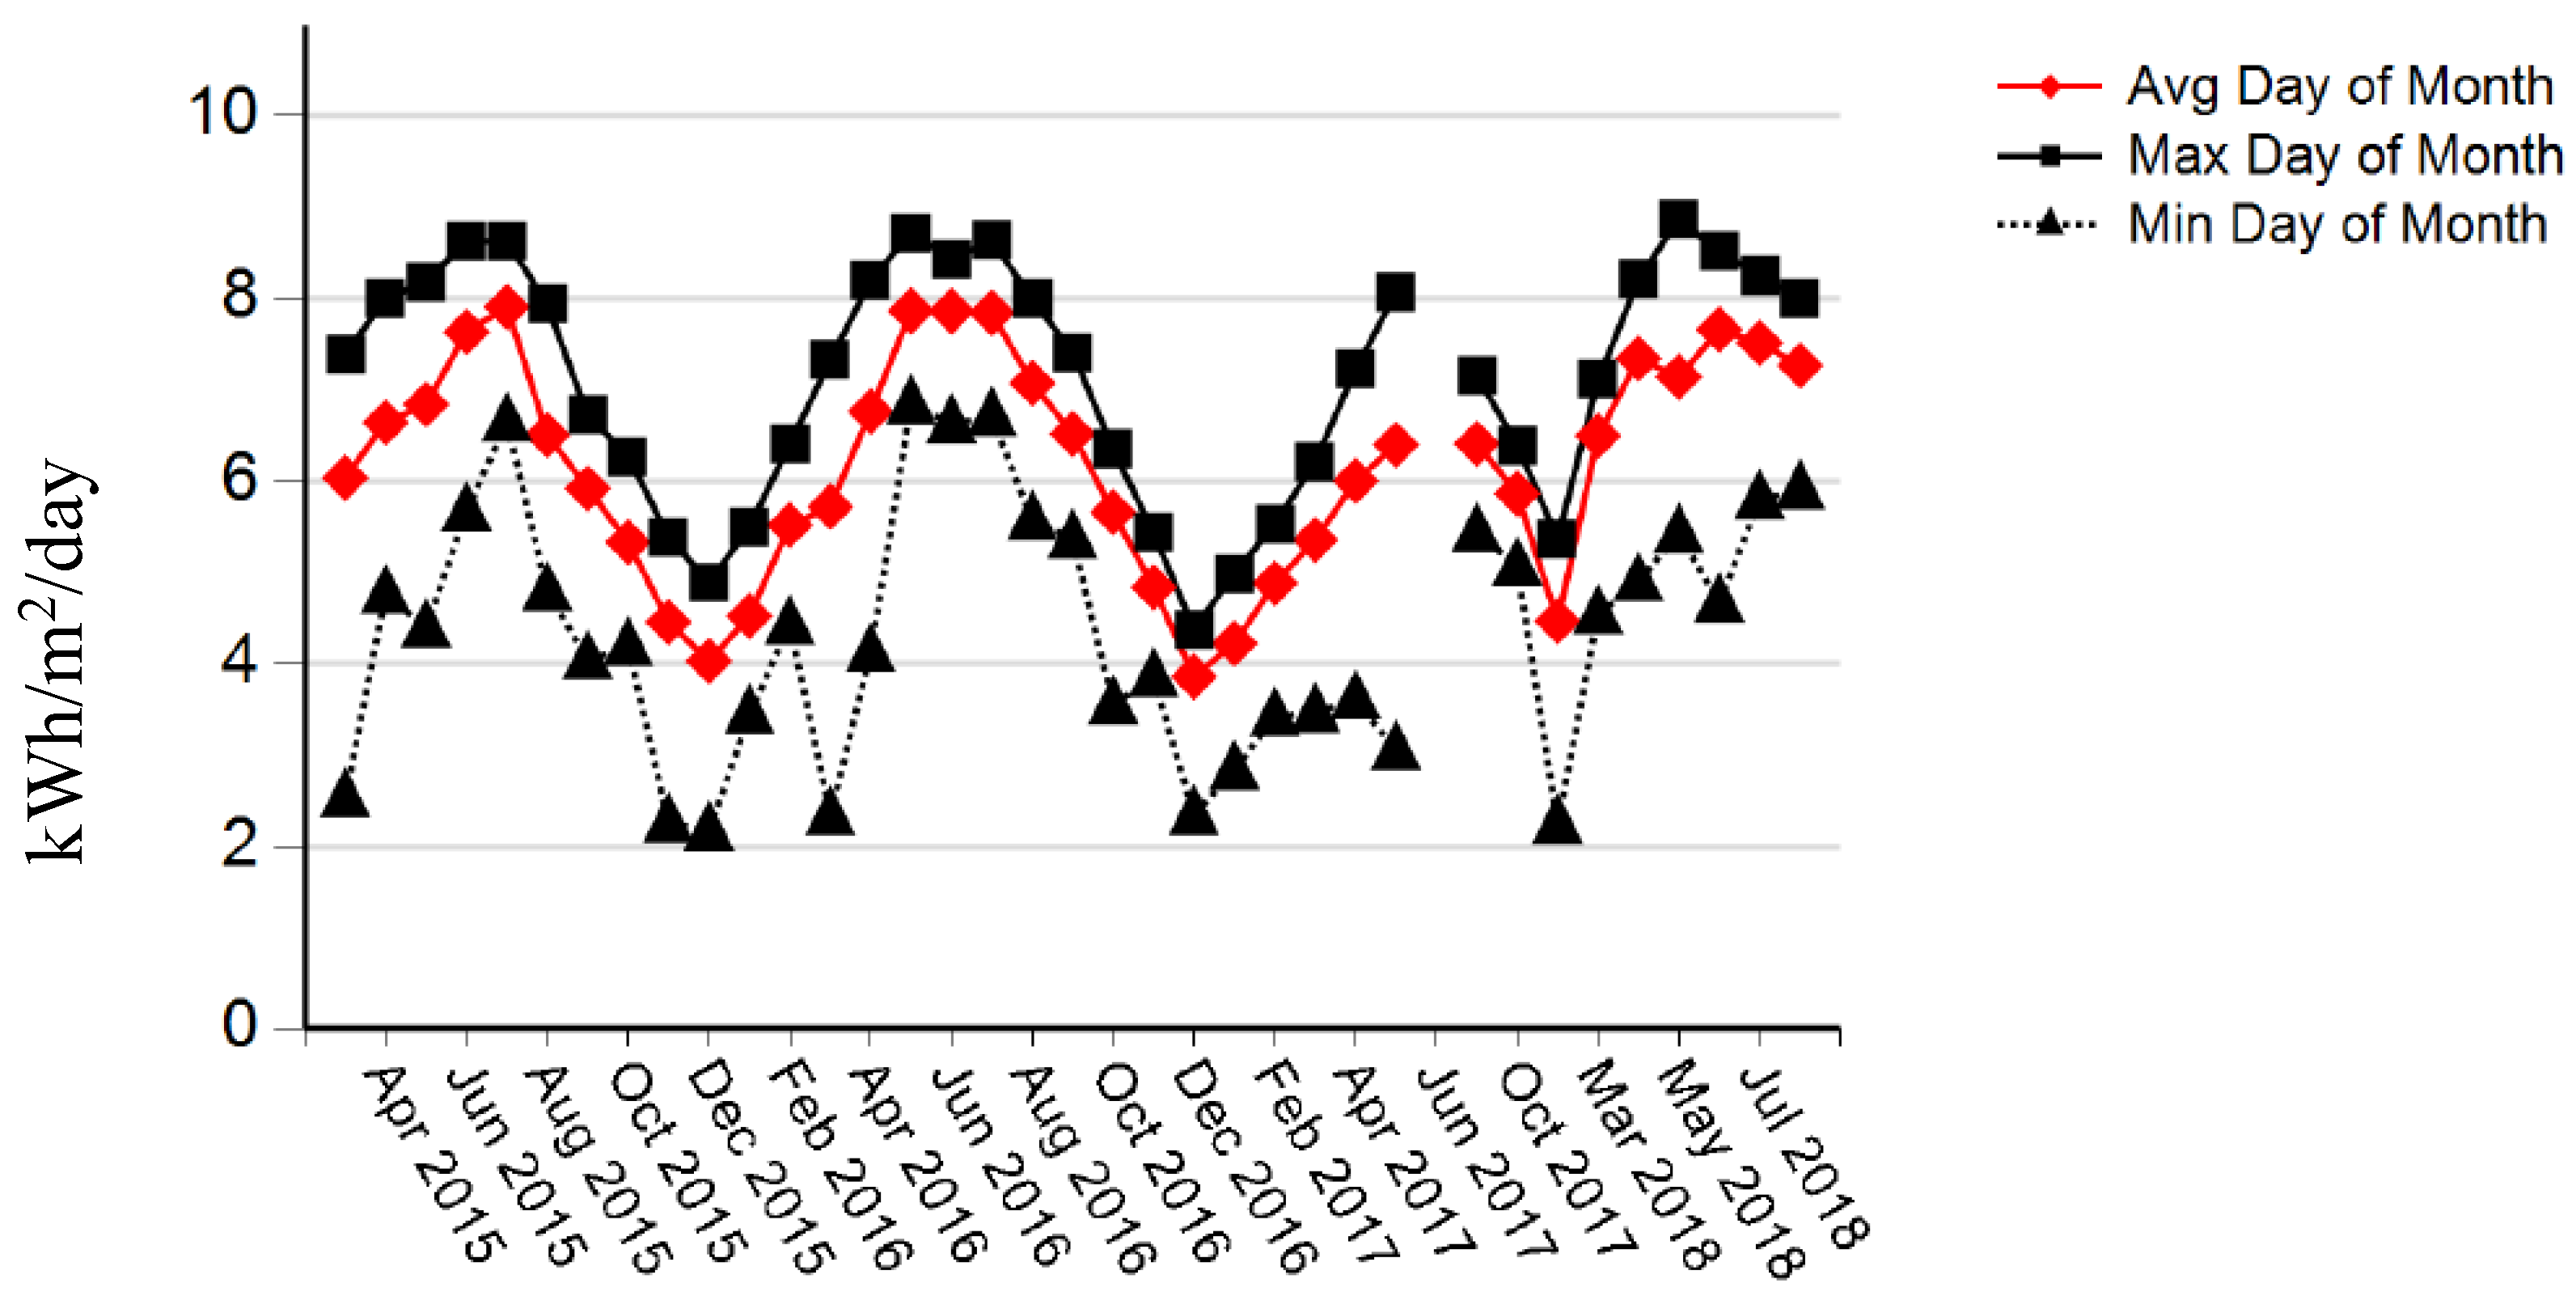
Madinah weather is arid. The city is hot in summer with long solar radiation hours and considerably cold in winter. The monthly average daily insolation incidence on a horizontal surface was obtained from Surface meteorology and Solar Energy (NASA-SSE) satellite measurements. According to the measured data, the average temperature in Madinah during 2015–2018 was 30.6 °C, while the average daily Global Horizontal Irradiance (GHI) was 6.2 kWh/m
2/day.
Figure 4 and
Figure 5 illustrate the monthly average GHI and temperature.
It is noticed from
Figure 4 and
Figure 5 that the solar radiation is at its highest during the summer (i.e., June–August), which witnesses extreme heat, having a negative influence on PV module performance, which will be analyzed and presented in the
Section 3.
2.3. Technical Specifications
Simulation is conducted by defining meteorological data, search space, load profile, equipment characteristics, economic data, and technical specifications [
9] using HOMER, which helps in analyzing and optimizing the technical, financial, and environmental aspects of RES system designs [
11]. It facilitates the performance analysis of a grid-connected and a stand-alone system that can include conventional and renewable energy sources and hybridized storage technologies. Further, the sensitivity of the optimized system can be determined by analyzing the impact of its variable variation on the overall performance.
Figure 6 shows a simplified schematic diagram of the microgrid system under investigation.
2.3.1. Meteorological Data
Simulation can only be as accurate as the adopted weather data. Thus, it is crucial to utilize precise and measured data to achieve sufficient results. While modeled data can be obtained through NASA or different databases linked to HOMER, more recent and accurate measured data were obtained from the Renewable Resource Atlas of K.A.CARE through the Renewable Resource Monitoring and Mapping (RRMM) ) program [
33]. The data were used to form a TMY file. The term TMY was introduced by NREL as a year of meteorological data in which every month was represented from different years. This helps the representation of longer periods. The GHI and temperature data were defined in the created TMY file to cover six years since the establishment of the measuring station in Madinah until December 2020.
Table 2 presents the years of the TMY file data.
2.3.2. Model Specifications
The lifetime of the PV panels is assumed to be 20 years. Equations (1)–(4) depict the calculations of the power output, considering the derate impact. All parameters are considered for the derate factor which varies significantly due to several factors, including the difference of nameplate rating between practical and standard conditions, soiling impact, wiring losses, etc. The lifetime of the inverter is assumed to be 15 years [
14].
where P
AC is AC power output; P
DC, DC power output; stc, standard test conditions; χ, derate factor; χ`, temperature-related derate factor; z, temperature coefficient per °C; τ
cell, cell temperature; τ
a, ambient temperature, and τ
n, cell temperature when the cell operates under normal operating cell temperature (i.e., a 0.8 sun and ambient temperature of 20 °C). Derate factor is calculated to range between 0.85–0.09 in characteristics similar to Saudi Arabia [
21].
To optimize the output of the PV panels, the orientation of the fixed panel needs to be determined to meet the highest GHI annual average level, using the following equations:
where δ is the declination of the sun; n, the number of the day in the year; ω, hour angle; T, time with reference to the solar noon; α, altitude angle reflecting how high up the sun is in the sky and a complement of the sun’s zenith (θz) to 90°; Φ, latitude; Ψ, azimuth angle reflecting the sun’s position in the sky from east to west.
2.3.3. Financial Parameters
The net present cost (NPC) is the sum of costs minus the sum of revenues over the lifetime of the system [
9]. NPC equates all monetary values and on the other hand the LCOE is a financial parameter utilized to compare the technical and economic performance of energy systems with similar or different generating technologies. LCOE is calculated as the ratio of plant total costs over the produced electricity throughout the lifetime of the system [
34,
35]. Equations (9) and (10) represent the NPC and LCOE calculations.
where I
t is the investment expenditure; RC
t, the replacement cost; OM
t, the operation and maintenance expenditures; FC
t, the fuel cost; CO
t, the contingency expenditures; St, the salvage value; Et, the electricity generation; EP
t, the electricity purchases from the grid; ES
t, the electricity sales to the grid; r, the discount rate; At, the cash flow; and n, the lifetime of the system. The index t indicates the year during which the various costs occurred.
The cost of electricity generation in Saudi Arabia is set at 0.08
$/kWh (i.e., 0.32 SAR/kWh) for the public sector. At IUM, the electricity consumption is considerably high and the microgrid is intended to cover a small portion of the demand with no prediction of excess energy.
Table 3 introduces a summary of the technical and financial specifications adopted for the components of the microgrid system.
3. Results Analysis of the Simulated Models
Several alternatives were defined for the analysis. The optimization results illustrated that the purchase of electricity from the grid is the economic option. This is an expected result, as the consumption of the university campus is considerably high owing to the inclusion of many employees, students, staff, and a residential campus. The objective of this study was therefore to propose a partial integration of renewable energy technologies and analyze their potential contribution to the reduction in the operating costs for the university in the long term. The minimum RES fraction was defined to be 2%. The load profile of a school was adopted from HOMER library and scaled up to match the actual consumption at the IUM.
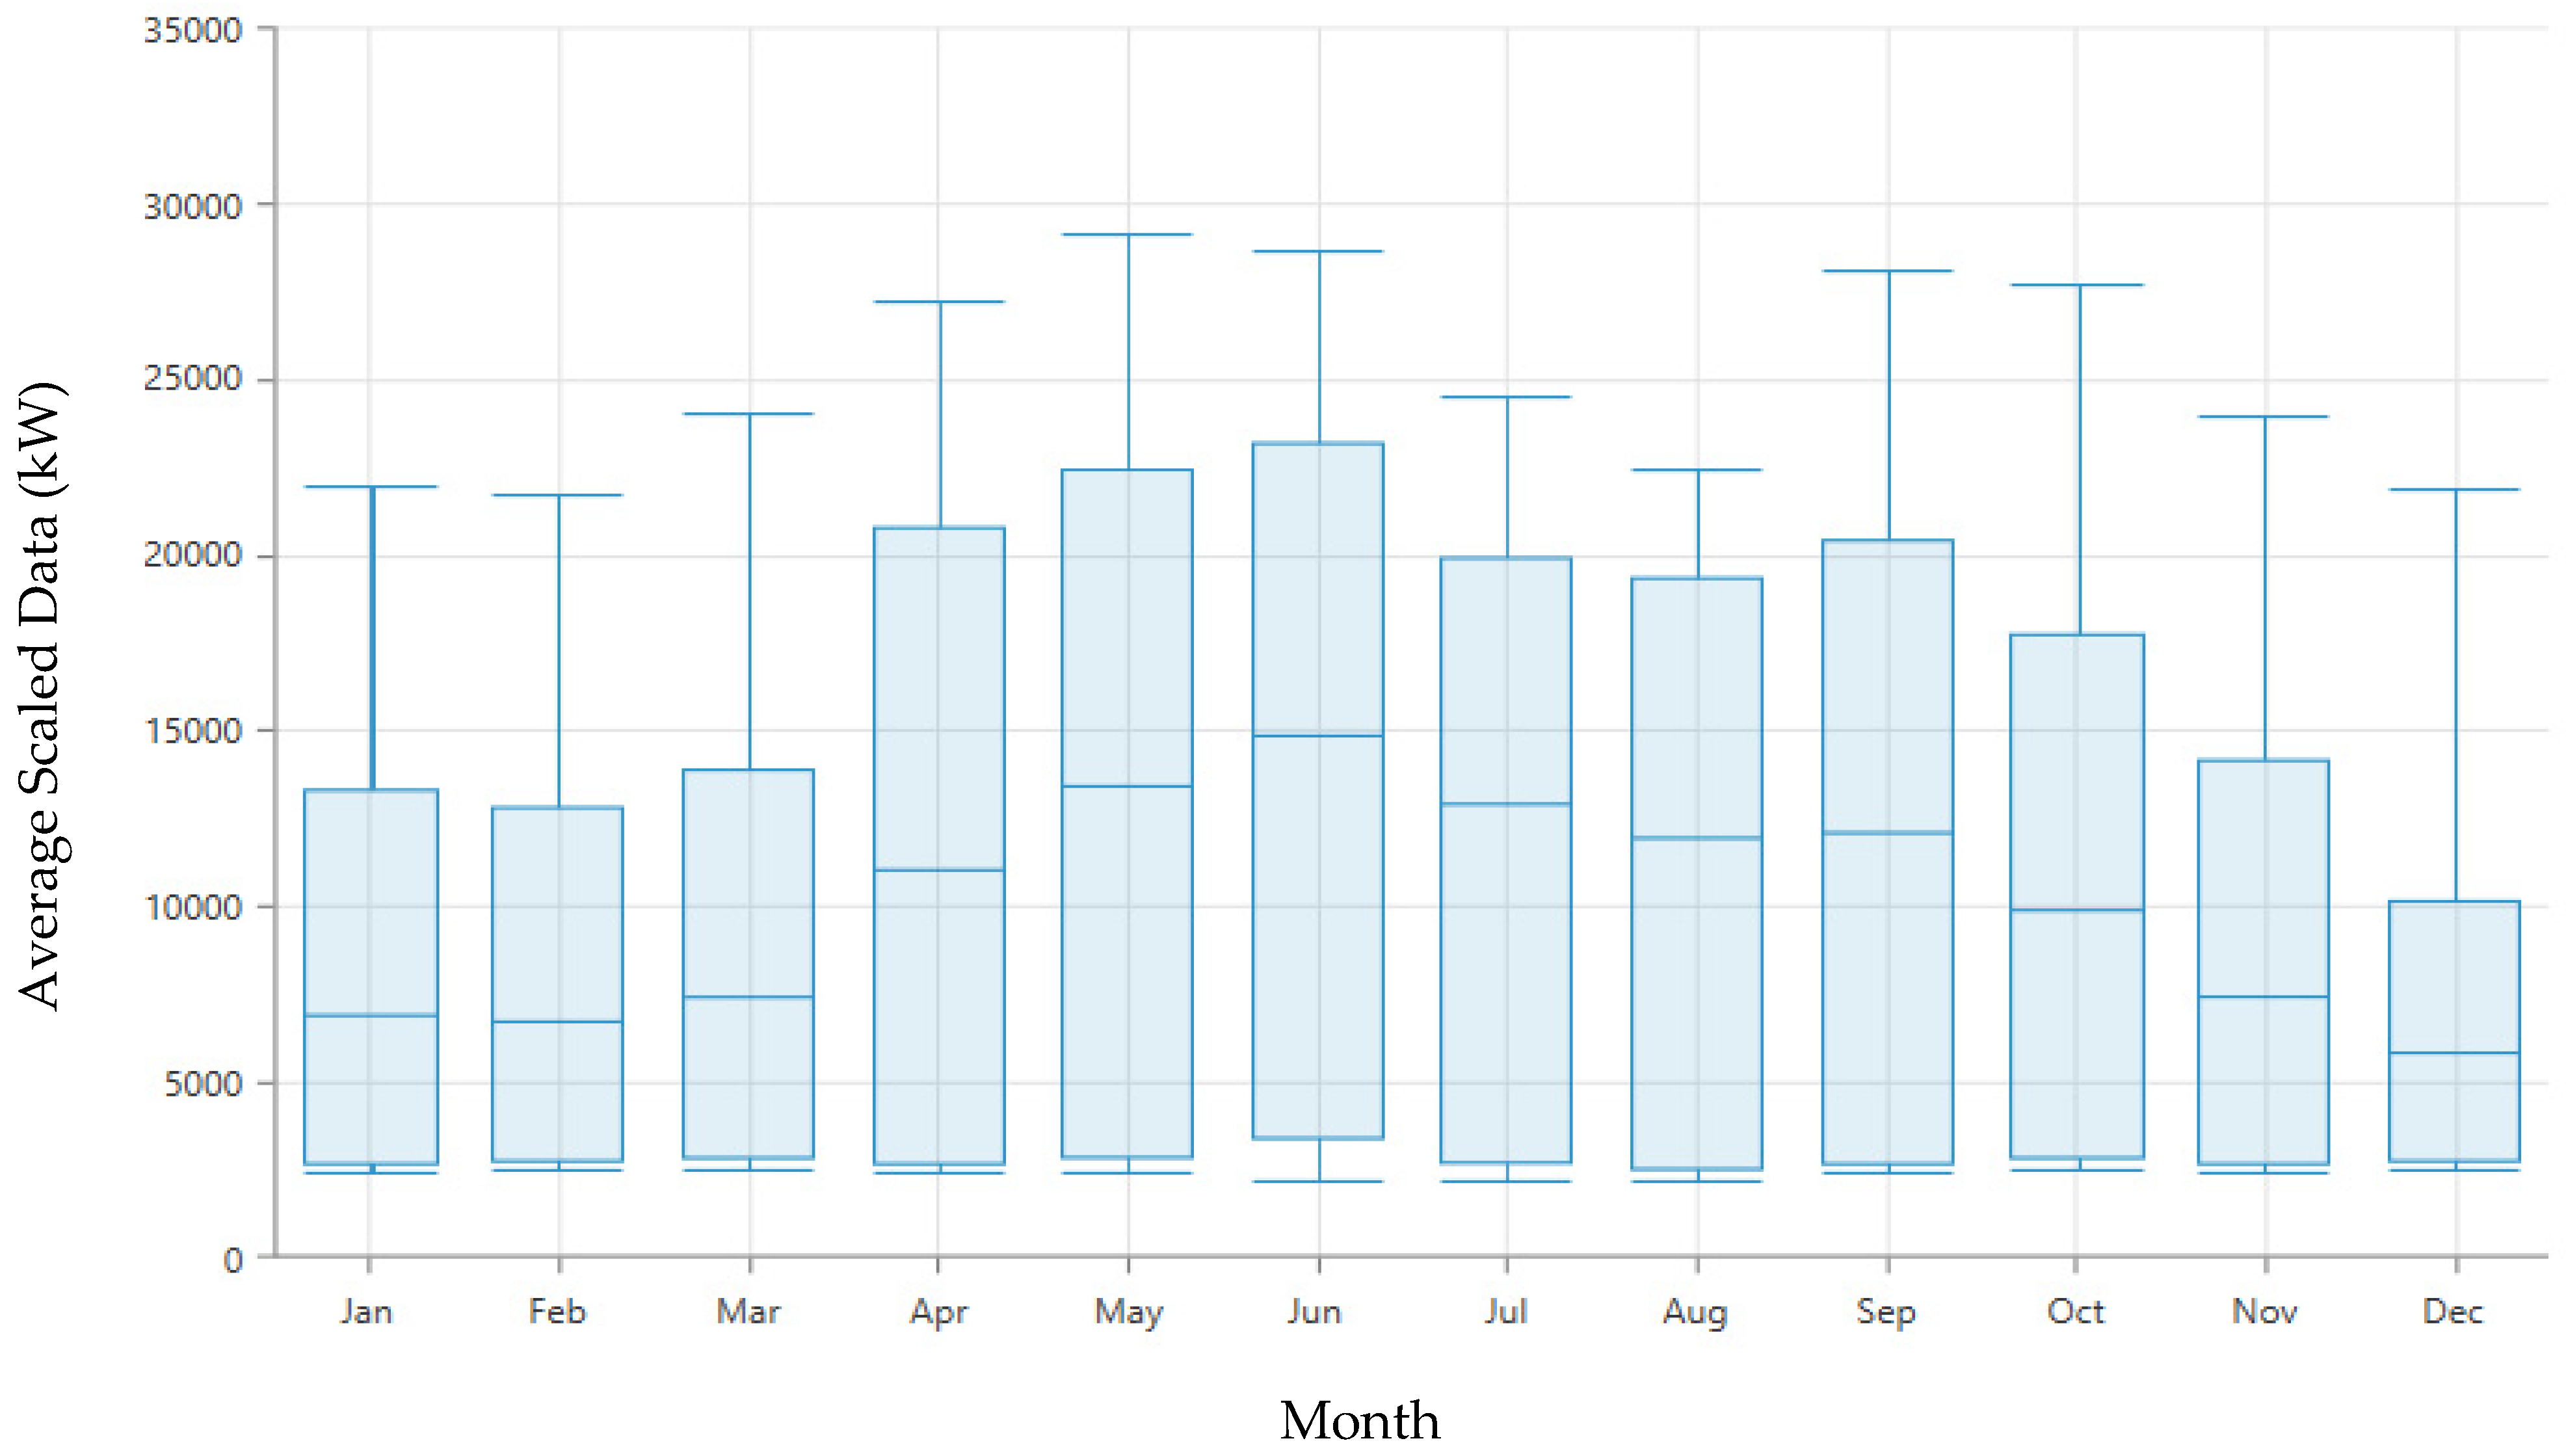
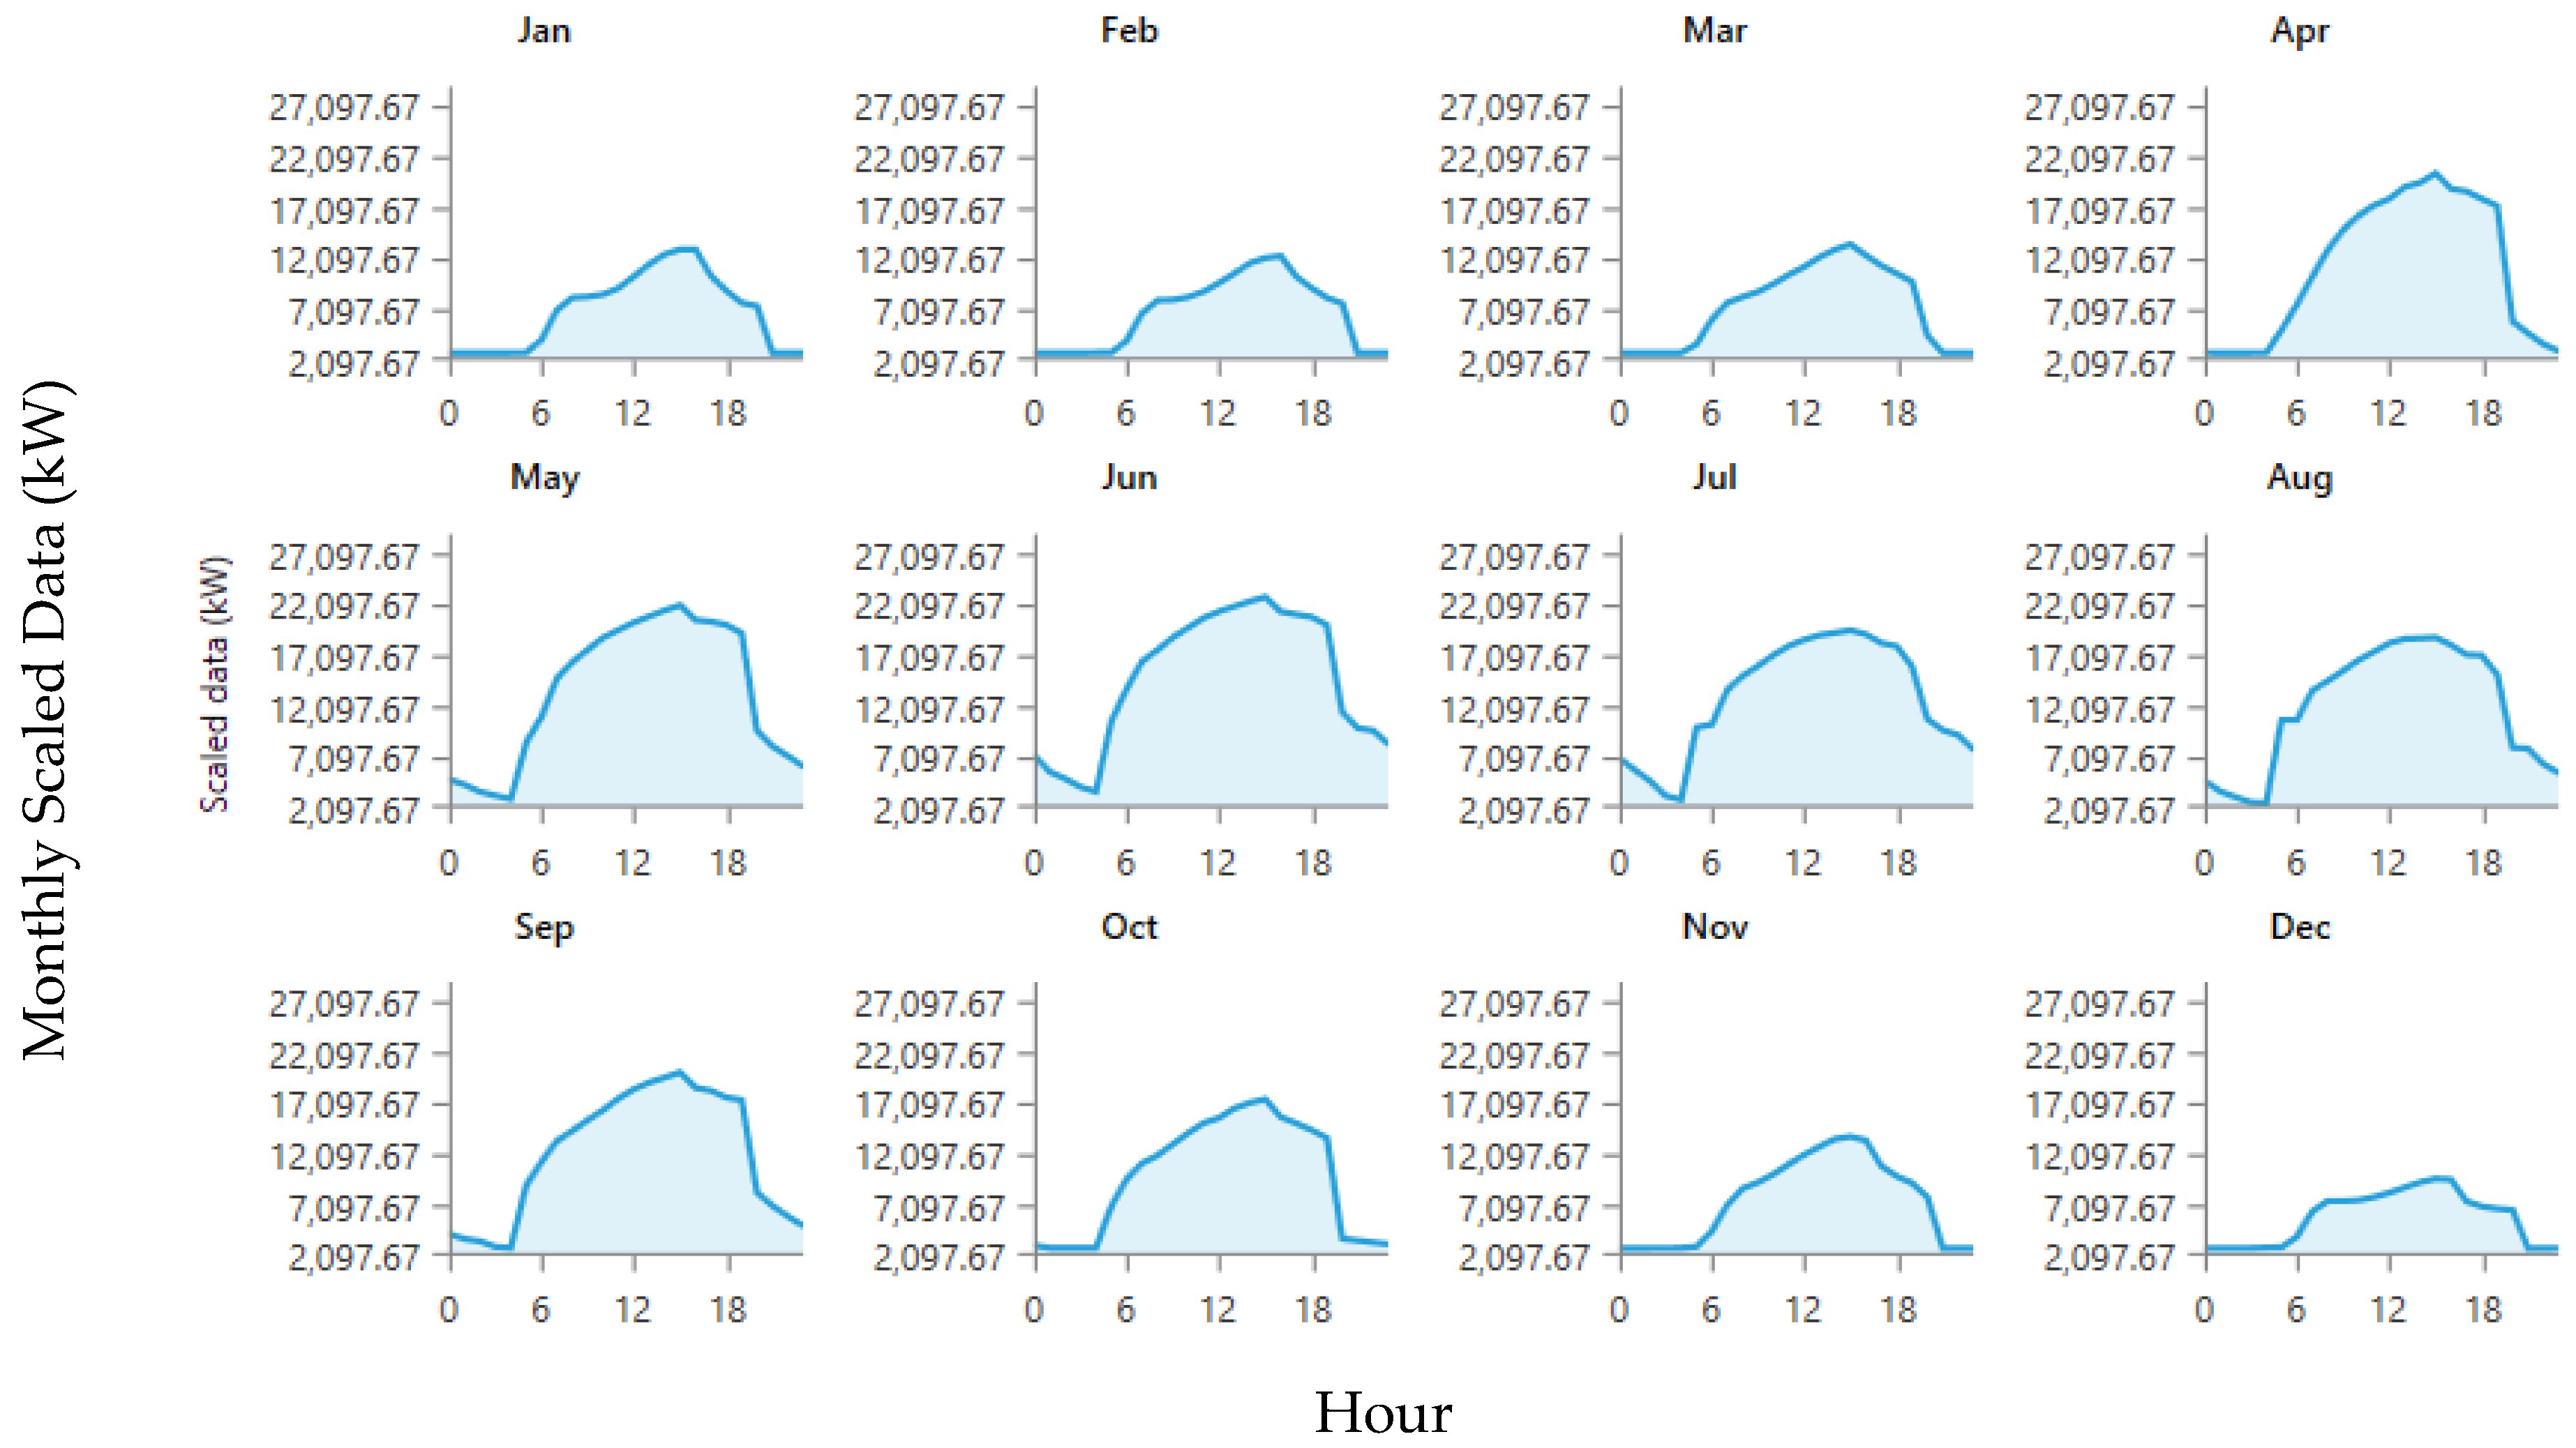
Figure 7 and
Figure 8 depict the estimated power demand, based on the available energy consumption data.
It can be noticed from
Figure 7 and
Figure 8 that the highest load demands correspond to the hottest period between June and August. The maximum annual power demand touches 28,700 kW, whereas the average is at 14,871 kW. The integration of RESs can help reduce a small proportion of grid purchases during that peak power demand. On the other hand, December to March witnesses the lowest power demand at the IUM, with the lowest annual demand of 2398 kW in February, whereas the average is 6754 kW. These months are considerably cold in Madinah, with an average temperature of 18.9 °C in January and February, compared to an average of 37.7 °C in August. The proposed microgrid investigation includes three alternatives, a PV system, wind system, and a hybrid system.
3.1. PV System Acting Alone
In this alternative, with an intended capacity of 1.5 MW, the PV system fraction represents 3.03% of the total electrical energy demand. The PV system is predicted to generate 2.68 GWh/y compared to 86.4 GWh/y purchased from the national grid. At the peak values, the renewable output covers up to 61.5% of the total load. This coverage occurs in the cold months, when the demand is lower, as can be seen from
Figure 9. It is important to note that the PV generation efficiency is negatively influenced by the very hot weather conditions witnessed in summer in Madinah. On the other hand, the length of solar radiation hours does not significantly vary between summer and winter, which means that the capacity factor is similar, whereas PV efficiency drops in summer reflecting a lower overall PV generation in summer.
The PV system has a capacity factor of 20.2%, with 4218 working hrs/y. The LCOE of the PV fraction is determined to be 0.051 USD/kWh. This LCOE equals 0.19 SAR/kW, which provides an opportunity to sign a power purchase agreement (PPA) with a third-party energy company at a FiT rate of 0.19 SAR/kWh. This price assumes a subsidy of 15% as a value added tax (VAT) relief for the incentivization of renewable energy projects. Given the simulation results obtained, we get:
The total cost of the PV system is USD 1,725,000 (i.e., 1150 USD/kW), as obtained from local suppliers for the FoE prototype. Accordingly, the simple payback period is 18.6 years. In terms of environmental benefits, this alternative leads to an annual reduction of 54.6, 0.237, and 0.116 million kg of carbon dioxide (CO2), sulfur dioxide (SO2) and nitric oxide (NOx), respectively.
Figure 10 presents the correlation of the cell temperature to the ambient temperature, as per Equations (1)–(4), which must be considered, especially in the high-heat months. It depicts the positive relationship between the ambient and the cell temperatures.
The adopted PV panels are fixed open racks with no tracking systems; the orientation is thus determined to optimize the energy production, considering the specific latitude of 24.48°. The optimal angle to orient the solar panels to generate maximum electrical power on 28th July, the day with the highest GHI average in the TMY, at one hour after solar noon. The solar module orientation is determined through the solar angle calculator for the specific location [
36].
3.2. Wind System Acting Alone
In this model, a system comprising 300 small-scale wind turbines is investigated. The total rated installed capacity of wind turbines is 1.05 MW. This system represents a fraction of 3.07% of the total electrical energy demand and is estimated to produce 2.71 GWh/y, compared to 85.70 GWh/y purchased from the grid. The LCOE of the wind fraction is determined to be 0.064 USD/kWh. At the peak values, the renewable output covers up to 47% of the total load. The capacity factor of the wind turbine system is 29.5%, with 8046 operating hrs/y.
Several studies investigated the potential locations for wind energy in Saudi Arabia and considered the western and eastern coastal regions and the high mountains, such as Jizan, Yanbu, Abha, and Dhahran, to be more suitable for such projects [
37,
38,
39,
40]. This LCOE equals 0.24 SAR/kWh. Thus, given the simulation results obtained, we get:
The total cost of the wind system is USD 1,260,000 (i.e., 1200 USD/kW). Accordingly, the simple payback period is 23.6 years. This alternative provides a longer payback period compared to the PV, the only alternative.
3.3. Hybrid System
Considering all the associated benefits, including the strategic goal of diversifying energy sources, and enhancement of universities’ areas utilization factor, a third alternative combining PV with wind energy is also investigated.
In this alternative, wind turbines and PV modules are hybridized and proposed with a total installed capacity of 1.37 MW. This capacity represents a fraction of 3.7% of renewable energy in the electrical energy system. The system includes 1.05 MW of installed capacity from wind and 0.315 MW from PV. Therefore, the fraction of wind turbines represents 77% of the total renewable fraction, while the PV represents 23%. The total annual generation is estimated to be 2.71 GWh/y from wind and 0.56 GWh/y from PV, compared to 85.50 GWh/y purchases from the grid. At the peak values, the renewable output covers up to 53.8% of the total load. The LCOE of the RES fraction is 0.061 USD/kWh. This LCOE equals 0.23 SAR/kWh. A FiT rate of 0.23 SAR/kWh can therefore be considered. Given the simulation results obtained, we get:
The total cost of the hybrid RES system is USD 1,622,250 (i.e., 1150 USD/kW for PV and USD 1200 for wind). Accordingly, the simple payback period is 20.7 years. This alternative requires a higher period to pay back its costs compared to the PV-only alternative and is lower than the wind-only alternative; however, it provides an important opportunity for electrical energy diversity, reduced impact of renewable energy intermittency, and improvement of the know-how level of two RES technologies. In terms of environmental benefits, this alternative leads to an annual reduction of 54.2, 0.235, and 0.115 million kg of CO
2, SO
2, and NO
x, respectively.
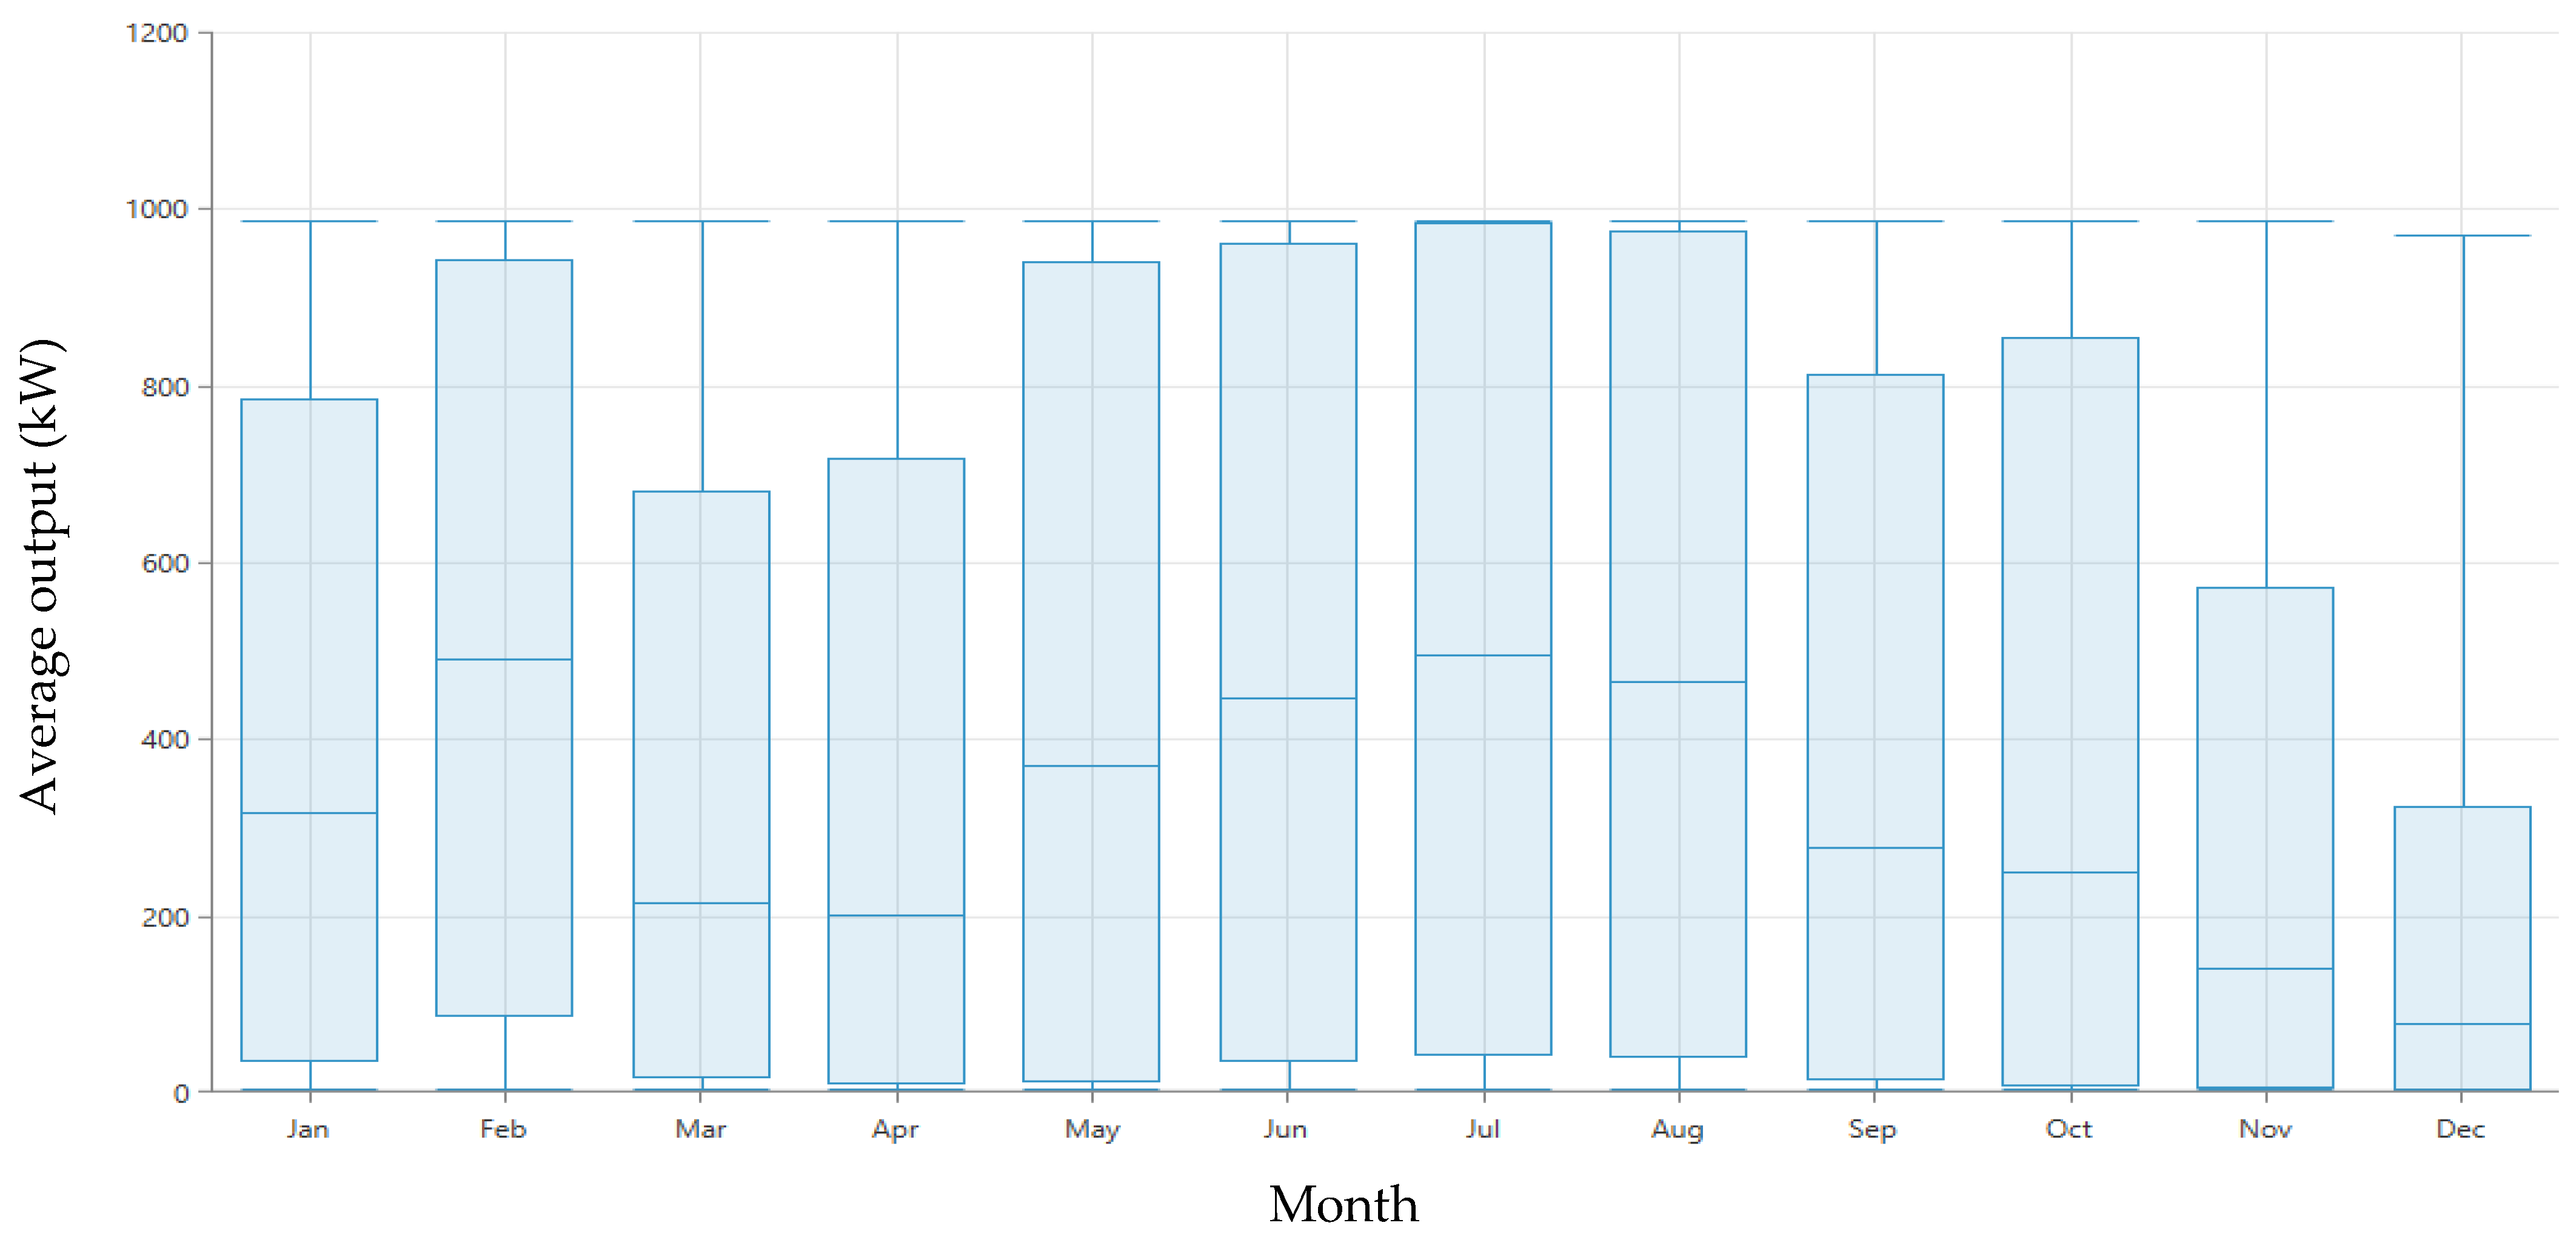
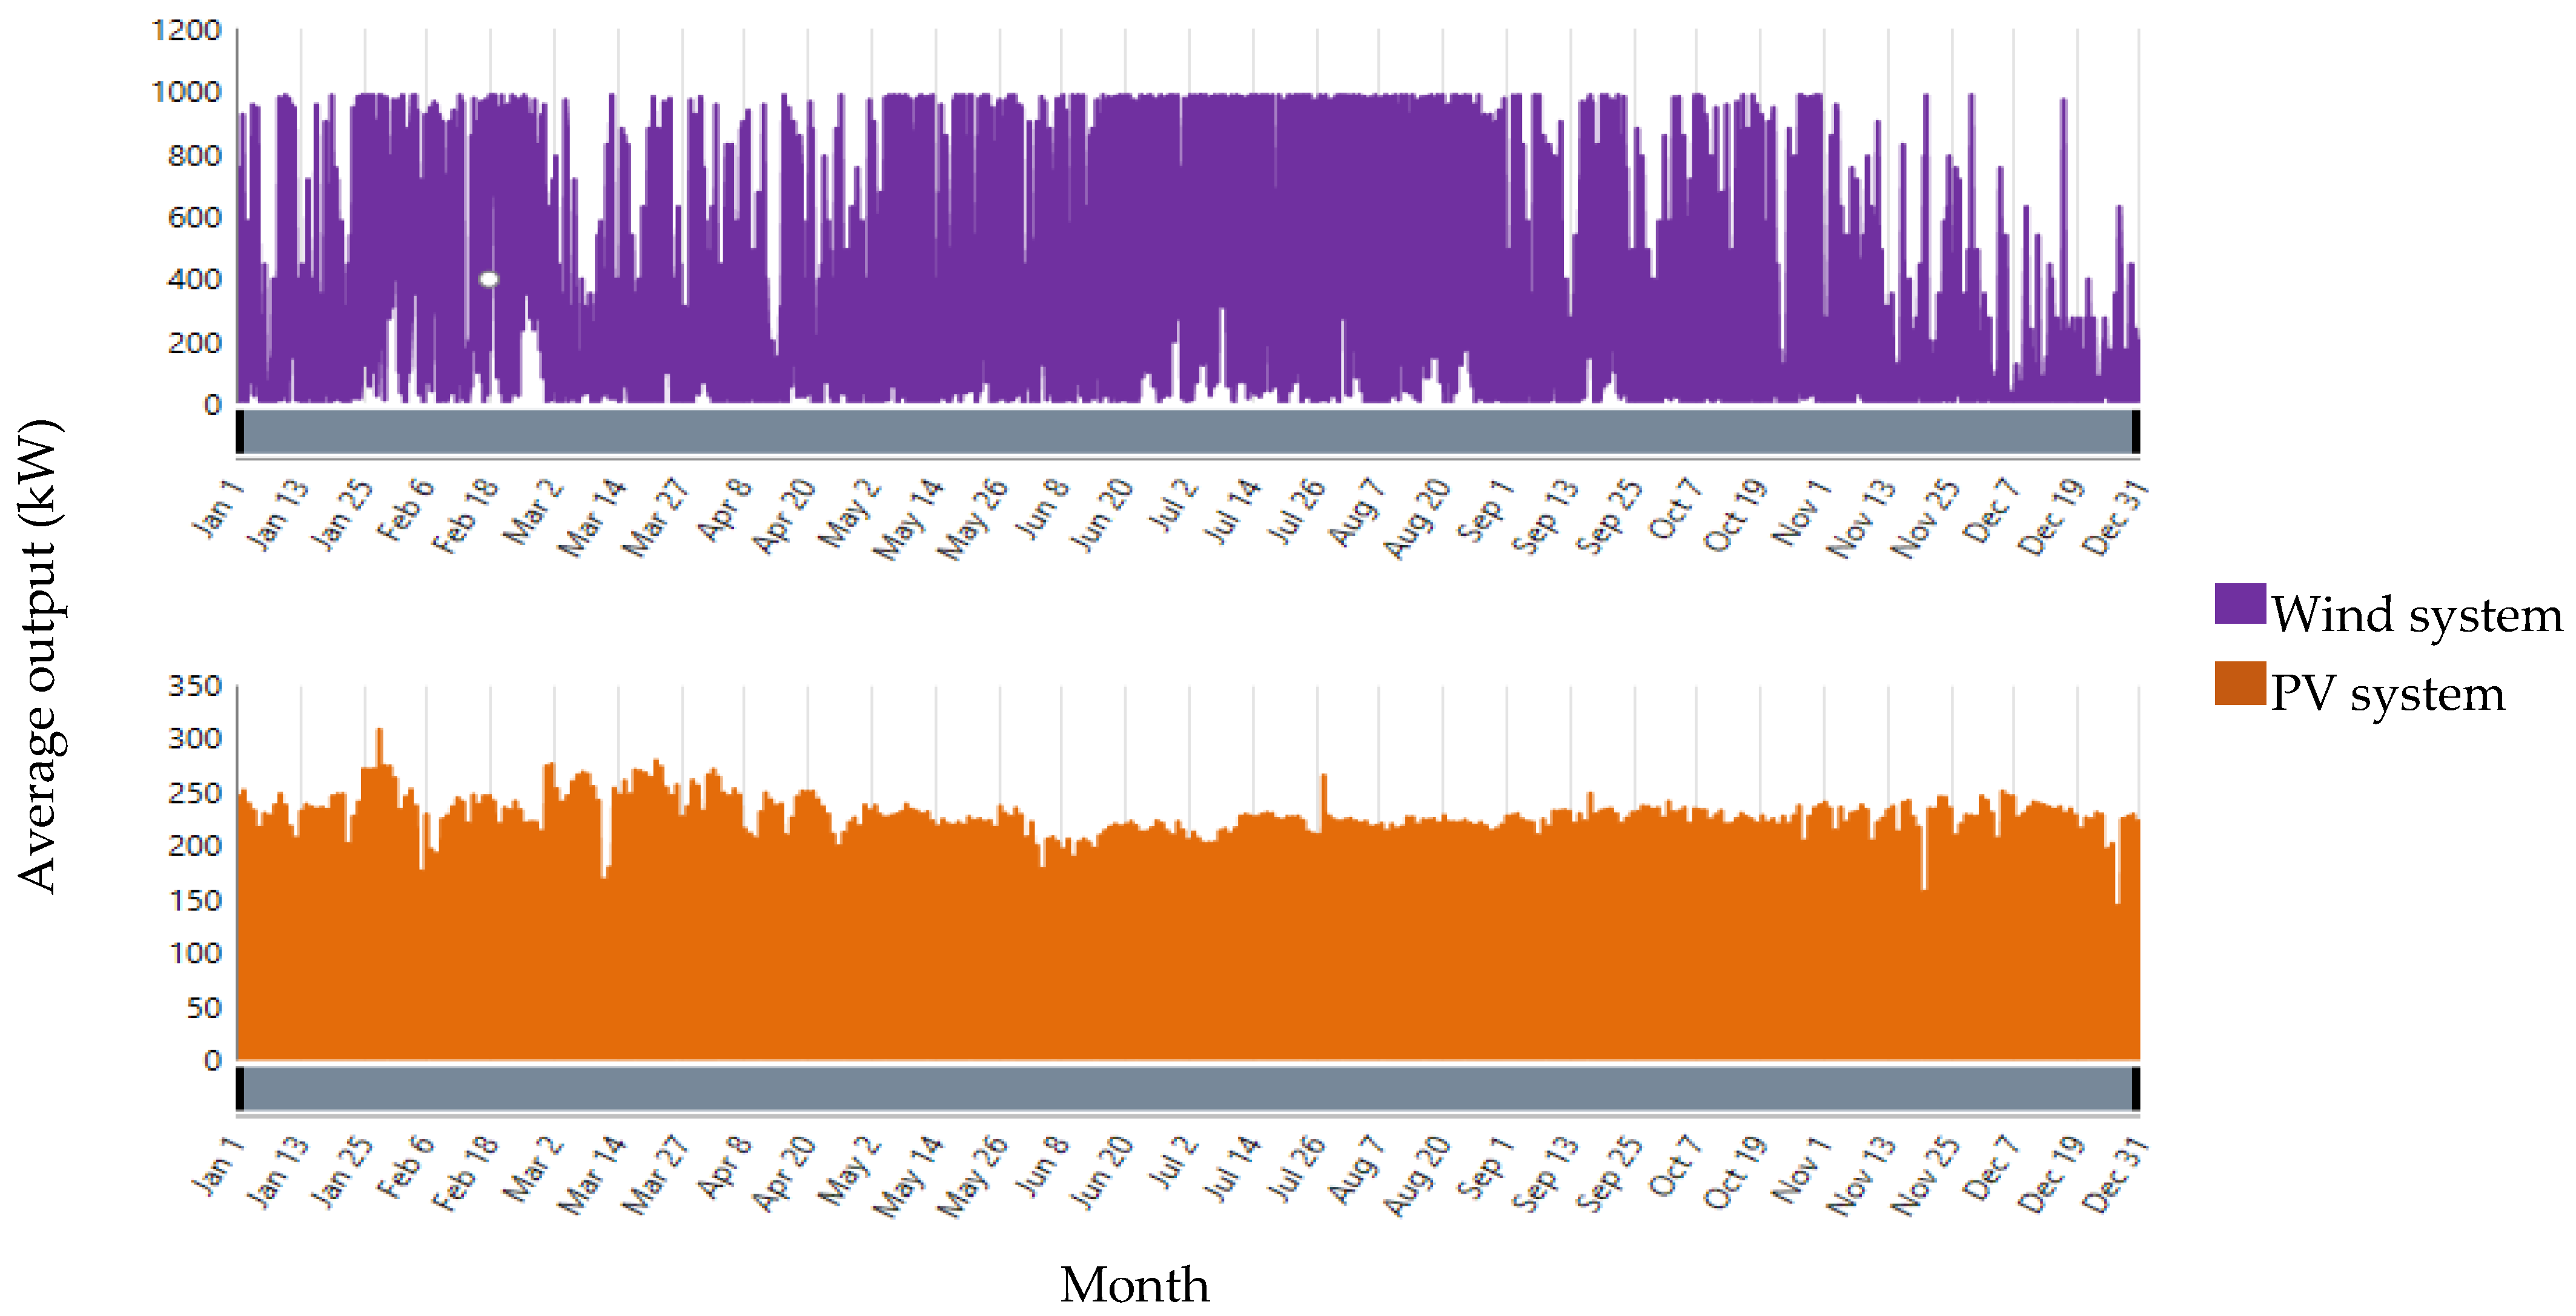
Figure 11 shows the performance of the wind and solar portions power output.
The wind system output is corelated to the wind speed. Summer months witness high average outputs, which are the months of the high wind speed. In addition, February witnesses high averages of wind generation as is displayed in the TMY file from 2017, a year that had high wind speeds in winter. Furthermore,
Figure 12 depicts the output of the PV portion and the wind portion in the hybrid system. The PV system covers in winter months for the wind system mitigation when its output decreases owing to lower wind speeds, as can be seen in March and April. On the other hand, a slight drop is noticed in the PV portion output due to the PV efficiency drop in hot summer in Madinah, which is compensated by the wind system.
The three proposed alternatives are compared regarding their technical and financial performance.
Table 4 and
Figure 13 highlight the technical and financial performance of the alternatives.
It can be noticed from
Figure 13 that the PV alternative has the lowest initial cost, LCOE, and a simple payback period. The PV system comes at a lower installation cost, following a significant reduction in module costs in the last decade and the impact of economies of scale. Saudi Arabia benefits from excellent levels of GHI throughout the year, with more than 12 hours of daylight on average in all nationally monitored locations [
41]. This, combined with the substantial improvement in PV module efficiency, makes the PV alternative the best in financial parameters.
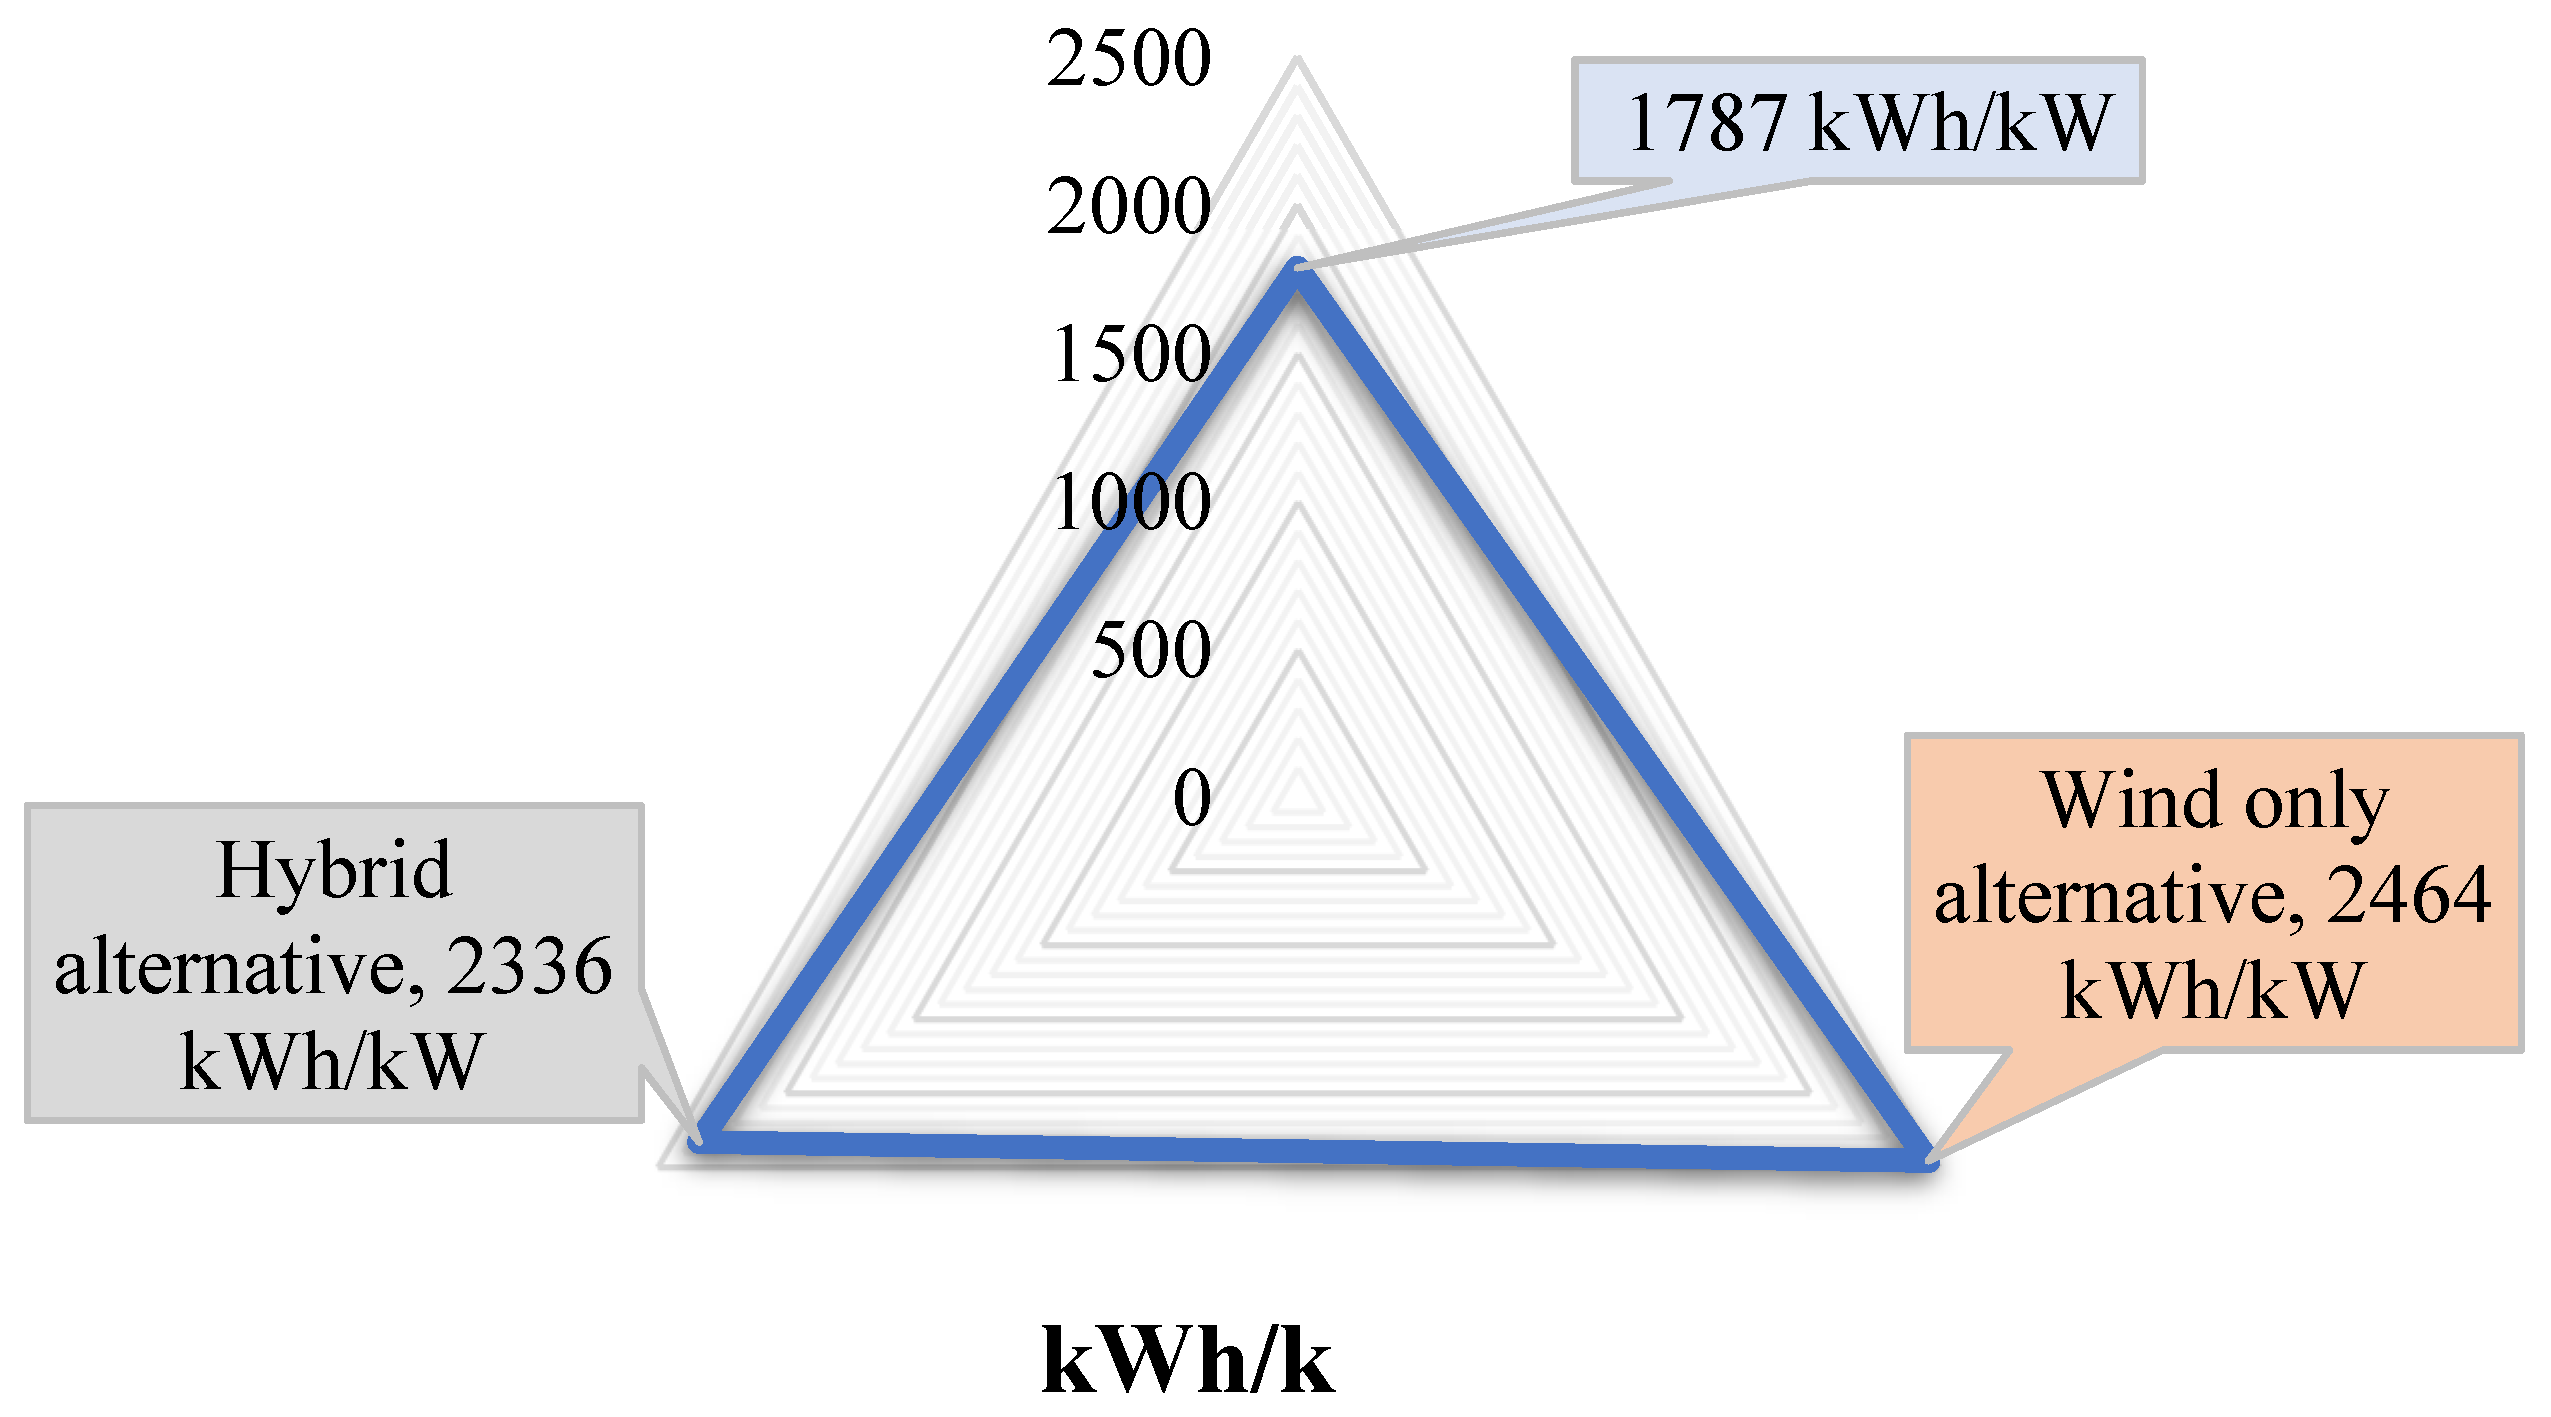
Table 4 depicts that the wind system alternative has the highest capacity factor, as the daily hours of wind availability are not correlated to sunrise and sunset. This enabled the wind system alternative to achieve the highest score in kWh/kW factor, which is presented in
Figure 14. On the other hand, the high initial cost, and the insignificance of wind resource levels in Madinah for electricity generation led to a higher LCOE, nearing the highest range reported in the literature.
The hybrid alternative has the highest annual generation, although its installed capacity is lower than the PV alternative. This is due to the higher capacity factor, which is an important support for energy source diversification and enhanced system reliability. The renewable fraction of the hybrid option is the highest among the investigated alternatives at 3.3%, whereas the simple payback period is lower than the wind-only alternative, owing to the inclusion of PV at a lower initial cost.
4. Validation and Sensitivity Analysis
To validate the results, the findings of initial cost, payback period, and LCOE were compared to the values reported in the literature as well as international databases considering PV and wind systems. The determined LCOE of the wind system (i.e., 0.064 USD/kWh) is in line with the range reported in Lazard’s LCOE analysis of 2019 [
38] (i.e., 0.028–0.068 USD/kWh) and reports IRENA [
42] at 0.068 USD/kWh. The determined LCOE in this study is near the high end of the reported LCOE, which reflects the lack of significant wind resources in the Madinah region for the installation of wind energy. Lowering the LCOE requires a larger installed capacity to benefit from the economies of scale. Additionally, Ekren et al. [
19] designed a hybrid PV-wind system and analyzed its sizing for electric vehicles charging stations in Turkey and concluded that the LCOE will be 0.064
$/kWh compared to 0.061 USD/kWh in the present study resulting in a 5% deviation.
For PV system validation, the results were compared with calculations obtained from the solar calculator developed by the Saudi Water and Electricity Regulatory Authority (WERA) and values reported in the literature. The LCOE determined in this study (i.e., 0.051 USD/kW) was found to be slightly lower than the LCOE reported by IRENA for commercial PV plants in India in 2020 (i.e., 0.055 USD/kW) [
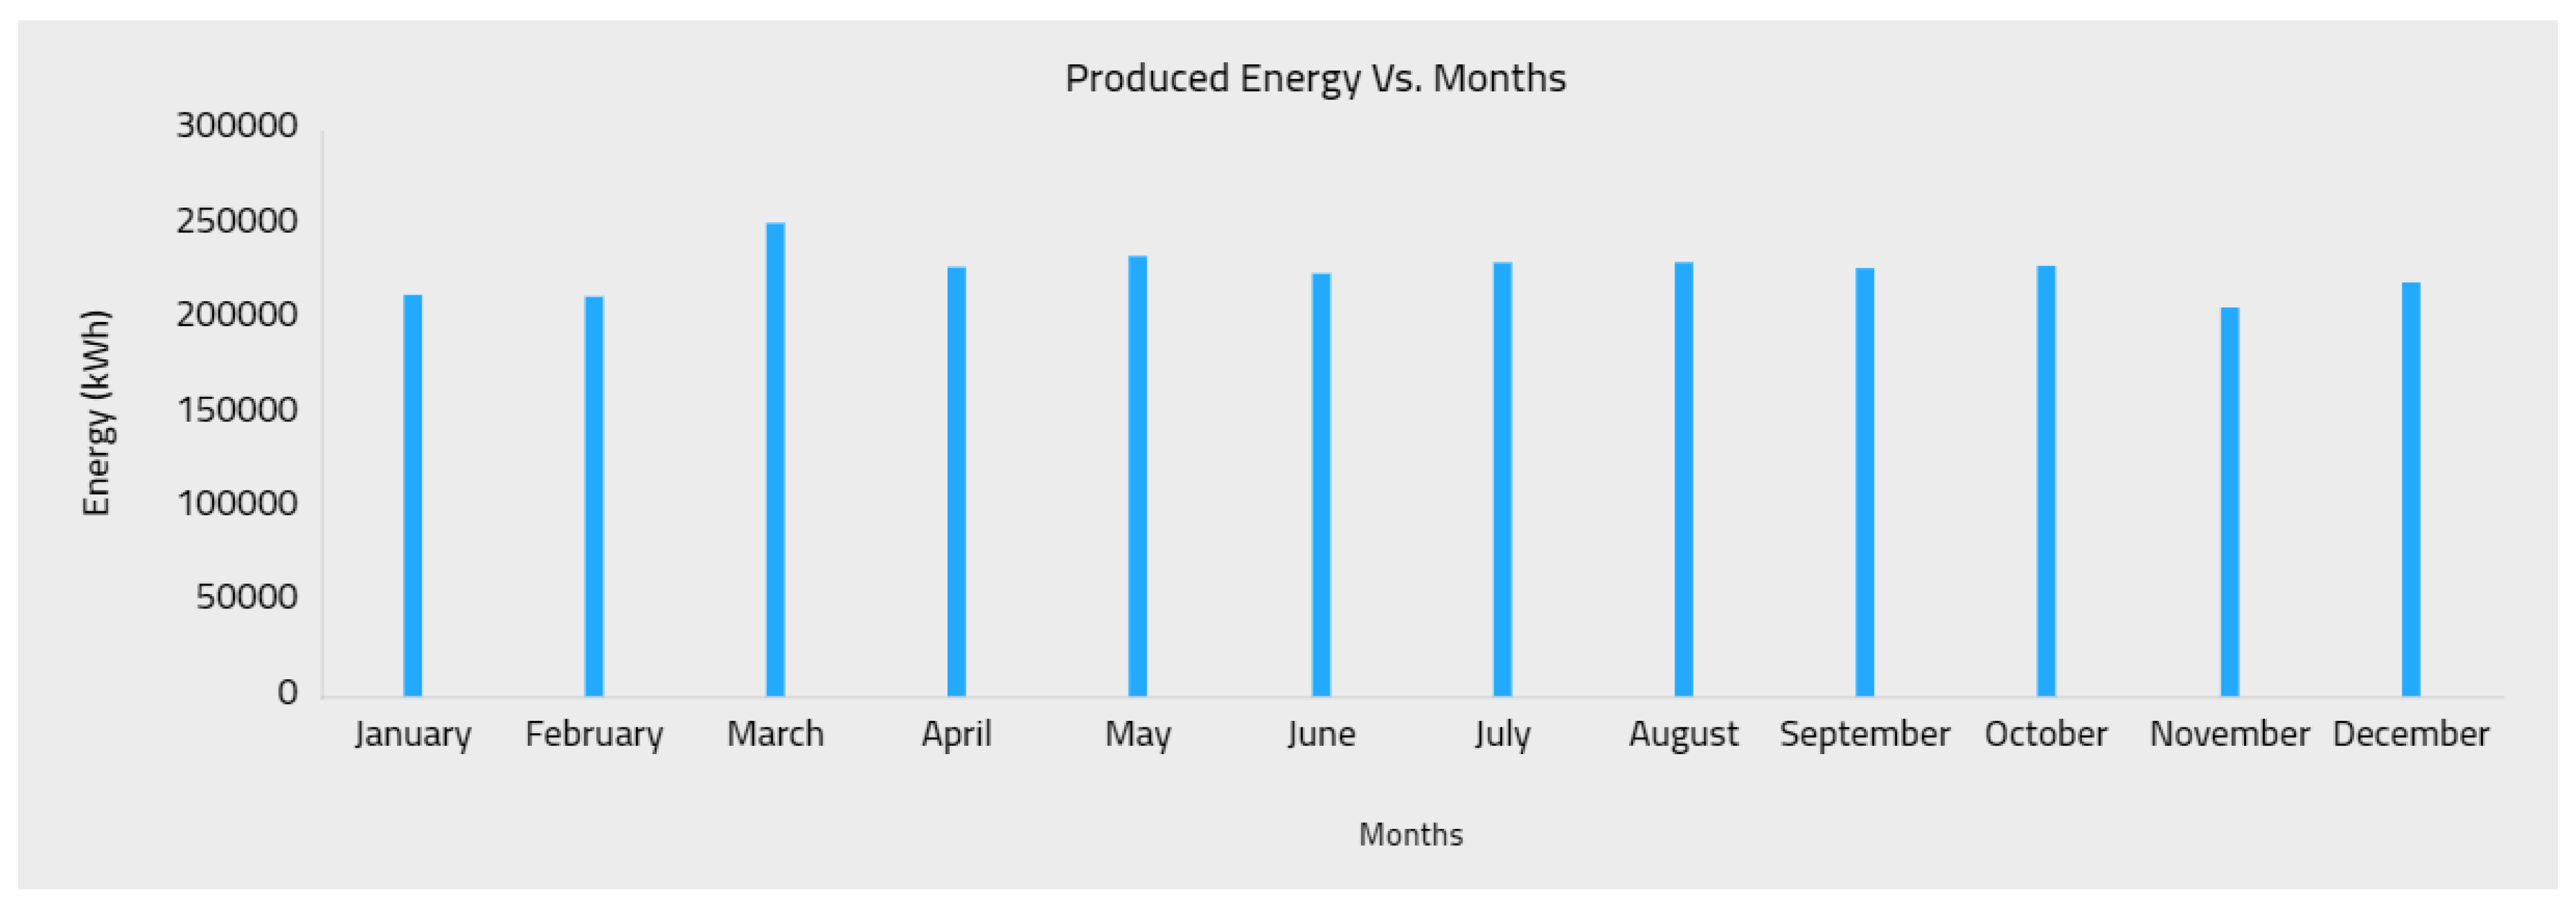
43], benefiting from the high GHI levels in Madinah with long solar radiation hours. Furthermore, WERA has developed a tool called Shamsi in 2021. Shamsi (translates as “my sun”) is similar to the NREL PV calculator, which provides a simplified calculation for consumers to determine the estimated costs, generation, and payback periods based on their locations and load consumption. Shamsi was utilized for the PV alternative, which achieved the lowest LCOE and simple payback period, vis-a-vis the other alternatives analyzed in the present study. A fixed open rack PV system of 1.5 MW at IUM was therefore investigated. The PV calculator of Shamsi predicted an average annual generation of 2.7 GWh/y.
Figure 15 presents the breakdown of the PV-system-produced energy.
Table 5 compares the annual generation predicted by Shamsi and that obtained in the
Section 3 based on the conducted simulation.
Figure 15 and
Table 5 illustrate the similarity of the results. With regard to Shamsi calculations as reference values, the simulation results deviate by only 0.75% for the average annual generation and 6.3% for the simple payback period. Further, the LCOE has been reported to be 0.055 USD/kWh by IRENA for commercial PV plants in India in 2020, which deviates by 7.3% from the result of the present study (i.e., 0.051 USD/kWh) [
43]. Considering the capacity factor of PV systems, Imam et al. [
44] conducted a study of grid-connected residential PV systems in Jeddah using the System Advisor Model (SAM) and arrived at a capacity factor of 22%, compared to 20.2% in this study.
A sensitivity analysis is carried out to examine the impact of changing critical parameters on the results. The effect of variations on the initial cost of the LCOE is determined.
Table 6 presents the correlation of initial cost variation with the LCOE of the three alternatives. It is noticed that the impact is higher on the PV system, calling for careful attention to the cost reduction trends, especially in the PV module prices.
5. Conclusions
As universities in Saudi Arabia are moving towards increasing their share of self-funding, it would be of significant benefit to invest in distributed generation (DG) systems. The implementation of such programs at the national level enables benefiting from the available spaces at universities, such as roof tops. This, along with energy efficiency polices, can help the massive expansion required of central power plants to meet the ever-increasing electricity demand.
This research investigated several alternatives for the integration of renewable energy resources (RESs) in the Islamic University of Madinah (IUM). The proposed microgrid alternatives included a PV system, wind energy system, and a hybrid system. A techno-economic analysis was carried out to evaluate the potential contribution of each system to the university. Accurately measured weather data were collected and utilized to formulate a typical meteorological year (TMY) profile for the simulation. Moreover, an accurate load profile was incorporated into the analysis to reflect on the results’ accuracy. The university campus includes nine colleges, three institutes, a healthcare center, supporting deanships, two mosques, a library center, sports facilities, and students’ residence.
Several parameters were studied, including the simple payback period, initial costs, levelized cost of energy (LCOE), capacity factors, and feed-in tariff (FiT). To do so, simulation was conducted by investigating meteorological data, search space, load profile, equipment characteristics, economic data, and technical specifications.
The proposed systems cover 3–3.7% of the overall annual electrical energy consumption of the university. The PV alternative achieved the best financial results, including the lowest initial cost per kW, LCOE, and simple payback period at 1150 USD/kW, 0.051 USD/kWh, and 18.6 years, respectively. The annual reduction in the electrical bill based on the PV alternative exceeds USD 92,000. The wind alternative comes at the highest initial cost per kW, LCOE, with a payback period of 1300 USD/kW, 0.064 USD/kWh, and 23.6 years, respectively. However, the wind alternative provides the best production rate per unit of installed capacity at 2464 kWh/kW, owing to having the highest capacity factor of 29.5%. The results of the wind alternative are significantly influenced by the insufficiency of high wind availability, compared to solar radiation in Madinah. To benefit from the long availability of wind compared to solar radiation and the strategic importance of energy source diversification, a hybrid option was investigated. The hybrid system benefits from the PV portion to lower the financial parameters, achieving an initial cost of 1266 USD/kW, a LCOE of 0.061 USD/kWh, and a payback period of 20.7 years.
Validation was carried out through comparison of acquired results with reports from literature and international energy agencies. In addition, a PV calculator recently developed in Saudi Arabia is utilized for PV system results validation. A sensitivity analysis was also conducted to evaluate the impact of the most influential parameters. The implication of the proposed project helps decision making to support planning in line with the Saudi strategic targets in the energy and educational domains. Future work is intended to cover different domains beyond the techno-economic aspect, including the environmental and social benefits, to consider all relevant quantitative and qualitative factors.
