Article

Developing and Validating an Assessment Scale to Measure the Competitiveness of Wellness Destinations

by
Thadathibesra Phuthong
1,
Pongpun Anuntavoranich
2,*,
Achara Chandrachai
3 and
Krerk Piromsopa
4
1
Technopreneurship and Innovation Management Program, Graduate School, Chulalongkorn University, Bangkok 10330, Thailand
2
Department of Industrial Design, Faculty of Architecture, Chulalongkorn University, Bangkok 10330, Thailand
3
Department of Commerce, Chulalongkorn Business School, Chulalongkorn University, Bangkok 10330, Thailand
4
Department of Computer Engineering, Faculty of Engineering, Chulalongkorn University, Bangkok 10330, Thailand
*
Author to whom correspondence should be addressed.
Sustainability 2022, 14(7), 4152; https://doi.org/10.3390/su14074152
Submission received: 1 March 2022 / Revised: 22 March 2022 / Accepted: 28 March 2022 / Published: 31 March 2022

Abstract

:
The present study developed an assessment scale to measure the competitiveness of wellness destinations in Thailand, particularly from the perspective of the wellness tourism firm. A literature review and in-depth interviews informed the components and indicators for the assessment. Then, a scale was developed to evaluate the effectiveness and accuracy of the measurement scale using exploratory factor analysis and verification by confirmatory factor analysis. These analyses generated seven dimensions of wellness tourism: destination environment, travel and policy, infrastructure and capacity, manufactured and cultural resources, strategy and structure, novelty potential, and cooperative and proactive marketing. The results indicate strategies and considerations to improve the competitiveness of wellness destinations in Thailand. The assessment tool may be valuable for wellness tourism clusters and stakeholders to assess and promote wellness destination competitiveness.

1. Introduction

Wellness tourism has been linked to improving wellbeing. As a subsector of tourism, it includes all the services provided to holistically maintain and improve a person’s health. When traveling abroad, tourists have the option to include wellness services [1]. While some medical tourism focuses on traditional medicine as a reactive response, the traditional wellness paradigm has been centered around proactive wellness practices for prevention and integrated wellness-oriented approaches [2]. In addition, wellness tourism connects and promotes tourism of every group and is one of the ten target industries considered a new engine of the global economy. The value of wellness tourism is the fourth highest in the sector, following cultural, culinary, and eco/sustainable tourism [3]. This is due, in part, to health-related trends, the promotion of quality of life, and ageing societies. As populations adapt to increasing numbers of the elderly, work-related illnesses, daily stresses, and the limitations of traditional medical treatments, interests have shifted to physical and mental preventive healthcare, including cosmetic and antiaging treatments. Tourists in this subsector have sufficient purchasing power and have been willing to pay more for products and services they consider beneficial to their health [4]. The Global Wellness Economy: Looking Beyond COVID, December 2021 report from the Global Wellness Institute (GWI) showed that, in 2020, the global wellness economy was worth USD 4.4 trillion while global wellness tourism was worth USD 720.4 billion in 2019 and USD 435.7 billion in 2020 as a result of the global COVID-19 pandemic. This was 40 percent lower, as compared to the 43 percent of the overall tourism industry. During 2019–2025, GWI has predicted that the yearly growth of wellness tourism will rise by 20.9 percent, as compared to other sectors of the wellness economy such as beauty and personal care, spas, and wellness lifestyle real estate. It was also predicted that the mean yearly rate of growth in the wellness economy was 9.9 percent, which outpaced the global economic growth at 7.3 percent, as predicted by the International Monetary Fund (IMF) [5].
Furthermore, the GWI report included data for wellness tourism trips by region in 2017, 2019, and 2020. In 2020, there were 600.8 million instances of wellness tourism. This was lower than that of 2019 at 335.6 million instances. The Asia-Pacific region accounted for the highest proportion of wellness tourism at 209.5 million instances, or 34.87 percent, followed by Europe at 221.1 million or 36.80 percent and North America at 124.8 million or 20.77 percent. However, the cost of wellness tourism was highest in North America. They also found that the rate of growth in wellness tourism has rapidly increased in Sub-Saharan Africa, the Middle East, North Africa, and the Asia-Pacific region [5]. From the data of the Global Wellness Economy Monitor in 2021, the market value of global wellness tourism in 2020 was an estimated USD 4.4 trillion amidst the chaos and the disruptions caused by the global COVID-19 pandemic. The average expansion between 2020 and 2025 was 9.9 percent per year. However, with wellness tourism as an industry with an emphasis on services, its employment rate was as high as 17.9 million workers [6]. Subsequently, the wellness economy has expanded rapidly with hot springs, spas, and other related health-promoting services such as beauty and antiaging services, including fitness and the mind and body [7], and ranked third out of ten industries in the wellness economy [4].
Of the twenty largest wellness tourism markets worldwide in 2020, Thailand ranked fifteenth with USD 4.7 billion in expenses, six and a half million traveling instances, and 500,000 jobs created. Nevertheless, with the COVID-19 pandemic, in 2019–2020, economic expansion was lowered by 72.3 percent. However, the data of the average annual rate of growth during 2017–2019 show that the trends for wellness tourism in Thailand had continuously expanded and were the highest among the top twenty destination markets at 18.7 percent, due to, at least in part, its geographical location and the variety of resources for wellness tourism and travel [5]. Thailand’s wellness tourism incorporates Thai traditions and health science, including Thai knowledge of both mental and physical health services. According to data from 2012, over a wellness tourists, both international and domestic, were visiting Thailand. In addition, they were linked to other activities that promoted other groups of tourists and made Thailand a premier wellness destination in Southeast Asia [8]. As the public sector has predicted that Thailand will be Asia’s medical and health destination at least until 2033, wellness tourism has become a focus in Thailand. Moreover, the emerging interest in maintaining health and searching for better, cheaper, and faster health services has led to the continuous growth of wellness tourism. As opposed to medical tourism, which is focused on traditional medical solutions for illness and disease, wellness tourism focuses on prevention, health improvements, and a better quality of life. These types of health services support those recovering from illnesses and those wishing to improve their overall wellbeing.
Since tourists may have more than one motivation for traveling, wellness tourism is often related to other forms of tourism, such as medical, cultural, sports, food, and ecological tourism. Wellness tourism, therefore, can promote other types of tourism, and it can add value and enhance the overall tourist experience. Thailand has incorporated traditional customs and practices as part of its health services so that they are unique and sought after by wellness tourists from around the world. These include holistic healthcare, Thai massages, Thai hermit exercise, and mental and physical restoration including “detoxes” and “eating according to life elements”, all of which are available for tourists and locals at various cost points. Typically, healthcare activities are incorporated into tour packages such as Thai massage tours, herbal food tours, and natural farming tours, or they may be amenities or extra services provided by accommodations such as spas and resorts [9].
In addition, the Thailand government also promotes the development of competitive service sectors that have potential for growth and supports, for example, the manufacturing sector in creating revenues from tourism, as well as developing tourism clusters according to each region’s potential and promoting tourism as needed by the market. The government’s “Thailand 4.0” policy also promoted wellness tourism [10]. Destination competitiveness refers to the readiness of an area for development, improvement, or adaptation, which is predominantly based on its appeal, or potential appeal, to tourists. Hudson et al. [11] indicated that competitiveness was important for the success of organizations, countries, and cities. However, competitiveness can be applied as a benchmark for the promotion and the development of tourist attractions, including those in the wellness tourism sector. Studies have been conducted in other countries concerning the competitiveness of wellness tourist destinations with different focuses, including: enhancing the competitiveness of a wellness tourism destination [12]; mountain-based tourist destinations and their impact on a person’s wellbeing [13]; productivity assessments of nature-based tourist destinations [14]; examination of the prosperity and efficiency of the tourism industry regarding economic recovery resulting from the COVID-19 pandemic [15]; revisiting destination competitiveness after the COVID-19 pandemic [16]; measuring the competitiveness of Iran’s health tourism [17]; determinants of health tourism competitiveness [18]; a comparable likeness of medical tourism competitiveness in India, Thailand, and Singapore [19]; profitability features of a medical tourism destination [20]; Singapore’s medical tourism competitiveness [21]; the factors behind the low interest in Russia as a medical tourism destination [22]; an analysis of the strategic management approaches of economic development in health tourism in Malaysia and Thailand [23]; the productivity advantage of originality in medical tourism in the Caribbean islands [24]; the determinants and the development strategies for medical tourism competitiveness [25]; a determination of station sustainability for Taiwan’s hot-spring tourism sector [26]; assessing the competitiveness of hot-spring tourism destinations [27]; sustainable improvement of competitiveness in rural tourism destinations [28]; development of an appraisal design for observing country-based tourism prosperity and efficiency [29]; a model of competitiveness in cultural heritage destinations [30]; the destination competitiveness of winter sport resorts [31]; the booster of rural tourism’s competitiveness [32]; and the competitiveness of surf tourism [33].
Nevertheless, despite public agencies placing more importance on promoting wellness tourism, Thailand’s ability to systematically evaluate the potential of a locale for wellness tourism and implement its development is still limited. Previous research has been focused on the exploration of wellness tourism demands regarding the trends, the behaviors, the demands, the experiences, and the satisfaction of wellness tourists [34,35,36,37,38,39,40,41,42,43]. Several studies emphasized exploring the management of tourist attractions, the development of routes, and the promotion of products to wellness tourists [44,45,46,47]. A number of studies concerning Thai spas and developing community wellness tourism explored quality development for businesses and communities and the types of wellness tourism in a particular area [48,49,50,51]. However, there has been a lack of research regarding the development of a measurement scale for evaluating the competitiveness of wellness destinations, particularly among those that offer niche services, rather than a more general view [52,53]; this would be especially useful for Thai destinations.
Therefore, this study developed a scale to assess the competitiveness of a wellness destination from the suppliers’ perspective. This study considered the following questions to attain these goals: (1) What factors contribute to a wellness destination competitiveness assessment? (2) How important are these factors to a wellness destination competitiveness assessment, particularly those which have been implemented in Thailand? First, an inductive approach was used to define and describe the competition factors of a wellness destination. After specifying a conceptual scope and highlighting the sub-components, a theoretical framework of wellness destination competitiveness was constructed using qualitative methodologies. The phrasing and content validity of parameters for wellness destination competitiveness were evaluated using data from a literature review and qualitative research. Second, exploratory factor analysis (EFA) and confirmatory factor analysis (CFA) were used to investigate two rounds of quantitative data. The findings were then employed to develop a multidimensional scale of wellness destination competitiveness. Consequently, this study may enrich future research into wellness destination competitiveness and provide a useful tool for the wellness tourism clusters and stakeholders to assess and manage wellness destination competitiveness from the perspective of wellness tourism enterprises.

2. Literature Review

2.1. Competitiveness in Economics and Management

Competitiveness can be defined through three approaches: behavioral, structural, and functional approaches. According to the behavioral approach, competitiveness is the act of identifying unique strategies businesses employ in a rivalry situation in order to provide financial efficacy of demand. The structural approach describes competitiveness as a strategy whereby there is regulation in terms of production such that there is an interbranch movement of factors of production. The functional approach, on the other hand, describes competitiveness as a major determinant of economic growth which results from businesses introducing development and innovative strategies. This approach argues that in order for a business to achieve a competitive advantage, it should be able to produce at a low cost and produce new products which satisfy the demand [54].
In line with Boikova et al. [55], competitiveness is a factor of economic growth. It ensures that there is there is efficient allocation of resources by ensuring that the resources used to produce a product are of good quality and conform with what the customer prefers. The resources are also allocated efficiently, minimizing the costs of production. The firms are also able to come up with new products and better production techniques. With improvement in efficiency, there is increased productivity, which in turn leads increased economic growth as measured by GDP per capita. The consumer is also able to utilize the product.
Competitiveness increases profitability. With increased competitiveness, there is greater research and development. The firms invest in research and development in order to bring out the business aspects that may not be working and come up with better business ideas. Research and development bring about innovation and thus improved products [56]. Improved products result in a sales increase, which leads to increased profitability of the company and consequently increased GDP [57]. Moreover, competitiveness reduces the level of unemployment in an economy. Owing to the fact that competitiveness increases the efficiency of production, bringing about economic growth, the unemployment rate reduces. Increased economic growth leads to an increased investment rate. Existing businesses are also able to operate at a low cost and thus are able to employ more people. The unemployment rate is thus reduced as a result of competitiveness [58].
In addition, competitiveness reduces the inflation rate. The higher the competitiveness, the lower the price levels. High competitiveness results in better allocation of resources, which leads to reduction in prices, temporarily reducing the inflation rate. Competitiveness also informs a firms’ pricing behavior and consequently, the inflation rate. A firm’s decision to revise the price of a product due to a demand shock is more likely to be prompt in a competitive market compared to a non-competitive market. Therefore, the inflation rate is reduced as a result of competitiveness [59].
In conclusion, competitiveness is a major determinant of the direction the economy will take. Increased competitiveness brings about an improvement and efficiency in resource allocation. This in turn results in economic growth. Profitability of any firm is also increased due to competitiveness. The company increases the level of research and development, and thus information on how to better the products is revealed, leading to increased profitability. Competitiveness, on the other hand, reduces the unemployment and the inflation rate in any given economy.

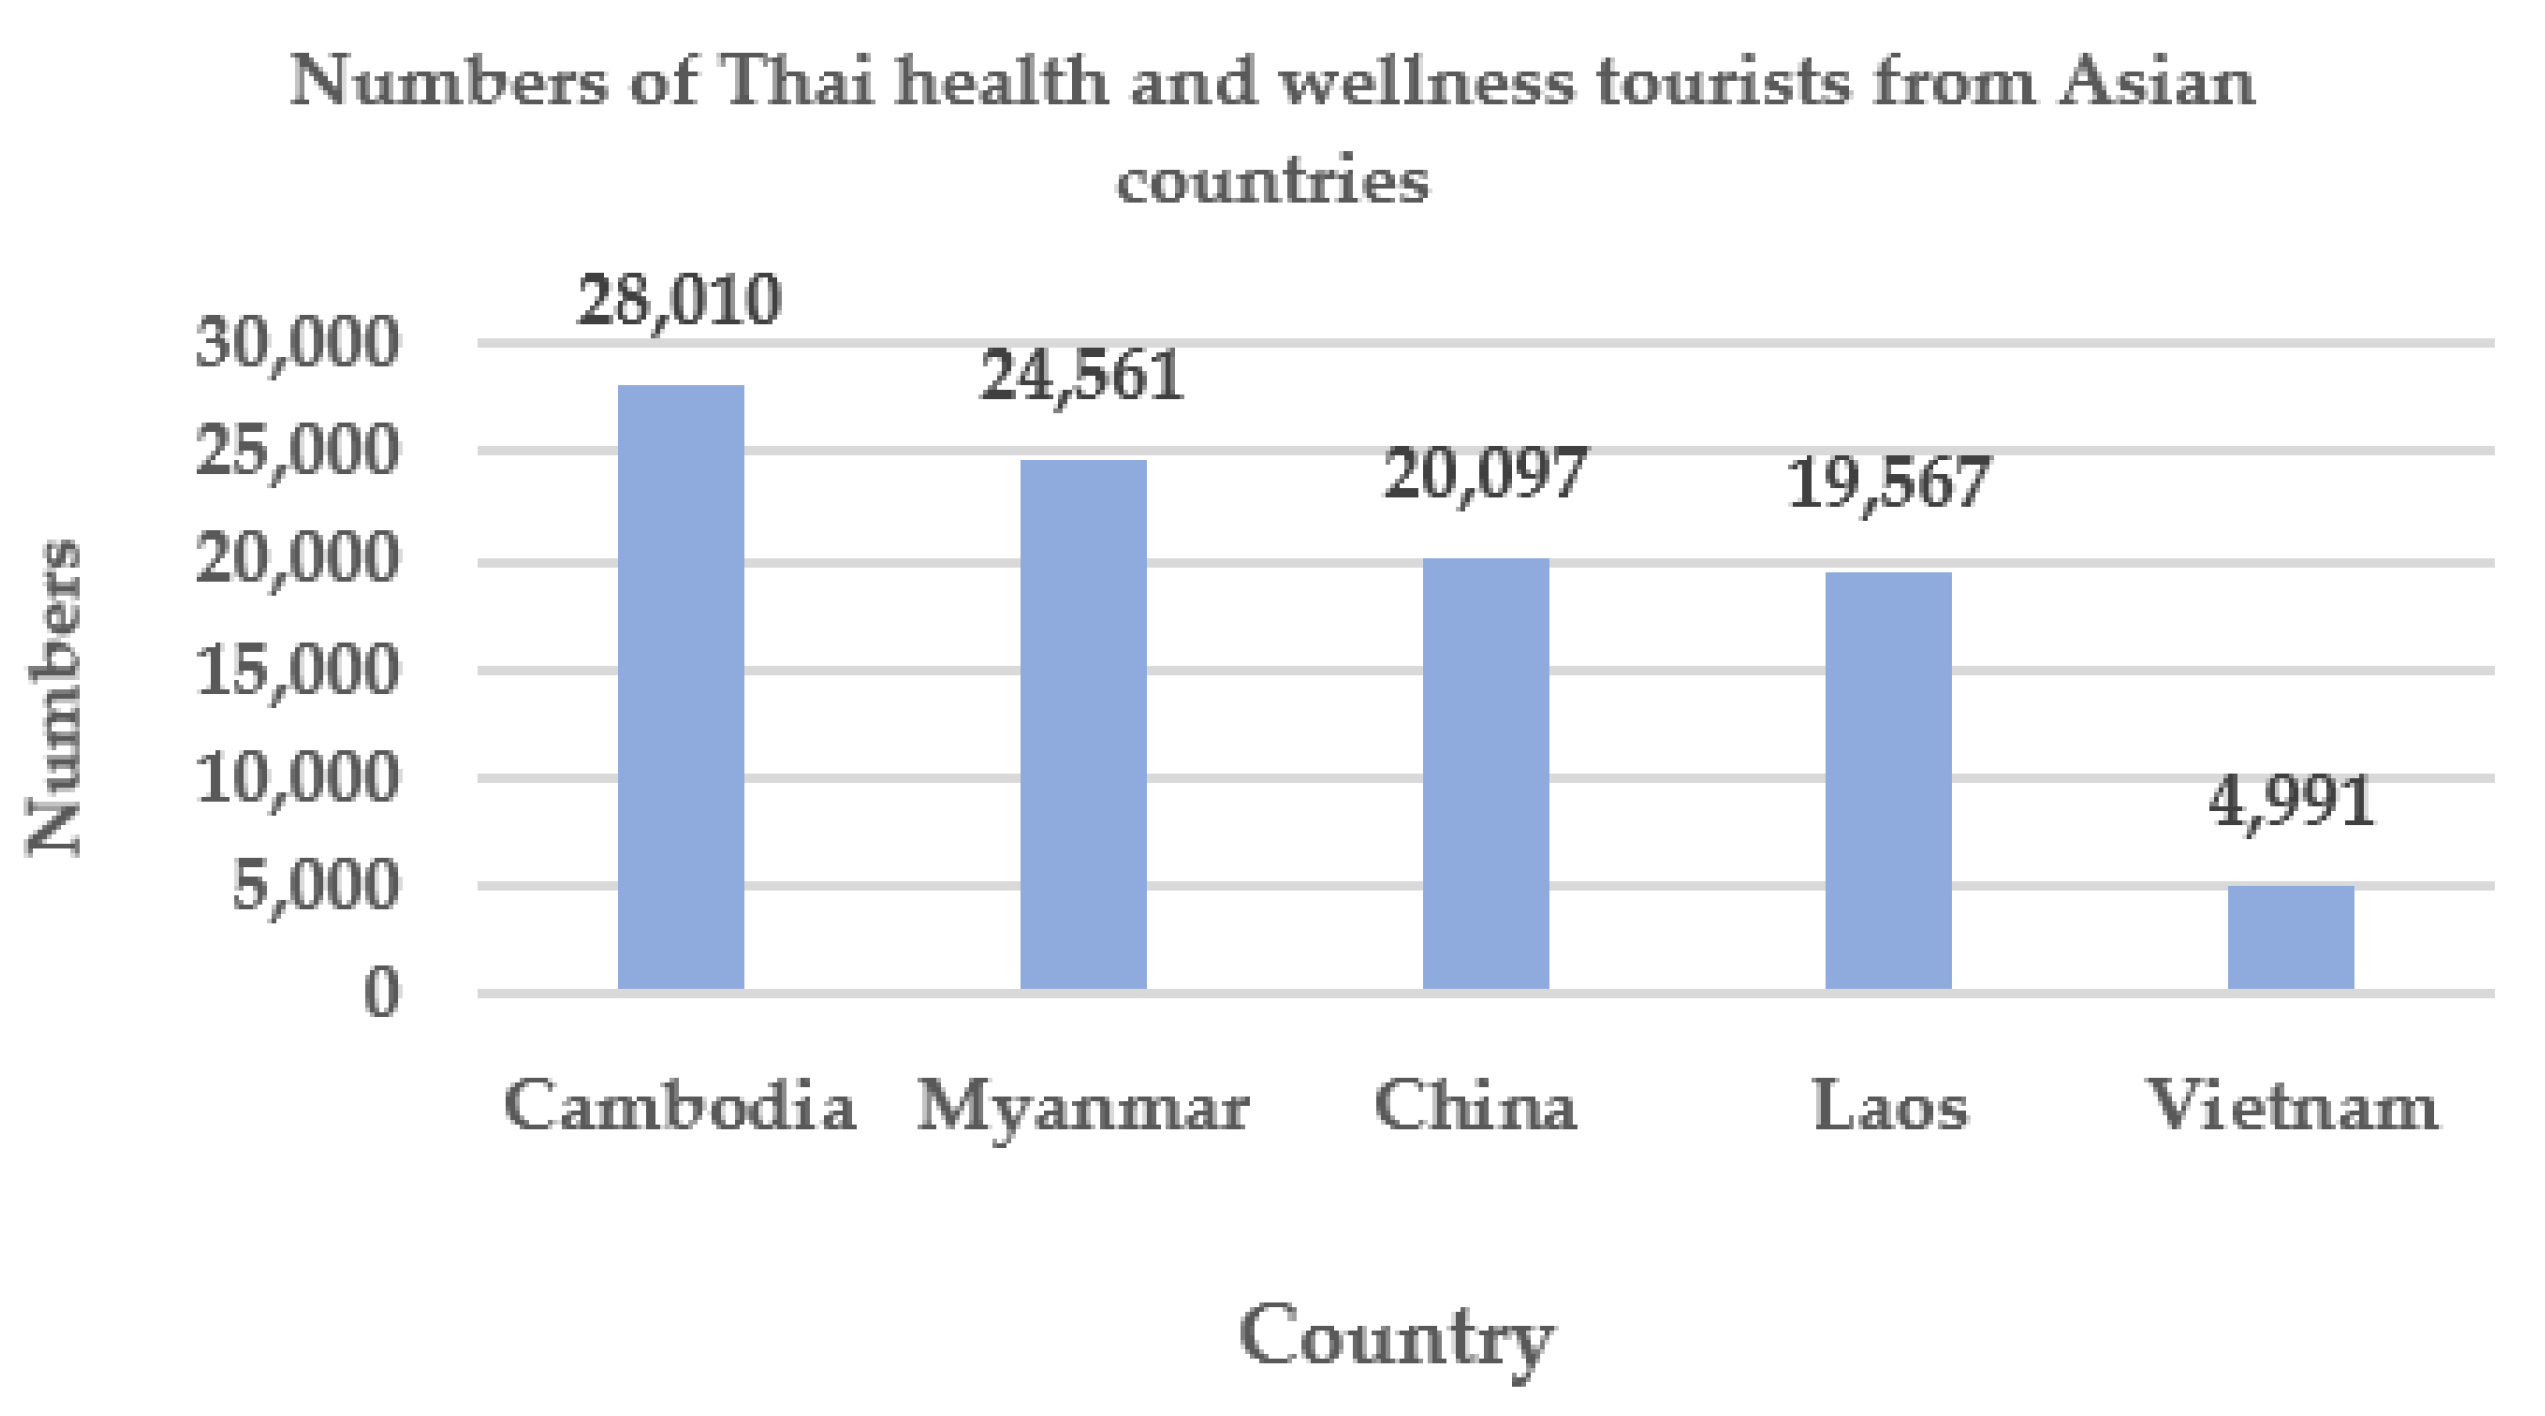
2.2. Dynamic Development of the Wellness Destination Market in Thailand

Health and wellness tourism, as a form of group tourism, is popular, with many regular visitors traveling to Thailand. This kind of tourism allows travelers to visit beautiful places along and engage in other activities, including medical treatment. Some travelers with no diseases visit Thailand for therapeutic activities to enhance their wellbeing. The health and wellness tourism market has recorded recent rapid growth in the Asia-Pacific region, especially in Thailand. This expansion of global wellness tourism is due to three factors: (1) the global middle-class population has increased, with higher incomes and an increased focus on tourism, (2) people now pay more attention to wellness, with increased knowledge about non-communicable diseases (NCDs), while muscle soreness is caused by stress due to the burden of responsibility, and (3) tourists now recognize a new experience that does not involve buying souvenirs to take back home [60].
From 2018 to 2022, tourist expansion in the Asia-Pacific region recorded a compound annual growth rate (CAGR) of 3.3% per annum, with strong economic and social development. Nowadays, the large variety of airlines and direct international flight schedules make travel faster and easier. Critical infrastructure development has also resulted in lower travel costs and the convenience of booking through online platforms.
In Thailand, health and wellness tourism had a CAGR of 11.45% per annum between 2014 and 2018. A total of 38,277,300 foreign tourists visited Thailand in 2018, with an increase of 8.19% in 2019. The latest report by GlobalData confirms Thailand as a key destination for health and wellness tourism, with numbers of health and wellness tourists forecasted to increase to 27.7 million by 2022, representing an increase in CAGR of 5.6% from 2019 [61]. The Ministry of Tourism and Sports identified health and wellness tourism as one of the top five revenue-generating industries. In 2020–2021, health and wellness tourism in Thailand was ranked 17th by Global MTI. Factors used in this ranking included destination environment, medical tourism industry, and quality of facilities and services. Moreover, Thailand was also ranked 15th in quality of facilities and services in terms of health and wellness tourism [62]. The International Healthcare Research Center (IHRC) predicted a growth of health and wellness tourism in Thailand at 14% per annum [63]. This information corresponds to the number of international tourists visiting Thailand, with an average increase of 12% per annum. Thai health and wellness tourists hail from Cambodia, Laos, Myanmar, and Vietnam (CLMV) and also from China and Japan. In 2018, two and half million international tourists visited Thailand for health and wellness tourism, accounting for 6 to 8% of the total number of tourists [64]. The growth of health and wellness tourism in Thailand may be partly due to Thailand’s focus on elderly tourists aged 60 years and over. Tourist numbers in this age group are increasing as a result of improved medical facilities. Many elderly people now spend their lives after retirement engaging in recreational activities or traveling to relax because they have more time than other generations. These people are financially stable, representing a new target market with higher purchasing power. Over the next 10 years, seven million elderly foreign tourists are forecasted to visit Thailand annually, with 31% coming from Japan. This increase in the elderly tourist population is an opportunity for Thailand to become the main target group of health and wellness tourists to further increase income from tourism [65].
Data presented by the National Statistical Office of Thailand in 2019 show that most Thai health and wellness tourists were from Asian countries, such as Cambodia, Myanmar, China, Laos, and Vietnam, as shown in Figure 1.
The European health and wellness tourists were mainly from Russia, followed by the United Kingdom, Germany, France, and Sweden, as shown in Figure 2.
Numbers of Thai health and wellness tourists are increasing, with Asians as the main group. However, despite Thailand’s high income from health and wellness tourism in the form of treatment, another group travels for health and wellness tourism in Thailand for health promotion, (disease prevention). Based on the foregoing information, the trend of health and wellness tourism in Thailand is increasing, especially when the main tourist groups are Asians. In Thailand, medicinal herbs are also used to treat various tourist ailments through foot massages, hermit exercise (Rusie Dutton) or spa treatment. UNESCO has recognized Thai massage as part of its Representative List of the Intangible Cultural Heritage of Humanity. Chantaburee [67] studied the opportunities and competitiveness in the Thai spa business, and concluded that there were great prospects for both Thai and foreign tourists, while Heesup et al. [68] found that spa tourism was becoming very popular among tourists from countries in Asia, such as Thailand, India, Singapore, and Malaysia. In the same vein, Kieanwatana et al. [69] reported that expectations of foreign health and wellness tourists in Thailand were high, with most wishing to relax their bodies and minds. The most popular health and wellness tourism activities were Thai massage, followed by foot reflexology and aromatherapy massage, as shown in Table 1.
Health and wellness tourism in Thailand is regarded by foreign tourists as a form of medical tourism, with the purposes of managing disease and beauty enhancement. Thailand is recognized as the number one tourist destination in the world. Most medical tourists who travel to Thailand prefer to use health check-up services, including cosmetic surgery and dentistry. They also seek treatment for specific cardiovascular and bone diseases. The Global Wellness Institute [5] highlighted personal care and beauty as the service most needed by medical tourists. Plastic surgeons from Thailand are world-renowned, with similar levels of service as hospitals in the United States. Thailand can offer cutting-edge medical technology at prices far cheaper than in other countries. For example, rhinoplasty is two-fold cheaper than in the United States, while gender reassignment surgery is ten-fold cheaper than in the United States and other European countries. Furthermore, Thailand is recognized and trusted by medical tourists because Thai doctors specialize in surgery at more than 1000 private hospitals, while over 61 hospitals are Joint Commission International (JCI)-certified by the United States, higher than any other country in the region. The International Society of Aesthetic Plastic Surgery (ISAPS) [70] and ratings of The International Healthcare Research Center in 2020 [62] reveal that Thai medical tourism was ranked 17th in the world, accounting for 38% of cases in the Asian region. In addition, Oxford Economics data reveal that Chinese tourists flock to Thailand for medical services because China has a new policy that allows each family to have two children, resulting in fertility treatment services becoming more popular among Chinese people. The cost of accessing these services is THB 200,000 to 400,000 per visit. Chinese tourists also use antiaging and wellness services, generating around THB 23 billion in income for Thailand in 2017. An analysis of foreign tourists using antiaging services in 2018 revealed that 66,492 generated an income of THB 23,128,859,400. These tourists came from China, England, the United Arab Emirates, Singapore, India, and Germany. On average, they stayed 5 days in Thailand, spending THB 234,923 to 700,000 for medical services. For infertility treatment, most foreign tourists were from China, Vietnam, Myanmar, and India, spending an average of THB 200,000 to 400,000, while for drug or alcohol rehab, the most frequent foreign tourists were from Australia, the United Kingdom, the United States, and Hong Kong, spending an average of 28 days and receiving services at THB 230,000 to 440,000 per person. Tourists who came to relax and use massage services at health and wellness resorts were mainly from England, followed by Australia, Germany, the United States, and Russia. The average time spent on services was 3 to 10 days, at a cost of THB 160,000 to 370,000 per person [63].
Thailand gains a high income from health and wellness tourism that will increase in the future; however, weaknesses include security management, environmental sustainability, and comprehensive land transport connections. The Travel & Tourism Competitiveness Index 2019 rated Thailand as the second-lowest in ASEAN after the Philippines [71]. Since 2020, many countries have suffered from volatility in the global economy. On Friday 3 April 2020, the World Bank released data showing the rapid spread of coronavirus (COVID-19). This pandemic has caused a major global recession and is likely to have a strong financial impact on many countries. The sudden drop in global spending, cash flow for activities, and restrictions on travel have adversely affected tourism. Many restaurants and hotels have closed, with a sudden slowdown in cash flow in the tourism industry [72]. COVID-19 is a key variable that is holding back growth in the health and wellness tourism sector.

2.3. A Review of the Development and Validation of a Scale Studies

The validity and reliability of research data play a critical role in ensuring that the research goal has been accurately achieved. The various issues that tend to occur concerning reliability and the validity of measure within a research process majorly contribute to enormous challenges for the researchers during the interpretation process, which often leads to the research being regarded as invalid. However, scale development, which is described as establishing reliable and valid research measures to evaluate the attribute of interest successfully, was developed to ensure reliability and validity of research data are achieved to promote a successful interpretation process. Moreover, several research articles addressing this topic were reviewed to understand how scale development adequately promotes reliability and validity.
In most situations, researchers tend to face a significant challenge when they realize that the attained results from research are not conclusive and, as a result, lead to inadequate understanding of a particular research topic. Hinkin [73] argues that having an adequate measurement in research is crucial because it contributes to achieving the research objectives. In addition, experiencing issues with the measures tends to be quite challenging for the researcher to develop an effective conclusion despite implementing advanced research techniques. Worthington and Whittaker [74] also argue that conceptual interpretability is a definitive factor retention criterion, which means that the researchers need to retain a factor in situations where it may be interpreted more successfully. Both arguments agree that implementing scale development in a research process contributes to an actual coefficient among the variables being focused on, which depend on their ability to operationalize a reliable and accurate latent construct.
On the other hand, Li et al. [75] assert that implementing scale development in a research process promotes validity and reliability of research data, contributing to an efficient and practical approach to exploring a theoretical structure within a latent construct. Moreover, the exploratory factor analysis plays a crucial role in the scale development process. It focuses on exploring observed variables’ primary framework, hence laying a rigid platform for a straightforward interpretable factor solution within a latent construct. Furthermore, in support of this notion, Gerbing and Anderson [76] argue that with the exploratory factor analysis reducing numerous indicators to a more manageable data set, it defines the relationship between the variable and the respondent, hence allowing a compelling exploration of the primary theoretical structure of the situation.
In an attempt to effectively attain a critical understanding of the passenger experiences, Ittamalla and Srinivas Kumar [77] identified that through scale development, the ability to achieve personal experiences from respondents was more effective compared to other approaches. Thus, with its ability to capture various personal and professional perspectives, the scale development may contribute significantly to the evaluation and enhancement of different areas of the public sector, such as the transport system and healthcare system, among others. Moreover, concerning this argument, Simms et al. [78] assert that the effectiveness framework linked to the scale development approach mainly concentrates on gathering responses from the original item population and the statistical processes established to sharpen those items into comparable and distinguishable scales. In addition, McKinley and Hyde [79] also support the idea that achieving various perspectives through scale development tends to result in the development of a critical understanding of the latent construct.
In conclusion, the scale development procedures have been implemented in diverse fields due to their ability to offer reliable and valid research data, allowing the researchers to interpret their research findings more accurately.

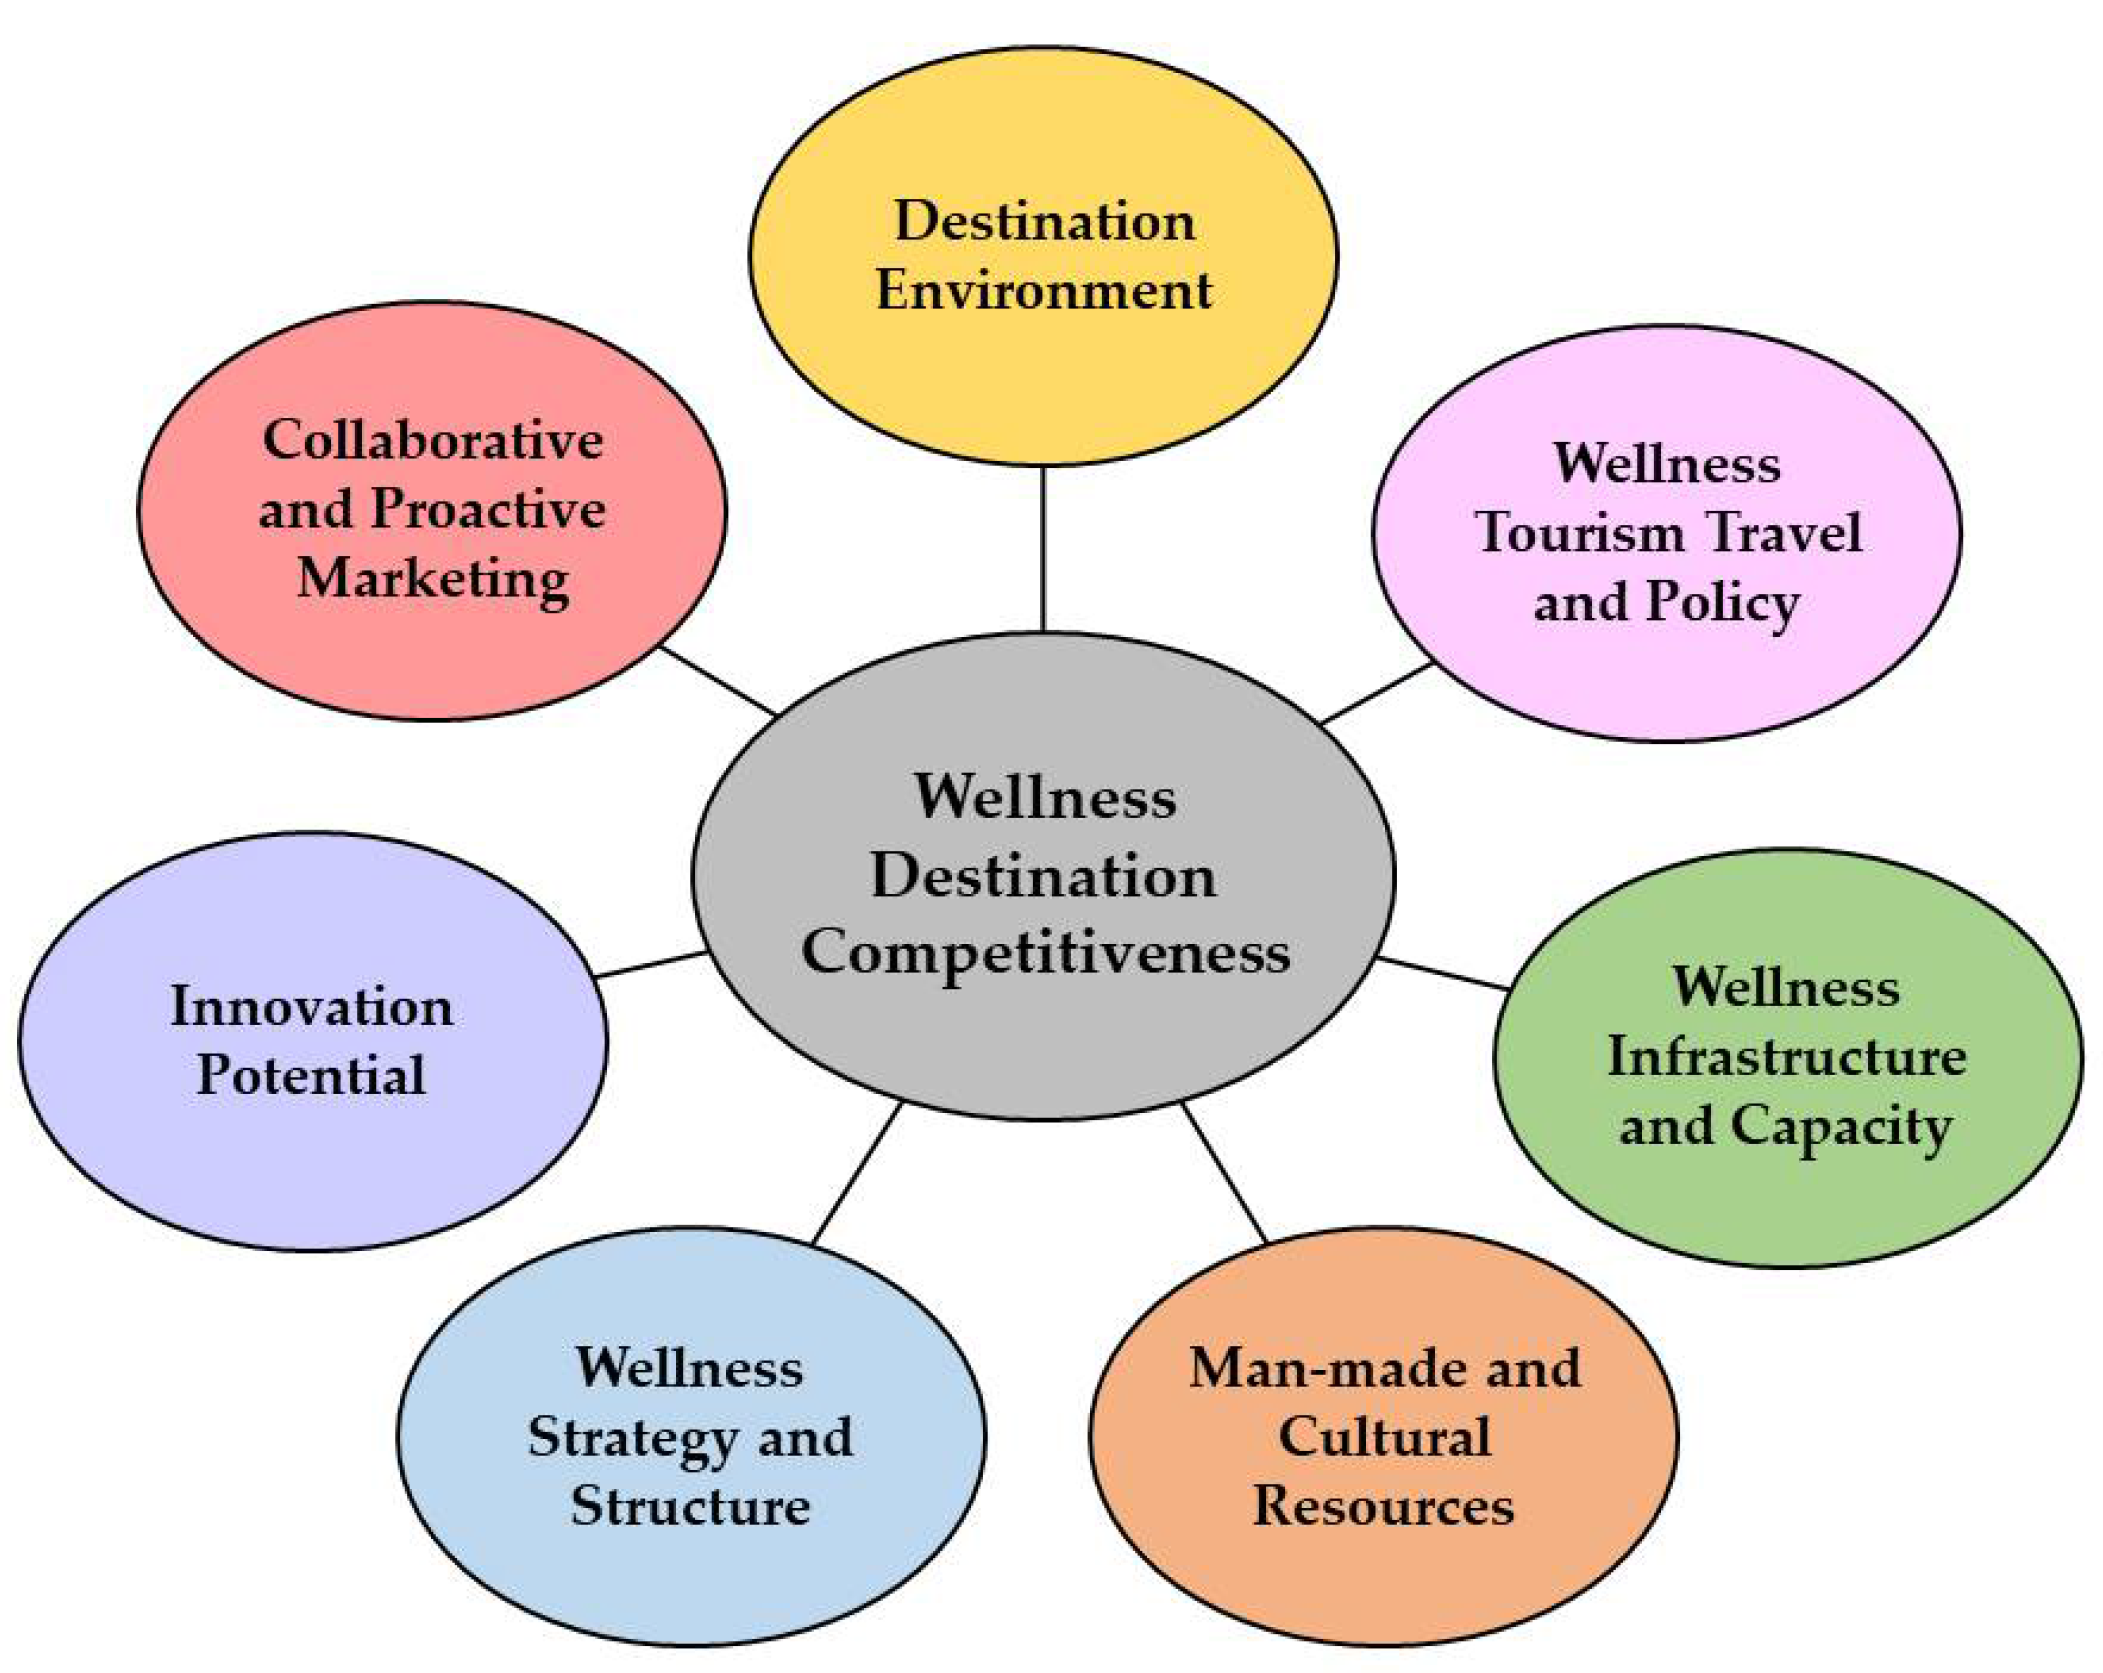
2.4. Measurements of Wellness Destination Competitiveness

A literature review was conducted using research and academic articles relating to wellness destination competitiveness that were published within the past five years in English. The selection criteria were: complete versions of the documents, including all content relating to wellness destination competitiveness, the quality and validity of the methods employed in the study, low risk of bias, complete results, appropriate methodology, and adherence to the ethical principles of research, including the protection of participants’ personal information. After reviewing the pertinent literature, we determined that indicators and parameters for the competitiveness of wellness destinations could be developed as a preliminary framework for our research. The details are shown in Figure 3.

2.4.1. Destination Environment

“Destination environment” refers to the key environmental and cultural factors of a destination that impact its suitability for development, improvement, or adaptation, including its established appeal and tourist attractions. In empirical tourism studies, researchers found that the following factors impacted the potential of a destination environment: political stability; the number of university hospitals [14,53,80,81,82]; the perceived safety of the destination and the number of police stations [20,33,53,81,82,83,84]; the sanitation, hygiene, and cleanliness of the attractions [16,20,53,82,85,86]; human resources and the local labor market; the friendliness of local people; the responsiveness of the tourism/hospitality employees to visitor needs; the responsiveness of destination services and the ease of communication between residents and tourists [53,80,83,86,87,88,89]; and the readiness of information technology and communication infrastructures of the destination, including telecommunication systems and online tourist information [53,81,87,88].

2.4.2. Wellness Tourism Travel and Policy

Wellness tourism “travel and policy” refers to regulations, rules, and policies concerning transportation and tourism in an area or surrounding tourist attractions that support wellness tourism and the methods to attract wellness tourists. Empirical research has shown that wellness tourism travel and policy are affected by the following: management guidelines focusing on sustainable tourism policies and destination management as well as government and health authorities as strange attractors [16,90]; openness to international tourists with a focus on convenience in financial institutions and currency exchange facilities, attitudes of custom/immigration officials, the visa policy, and the ease and cost of obtaining an entry visa, if required [20,53,80,82,83,86,87,91]; price competitiveness of tourism services, hospitality services, accommodation services, restaurants, airport amenities, and destination tour packages, as well as the total cost relative to that of a competitor destination [53,82,83,84,85,86]; and the importance given to environmental sustainability, such as environmental commitment, sustainability, the residents’ quality of life, and waste disposal [14,29,33,53,81,82,87,89].

2.4.3. Wellness Tourism Infrastructure and Capacity

Wellness tourism “infrastructure and capacity” refers to the readiness of the existing infrastructure of a potential wellness destination that is being considered for development, improvement, or adaptation. In studies of wellness tourism competitiveness, key factors reported included the following: transportation systems that allowed convenient access to an area or tourist attraction by air, land, or water, the destination transport facilities, and the quality of local transport [14,20,53,82,83,84,85,86,87,88,89,92,93]; comprehensive tourism service infrastructures, such as tourism support services, easy access to tourist information both on-site and online, and tourist guidance information and signage [20,53,82,83,84,85,86]; accessibility and accommodation for special needs and disabilities at destination facilities according to current standards [33,81,84,85,88,90]; accommodation for dietary restrictions and preferences, including a variety of food and beverages available at local hospitality facilities and the availability of quality food and meals [20,80,84,86,88,90]; accessibility and accommodation for special needs and disabilities at recreational sites and activities, including a variety of entertainment, festivals, theaters, galleries, cinemas, sports facilities, special events, sports, and other recreational opportunities [53,82,83,84,85,86,90].

2.4.4. Wellness Tourism Man-Made and Cultural Resources

“Man-made and cultural resources” refers to the readiness of semi-natural and man-made resources as well as the cultural traditions and knowledge of an area and tourist attractions that are suitable for developing new tourist attractions, routes, and activities that will attract wellness tourists. These include the appeal of the local area and how that can be used to promote the destination for wellness tourists. Previous research found that factors that promoted and supported wellness tourism included natural attractions, natural wonders, scenery and landscape, and man-made attractions [20,82,83,84,85,88,94,95]; cultural and local knowledge that pertained to unique archaeological and cultural attractions, historical attractions, cultural festivals, handicrafts/souvenirs, iconic attractions, traditional arts, and cultural richness [14,20,29,80,81,82,83,84,86,88,90,95,96]; resources that were suitable for planning and organizing wellness activities, such as adventure activities and creative tourism resources [81,82,83,85,88]; the availability of modern medical facilities, technology, and resources [20,80,82,87,89]; and the readiness of wellness and other related business resources, such as the availability of spas and hot springs, the variety of existing tourist attractions for recovering patients, and tourism amenities, such as cafeterias, public phones, hotels, restaurants, banks, and emergency services [19,80].

2.4.5. Wellness Tourism Strategy and Structure

Wellness tourism “strategy and structure” refers to the strategic planning needed to develop and improve wellness tourism in an area with tourist attractions and the presentation of activities for restorative health treatments. Previous research found factors that impact the strategy and structure included the quality of professional services and treatments that met the performance standards of tourism/hospitality companies as well as the development of training programs to enhance the quality of the available services [20,53,82,85,88,89,94]; awards for reputation and wellness tourism, such as internationally recognized medical services and highly regarded healthcare institutions [19,20]; quality certificates and international standard accreditation of medical and health services, including those of international hospital accreditation and credentials [20,21,80]; reported customer satisfaction regarding the availability of communication through a patient’s native language and the quality of the experience as well as protocols for visitor satisfaction management, and tourism companies with programs to ensure/monitor visitors’ satisfaction [20,81,86,87,89,90]; the connectedness and ease of access to products, services, activities, and other components of wellness tourism provided for tourists [92]; health-related spa and wellness activities that offer nutrition therapy [94]; exercise for health [80]; meditation [80]; hydrotherapy such as water-based and sweat-bathing treatments [94]; mind rejuvenation activities, including the availability of cooking classes [80]; and body and aesthetic care activities [94].

2.4.6. Wellness Tourism Innovation Potential

Wellness tourism “innovation potential” refers to a region or tourist attraction’s potential to create and offer unique, innovative products and services to attract wellness tourists. Previous research found that factors indicating innovation potential included knowledge exploitation for upscale, rapid medical services [20,97]; human capital to develop new products and services, such as knowledgeable staff who are experts in wellness tourism, have creative abilities, and passion in developing new products and services [21,91]; openness to service innovation, such as exploiting market opportunities, utilizing technology, and digitizing the tourist experience [16,19,21,93]; adaptive, rapid solutions to improve current systems, such as knowledge transformation and organizational changes to optimize the management of sustainability, programs to monitor and ensure visitor satisfaction hosted the tourism firm, and awareness of tourism employees regarding the quality of services as well as their technical competency [21,57,89,97]; the application of outstanding community resources, knowledge, and local identity as selling points and adding value to products and tourism services to maximize local economic development [90]; continuous improvement and development of new working processes regarding management capabilities of health tourism firms and organizations, the establishment of training programs to improve service quality, well-defined performance criteria in tourism/hospitality enterprises, and quality assessment and enforcement [19,80,87].

2.4.7. Wellness Tourism Collaborative and Proactive Marketing

Wellness tourism “collaborative and proactive marketing” refers to the capability of an area or tourist attraction to collaborate with other destinations and attractions and proactively market to their targeted customer groups. In previous studies, researchers found that that factors indicating collaborative and proactive marketing included the formation of collaborative clusters as well as the number of partnerships and collaborative projects [91,98,99]; the application of business networks and alliances to communicate with all stakeholders, including the establishment of strategic alliances in destination competitiveness [16,98]; opportunities and support of local communities in taking part in planning wellness tourism [98,100]; collaboration with wellness and health tourism agencies [21]; collaboration between public and private agencies by determining firm tourism strategies through joint public–private policymaking, commitment of the public sector to tourism and hospitality education, and commitment of the private sector to tourism and hospitality education [80,98,101]; collaboration with public and private agencies to advertise wellness tourism products and services including wellness tourism marketing, promoting networking, and strategic planning, and public–private partnerships (PPPs) in healthcare financing [21,92,98,99,102]; a focus on offering targeted brand stories that support community and environmental development [87,103]; targeted brand building to attract tourists with on-trend slogans, logos, and health promotion services of tourism destinations [16,20,21,99,104,105]; the organization of wellness tourism programs and activities in which local communities could participate that also create local employment opportunities [99]; building a more impactful brand identity than the competitors’, [90,104,105]; linking advertising and marketing through health-related social media and sporting connections as well as business ties and trade links in key tourist origin markets [87,89]; environmental simulations presented at popular venues so that target groups, customers, and potential customers could experience and visualize wellness destinations [106,107,108]; local, national, and international promotional events and campaigns [19]; and surveys that score collaborative values, such as tourists’ content creation, online reviews, and online satisfaction [109,110].

3. Methodology

This study used a combination of qualitative and quantitative research methods and adopted a standard scale development process, as suggested by Churchill [111]. Churchill’s framework [111] collects and organizes disparate data to provide enhanced measurement and reliably assess the quality of results. Our literature review suggested that the components of wellness destination competitiveness consisted of seven dimensions: destination environment; travel and policy; infrastructure and capacity; man-made and cultural resources; wellness strategy and structure; innovation potential; and collaborative and proactive marketing, along with 50 indicators. Afterwards, in-depth interviews with stakeholders in wellness tourism clusters were conducted to validate the components and indicators derived from our literature review. Theoretical sampling was employed to recruit the key informants of the study based on the premise that the key informants must be suitable and consistent with the research objective [112]. We used a purposive sampling method from September 2021 to October 2021. The data were collected and examined iteratively until no new dimensions emerged, indicating information saturation [113]. The interview results show that data saturation was reached at thirteen participants, comprising three wellness tourism administrators, five wellness tourism experts, three wellness tourism enterprises, and two wellness tourists, as shown in Appendix A.
Due to the source triangulation between the literature and the in-depth interviews, 41 out of 50 indicators were selected. The content validity of the questionnaire was analyzed using item–objective congruence (IOC). Five experts were asked to review the items to improve the scale’s content validity, specificity, clarity, conciseness, and readability [114,115,116]. The experts comprised five university teachers and researchers specializing in wellness tourism. The results of the IOC do not reveal any questions with scores lower than 0.50 [117]. The IOC scores were 0.60–1.00. The questionnaire was also tested for reliability using Cronbach’s alpha coefficient. A statistical package was used to analyze 30 questionnaires submitted by groups of respondents whose characteristics were similar to those of the sample group. The accepted criteria were above 0.7, indicating that the questionnaire had acceptable reliability and all variables’ level of confidence were acceptable [118]. The results from the analysis show that all questions passed the criteria with scores of 0.718–0.926.
The instrument used for collecting data was a questionnaire that had been divided into three parts. Part 1 consisted of four questions concerning the general information of the companies. Part 2 consisted of five questions concerning general information about the respondent. The questionnaire was in the form of a checklist. Part 3 considered the importance of factors in wellness destination competitiveness assessment including (1) destination environment for six questions, (2) wellness tourism travel and policy for four questions, (3) infrastructure and capacity for five questions, (4) man-made and cultural resources for four questions, (5) wellness strategy and structure for eight questions, (6) innovation potential for five questions, and (7) collaborative and proactive marketing for nine questions. The questions were graded on a five-point Likert scale; the responses were labeled as follows: not important, moderately important, important, very important, and most important.
For data collected for the development of indicators, the research population was a wellness tourism enterprise cluster in Thailand. During the data collection process, the sample group was ten wellness tourism enterprise network clusters from different regions: Chiang Mai, Lampang, Phuket, Nakornsrithammarat, Ranong, Khonkaen, Nakornratchasima, Kanchanaburi, Pracheenburi, and Phranakorn Sriayuddhaya. The size of the sample group was calculated according to the sampling method in [119] using the ratio between the sample unit and the number of parameters. The sample size calculations for this structural equation model used the sample size calculations required for a structural equation model study based on the number of observable and latent variables in effect: magnitude, probability, and desired statistical power. From the calculation, the recommended minimum sample size was 180 using the multistage sampling strategy to select the representative samples. The samples were purposively collected from the aforementioned sample group. The quota sampling method was used to select samples from the 10 clusters. The number of samples from each cluster was determined to be 25 samples. Companies in each area could have only one respondent. A total of 250 samples were collected, which was more than the recommended minimum sample size.
A pilot study was conducted to empirically investigate the dimensionality of the measurements. Such measurement was accomplished by exploratory factor analysis. A paper and an online questionnaire were created by linking the data to Google Drive and creating a QR Code and link, for convenience in sending and completing the online questionnaire. A total of 250 questionnaires were sent to the sample group in Thailand. Paper questionnaires were sent back by mail within 15 days after being received. The respondents were required to enclose a letter of introduction along with an answer appreciation cooperation, useful application for others, and answer confidentiality guarantee documents. We also enclosed a self-addressed, stamped envelope for the respondents’ convenience. Since the wellness tourism companies were located in every region of Thailand and the COVID-19 pandemic was ongoing, sending the questionnaire by email was convenient. The questionnaires were administered from September 2021 to October 2021. Participation was voluntary. A total of 216 questionnaires were returned; 45 questionnaires had incomplete answers. Therefore, 171 were valid, which was more than the independent variable plus 50 [120]. This indicates that the sample group was representative of the population. The response rate was 68.40 percent [121].
Bartlett’s and Kaiser–Meyer–Olkin (KMO) tests were employed to analyze the correlation matrix and sample adequacy. The results of Bartlett’s test reveal significant inter-item correlation (greater than 0.6). Cronbach’s alpha and the item total correlation were used to assess the factor reliability. Cronbach’s alpha was 0.937. The Kaiser–Meyer–Olkin (KMO) result was 0.687–0.927. At 0.0001 levels, Bartlett’s sphericity test was significant. According to the screen plot and eigenvalue results, all items explained roughly 73.57% of the overall variance. After completing the preceding methods, the 41 items remained, which was used in the central survey to conduct confirmatory factor analysis, as shown in Table 2.
The primary survey was conducted in the same way as the pilot study. A total of 250 questionnaires were sent to wellness tourism entrepreneurs in Thailand during November 2021–December 2021, and 235 questionnaires were returned. There were 19 questionnaires with incomplete content, and 216 questionnaires with complete content. This was more than the independent variables plus 50 [120], which indicates that the sample group was representative of the population. Furthermore, the sample size was modest, as compared to the observable variables (41) included in the model. Nonetheless, recent research has concluded that a minimum sample size of 200 is required for credible multivariate statistical inferences [122,123,124]. A response rate of 78.33 percent suggested that it was appropriate [121].

Participants’ Rights Protection

The research ethics review committee at Chulalongkorn University, the Second Allied Academic Group in Social Sciences, Humanities, and Fine and Applied Arts, accepted the study for research involving human subjects with COA No. 226/2564 and COA No. 314/2564. The information sheet for research participants and the informed consent form were used. The participants were also informed that their private information would be secure and that they had the right to withdraw from the research project at any time.

4. Data Analysis and Results

4.1. General Data Analysis Regarding the Organization

Results from the general data analysis show that there were 216 organizations. When categorized according to their year of founding, we found that most were in business for 5–10 years, followed by those in business for 11–20 years, more than 5 years, and more than 20 years. These accounted for 50 percent, 25 percent, 16.70 percent, and 8.3 percent, respectively. Their average annual revenue in the past year were more than THB 1 million, followed by THB 100,001–500,000, THB 500,001–1000,000, THB 50,001–100,000, and THB 10,000–50,000. These accounted for 50 percent, 20.8 percent, 16.7 percent, 8.3 percent, and 4.2 percent, respectively. Overall, organizations with less than 50 staff members accounted for 82.4 percent; followed by those with 50–200 staff members, which accounted for 9.3 percent; and those with 201–500 staff members, which accounted for 8.3 percent, respectively. The types of services offered by organizations related to the wellness tourism industry included spas, Thai massage, fitness, meditation, and healthy cooking practices. These accounted for 70.8 percent, followed by accommodations such as health resorts and spas at 16.7 percent, and food and beverages such as healthy and organic food restaurants at 12.5 percent.

4.2. Analysis of General Information Regarding the Questionnaire Respondents

The analysis of general information regarding the respondents showed that out of the 216 questionnaire respondents in the sample groups, 66.7 percent were female, and 33.3 percent were male. Most of the respondents were 26–35 years old and 36–45 years old, which accounted for 29.2 percent, followed by those 46–55 years old at 25 percent, 56–65 years old at 12.5 percent, and above 65 years old at 4.2 percent. Overall, the respondents who graduated with a bachelor’s degree accounted for 66.7 percent, followed by master’s degree graduates at 25 percent, and lower than a bachelor’s degree at 8.3 percent. Most of them were entrepreneurs or business owners. These accounted for 66.7 percent. This was followed by mid-level executives such as department, sector, and section managers at 12.5 percent; other positions, such as spa managers, general managers, and learning and development officers comprised 16.7 percent. High-level executives, such as managing directors and deputy managing directors, accounted for 4.2 percent. Most of these executives had 6–10 years of experience working in the wellness tourism business, comprising 45.8 percent, followed by 11–15 years at 25 percent, 1–5 years at 20.8 percent, and 16–20 years and more at 4.2 percent.

4.3. Validation of the Measurement Scale

To examine the model’s reliability and validity, the 216 valid responses were analyzed using confirmatory factor analysis (CFA) with AMOS 22.0. The study’s goal was to determine if the competitiveness of wellness destinations could be identified using the aforementioned seven categories. Several goodness-of-fit statistics, such as chi-squared, the degrees-of-freedom ratio (χ2/df), comparative fit index (CFI > 0.90), internal fit index (IFI > 0.90), Tucker–Lewis index (TLI > 0.90), and root mean square error of approximation (RMSEA < 0.08) [87,91], were used to assess the model. The goodness-of-fit statistics were χ2 = 625.815, df = 607 χ2/df = 1.031, CFI = 0.997, IFI = 0.997, TLI = 0.996, and RMSEA = 0.014. The data were found to be suitable for the suggested model when the goodness-of-fit indices generated as a consequence of the confirmatory factor analysis were assessed. The squared multiple correlations (SMC-R2) were between 0.381 and 0.845, and the standardized factor loadings for the 41 items were between 0.618 and 0.919.
When the same object is measured repeatedly, the degree of consistency of the results is referred to as reliability [118]. The scale’s internal consistency was tested using composite reliability (CR) [125]. The seven latent variable CRs ranged from 0.793 to 0.955, exceeding the cut-off value of 0.6 [126]. The factor loadings of all the items were calculated to determine convergent validity (factor loadings > 0.5) [118] and the extracted average variance (AVE > 0.50) [125]. In Table 3, all items had significant loadings between 0.618 and 0.919, above the criterium of 0.5. The AVE of the seven dimensions ranged from 0.500 to 0.749, which was greater than the 0.45 threshold proposed by Netemeyer et al. for a new development scale [116]. The scale had strong convergent validity between the constructs in general.
The low correlation or substantial difference between the potential and other dimensions is discriminant validity [118]. Good discriminant validity is shown if the square root of the AVE value is greater than the correlation coefficient among the constructs [125]. The correlation coefficient between constructs should not surpass 0.85, according to Kline [124]. The disparities in the chi-squared values across the various dimensions reached a significant level, as shown in Table 4. The seven latent variable correlation coefficients ranged from 0.363 to 0.551, which was less than the square root of the AVE value of the seven dimensions. All the construct correlations were less than 0.85. As a result, all the indicators demonstrated strong discriminant validity. Furthermore, the seven factors’ normalized regression coefficients were significant at p < 0.001, indicating that the seven factors could accurately quantify wellness destination competitiveness while maintaining nomological validity.

4.4. Descriptive Statistics

The analysis results, shown in Table 5, indicate that factors for evaluating wellness destination competitiveness regarding collaborative and proactive marketing ( x ¯ = 4.57, S.D. = 0.508), innovation potential ( x ¯ = 4.51, S.D. = 0.545), and wellness tourism travel and policy ( x ¯ = 4.29, S.D. = 0.572) were the top three important factors. However, strategy and structure ( x ¯ = 4.19, S.D. = 0.552), infrastructure and capacity ( x ¯ = 4.16, S.D. = 0.550) man-made and cultural resources ( x ¯ = 4.03, S.D. = 0.602), and destination environment ( x ¯ = 3.76, S.D. = 0.558) were the most important factors. Destination environment was the factor that was the least important. The standard deviation for every factor was lower than 1.25. This suggests that the seven wellness destination competitiveness evaluation factors were either slightly different, similar, or slightly similar.
The three most important indicators were marketing of wellness products and services with allies from public and private agencies at local, national, and international levels (COL4, x ¯ = 4.71), the environment simulation at a real venue for target groups, customers, and interested people so they may experience, understand, and have a clearer visualization of the wellness tourism destination (COL8, x ¯ = 4.64), and the collaboration between public and private agencies (COL3, x ¯ = 4.61). However, the business environment supporting wellness tourism business (DE1, x ¯ = 3.77), human resources in the area whose duty was to welcome wellness tourists (DE5, x ¯ = 3.64), and human resources in terms of staff in wellness tourism enterprises and businesses who were responsible for delivering products and services to the tourists (DE4, x ¯ = 3.42) were the three least important indicators.

5. Discussion and Implications

5.1. Discussion on the Final Model of the Wellness Destination Competitiveness Assessment Dimensions

Despite many studies on wellness destination competition, empirical research on the factors affecting wellness destination competitiveness has been scarce. Therefore, to establish an assessment scale, this study used qualitative and quantitative methods based on Churchill’s methodology. Seven wellness destination competitiveness assessment dimensions, including destination environment, travel and policy, infrastructure and capacity, man-made and cultural resources, strategy and structure, innovation potential, and collaborative and proactive marketing, were identified based on triangulated results from the literature review, in-depth interviews, and expert panel discussions. This study developed a quantitative survey to further investigate the reliability and validity of the scale, and a total of 216 valid questionnaires were collected. After analyzing the data, the assessment components of wellness destination competitiveness were divided into seven categories and 41 indicators.
The first component was the destination environment. The safety and security of the destination was the indicator that had the highest factor-loading score. Tourism enterprises placed importance on effective administration and management of safety and security for tourists. This indicator directly affected tourists’ perception of the security of the destination. The findings are in line with Neto et al. [53]; Queiroz Neto et al. [82]; Woyo and Slabbert [86]; and Mustafa et al. [88], who suggested that political stability as well as safety and security were important conditions impacting tourist interest in a tourist destination.
The second component was travel and tourism policies. Openness to international tourists to specifically promote wellness tourism had the highest factor-loading score. Importance should also be placed on planning and transportation as well as traveling policies that support international services. These are in line with previous research that highlighted the level of internationalization [91], the efficiency of customs and immigration as well as attitudes of customs and immigration officials [83], visa policies, and the ease and cost of obtaining an entry visa [20,53,82,87] as key factors that influenced tourist interest in a tourist destination.
The third component was wellness infrastructure and capacity. Infrastructure supporting services and tourism was the indicator with the highest factor-loading score. This reflected that from the perspective of tourism enterprises, wellness tourism destinations should have guidelines and prepared suggestions available for tourists that are easily accessible at tourist information centers and online. This is in line with previous research findings that tourism support services [86,87,89], tourist guidance information and tourist services [83,84], and easy access to tourist information both online and on-site [20,82] were key factors that influenced tourist interest in a tourist destination.
The fourth component was man-made and cultural resources. The availability of semi-natural tourist attractions was the indicator with the highest factor-loading score. From the perspective of tourism enterprises, the unique and abundant natural resources of a wellness tourism destination were crucial to attract wellness tourists and could be used to promote health-related products and services. In addition, the man-made tourist attractions should blend in with the natural environment of the area. The results are in line with studies conducted by Junio et al. [20]; Neto et al. [53]; Queiroz Neto et al. [82]; Akin et al. [83]; Armis and Kanegae [84]; Milićević et al. [85]; Mustafa et al. [88]; Lee and Li [94]; and Wardana et al. [95], all of whom indicated that the natural environment, the natural wonders, and the scenery were all key factors that influenced tourist interest in a tourist destination.
The fifth component was wellness strategy and structure. The highest factor-loading scores were found in the link between diverse products, services, activities, and the components of wellness tourism and the visitors who visited the destination. From the perspective of tourism enterprises, business plans that effectively deliver wellness products and services to visiting tourists could increase competitiveness. Good business management requires integrated management and collaboration as well as the continuation among activities and stakeholders in the supply chain, including managing the balance between the supply and demand of wellness tourism. This was in line with research by Dias et al. [92], who found that facilitating access to suppliers was a key factor that influenced tourist interest in a tourist destination.
The sixth component was innovation potential. Human capital to develop new products or services had the highest factor-loading score. This reflected the perspective of tourism enterprises that the development of innovative products and services by those living and working at the wellness tourist destination were important factors to improve the wellness tourist’s overall experience. The findings were in line with research by Ganguli and Ebrahim [21] and Dias et al. [91], who found that the importance of creative and innovative development of new products and services for health and wellness was a key factor that influenced tourist interest in a tourist destination and their desire to return.
The seventh component was collaborative and proactive marketing. The formation of clusters, whose purpose was collaborative working and communication with all stakeholders, was the indicator with the highest factor-loading score. From the perspective of tourism enterprises, relationships among different agencies at different levels of wellness travel and tourism would result in the further development of the destination’s competitive potential. These findings are in line with research by Altinay and Kozak [16] and Dias et al. [91], who found that cluster creation, collaborative projects, and strategic alliances were key factors that improved the impact of marketing and brand awareness and influenced tourist interest in a tourist destination.

5.2. Discussion on the Important of the Wellness Destination Competitiveness Dimensions and Each Factor of the Wellness Destination Competitiveness Measurement Scale

The seven categories had varied factor loadings. Collaboration and proactive marketing, innovation potential, and travel and policy were the most important dimensions according to our respondents. Due to its association to collaborative strategic management, the collaborative and proactive marketing factor was determined to be critical. Supporting factors were destination environment, travel and policy, infrastructure and capacity, and man-made and cultural resources; these were used for proactive marketing to define clear positions and target groups of customers. Innovation potential was important, as it provided a guideline for developing and improving abilities to create or offer new health promotion products and services to increase the competitive potential with supporting factors, such as destination environment, travel and policy, infrastructure and capacity, and man-made and cultural resources. These work together to promote the wellness destination and increase its appeal to wellness tourist.
The least important component was the destination environment, along with the following items: a business environment that promotes wellness tourism business, human resources of staff in the area who welcome wellness tourists, and human resources in wellness tourism enterprises or businesses whose duty is to deliver products and services to tourists. In addition, the second least important factor was man-made and cultural resources, including the readiness of cultural and knowledge tourist attractions and the readiness of semi-natural tourist attractions. This indicates that tourism firms did not feel these were as important as improving a destination’s competitiveness and increasing the destination’s capacity to do so. Formation of cluster groups for wellness tourism management, aggressive marketing with business partners, stimulation of business enterprises and stakeholders to increasingly create and develop new products and services to respond to the needs of wellness tourists, policy setting with regard to tourism and traveling to attract wellness tourists, and especially the openness to international tourists caused tourism enterprises to view the components of destination environment and man-made and cultural resources as less important than the components of collaborative and proactive marketing, innovation potential, and travel and policy.

5.3. Theoretical and Practical Implications

This study provides several contributions. The research results indicate that the components and indicators applied were appropriate for an assessment measuring the competitiveness of a wellness destination. This scale could, therefore, be used to develop and increase the potential and the readiness of a wellness destination so that it could compete at the international level. The multidimensional wellness destination-competitiveness assessment may be a useful tool for governments, destination management organizations, tourism administrations, wellness tourism enterprises, and other stakeholders in assessing wellness destination competitiveness.
Researchers in wellness tourism could use concepts and research findings related to components of our wellness destination competitiveness assessment for evaluation and development. It may act as a guide for wellness destinations and attractions to improve their marketing strategies and management as well as encourage further innovation and development.
Public agencies such as the Department of Health Service Support, the Ministry of Health, the Ministry of Tourism and Sports, and the Tourism Authority of Thailand, including associations and supporting agencies such as Thai Spa Association, Thai Tourism Association, Thai Spa and Wellness Federation, Province Tourism Association, and Thai Medicine Association, may use these research results to inform their legal policies and wellness tourism strategies. The research findings that collaborative and proactive marketing, innovation potential, and travel and policy were important factors in improving the competitive potential of a wellness destination could be used to plan and promote the formation of wellness tourism cluster groups, effectively conduct aggressive marketing for the target groups, to give support via funding, and to further enable businesses to create new wellness products and services through education and training. This study identified destination environments and man-made and cultural resources as the least important factors for wellness destination competitiveness. Instead, more focus should be placed on the physical and online availability and ease of access of information describing destination attractions for tourists. Apart from that, importance should also be placed on developing the cultural knowledge of areas and tourist attractions, routes, and activities that appeal to wellness tourists.
For wellness tourism enterprises, the research results for both complete tourism experiences, including accommodation, restaurants, and beverages, and wellness services, including private hospitals, spa resorts, day spas, health massages, fitness gyms, and sports, may be used to build upon existing activities related to wellness tourism and to enhance staff efficiency. In addition, a focus on developing innovative services and products, improving transportation, and taking advantage of rich cultural traditions that are of interest to wellness tourists may improve a wellness destination’s competitiveness and attract more wellness tourists.

6. Limitations and Future Research

There were some limitations in this study. First, Churchill [111] offered other approaches and strategies not used in this investigation. As a result, future studies may include additional ways to develop and improve a similar assessment scale. Second, this research examined the competitiveness of wellness destinations from the perspective of wellness tourism businesses. Future research might consider the viewpoints of various stakeholders, such as governments, tourists and travelers, destination management organizations, and tourism administrations, in order to improve this assessment tool and enrich wellness destination competitiveness research. Third, since all data were collected in Thailand, the results may have been influenced by the background of the wellness tourist businesses, and this study did not assess cross-cultural reliability and validity. Future research should test the assessment tool in different cultural and religious settings. Furthermore, the study was conducted in Thailand during the COVID-19 pandemic, which made access to participants difficult. As a result, the results may be skewed due to the small sample size. A more comprehensive survey with a larger representative sample size could improve its accuracy and reliability.

Author Contributions

Conceptualization, T.P.; methodology, T.P.; validation, T.P.; formal analysis, T.P.; investigation, T.P.; writing—original draft preparation, T.P.; writing—review and editing, A.C. and T.P.; visualization, T.P.; supervision, P.A., A.C. and K.P. All authors have read and agreed to the published version of the manuscript.

Funding

This research received no external funding.

Institutional Review Board Statement

The study was conducted according to the guidelines of the Declaration of Helsinki, the Belmont report, CIOMS guidelines, and the principle of the international conference on harmonization-good clinical practice (ICH-GCP), and approved by the Research Ethics Review Committee for Research Involving Human Subjects: The Second Allied Academic Group in Social Sciences, Humanities, and Fine and Applied Arts at Chulalongkorn University with COA No. 226/2564 and COA No. 314/2564.

Informed Consent Statement

Informed consent was obtained from all subjects involved in the study.

Data Availability Statement

The data are not publicly available, as respondents were guaranteed confidentiality and anonymity in this study.

Acknowledgments

This research was supported by the 90th Anniversary of Chulalongkorn University Fund (Ratchadaphiseksomphot Endowment Fund), as well as Technopreneurship and Innovation Management Program, Graduate School, Chulalongkorn University.

Conflicts of Interest

The authors declare no conflict of interest.

Appendix A

Table A1. Interviewee profiles.
Code NameTypeGenderExperience (Year)EducationOccupationDuration (Min)
TA1Tourism administrationFemale33Bachelor’sDirector48.05
TA2Female29Master’sDirector51.49
TA3Female13Bachelor’sDirector72.10
TE1Tourism expertFemale27Ph.D.Professor27.39
TE2Male9Ph.D.Professor96.45
TE3Female5Ph.D.Lecturer48.45
TE4Female16Ph.D.Lecturer76.27
TE5Male22Ph.D.Professor49.28
TP1Tourism enterpriseMale25M.D.Wellness tourism entrepreneur68.16
TP2Female22Bachelor’sWellness tourism entrepreneur and Spa Developer101.50
TP3Male40Master’sWellness tourism entrepreneur95.03
TR1TouristFemale5Master’sWellness traveler48.52
TR2Female6Master’sWellness traveler57.22

References

  1. Yeung, O.; Johnston, K. Global Wellness Tourism Economy. 2018. Available online: https://globalwellnessinstitute.org/industry-research/global-wellness-tourism-economy/ (accessed on 9 January 2021).
  2. Global Spa Summit & Stanford Research Institute International. Spas and the Global Wellness Market: Synergies and Opportunities. 2010. Available online: https://www.sri.com/publication/spas-and-the-global-wellness-market-synergies-and-opportunities/ (accessed on 9 January 2021).
  3. The Global Wellness Institute. The Global Wellness Tourism Economy 2013 & 2014. 2014. Available online: https://globalwellnessinstitute.org/wp-content/uploads/2018/06/GWI_2013_and_2014_Global_Wellness_Tourism_Economy_Report_Final.pdf (accessed on 9 January 2021).
  4. The Global Wellness Institute. Executive Summary. In The Global Wellness Economy. Global Wellness Economy Monitor October 2018; GWI: Miami, FL, USA, 2018. [Google Scholar]
  5. The Global Wellness Institute. The Global Wellness Economy: Looking Beyond COVID. 2021. Available online: https://globalwellnessinstitute.org/wp-content/uploads/2021/11/GWI-WE-Monitor-2021_final-digital.pdf (accessed on 9 January 2021).
  6. Chulalongkorn University Intellectual Property Institute. Trends Analysis Report on Technology and Affluent, Medical and Wellness Tourism Industry. 2017. Available online: https://www.ipthailand.go.th/images/3534/web_01052018/Report_CHU/8_Well-being_06.12.2017_CHU.pdf (accessed on 9 January 2021).
  7. Teeranon, K. Thailand’s Wellness Tourism: Situation and Potential towards Competition of ASEAN Region. FEU Acad. Rev. J. 2018, 12, 22–34. Available online: https://so01.tci-thaijo.org/index.php/FEU/article/view/109385/92255 (accessed on 23 January 2021). (In Thai).
  8. Kieanwatana, K. Situations and Trends of World and Thailand Health Tourism. J. Cult. Approach 2018, 19, 78–87. Available online: https://so02.tci-thaijo.org/index.php/cultural_approach/article/view/123953 (accessed on 23 January 2021). (In Thai).
  9. Permanent Secretary, Ministry of Tourism and Sports. Tourism Economic Review; Permanent Secretary Ministry of Tourism and Sports: Bangkok, Thailand, 2016. (In Thai)
  10. Office of the National Economics & Social Development Board. The 12th National Economic and Social Development Plan (2017–2021); The Prime Minister’s Office All Rights Reserved: Bangkok, Thailand, 2016. (In Thai)
  11. Hudson, S.; Ritchie, B.; Timur, S. Measuring destination competitiveness: An empirical study of Canadian ski resorts. Tour. Plan. Dev. 2004, 1, 79–94. [Google Scholar] [CrossRef]
  12. Tuominen, T.; Saari, S.; Binder, D. Enhancing the competitiveness of a wellness tourism destination by coordinating the multiple actor collaboration. In The Routledge Handbook of Health Tourism; Routledge: London, UK, 2017; pp. 285–297. [Google Scholar]
  13. Zeng, L.; Li, R.Y.; Huang, X. Sustainable Mountain-Based Health and Wellness Tourist Destinations: The Interrelationships between Tourists’ Satisfaction, Behavioral Intentions, and Competitiveness. Sustainability 2021, 13, 3314. [Google Scholar] [CrossRef]
  14. Dos Anjos, F.A.; Da Rosa, S. Measurement of competitiveness of nature-based tourist destinations: Application to national parks in brazil. J. Environ. Manag. Tour. 2021, 12, 1204–1219. [Google Scholar]
  15. Salinas Fernández, J.A.; Serdeira Azevedo, P.; Martín Martín, J.M.; Rodríguez Martín, J.A. Determinants of tourism destination competitiveness in the countries most visited by international tourists: Proposal of a synthetic index. Tour. Manag. Perspect. 2020, 33, 100582. [Google Scholar] [CrossRef]
  16. Altinay, L.; Kozak, M. Revisiting destination competitiveness through chaos theory: The butterfly competitiveness model. J. Hosp. Tour. Manag. 2021, 49, 331–340. [Google Scholar] [CrossRef]
  17. Mohammadian Mosammam, H.; Sarrafi, M.; Nia, J. Measuring the competitiveness of Iran’s health tourism. Int. J. Tour. Policy 2019, 9, 201. [Google Scholar] [CrossRef]
  18. Schalber, C.; Peters, M. Determinants of health tourism competitiveness: An Alpine case study. Tourism 2012, 60, 307–323. [Google Scholar]
  19. Ebrahim, A.H.; Ganguli, S. Strategic priorities for exploiting Bahrain’s medical tourism potential. J. Place Manag. Dev. 2017, 10, 45–60. [Google Scholar] [CrossRef]
  20. Junio, M.M.V.; Kim, J.H.; Lee, T.J. Competitiveness attributes of a medical tourism destination: The case of South Korea with importance-performance analysis. J. Travel Tour. Mark. 2017, 34, 444–460. [Google Scholar] [CrossRef]
  21. Ganguli, S.; Ebrahim, A.H. A qualitative analysis of Singapore’s medical tourism competitiveness. Tour. Manag. Perspect. 2017, 21, 74–84. [Google Scholar] [CrossRef]
  22. Novikova, N.G.; Sakharchuk, E.S.; Ilkevich, S.V. The factors of Russia’s low competitiveness as a medical tourism destination. World Appl. Sci. J. 2013, 27, 251–255. [Google Scholar] [CrossRef]
  23. Hin, C.W.; Bohari, A.; Pu, L.T. An analysis of competitiveness of medical tourism in Malaysia and Thailand: A strategic management approach. Int. Bus. Manag. 2013, 7, 493–499. [Google Scholar] [CrossRef]
  24. Chambers, D.; McIntosh, B. Using Authenticity to Achieve Competitive Advantage in Medical Tourism in the English-Speaking Caribbean. Third World Q. 2008, 29, 919–937. [Google Scholar] [CrossRef]
  25. Hosseini, S.S.; Taghvaei, M. Medical tourism development determinants & strategies by taking an Approach towards Services Integration (Case study of tree health areas). J. Tour. Dev. 2021, 10, 199–214. [Google Scholar] [CrossRef]
  26. Lee, C.-F.; King, B. A determination of destination competitiveness for Taiwan’s hot springs tourism sector using the Delphi technique. J. Vacat. Mark. 2009, 15, 243–257. [Google Scholar] [CrossRef]
  27. Lee, C.-F.; King, B. Assessing Destination Competitiveness: An Application to the Hot Springs Tourism Sector. Tour. Hospit. Plann. Dev. 2006, 3, 179–197. [Google Scholar] [CrossRef] [Green Version]
  28. Campón-Cerro, A.M.; Hernández-Mogollón, J.M.; Alves, H. Sustainable improvement of competitiveness in rural tourism destinations: The quest for tourist loyalty in Spain. J. Dest. Mark. Manag. 2017, 6, 252–266. [Google Scholar] [CrossRef]
  29. Liu, Y.L.; Ko, P.F.; Chiang, J.T. Developing an Evaluation Model for Monitoring Country-Based Tourism Competitiveness. SAGE Open 2021, 11, 21582440211047559. [Google Scholar] [CrossRef]
  30. García-Almeida, D.; Gartner, W. Model konkurentnosti u turističkim destinacijama nematerijalne kulturne baštine sa stajališta temeljenog na znanju. Acta Tur. 2021, 33, 7–37. [Google Scholar] [CrossRef]
  31. Hallmann, K.; Müller, S.; Feiler, S. Destination competitiveness of winter sport resorts in the Alps: How sport tourists perceive destinations? Curr. Issues Tour. 2014, 17, 327–349. [Google Scholar] [CrossRef]
  32. Lim, J.; Lo, M.-C.; Mohamad, A.A.; Wang, Y.-C.; Chin, C.-H. Booster of Rural Tourism’s Competitiveness: Stakeholders’ Involvement as a Moderator. J. Soc. Sci. Res. 2018, 539–546, 6. [Google Scholar] [CrossRef]
  33. Martín-González, R.; Swart, K.; Luque-Gil, A.M. Tourism competitiveness and sustainability indicators in the context of surf tourism: The case of Cape Town. Sustainability 2021, 13, 7238. [Google Scholar] [CrossRef]
  34. Chimpalee, J. The Expectations and Perceptions of Thai Tourists towards the Service Quality of Health Tourism Rommanee Hot Spring in Phangnga Province. J. Hum. Soc. Sci. Rajapruk Univ. 2021, 7, 246–262. Available online: https://so03.tci-thaijo.org/index.php/rpu/article/view/254792 (accessed on 9 January 2021). (In Thai).
  35. Kanittinsuttitong, N.; Lerdsakul, J. Market Demand and Capacity of Wellness Tourism in Nakhon si Thammarat Province. J. Soc. Sci. Buddh. Anthrop. 2021, 6, 77–93. Available online: https://so04.tci-thaijo.org/index.php/JSBA/article/view/248436 (accessed on 9 January 2021). (In Thai).
  36. Peeraschaik, I.; Sangpikul, A. Tourist Experiences of Health Tourism at Natural Hot Springs Affecting Thai Tourists’ Satisfaction in Thong Pha Phoom, Karnchanaburi Province. J. Kanchanaburi Rajbhat Univ. 2021, 10, 223–234. Available online: https://so03.tci-thaijo.org/index.php/KRUjournal/article/view/246583/171198 (accessed on 23 January 2021). (In Thai).
  37. Siribowonphitak, C. Factors affecting revisiting of health tourists in Maha Sarakham province. Silpakorn Univ. J. 2021, 41, 37–50. (In Thai) [Google Scholar] [CrossRef]
  38. Heranya, M. Wellness Tourism Behavior of Thai Tourists in Chiang Mai. Sarasatr 2021, 4, 664–677. Available online: https://so05.tci-thaijo.org/index.php/sarasatr/article/view/253309 (accessed on 23 January 2021). (In Thai).
  39. Thaotrakool, N.; Wannaluk, P. Guidelines for Marketing Communication Development of Health Tourismat Samoeng District and Mae-On District in Chiang Mai Province. Christ. Univ. Thailand J. 2020, 26, 72–83. Available online: https://he01.tci-thaijo.org/index.php/CUTJ/article/view/236377/165208 (accessed on 23 January 2021). (In Thai).
  40. Weerakit, N.; Poomaphinunt, P. Service Quality and Satisfaction of Chinese Wellness Tourists. J. Int. Stud. Prince Songkla Univ. 2020, 10, 29–52. Available online: https://so03.tci-thaijo.org/index.php/jis/article/view/244381 (accessed on 23 January 2021). (In Thai).
  41. Soonthonsmai, V. A Causal Model of Satisfaction on Service Quality of Health Tourism in Scandinavian Aging Tourists in Thailand. Acad. J. Hum. Soc. Sci. Burapha Univ. 2020, 28, 244–268. Available online: https://so06.tci-thaijo.org/index.php/husojournal/article/view/195975/164328 (accessed on 23 January 2021). (In Thai).
  42. Chansiriwat, T. Need of Health Tourism Information in Thailand of Thai Tourists. J. Inf. Sci. 2019, 36, 1–17. Available online: https://so03.tci-thaijo.org/index.php/jiskku/article/view/126736 (accessed on 23 January 2021). (In Thai).
  43. Pengthong, N. Factors that are Affecting the Health-Related Tourism to Foreign Tourists of Koh Samui District, Surat Thani Province. Pathumthani Univ. Acad. J. 2019, 11, 267–277. Available online: https://so05.tci-thaijo.org/index.php/ptujournal/article/view/187782 (accessed on 23 January 2021). (In Thai).
  44. Chatchawanchanchanakij, P.; Arpornpisan, P.; Chatchawanchanchanakij, K. Influence of Tourism Components on Health Tourism Image in Thailand. J. Interdiscip. Res. Grad. Stud. 2021, 10, 1–8. Available online: https://so03.tci-thaijo.org/index.php/JIRGS/article/view/252755/170622 (accessed on 23 January 2021). (In Thai).
  45. Kupkitaphun, K.; Bunjongmanee, P. The Guidelines of Health Tourism Development of European Tourist in Prachuap Khiri Khan Province. J. Grad. Stud. Valaya Alongkorn Rajabhat Univ. 2020, 14, 1–13. Available online: https://so02.tci-thaijo.org/index.php/JournalGradVRU/article/view/211712/163883 (accessed on 23 January 2021). (In Thai).
  46. Saynaratchai, K.; Kieanwatana, K.; Tuntate, U. The Development of Wellness Travel Programme for Tourist at Mae Sot Municipality in Tak Province. Inthaninthaksin J. 2020, 15, 59–91. Available online: https://so02.tci-thaijo.org/index.php/HUSOTSU/article/view/246599/166909 (accessed on 23 January 2021). (In Thai).
  47. Boonchuai, J.; Dhamabutra, P. Strategic Plan for Integrated Sustainable Health Tourism Development in Bangkok, Thailand. Hum. Soc. Sci. Arts 2019, 12, 68–84. Available online: https://he02.tci-thaijo.org/index.php/Veridian-E-Journal/article/view/146330 (accessed on 23 January 2021). (In Thai).
  48. Praprom, C.; Laipaporn, J. Probability Analysis of Wellness Tourism Service for Tourists Traveling in Betong District, Yala Province. Panyapiwat J. 2021, 13, 54–70. Available online: https://he02.tci-thaijo.org/index.php/Veridian-E-Journal/article/view/146330/146936 (accessed on 23 January 2021). (In Thai).
  49. Nootayasakul, C.; Sungrugsa, N. Model of Human Resource Development in the Spa Business to Promote Wellness Tourism for Senior Tourists. Dusit Thani Coll. J. 2020, 13, 16–29. Available online: https://so01.tci-thaijo.org/index.php/journaldtc/article/view/241090 (accessed on 23 January 2021). (In Thai).
  50. Wongprayoon, H.P.; Keadwichai, L.; Chancharoen, S. Management Factors Affecting to Health and Cultural Tourism Model in Khung Bang Kachao, Samut Prakarn Province. J. Assoc. Res. 2020, 25, 411–433. Available online: https://so04.tci-thaijo.org/index.php/jar/article/view/247735/168194 (accessed on 9 January 2021). (In Thai).
  51. Leksuma, P.; Dokchan, T.; Udomsilp, M.; Fakyen, A.; Chuamuangphan, N. The Guideline of Wellness Tourism Activities Development in Western Thailand. Res. Dev. J. Loei Rajabhat Univ. 2019, 14, 20–30. Available online: https://so05.tci-thaijo.org/index.php/researchjournal-lru/article/view/207005/158969 (accessed on 9 January 2021). (In Thai).
  52. Dwyer, L.; Kim, C. Destination Competitiveness: Determinants and Indicators. Curr. Issues Tour. 2003, 6, 369–414. [Google Scholar] [CrossRef]
  53. Neto, A.Q.; Dimmock, K.; Lohmann, G.; Scott, N. Destination competitiveness: How does travel experience influence choice? Curr. Issues Tour. 2020, 23, 1673–1687. [Google Scholar] [CrossRef]
  54. Melnyk, O.; Yaskal, I. Theoretical Approaches to Concepts of “Competition” and “Competitiveness”. Ecoforum J. 2013, 2, 8–12. Available online: http://www.ecoforumjournal.ro/index.php/eco/article/viewFile/27/31 (accessed on 13 March 2022).
  55. Boikova, T.; Zeverte-Rivza, S.; Rivza, P.; Rivza, B. The Determinants and Effects of Competitiveness: The Role of Digitalization in the European Economies. Sustainability 2021, 13, 11689. [Google Scholar] [CrossRef]
  56. Şener, S.; Sarıdoğan, E. The Effects of Science-Technology-Innovation on Competitiveness and Economic Growth. Procedia Soc. Behav. Sci. 2011, 24, 815–828. [Google Scholar] [CrossRef] [Green Version]
  57. Popescu, G.H.; Sima, V.; Nica, E.; Gheorghe, I.G. Measuring Sustainable Competitiveness in Contemporary Economies—Insights from European Economy. Sustainability 2017, 9, 1230. [Google Scholar] [CrossRef] [Green Version]
  58. Badura, O.; Melecky, A.; Melecky, M. Liberalizing Passenger Rail: The Effect of Competition on Local Unemployment. 2022. Available online: https://papers.ssrn.com/sol3/papers.cfm?abstract_id=3954106 (accessed on 13 March 2022).
  59. Przybyla, M.; Roma, M. Does Product Market Competition Reduce Inflation? Evidence from EU Countries and Sectors (March 2005). 2005. Available online: https://doi.org/10.2139/ssrn.676404 (accessed on 13 March 2022).
  60. Marketeer Online. Wellness Tourism: The Opportunity of Tourism Business. 2020. Available online: https://marketeeronline.co/archives/21776 (accessed on 12 March 2022). (In Thai).
  61. GlobalData Plc. Health and Wellness Tourism Trips to Asia to Reach 128.3 Million by 2022, Says GlobalData. 2020. Available online: https://www.globaldata.com/health-and-wellness-tourism-trips-to-asia-to-reach-128-3-million-by-2022-says-globaldata/ (accessed on 12 March 2022).
  62. The International Healthcare Research Center. This Destination is One of 46 Global Destinations Ranked Within the 2020–2021 Medical Tourism Index. Below is a Snapshot of This Destination’s Ranking. 2020. Available online: https://www.medicaltourism.com/destinations/thailand (accessed on 12 March 2022).
  63. Ministry of Tourism and Sports. ASEAN Health Tourism 2012: Generates More than 2500 Million Baht in Current Income in Thailand. 2018. Available online: https://millionaire-academy.com/ (accessed on 12 March 2022). (In Thai)
  64. Kasikorn Research Center. Medical-Tourism Continued to Expand in 2018. 2019. Available online: https://www.kasikornbank.com/th/personal/the-wisdom/articles/e-newsletter/issue/2018/Pages/06.html (accessed on 12 March 2022). (In Thai).
  65. Department of International Trade Promotion, Ministry of Commerce. Elderly Tourist Market: New Thai Opportunities, Growing with AEC. 2014. Available online: https://ditp.go.th/contents_attach/87428/87428.pdf (accessed on 12 March 2022). (In Thai)
  66. National Statistical Office. Number of Foreign Tourists Entering the Country Thailand Classified by Nationality 2009–2018. 2019. Available online: http://statbbi.nso.go.th/staticreport/page/sector/th/17.aspx (accessed on 12 March 2022). (In Thai)
  67. Chantaburee, S. Opportunity and Competitiveness of Spa and Thai Massage Businesses in Thailand. Kasem Bundit J. 2016, 17, 49–63. Available online: https://so04.tci-thaijo.org/index.php/jkbu/article/view/69401 (accessed on 23 January 2022). (In Thai).
  68. Heesup, H.; Kiattipoom, K.; Heekyoung, J.; Wansoo, K. The role of wellness spa tourism performance in building destination loyalty: The case of Thailand. J. Travel Tour. Mark. 2017, 35, 595–610. [Google Scholar] [CrossRef]
  69. Kieanwatana, K.; Sukonthasab, S.; Leemingsawat, W. Situations and Trends of World and Thailand Health Tourism. Acad. J. Ins. Phys. Educ. 2018, 10, 167–177. Available online: https://he02.tci-thaijo.org/index.php/TNSUJournal/article/view/249220 (accessed on 23 January 2022). (In Thai).
  70. The International Society of Aesthetic Plastic Surgery. Isaps International Survey on Aesthetic/Cosmetic Procedures Performed in 2018. 2018. Available online: https://www.isaps.org/wp-content/uploads/2020/10/ISAPS-Global-Survey-Results-2018-1.pdf (accessed on 12 March 2022).
  71. World Economic Forum. The Travel & Tourism Competitiveness Report 2019. 2019. Available online: https://www3.weforum.org/docs/WEF_TTCR_2019.pdf (accessed on 12 March 2022).
  72. Bangkokbiznews. World Organization Warns of ‘COVID-19’ a Major Economic Recession. 2020. Available online: https://www.bangkokbiznews.com/news/detail/874550 (accessed on 12 March 2022). (In Thai).
  73. Hinkin, T.R. A Review of Scale Development Practices in the Study of Organizations. J Manag. 1995, 21, 967–988. [Google Scholar] [CrossRef]
  74. Worthington, R.L.; Whittaker, T.A. Scale Development Research: A Content Analysis and Recommendations for Best Practices. Couns. Psychol. 2006, 34, 806–838. [Google Scholar] [CrossRef]
  75. Li, X.; Du, J.; Long, H. Understanding the Green Development Behavior and Performance of Industrial Enterprises (GDBP-IE): Scale Development and Validation. Int. J. Environ. Res. Public Health 2020, 17, 1716. [Google Scholar] [CrossRef] [PubMed] [Green Version]
  76. Gerbing, D.W.; Anderson, J.C. An Updated Paradigm for Scale Development Incorporating Unidimensionality and Its Assessment. J. Mark. Res. 1988, 25, 186–192. [Google Scholar] [CrossRef]
  77. Ittamalla, R.; Srinivas Kumar, D.V. Determinants of holistic passenger experience in public transportation: Scale development and validation. J. Retail. Consum. Serv. 2021, 61, 102564. [Google Scholar] [CrossRef]
  78. Simms, L.J.; Wright, A.G.C.; Cicero, D.; Kotov, R.; Mullins-Sweatt, S.N.; Sellbom, M.; Watson, D.; Widiger, T.A.; Zimmermann, J. Development of Measures for the Hierarchical Taxonomy of Psychopathology (HiTOP): A Collaborative Scale Development Project. Assessment 2021, 29, 3–16. [Google Scholar] [CrossRef]
  79. McKinley, N.M.; Hyde, J.S. The Objectified Body Consciousness Scale: Development and Validation. Psychol. Women Q. 1996, 20, 181–215. [Google Scholar] [CrossRef]
  80. Bogale, D.; Wondirad, A. Determinant factors of tourist satisfaction in Arbaminch City and its vicinity, Southern Ethiopia. Int. J. Tour. Policy 2019, 9, 320–348. [Google Scholar] [CrossRef]
  81. Ferreira, D.; Perks, S. A dimensional framework of tourism indicators influencing destination competitiveness. Afr. J. Hosp. Tour. Leis. 2020, 9, 1–21. [Google Scholar] [CrossRef]
  82. Queiroz Neto, A.; Lohmann, G.; Scott, N.; Dimmock, K. Rethinking competitiveness: Important attributes for a successful scuba diving destination. Tour. Recreat. Res. 2017, 42, 356–366. [Google Scholar] [CrossRef]
  83. Akin, M.H.; Ozturk, Y.; Karamustafa, K. A comparative perspective on destination competitiveness through visitors’ and stakeholders’ perceptions in the region of Cappadocia. J. Hosp. Tour. Insights 2021. [Google Scholar] [CrossRef]
  84. Armis, R.; Kanegae, H. Regional competitiveness of a post-mining city in tourism: Ombilin coal mining heritage of Sawahlunto, Indonesia. Reg. Sci. Policy Pract. 2021, 13, 1888–1910. [Google Scholar] [CrossRef]
  85. Milićević, S.; Petrović, J.; Kostić, M.; Lakićević, M. Tourism product in the function of improving destination competitiveness: Case of Vrnjačka Banja, Serbia. Qual.-Access Success 2020, 21, 133–138. [Google Scholar]
  86. Woyo, E.; Slabbert, E. Competitiveness factors influencing tourists’ intention to return and recommend: Evidence from a distressed destination. Dev. S. Afr. 2021. [Google Scholar] [CrossRef]
  87. Gajić, T.; Penić, M.; Vujko, A.; Petrović, M.D. Development Perspectives of Rural Tourism Policy—A Comparative Study of Rural Tourism Competitiveness Based on Perceptions of Tourism Workers in Slovenia and Serbia. East. Eur. Countrys. 2018, 24, 143–154. [Google Scholar] [CrossRef] [Green Version]
  88. Mustafa, H.; Omar, B.; Mukhiar, S.N.S.; Park, O.; Zainol, W.W. Exploring Island Destination Competitiveness of Langkawi and Jeju UNESCO Global Geopark: Assessment from International Tourists and Tourism Practitioners. Tour. Plan. Dev. 2021. [Google Scholar] [CrossRef]
  89. Petrović, M.D.; Vujko, A.; Gajić, T.; Vuković, D.B.; Radovanović, M.; Jovanović, J.M.; Vuković, N. Tourism as an approach to sustainable rural development in post-socialist countries: A comparative study of Serbia and Slovenia. Sustainability 2018, 10, 54. [Google Scholar] [CrossRef] [Green Version]
  90. Goffi, G.; Cucculelli, M. Explaining tourism competitiveness in small and medium destinations: The Italian case. Curr. Issues Tour. 2019, 22, 2109–2139. [Google Scholar] [CrossRef]
  91. Dias, Á.L.; Silva, R.; Patuleia, M.; Estêvão, J.; González-Rodríguez, M.R. Selecting lifestyle entrepreneurship recovery strategies: A response to the COVID-19 pandemic. Tour. Hosp. Res. 2021. [Google Scholar] [CrossRef]
  92. Dias, Á.; Patuleia, M.; Silva, R.; Estêvão, J.; González-Rodríguez, M.R. Post-pandemic recovery strategies: Revitalizing lifestyle entrepreneurship. J. Policy Res. Tour. Leis. Events 2021. [Google Scholar] [CrossRef]
  93. Rucci, A.C.; Moreno-Izquierdo, L.; Perles-Ribes, J.F.; Porto, N. Smart or partly smart? Accessibility and innovation policies to assess smartness and competitiveness of destinations. Curr. Issues Tour. 2021. [Google Scholar] [CrossRef]
  94. Lee, C.W.; Li, C. The process of constructing a health tourism destination index. Int. J. Environ. Res. Public Health 2019, 16, 4579. [Google Scholar] [CrossRef] [PubMed] [Green Version]
  95. Wardana, I.M.; Sukaatmadja, I.P.G.; Yasa, N.N.K.; Astawa, I.P. Cultural tourism and ecotourism empowerment in the sustainable tourism development and destination competitiveness enhancement. J. Environ. Manag. Tour. 2019, 10, 753–762. [Google Scholar] [CrossRef]
  96. Hernández-Rojas, R.D.; del Río, J.A.J.; Fernández, A.I.; Vergara-Romero, A. The cultural and heritage tourist, SEM analysis: The case of The Citadel of the Catholic King. Herit. Sci. 2021, 9, 52. [Google Scholar] [CrossRef]
  97. Font, X.; Torres-Delgado, A.; Crabolu, G.; Palomo Martinez, J.; Kantenbacher, J.; Miller, G. The impact of sustainable tourism indicators on destination competitiveness: The European Tourism Indicator System. J. Sustain. Tour. 2021. [Google Scholar] [CrossRef]
  98. Armenski, T.; Dwyer, L.; Pavluković, V. Destination Competitiveness: Public and Private Sector Tourism Management in Serbia. J. Travel Res. 2017, 57, 384–398. [Google Scholar] [CrossRef]
  99. Munzhelele, T.W. An Assessment of the Potential of Hot Spring Tourism in Limpopo Province. Ph.D. Thesis, University of Venda, Limpopo, South Africa, 2017. [Google Scholar]
  100. Lo, M.-C.; Chin, C.-H.; Law, F.-Y. Tourists’ perspectives on hard and soft services toward rural tourism destination competitiveeness: Community support as a moderator. Tour. Hosp. Res. 2017, 19, 139–157. [Google Scholar] [CrossRef]
  101. Bertolini, O.T.; Monticelli, J.M.; Garrido, I.L.; Verschoore, J.R.; Henz, M. Achieving legitimacy of a film-tourism strategy through joint private–public policymaking. Int. J. Tour. Cities 2021. [Google Scholar] [CrossRef]
  102. Slocum, S.L. The Influence of Government Controlled DMOs on Destination Competitiveness: The Case of Belarus. Tour. Plan. Dev. 2021. [Google Scholar] [CrossRef]
  103. Topolansky Barbe, F.; Gonzalez Triay, M.; Häufele, C. The competitiveness of the Uruguayan rural tourism sector and its potential to attract German tourists. Compet. Rev. 2016, 26, 166–187. [Google Scholar] [CrossRef]
  104. Hanafiah, M.H.; Zulkifly, M.I. Tourism destination competitiveness and tourism performance. Compet. Rev. 2019, 29, 592–621. [Google Scholar] [CrossRef]
  105. Šajinović, S. Tourist destination branding in function of market positioning and increased competitiveness of spa tourism. Zb. Rad. Ekon. Fak. Istoč. Sarajev. 2016, 13, 29–40. [Google Scholar] [CrossRef] [Green Version]
  106. An, S.; Choi, Y.; Lee, C.-K. Virtual travel experience and destination marketing: Effects of sense and information quality on flow and visit intention. J. Dest. Mark. Manag. 2021, 19, 100492. [Google Scholar] [CrossRef]
  107. Marasco, A.; Buonincontri, P.; van Niekerk, M.; Orlowski, M.; Okumus, F. Exploring the role of next-generation virtual technologies in destination marketing. J. Dest. Mark. Manag. 2018, 9, 138–148. [Google Scholar] [CrossRef]
  108. Huang, Y.C.; Backman, K.F.; Backman, S.J.; Chang, L.L. Exploring the Implications of Virtual Reality Technology in Tourism Marketing: An Integrated Research Framework. Int. J. Tour. Res. 2016, 18, 116–128. [Google Scholar] [CrossRef]
  109. Glyptou, K. Destination Image Co-creation in Times of Sustained Crisis. Tour. Plan. Dev. 2021, 18, 166–188. [Google Scholar] [CrossRef]
  110. Michopoulou, E.; Al-Qasmi, I.; Melpignano, C. Co-creating Value in Desert Tourism Experiences. Tour. Plan. Dev. 2021, 18, 245–265. [Google Scholar] [CrossRef]
  111. Churchill, G.A. A Paradigm for Developing Better Measures of Marketing Constructs. J. Mark. Res. 1979, 16, 64–73. [Google Scholar] [CrossRef]
  112. Corbin, J.; Strauss, A. Basics of Qualitative Research: Techniques and Procedures for Developing Grounded Theory, 3rd ed.; Sage: Thousand Oaks, CA, USA, 2008. [Google Scholar] [CrossRef]
  113. Boddy, C.R. Sample size for qualitative research. Qual. Mark. Res. 2016, 19, 426–432. [Google Scholar] [CrossRef]
  114. Busser, J.A.; Shulga, L.V. Co-created value: Multidimensional scale and nomological network. Tour. Manag. 2018, 65, 69–86. [Google Scholar] [CrossRef]
  115. DeVellis, R.F. Scale Development: Theory and Applications, 3rd ed.; Sage: Thousand Oaks, CA, USA, 2012. [Google Scholar]
  116. Netemeyer, R.G.; Bearden, W.O.; Sharma, S. Scaling Procedures: Issues and Applications; Sage Publications: Thousand Oaks, CA, USA, 2003. [Google Scholar]
  117. Rovinelli, R.J.; Hambleton, R.K. On the Use of Content Specialists in the Assessment of Criterion-Referenced Test Item Validity. Tijdschr. Voor Onderwijsres. 1977, 2, 49–60. [Google Scholar]
  118. Hair, J.F., Jr.; Black, W.C.; Babin, B.J.; Anderson, R.E. Multivariate Data Analysis: A Global Perspective, 7th ed.; Pearson Education: Upper Saddle River, NJ, USA, 2010. [Google Scholar]
  119. Soper, D.S. A-Priori Sample Size Calculator for Structural Equation Models. 2021. Available online: https://www.danielsoper.com/statcalc (accessed on 9 May 2021).
  120. Harris, R.J. A Primer of Multivariate Statistics, 3rd ed.; Erlbaum: Mahwah, NJ, USA, 2001. [Google Scholar]
  121. Baruch, Y.; Holtom, B.C. Survey response rate levels and trends in organizational research. Hum. Relat. 2008, 61, 1139–1160. [Google Scholar] [CrossRef] [Green Version]
  122. Loehlin, J.C. Latent Variable Model: An Introduction to Factor, Path, and Structural Analysis, 2nd ed.; Lawrence Erlbaum: Hillsdale, NJ, USA, 1992. [Google Scholar]
  123. Mueller, R.O. Structural equation modeling: Back to basics. Struct. Equ. Model. 1997, 4, 353–369. [Google Scholar] [CrossRef]
  124. Kline, R.B. Principles and Practice of Structural Equation Modeling, 3rd ed.; Guilford Press: New York, NY, USA, 2011. [Google Scholar]
  125. Fornell, C.; Larcker, D.F. Evaluating Structural Equation Models with Unobservable Variables and Measurement Error. J. Mark. Res. 1981, 18, 39–50. [Google Scholar] [CrossRef]
  126. Bagozzi, R.P.; Yi, Y. On the evaluation of structural equation models. J. Acad. Mark. Sci. 1988, 16, 74–94. [Google Scholar] [CrossRef]
Figure 1. Number of Thai health and wellness tourists from Asian countries in 2019. Sources: The National Statistical Office of Thailand [66].
Sustainability 14 04152 g001
Figure 2. Number of Thai health and wellness tourists from European countries in 2019. Sources: The National Statistical Office of Thailand [66].
Sustainability 14 04152 g002
Figure 3. Proposed dimensions of the wellness destination competitiveness assessment.
Sustainability 14 04152 g003
Table 1. Types of activities that foreign health and wellness tourists in Thailand expect.
Types of ActivitiesPercentages of Expectations
Thai massage65.80
Foot reflexology30.10
Healthy eating29.50
Aromatherapy massage26.80
Yoga23.80
Thai boxing22.30
Meditation20.60
Saunas16.60
Compress massage13.80
Stone massage13.60
Taichi13.60
Soaking in the jacuzzi pool13.00
Acupressure massage11.00
Hermit exercise (Rusie Dutton)8.20
Mud-pack therapy6.70
Source: Kieanwatana et al. [69].
Table 2. Wellness destination competitiveness measurement scale.
DimensionCodeItem
Destination environmentDE1Business environment that promotes wellness tourism business
DE2Safety and security of the destination
DE3Health and hygiene of the destination
DE4Human resources in terms of staff in wellness tourism organizations and businesses that are responsible for delivering products and services to the tourists
DE5Human resources in the area whose duty it is to welcome wellness tourists
DE6Availability of information and communication technology
Wellness tourism travel and policyPOL1Importance given to transportation, tourism, and health services
POL2Openness to international tourists to specifically promote wellness tourism
POL3Ability to specify the price level of health promotion products and services
POL4Environmentally friendly experience in the destination area
Wellness infrastructure and capacityINF1Infrastructure of transportation system that is ready to support wellness tourism
INF2Infrastructure to support services and tourism
INF3Ability to accommodate tourists in terms of venues, accommodation, and facilities
INF4Ability to accommodate tourists in terms of food and beverages
INF5Ability to accommodate tourists in terms of recreation and entertainment
Man-made and cultural resourcesMAC1Readiness of semi-natural tourist attractions
MAC2Readiness of cultural and knowledgeable wisdom of tourist attractions
MAC3Resources that are suitable for the development of tourist attractions, routes, or new activities to respond to wellness tourist needs
MAC4Readiness of health promotion resources
Wellness strategy and structureWEL1Strategy to improve the quality of services and treatments
WEL2Promotion of tourist attractions as well-known and accredited
WEL3Strategy planning for delivering services for customer satisfaction
WEL4Link between different products, services, activities, and components of wellness tourism and tourists who visit the destination
WEL5Health therapy and beauty activities offered by tourist attractions, such as healthy food, hot-spring bathing, steaming, water exercise, hydromassage, Thai massage, spas, Thai herbal steam, and acupuncture
WEL6Tourist attractions offering physical wellness activities, such as yoga, sports tourism, cycling, and trekking
WEL7Tourist attractions offering mental wellness activities, such as meditation, mind reading, Dharma practice, and mind-restorative activities
WEL8Tourist attractions offering local knowledge learning activities, such as massage class, cooking class, local knowledge class, tour to learn local knowledge, market tour, and merit-making at temples.
Innovation potentialINN1Knowledge to develop new products and services, including activities and components of wellness tourism, which are faster and of high quality
INN2Knowledge to respond to the needs of customers and tourists at the highest level
INN3Human capital to develop new products and services, such as staff who are experts in wellness tourism and creative and passionate in developing new products and services, etc.
INN4Openness to service innovation, such as application of electronic tourism system; acceptance of new technologies; and absorption, adjustment, and use of outside knowledge
INN5Development of new wellness tourism services and products using local community resources based on outstanding local knowledge and identity
Collaborative and proactive marketingCOL1Formation of cluster groups whose purpose is to work collaboratively and communicate with every group of stakeholders
COL2Creating opportunities and supporting local communities in participating in planning wellness tourism, such as health tourism programs or activities and local employment
COL3Collaboration between public and private agencies
COL4Marketing of health products and services with allies from public and private agencies at local, national, and international levels
COL5Creating target brands attractive to tourists, such as outstanding presentation of slogans, logos, and health promotion services
COL6Creating a more memorable brand identity than competitors’
COL7Links for advertising and publicizing together to market through health-based online social media platforms
CO8Environmental simulation at real venues for targeted groups, customers, and interested people so they may experience, understand, and have clearer visualization of wellness tourism destination
COL9Creating shareable feedback such as tourist feedback via online reviews and scores to evaluate customer satisfaction via online channels
Table 3. Confirmatory factor analysis results for the final model of the wellness destination competitiveness assessment dimensions in Thailand (N = 216).
ComponentsIndicatorsFactor LoadingR2Construct Reliability (CR)Average Variance Extracted (AVE)
Destination environment
(DE)
DE10.8040.6460.8920.583
DE20.8530.728--
DE30.8030.645--
DE40.7110.505--
DE50.7680.590--
DE60.6180.381--
Wellness tourism travel and policy
(POL)
POL10.7790.6080.8820.652
POL20.8560.732--
POL30.8160.667--
POL40.7770.603--
Wellness infrastructure and capacity
(INF)
INF10.6790.4610.8520.536
INF20.8220.675--
INF30.7720.596--
INF40.6690.447--
INF50.7070.500--
Man-made and cultural resources
(MAC)
MAC10.7250.5250.7930.500
MAC20.6940.482--
MAC30.6870.472--
MAC40.6930.480--
Wellness strategy and structure
(WEL)
WEL10.7730.5970.9120.566
WEL20.7330.537--
WEL30.7320.536--
WEL40.8350.697--
WEL50.7320.536--
WEL60.7090.503--
WEL70.7910.626--
WEL80.7040.496--
Innovation potential
(INN)
INN10.9010.4850.9370.749
INN20.8250.681--
INN30.9190.845--
INN40.8940.800--
INN50.7800.609--
Collaborative and proactive marketing
(COL)
COL10.9110.5270.9550.703
COL20.8420.709--
COL30.7920.627--
COL40.8010.642--
COL50.8390.703--
COL60.8450.715--
COL70.8180.669--
COL80.8550.730--
COL90.8390.703--
Table 4. Correlations and square root of average variance extracted (AVE) (N = 216).
AVEDEPOLINFMACWELINNCOL
DE0.5830.764
POL0.6520.4020.807
INF0.5360.4220.4600.732
MAC0.5000.4280.4730.4850.707
WEL0.5660.4490.5070.5310.5510.752
INN0.7490.3750.4650.4710.4770.5270.865
COL0.7030.3630.4300.4240.4480.4980.5170.838
Note: Bold diagonal elements are the square root of AVE for each construct. Off-diagonal elements are the correlations between constructs.
Table 5. Mean test of ratings of the wellness destination competitiveness dimensions and each factor of the wellness destination competitiveness measurement scale (N = 216).
DimensionMeanS.D.RankIndicatorsMeanS.D.Rank
Collaborative and proactive marketing
(COL)
4.570.5081COL44.710.5581
COL84.640.5702
COL34.610.5973
INN54.590.5914
COL94.590.5504
COL24.560.6246
Innovation potential
(INN)
4.510.5452COL54.540.6067
INN34.530.6078
INN44.520.6179
COL64.510.61710
COL74.490.61711
INN24.490.65412
Wellness tourism travel and policy
(POL)
4.290.5723COL14.460.60613
INN14.440.65114
POL14.380.62415
WEL34.360.66516
INF34.350.59717
Wellness strategy and structure
(WEL)
4.190.5524WEL84.350.64518
POL34.300.71219
POL24.300.64120
WEL64.260.60721
WEL74.250.63322
INF14.190.72823
Wellness infrastructure and capacity
(INF)
4.160.5505POL44.180.67224
WEL54.160.67225
INF24.150.71126
WEL44.140.70627
INF44.100.64828
MAC34.080.75929
Man-made and cultural resources
(MAC)
4.030.6026DE64.070.68230
MAC44.060.80231
INF54.040.69432
WEL24.020.71133
MAC24.010.65534
MAC13.980.69935
Destination environment
(DE)
3.760.5587WEL13.980.78936
DE33.840.69837
DE23.810.63338
DE13.770.64539
DE53.640.72640
DE43.420.72641
Publisher’s Note: MDPI stays neutral with regard to jurisdictional claims in published maps and institutional affiliations.

