
Decarbonising Universities: Case Study of the University of Exeter’s Green Strategy Plans Based on Analysing Its Energy Demand in 2012–2020


Abstract
:1. Introduction
2. Literature Review
2.1. Scope 1: Direct Emissions Reductions (Burning Fuel for Heat or for Vehicles)
2.1.1. Gas
2.1.2. Vehicle Fleet
2.1.3. Oil
2.2. Scope 2: Reductions Downstream Activities’ Emissions
Buildings Standards
2.3. Scope 3: Reductions Upstream Activities’ Emissions
2.4. Alternative Generation (Carbon Negative)
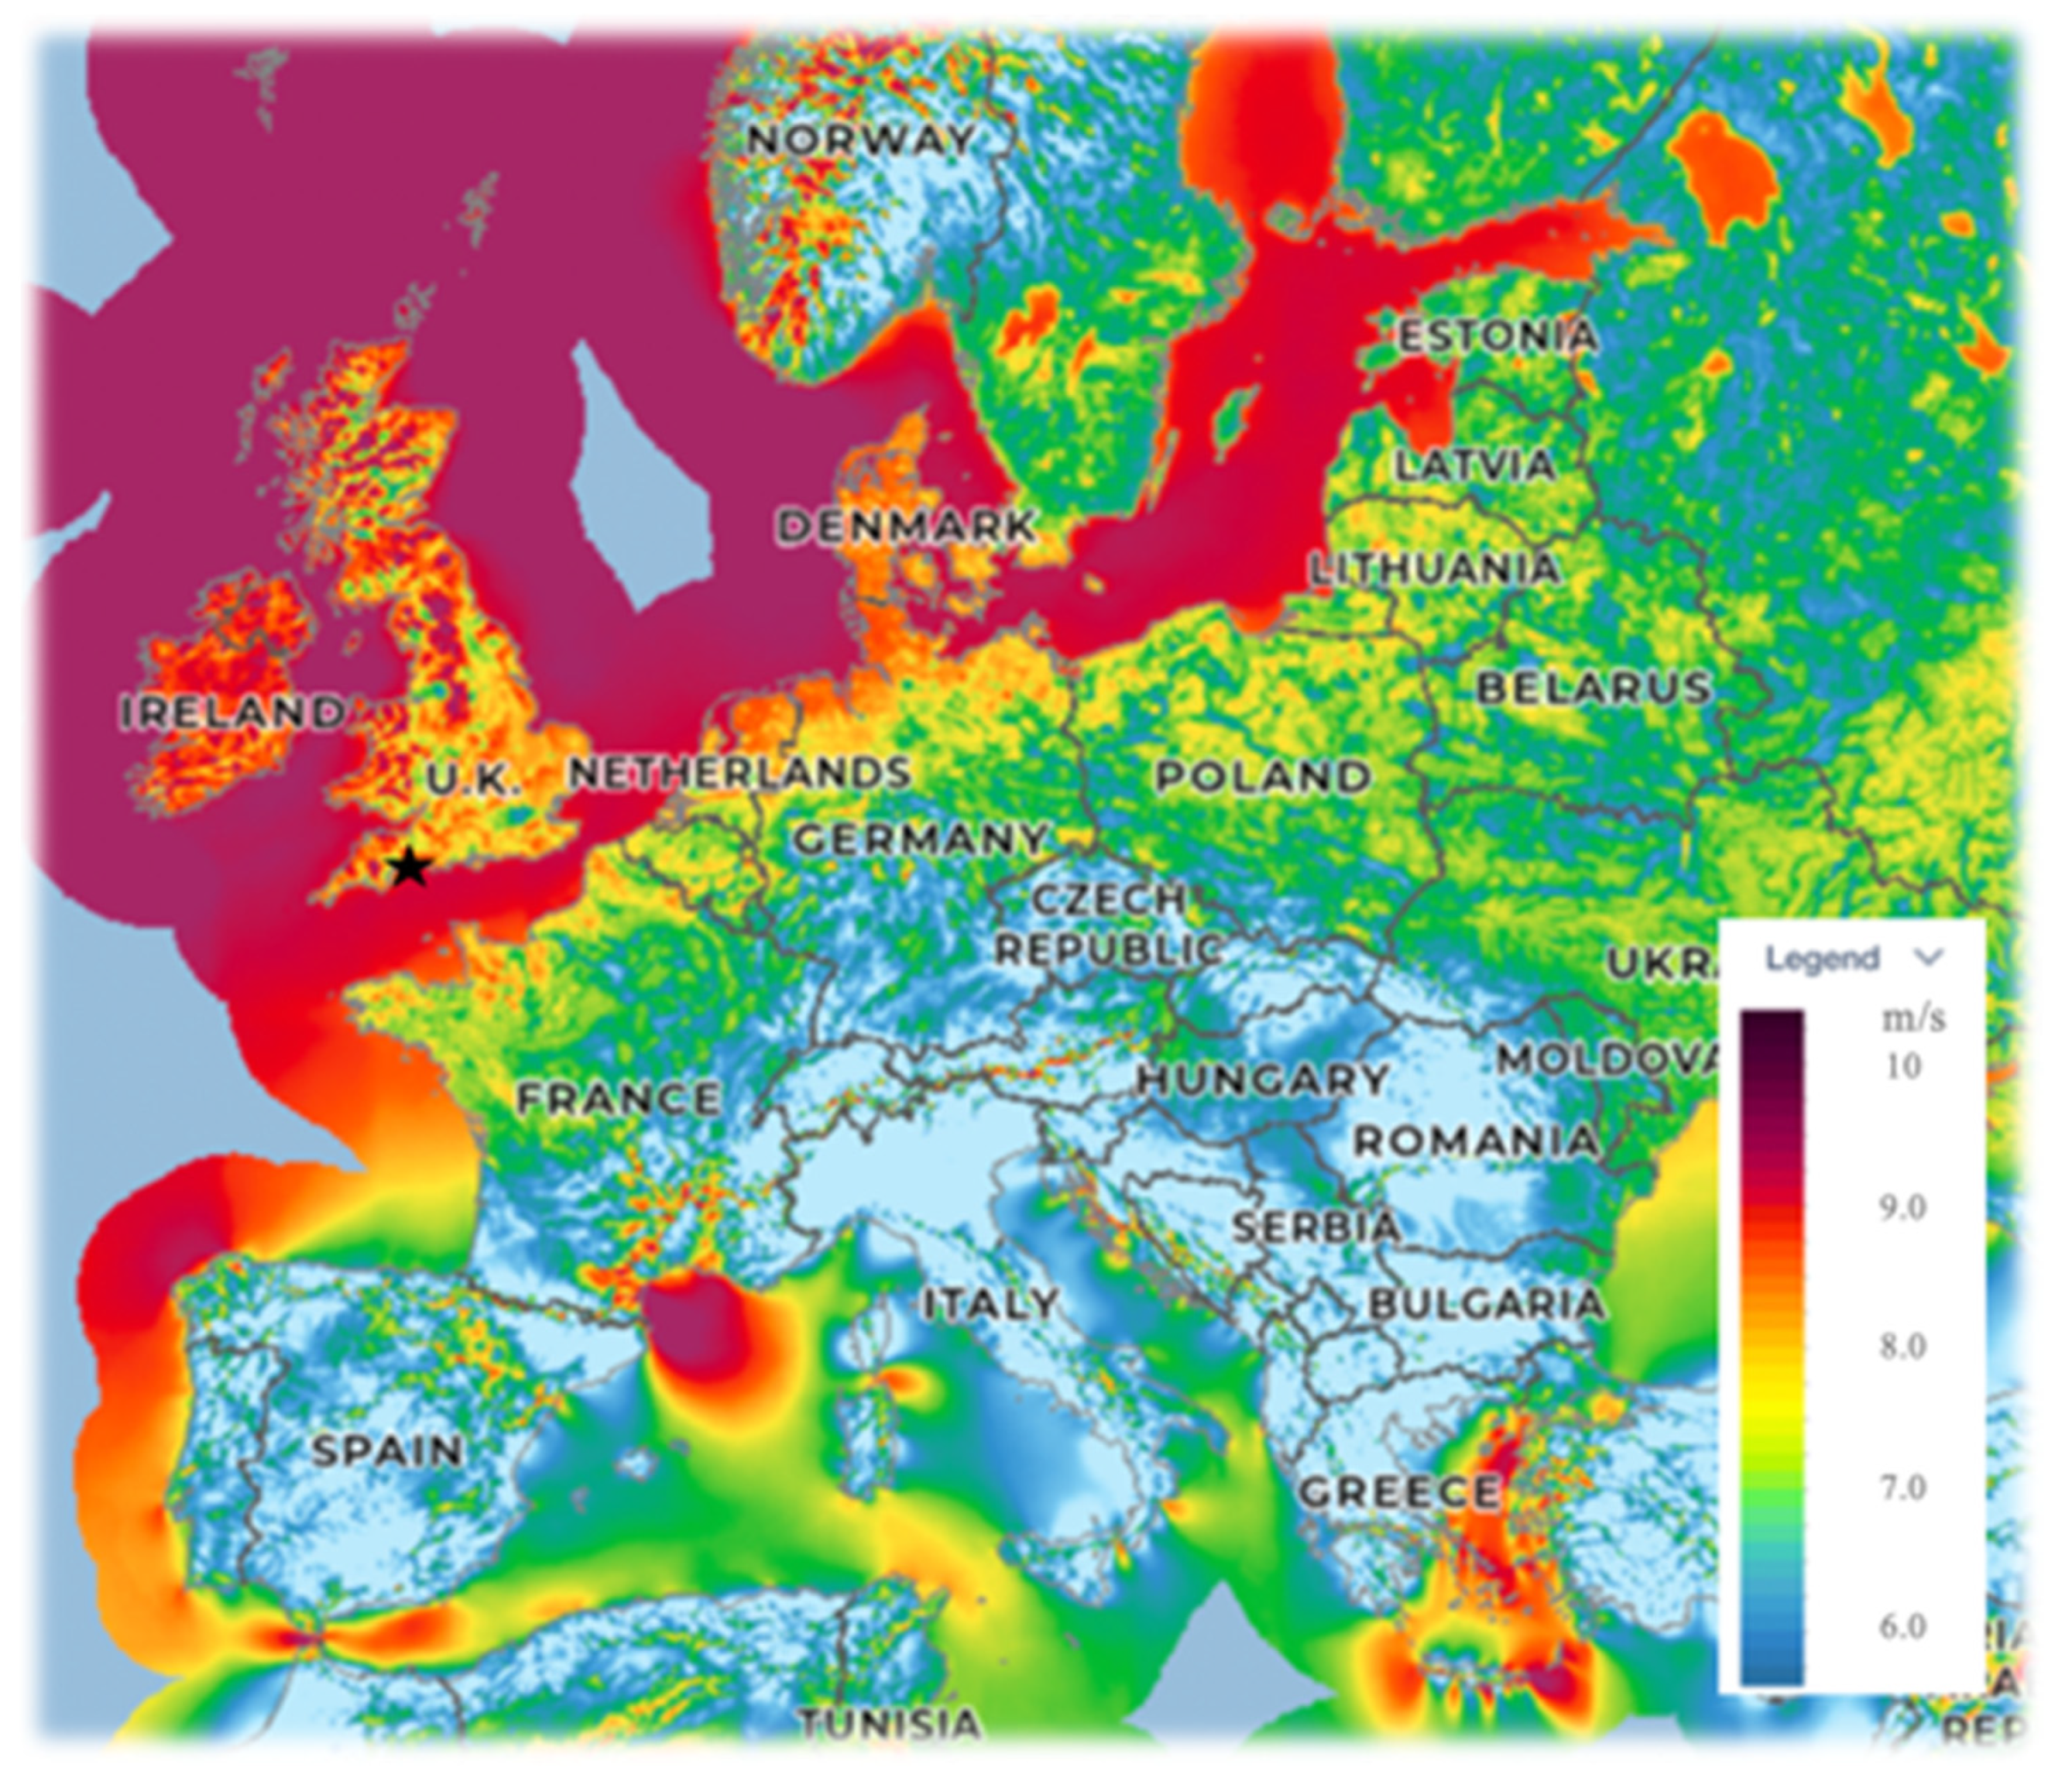
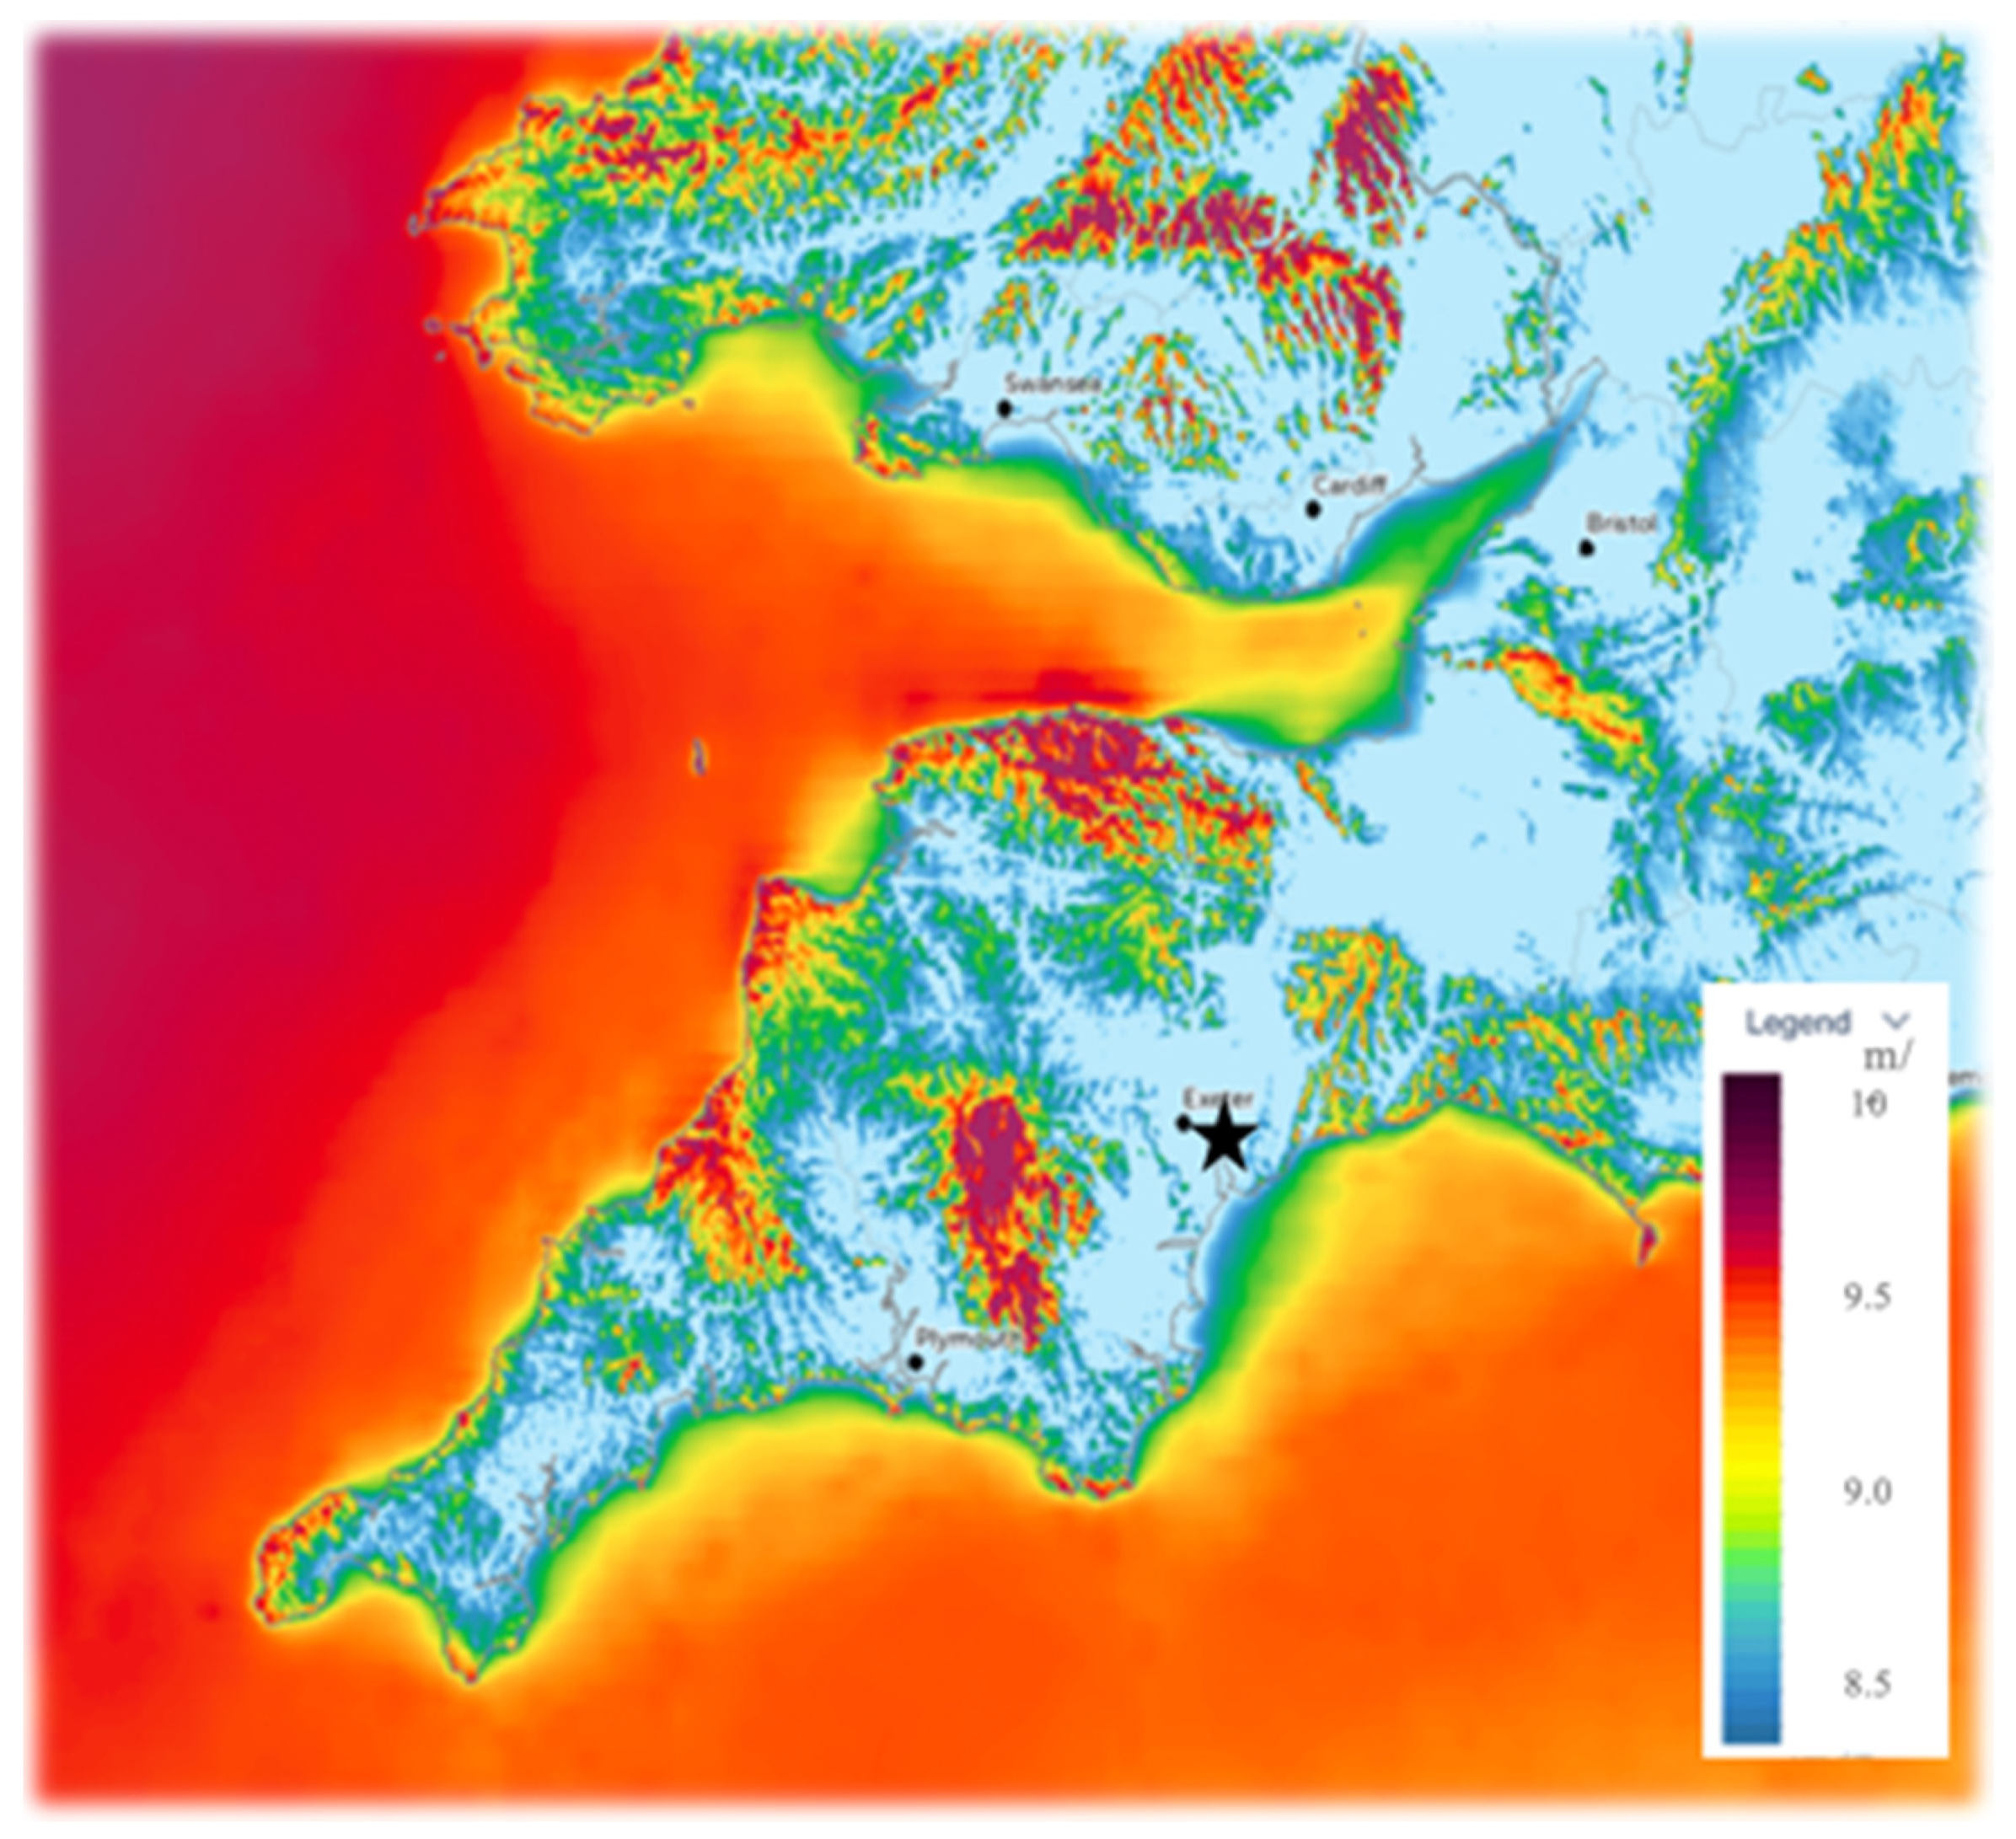
2.4.1. Wind
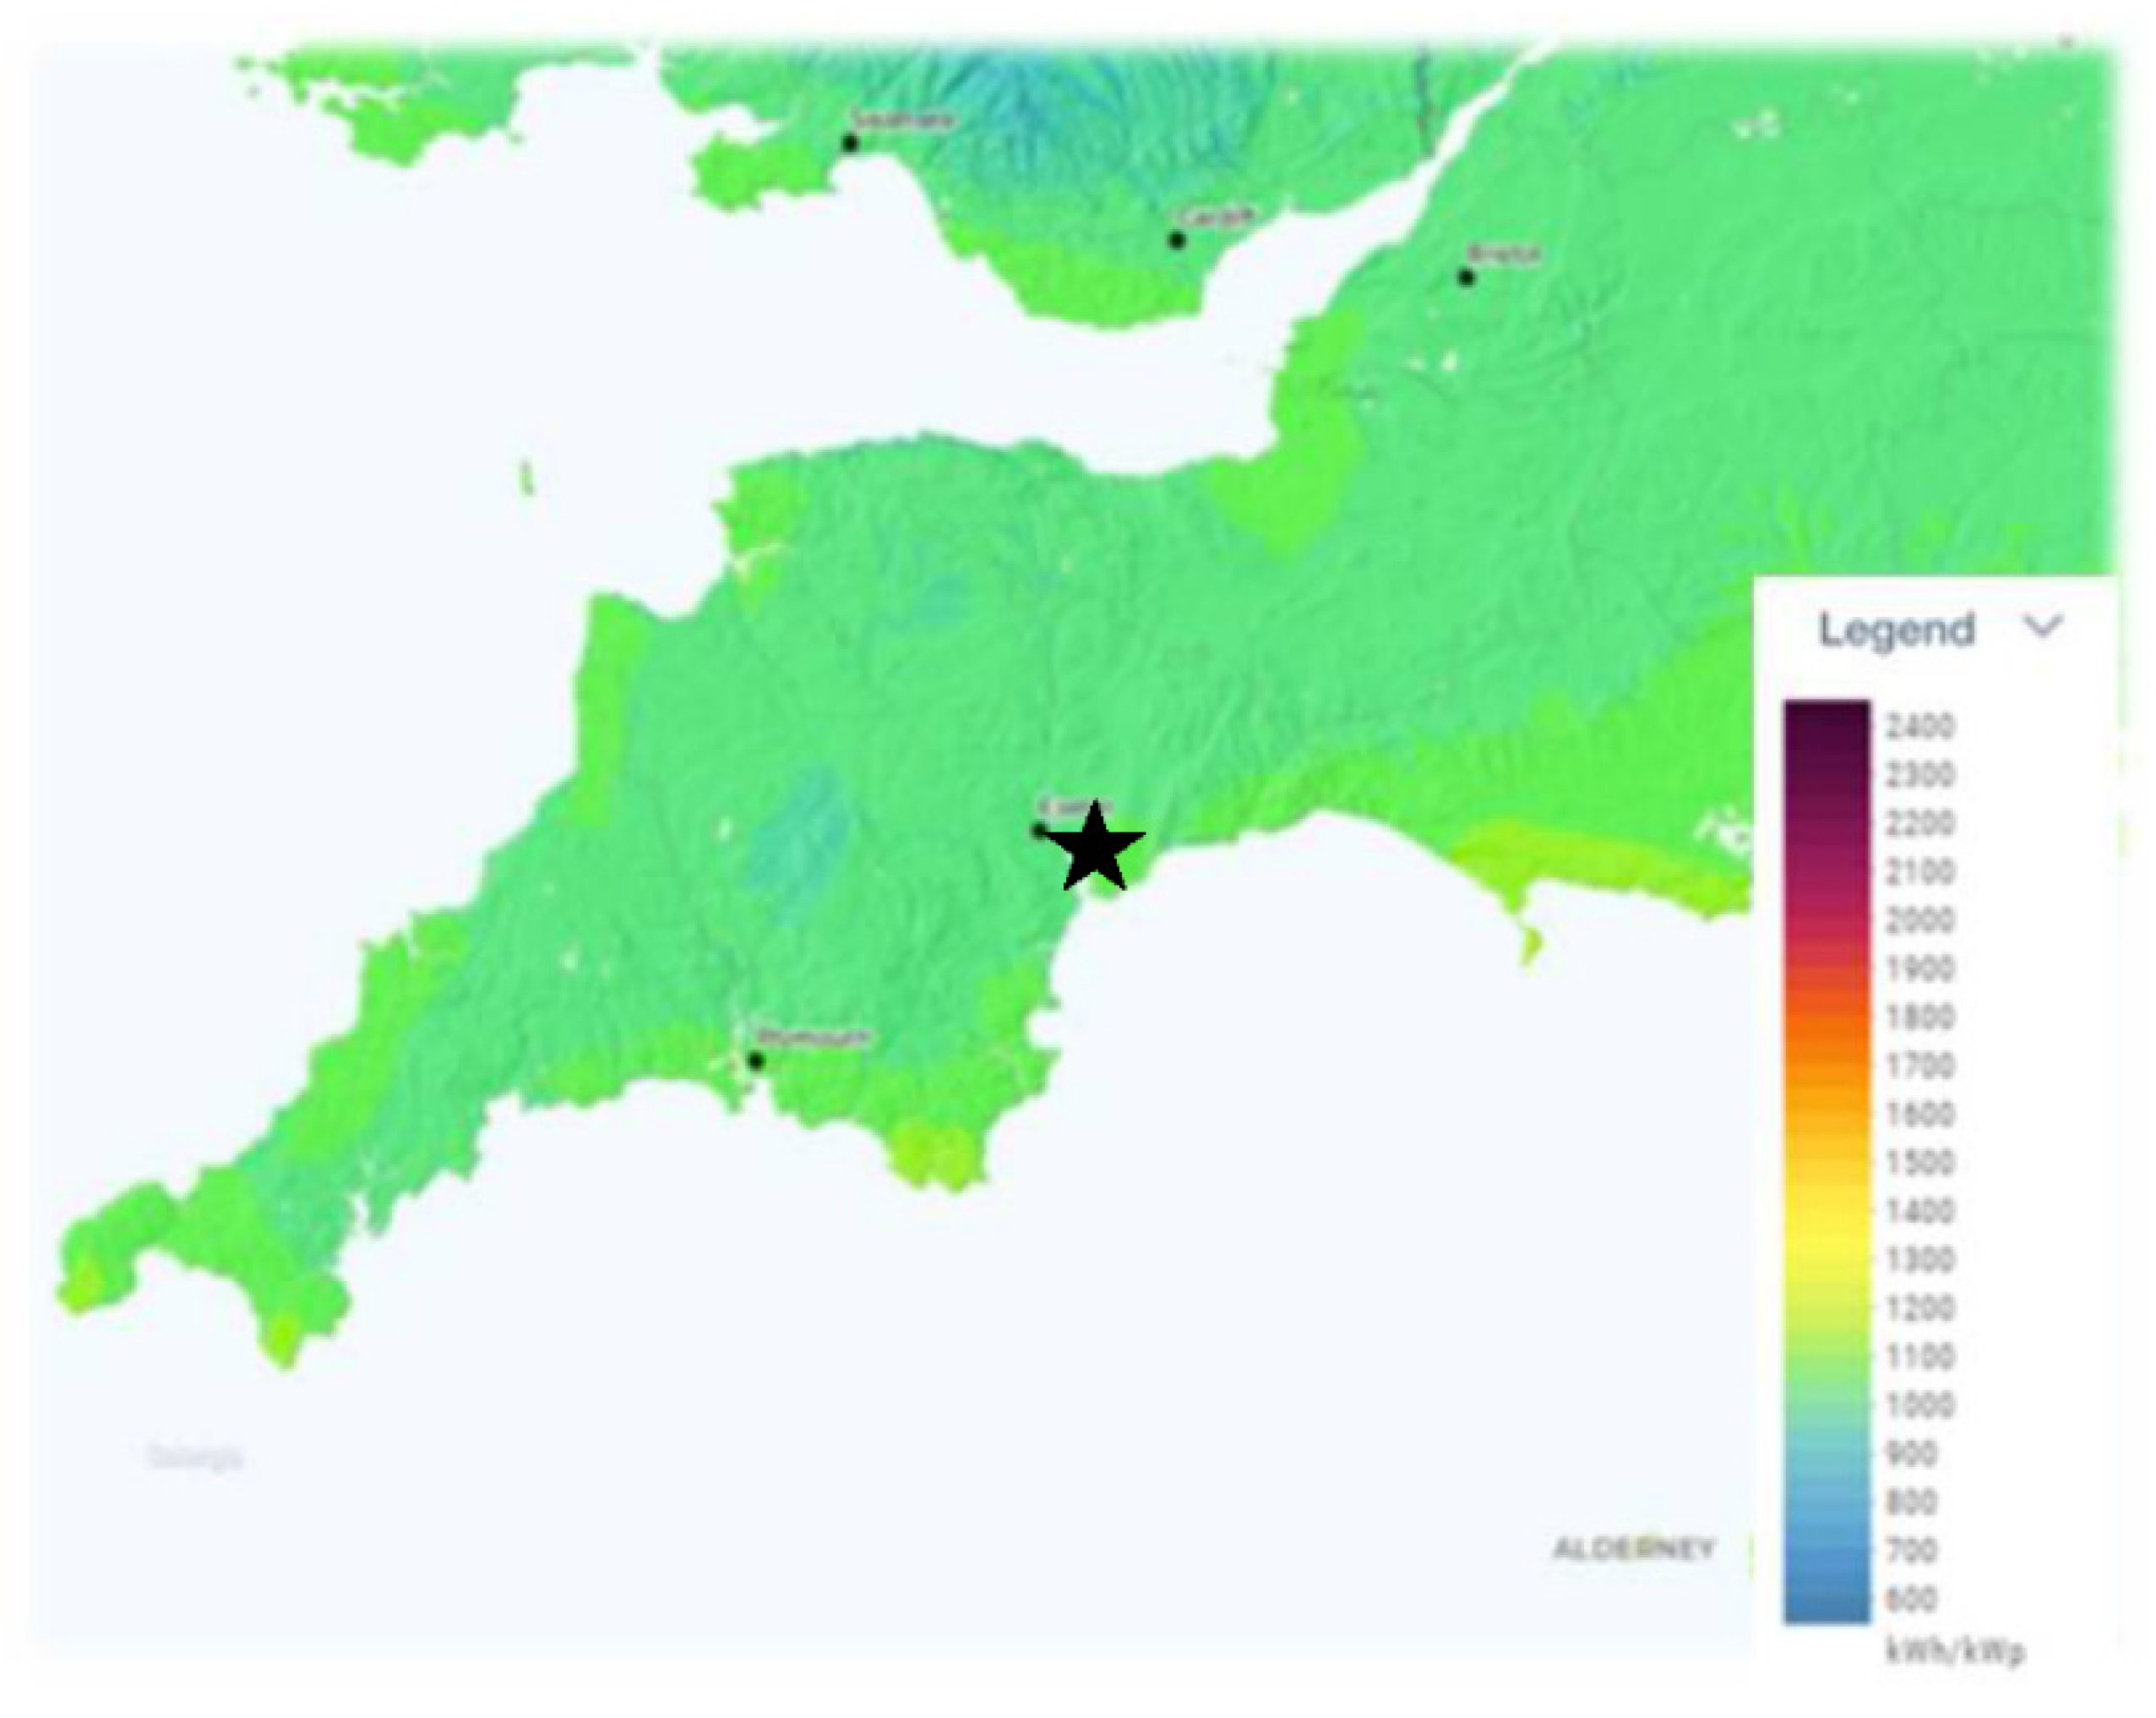
2.4.2. Solar
3. Methodology
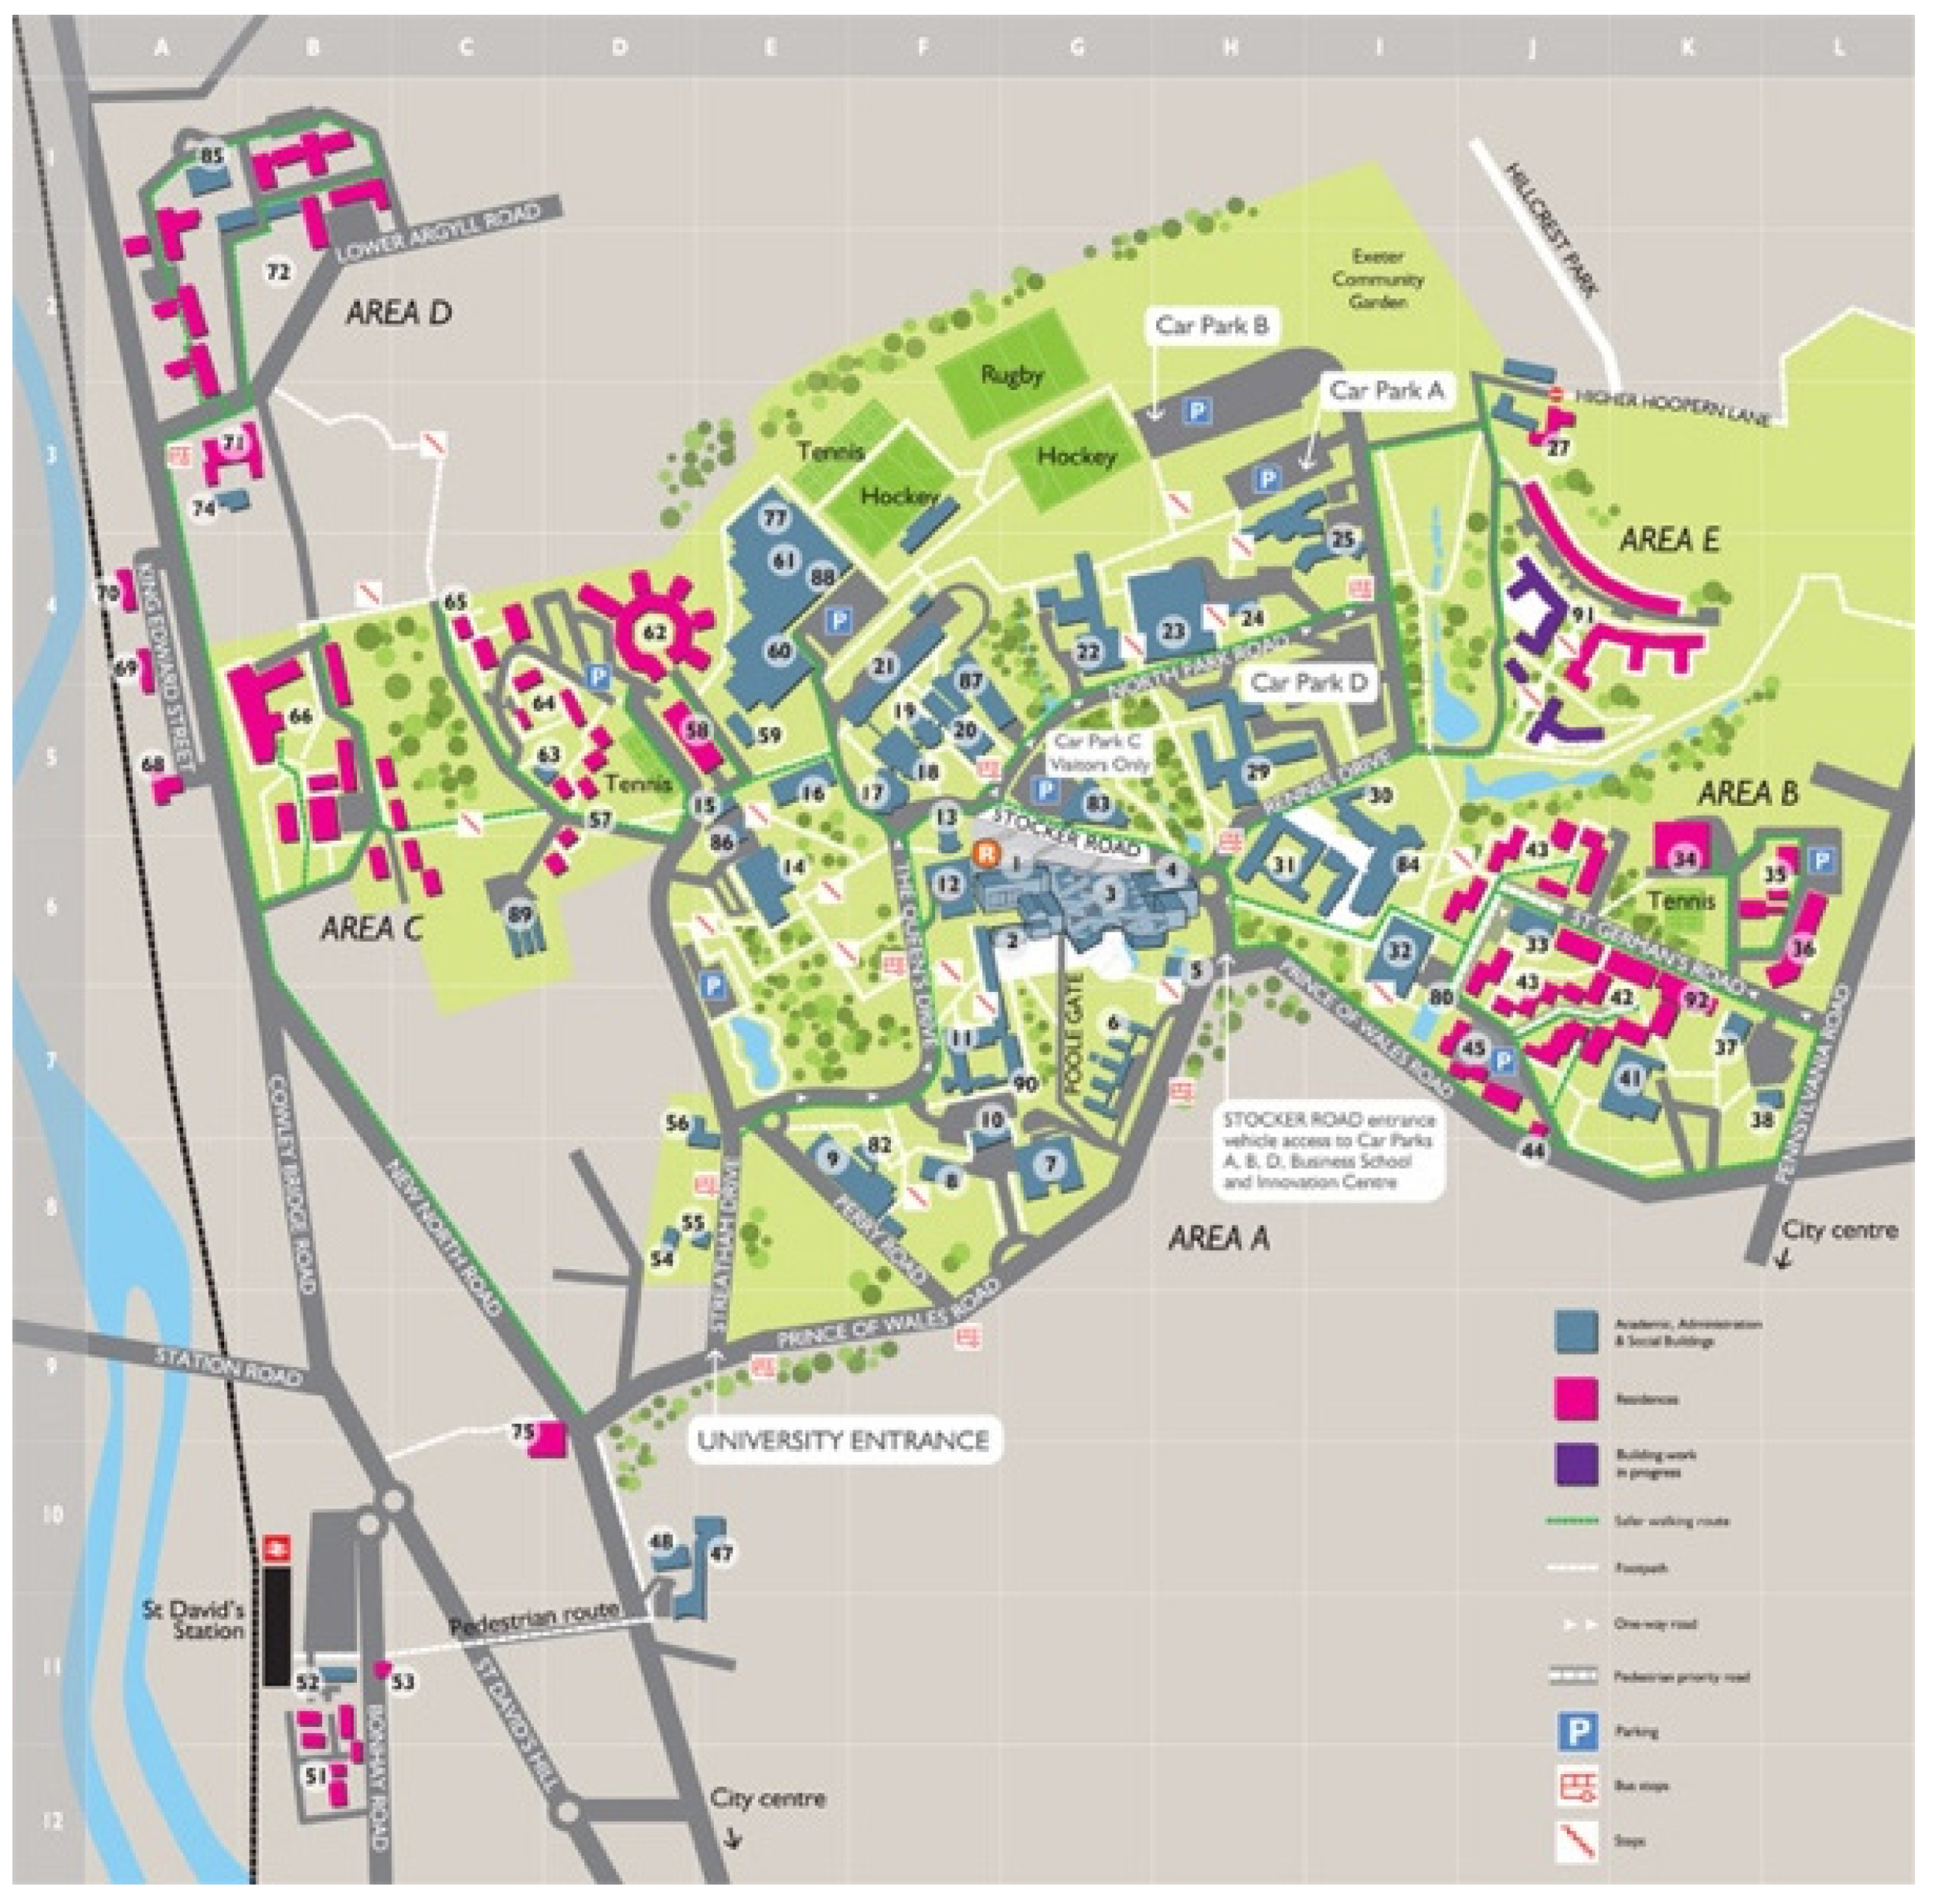
Data Collection and Compilation
4. Analysis
4.1. Scope 1
4.2. Scope 2
4.3. Scope 3
5. Results
5.1. Scope 1
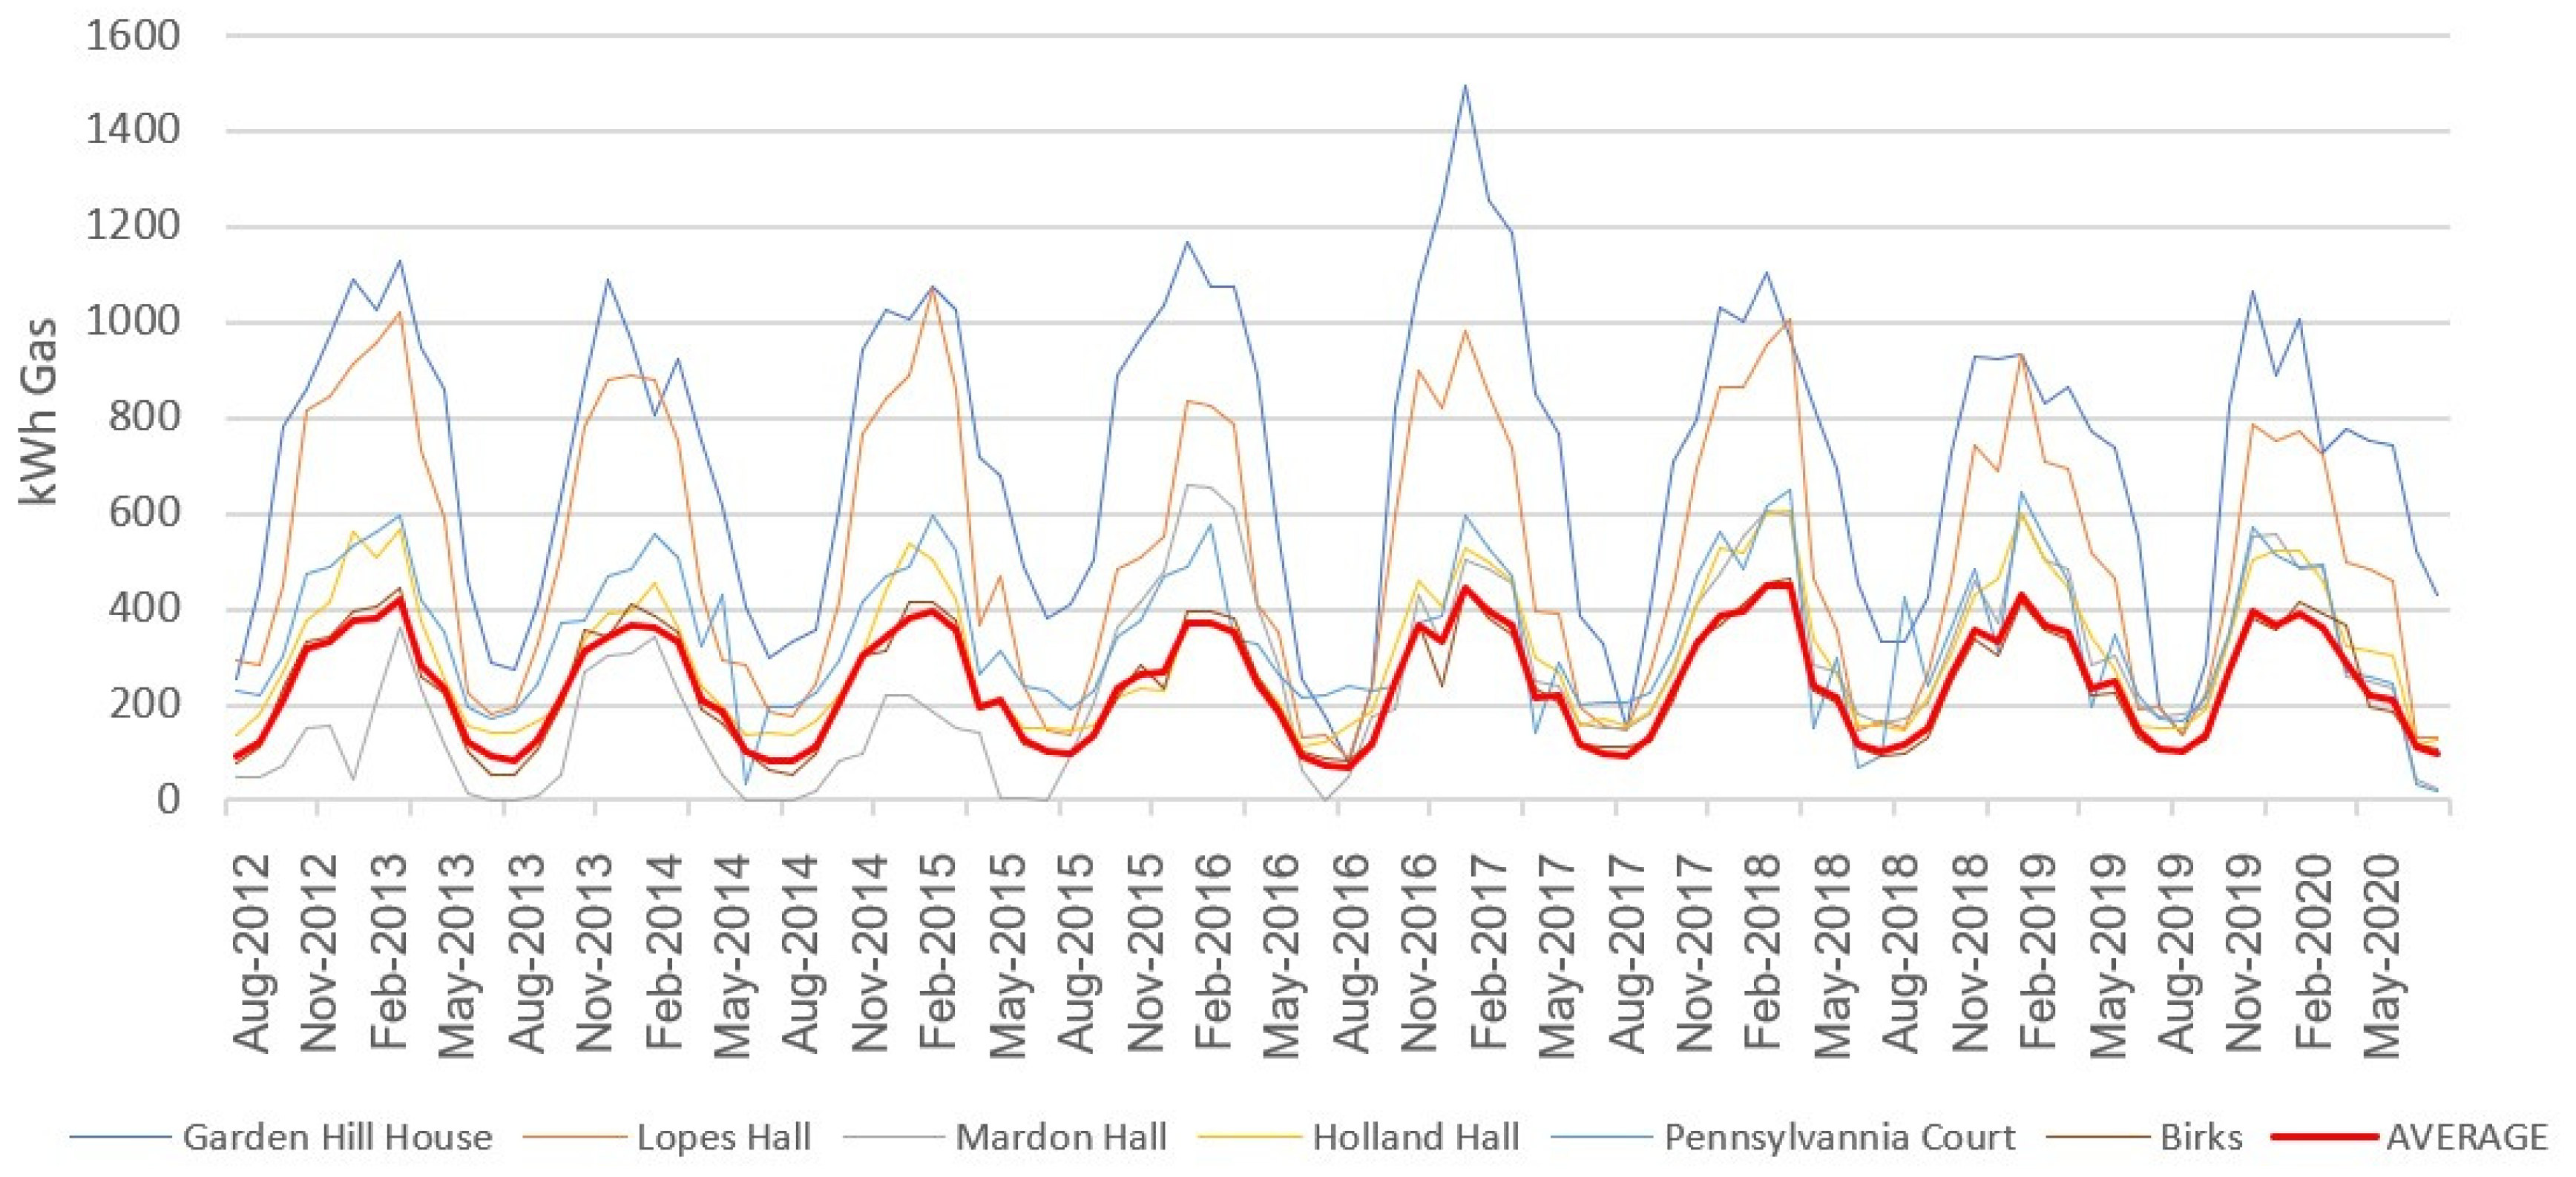
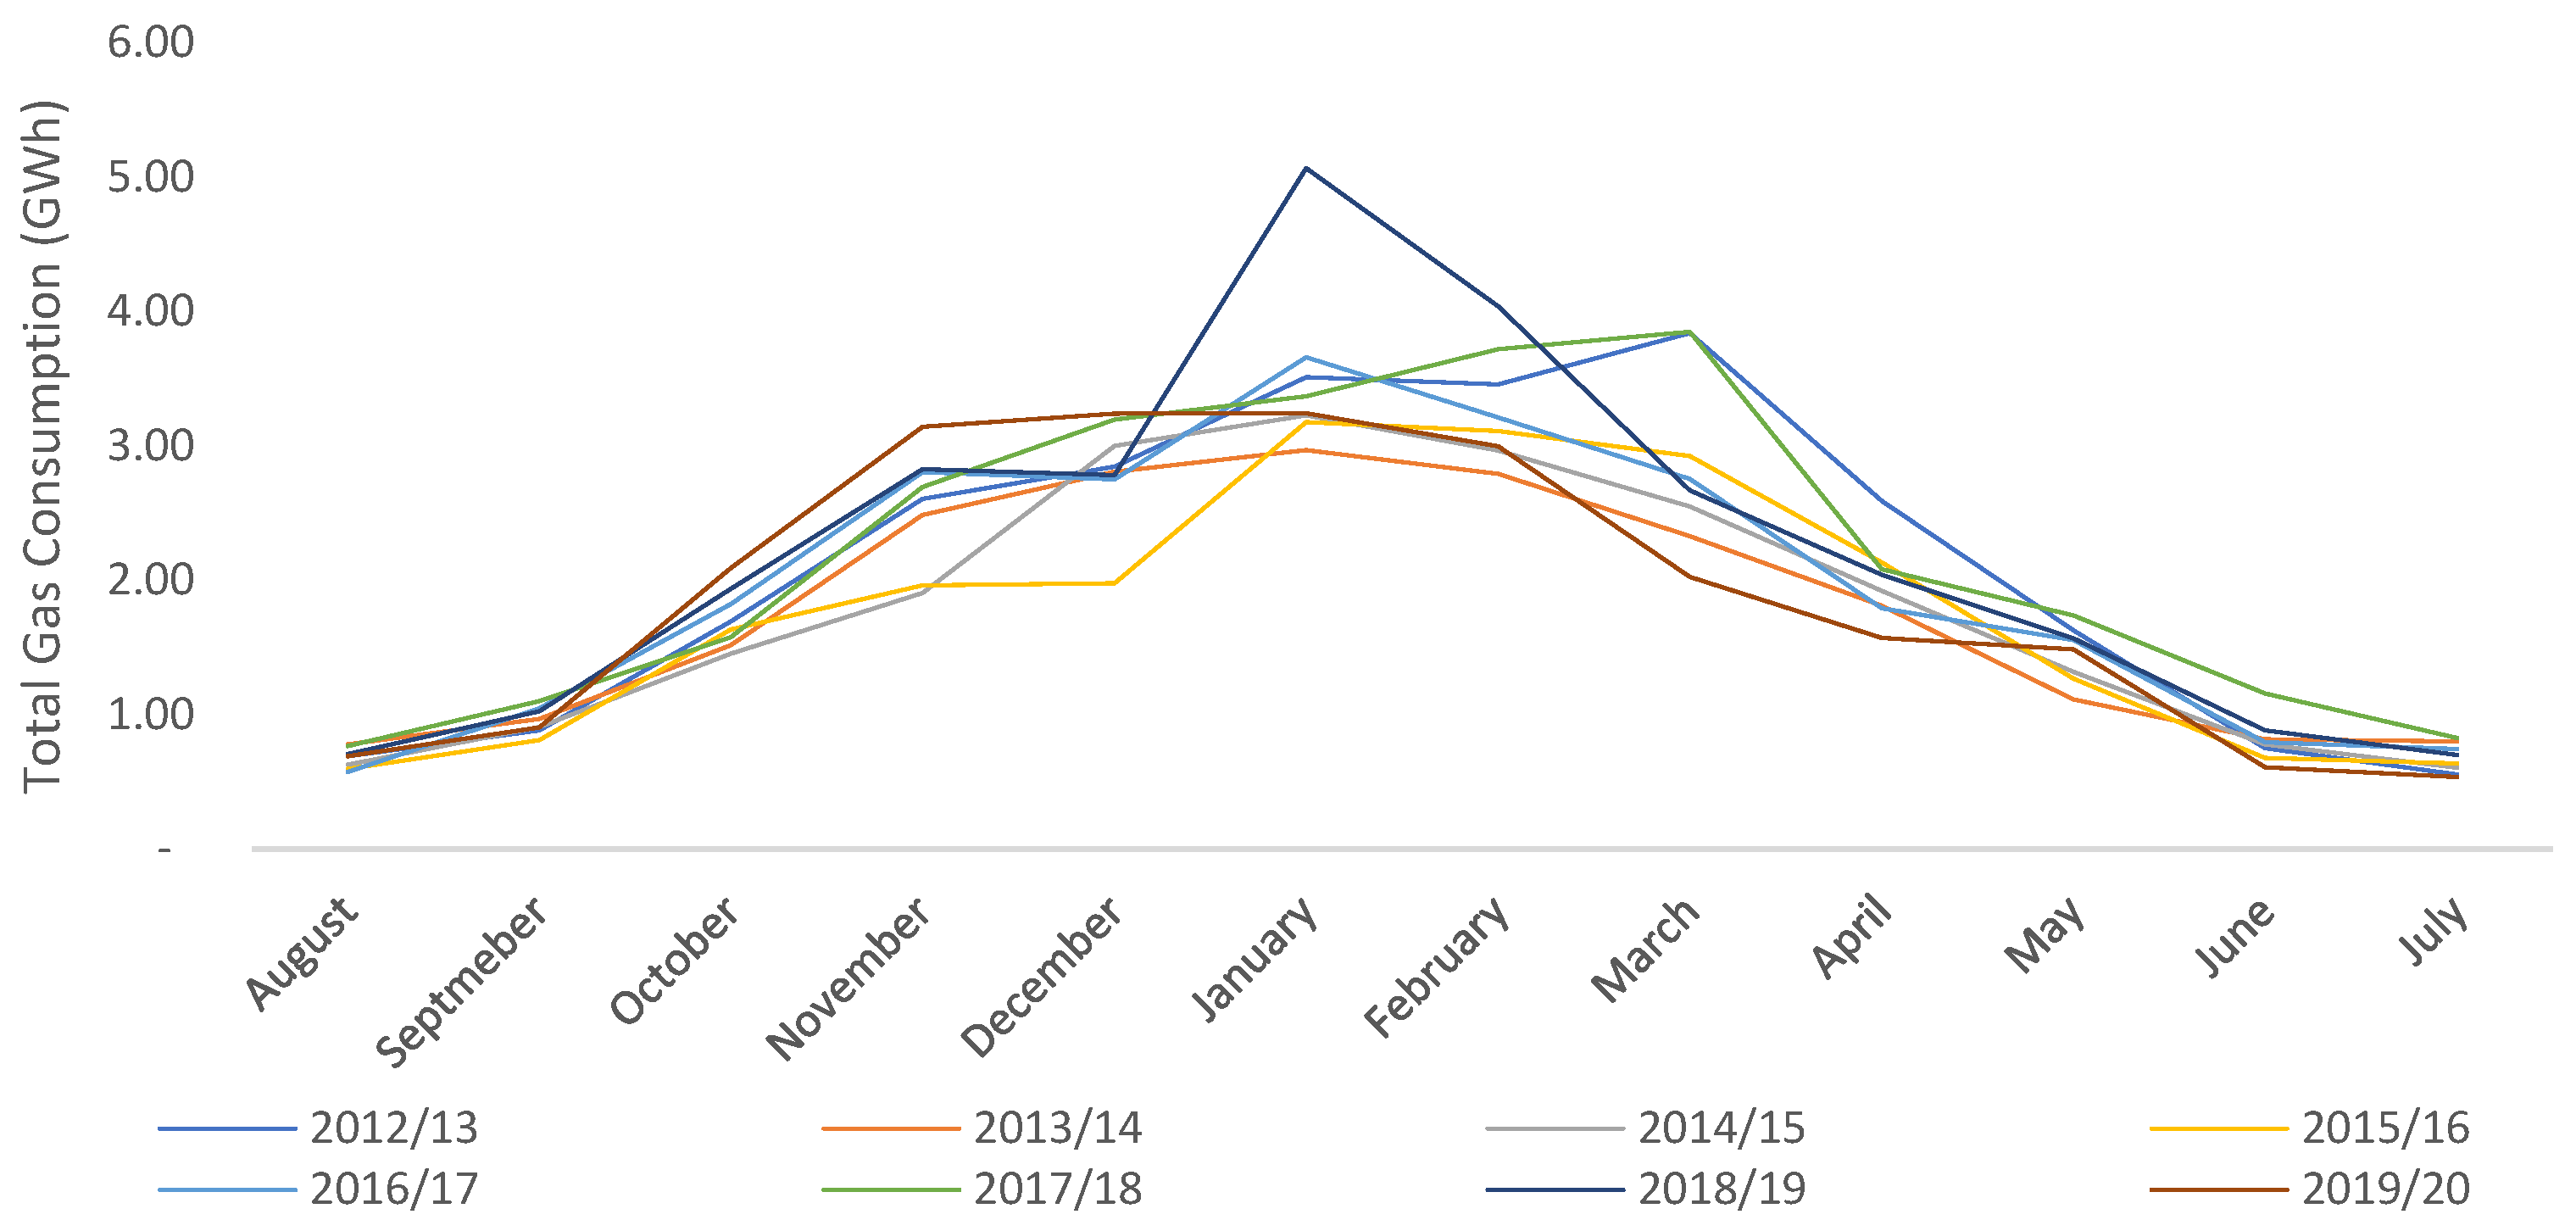
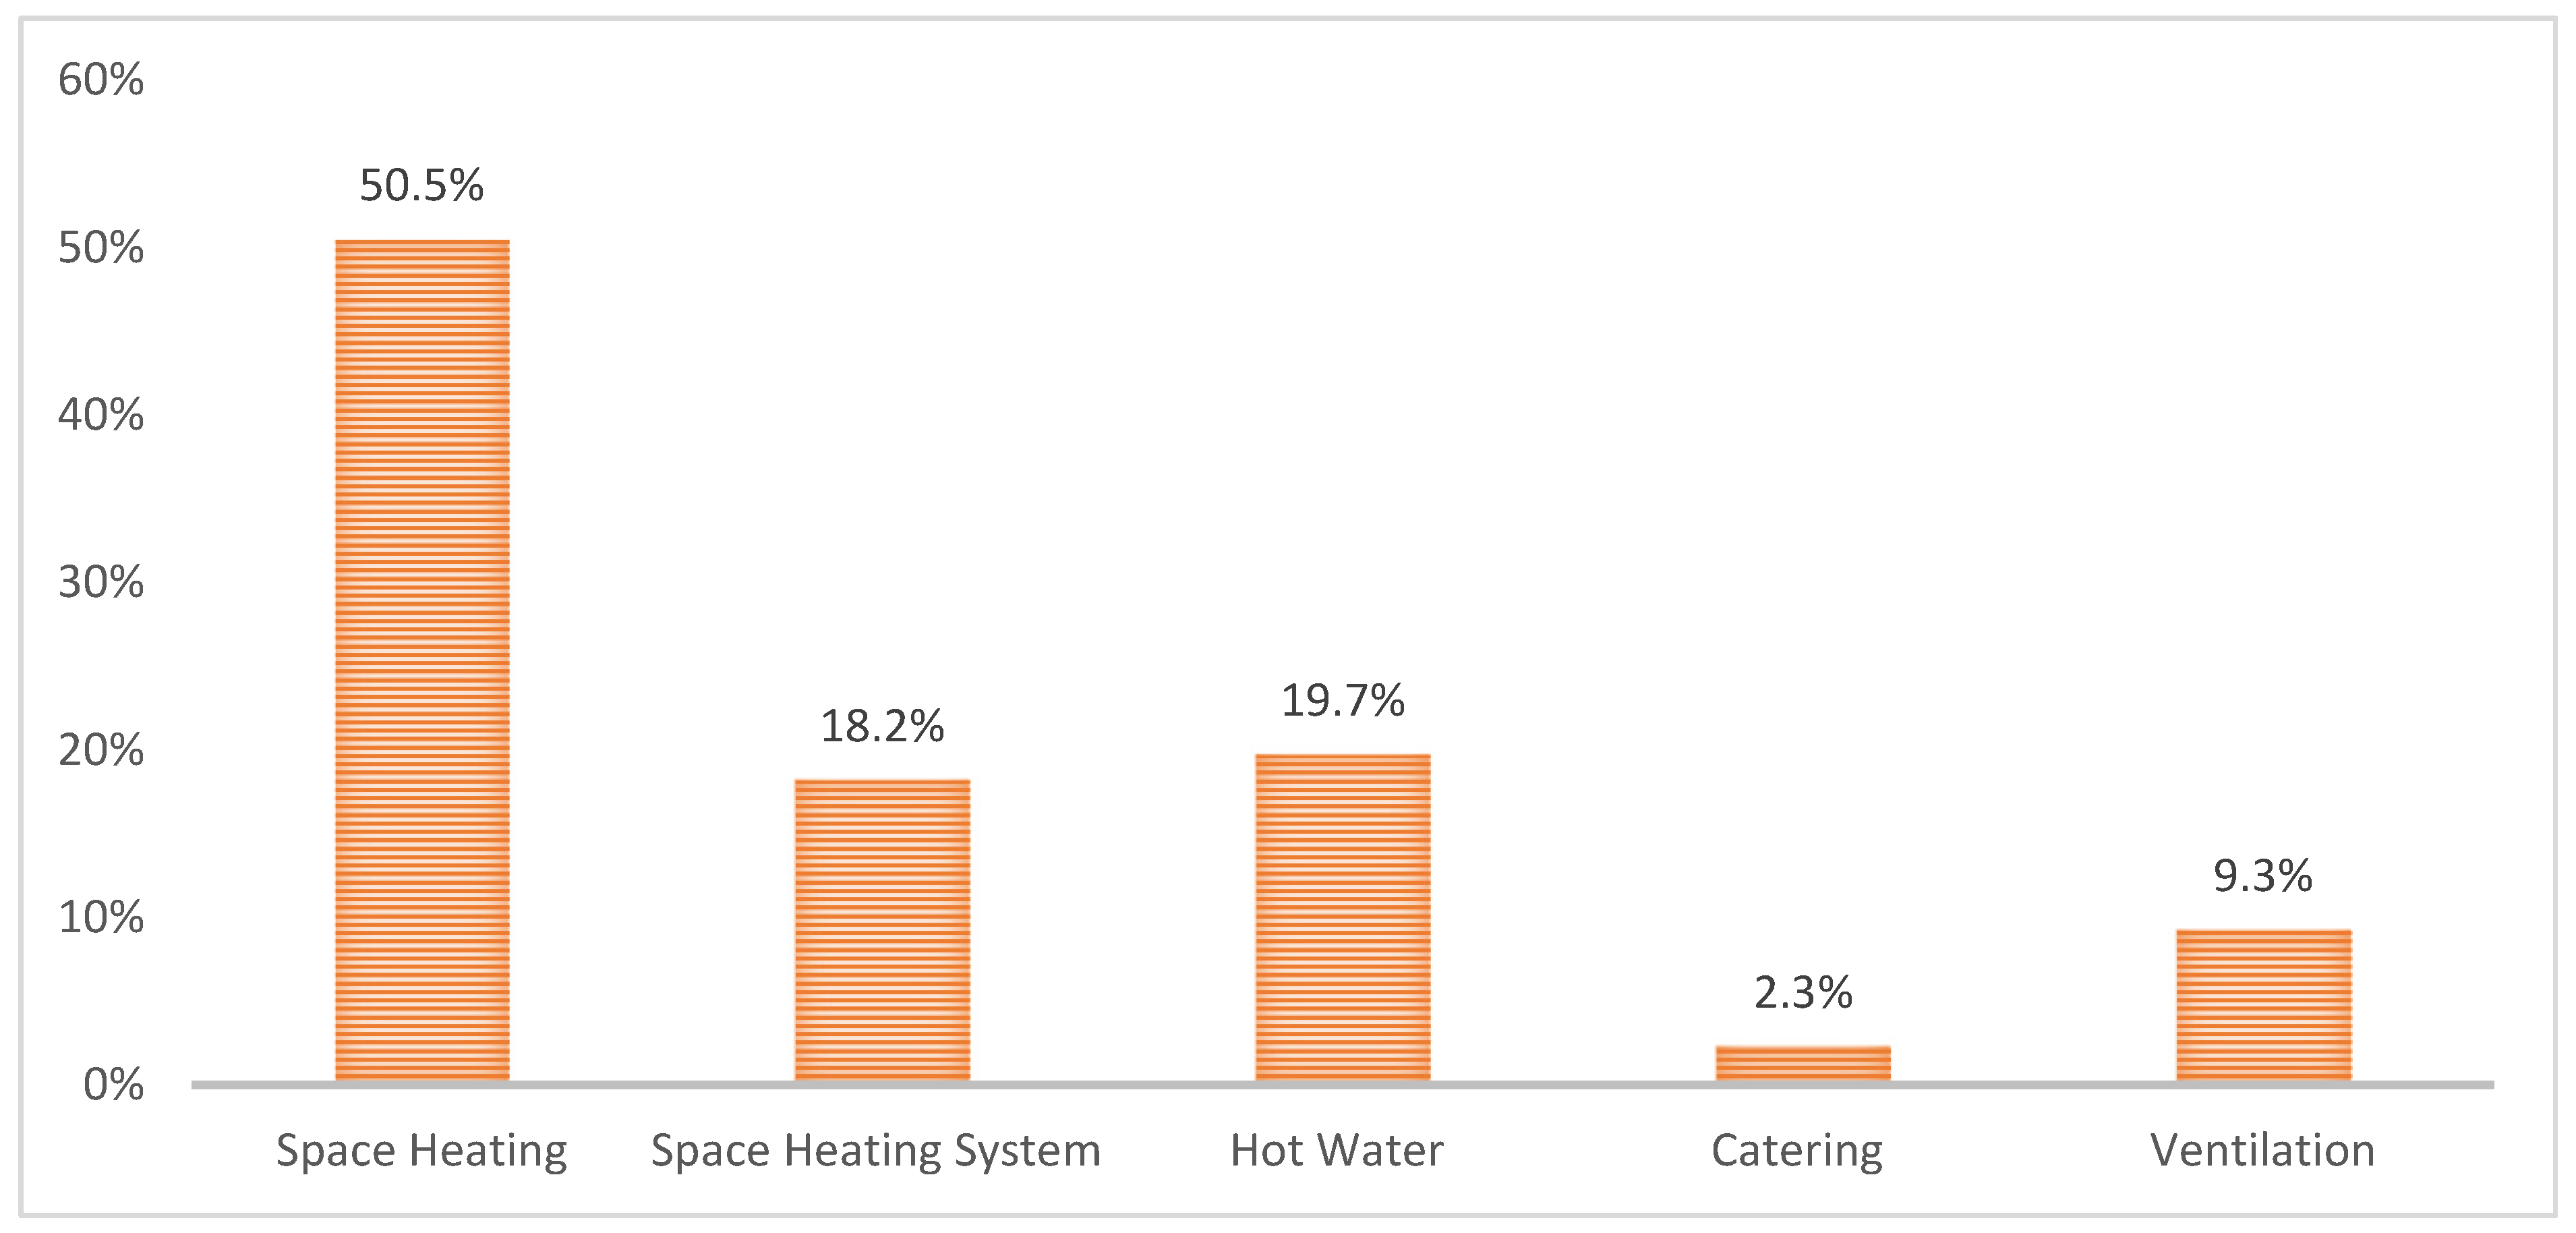
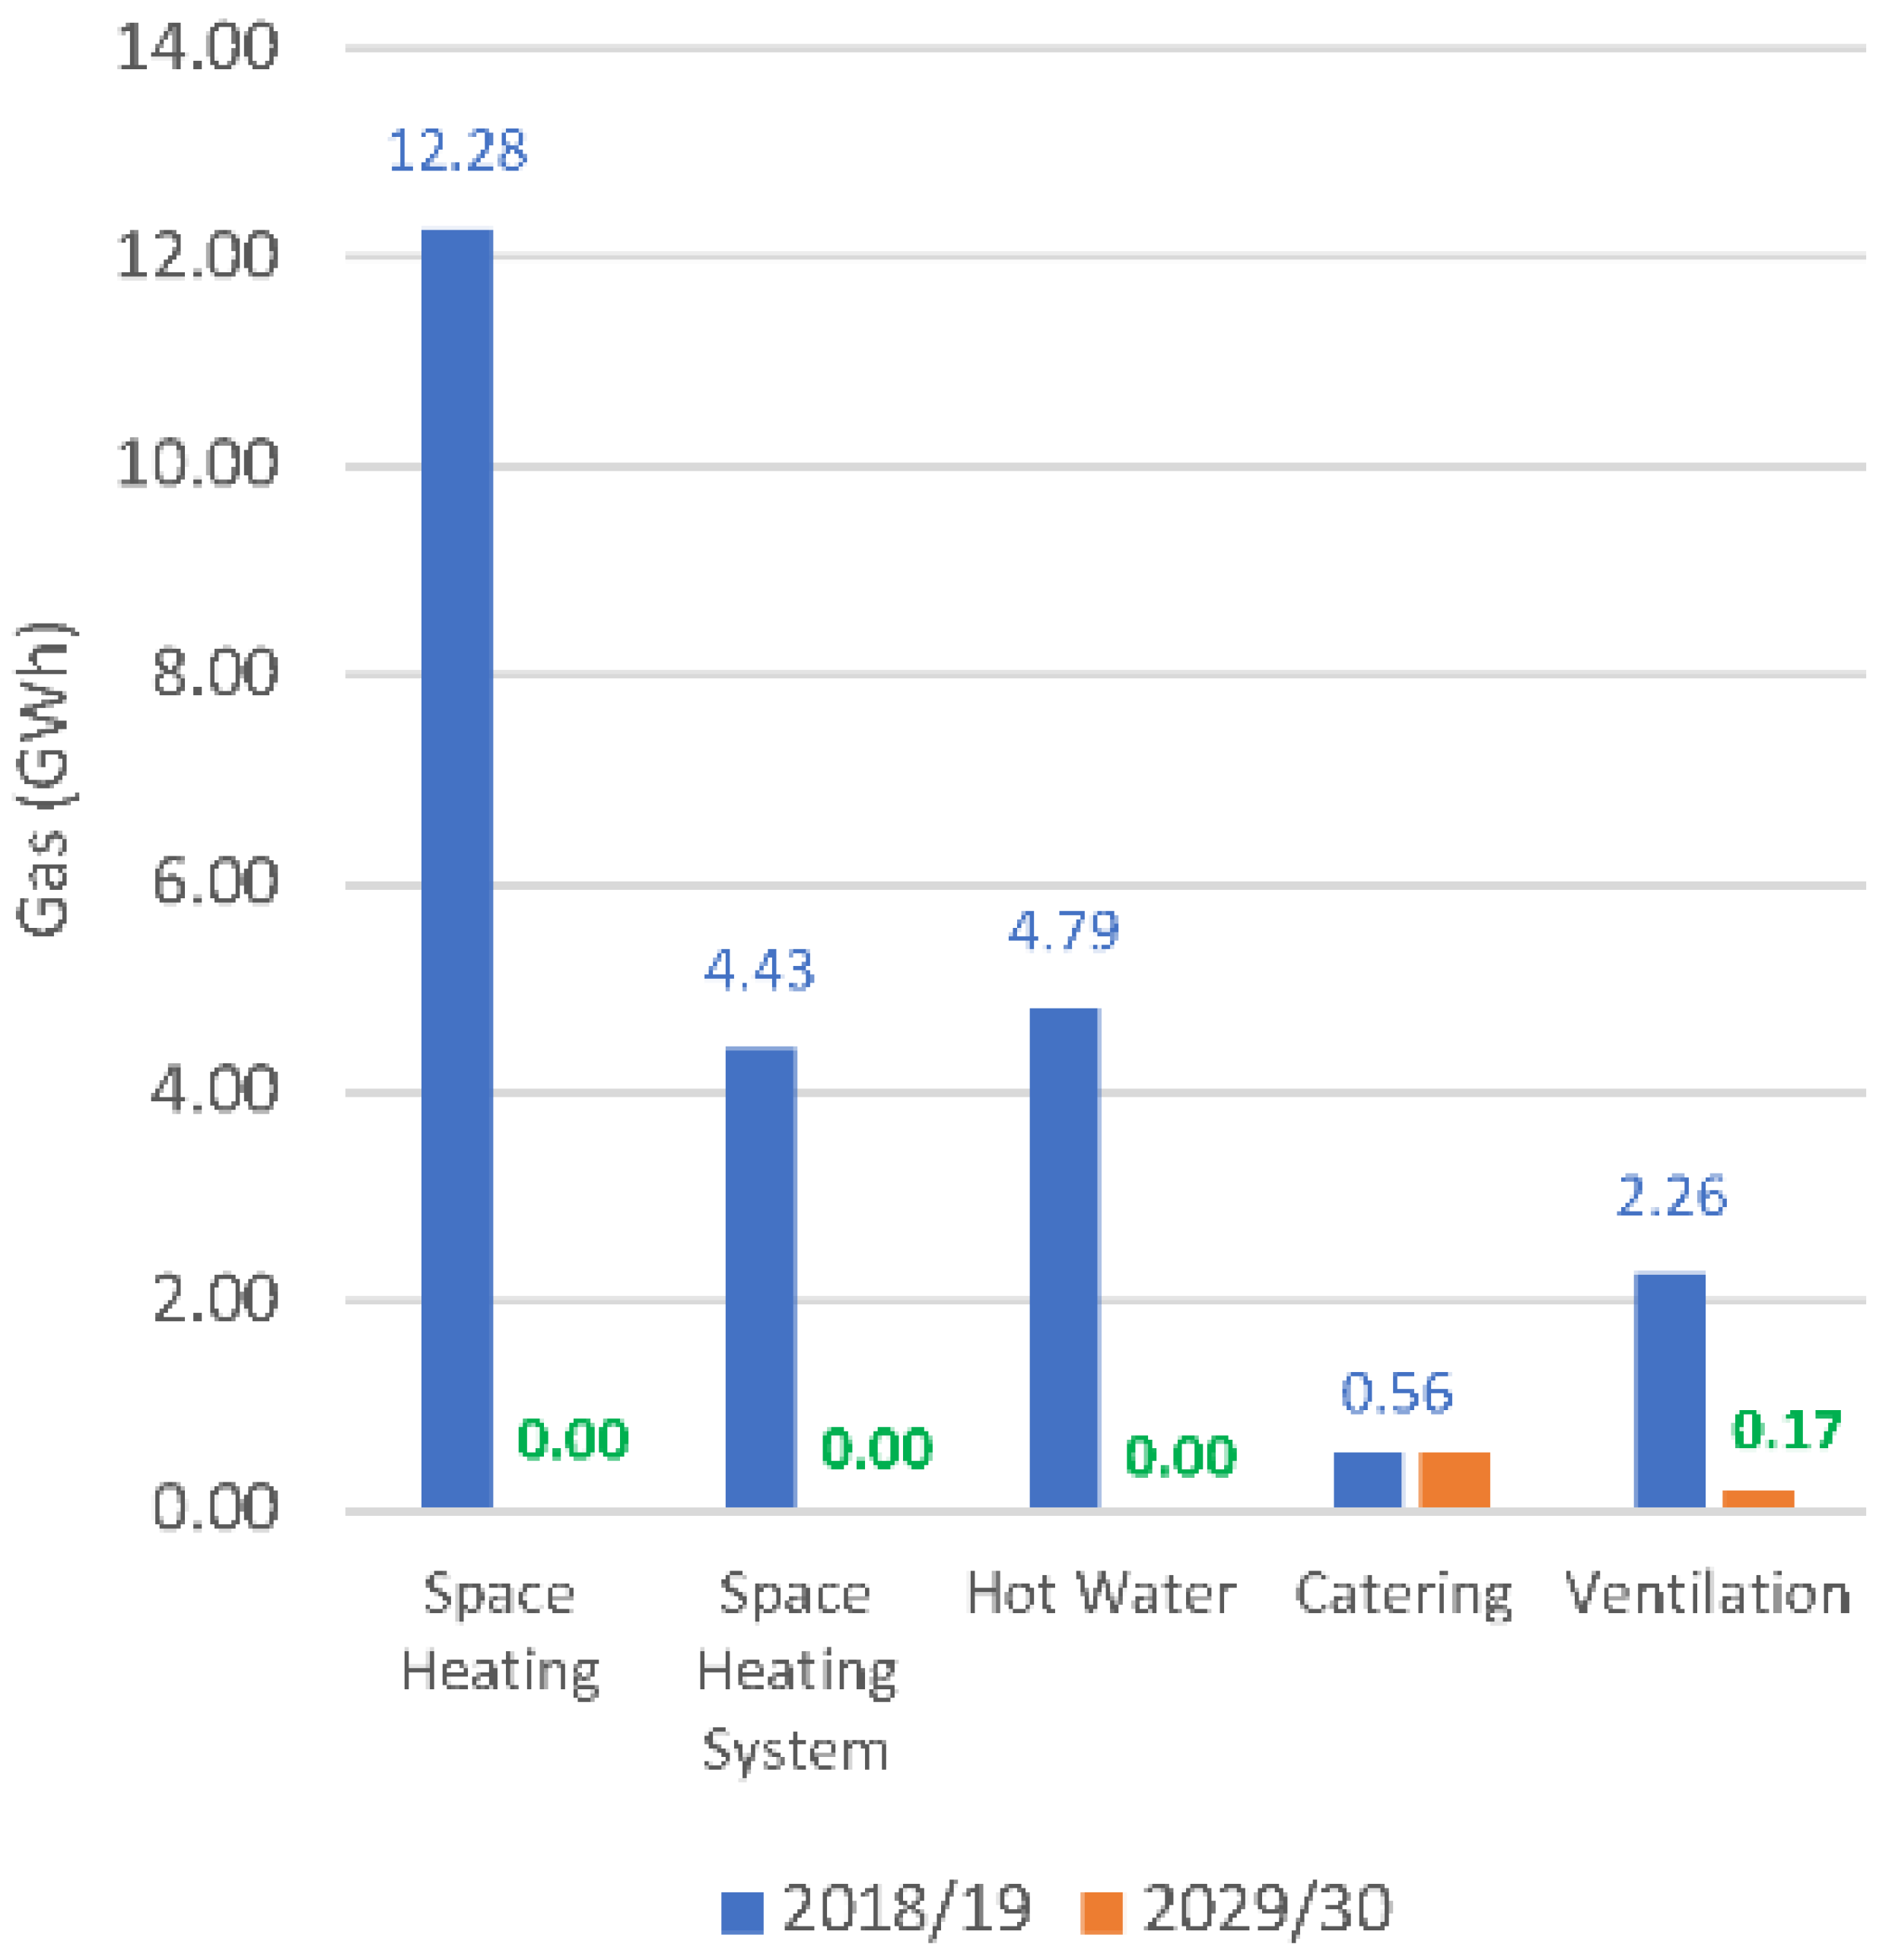
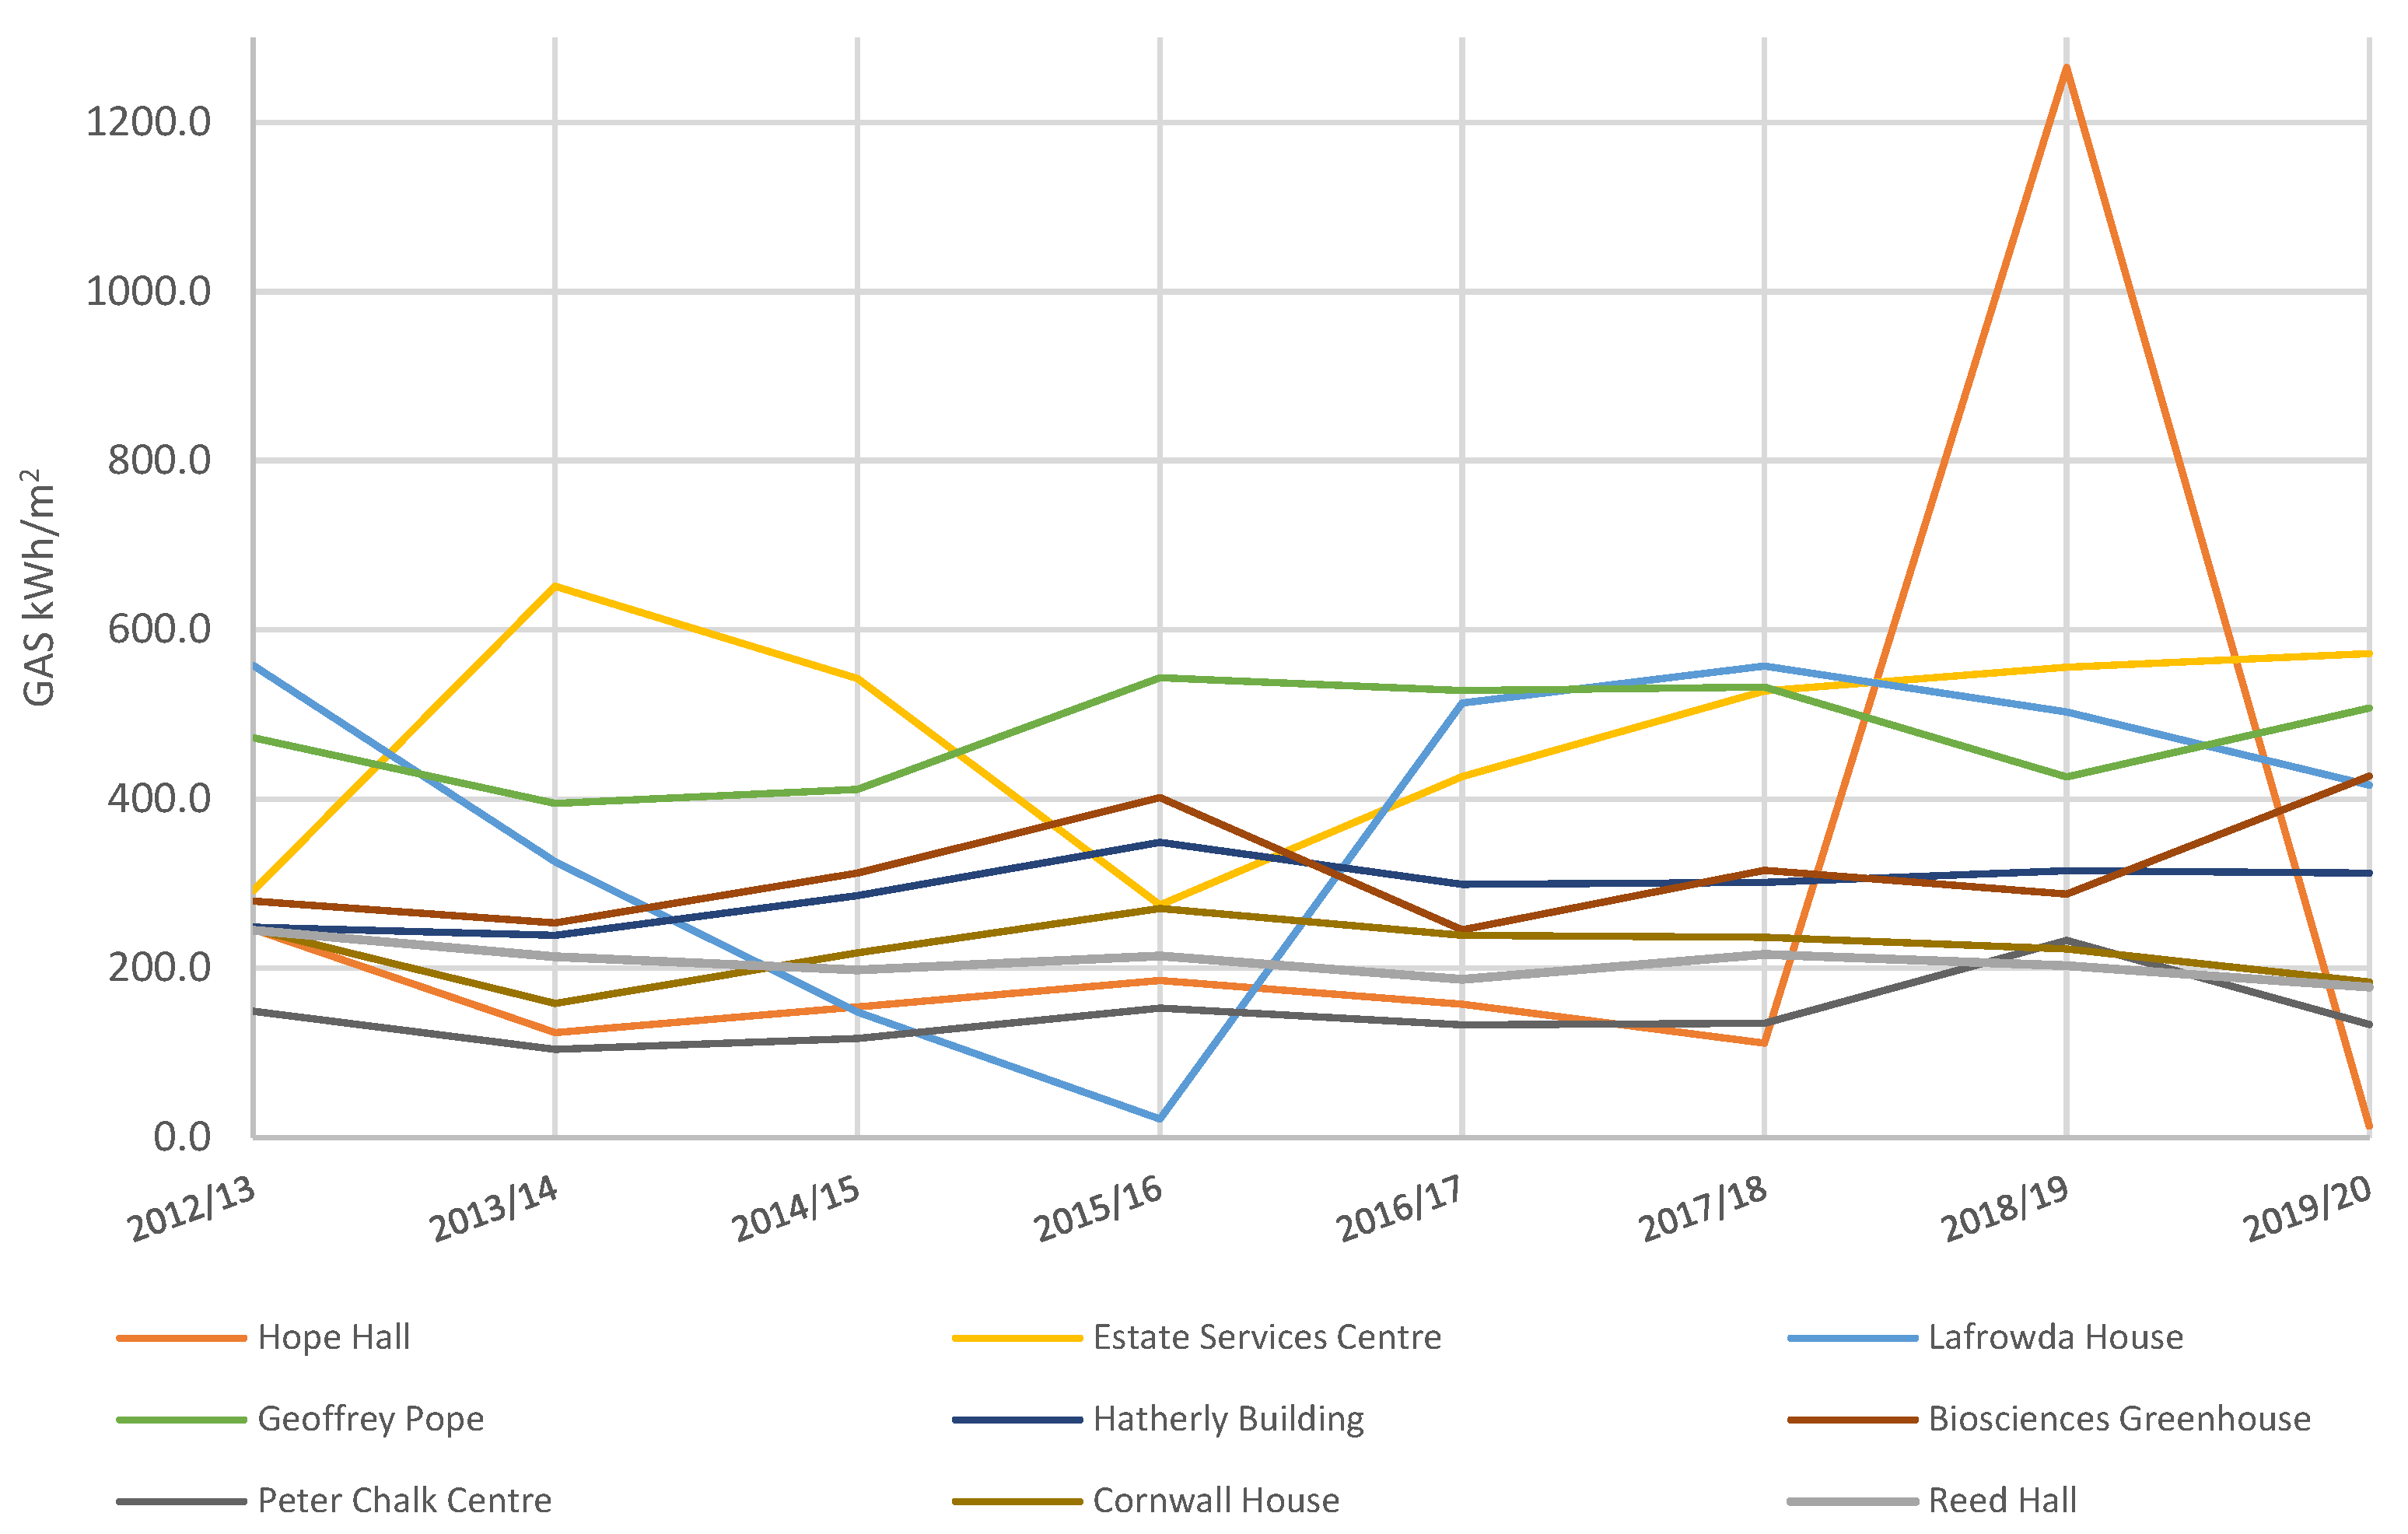
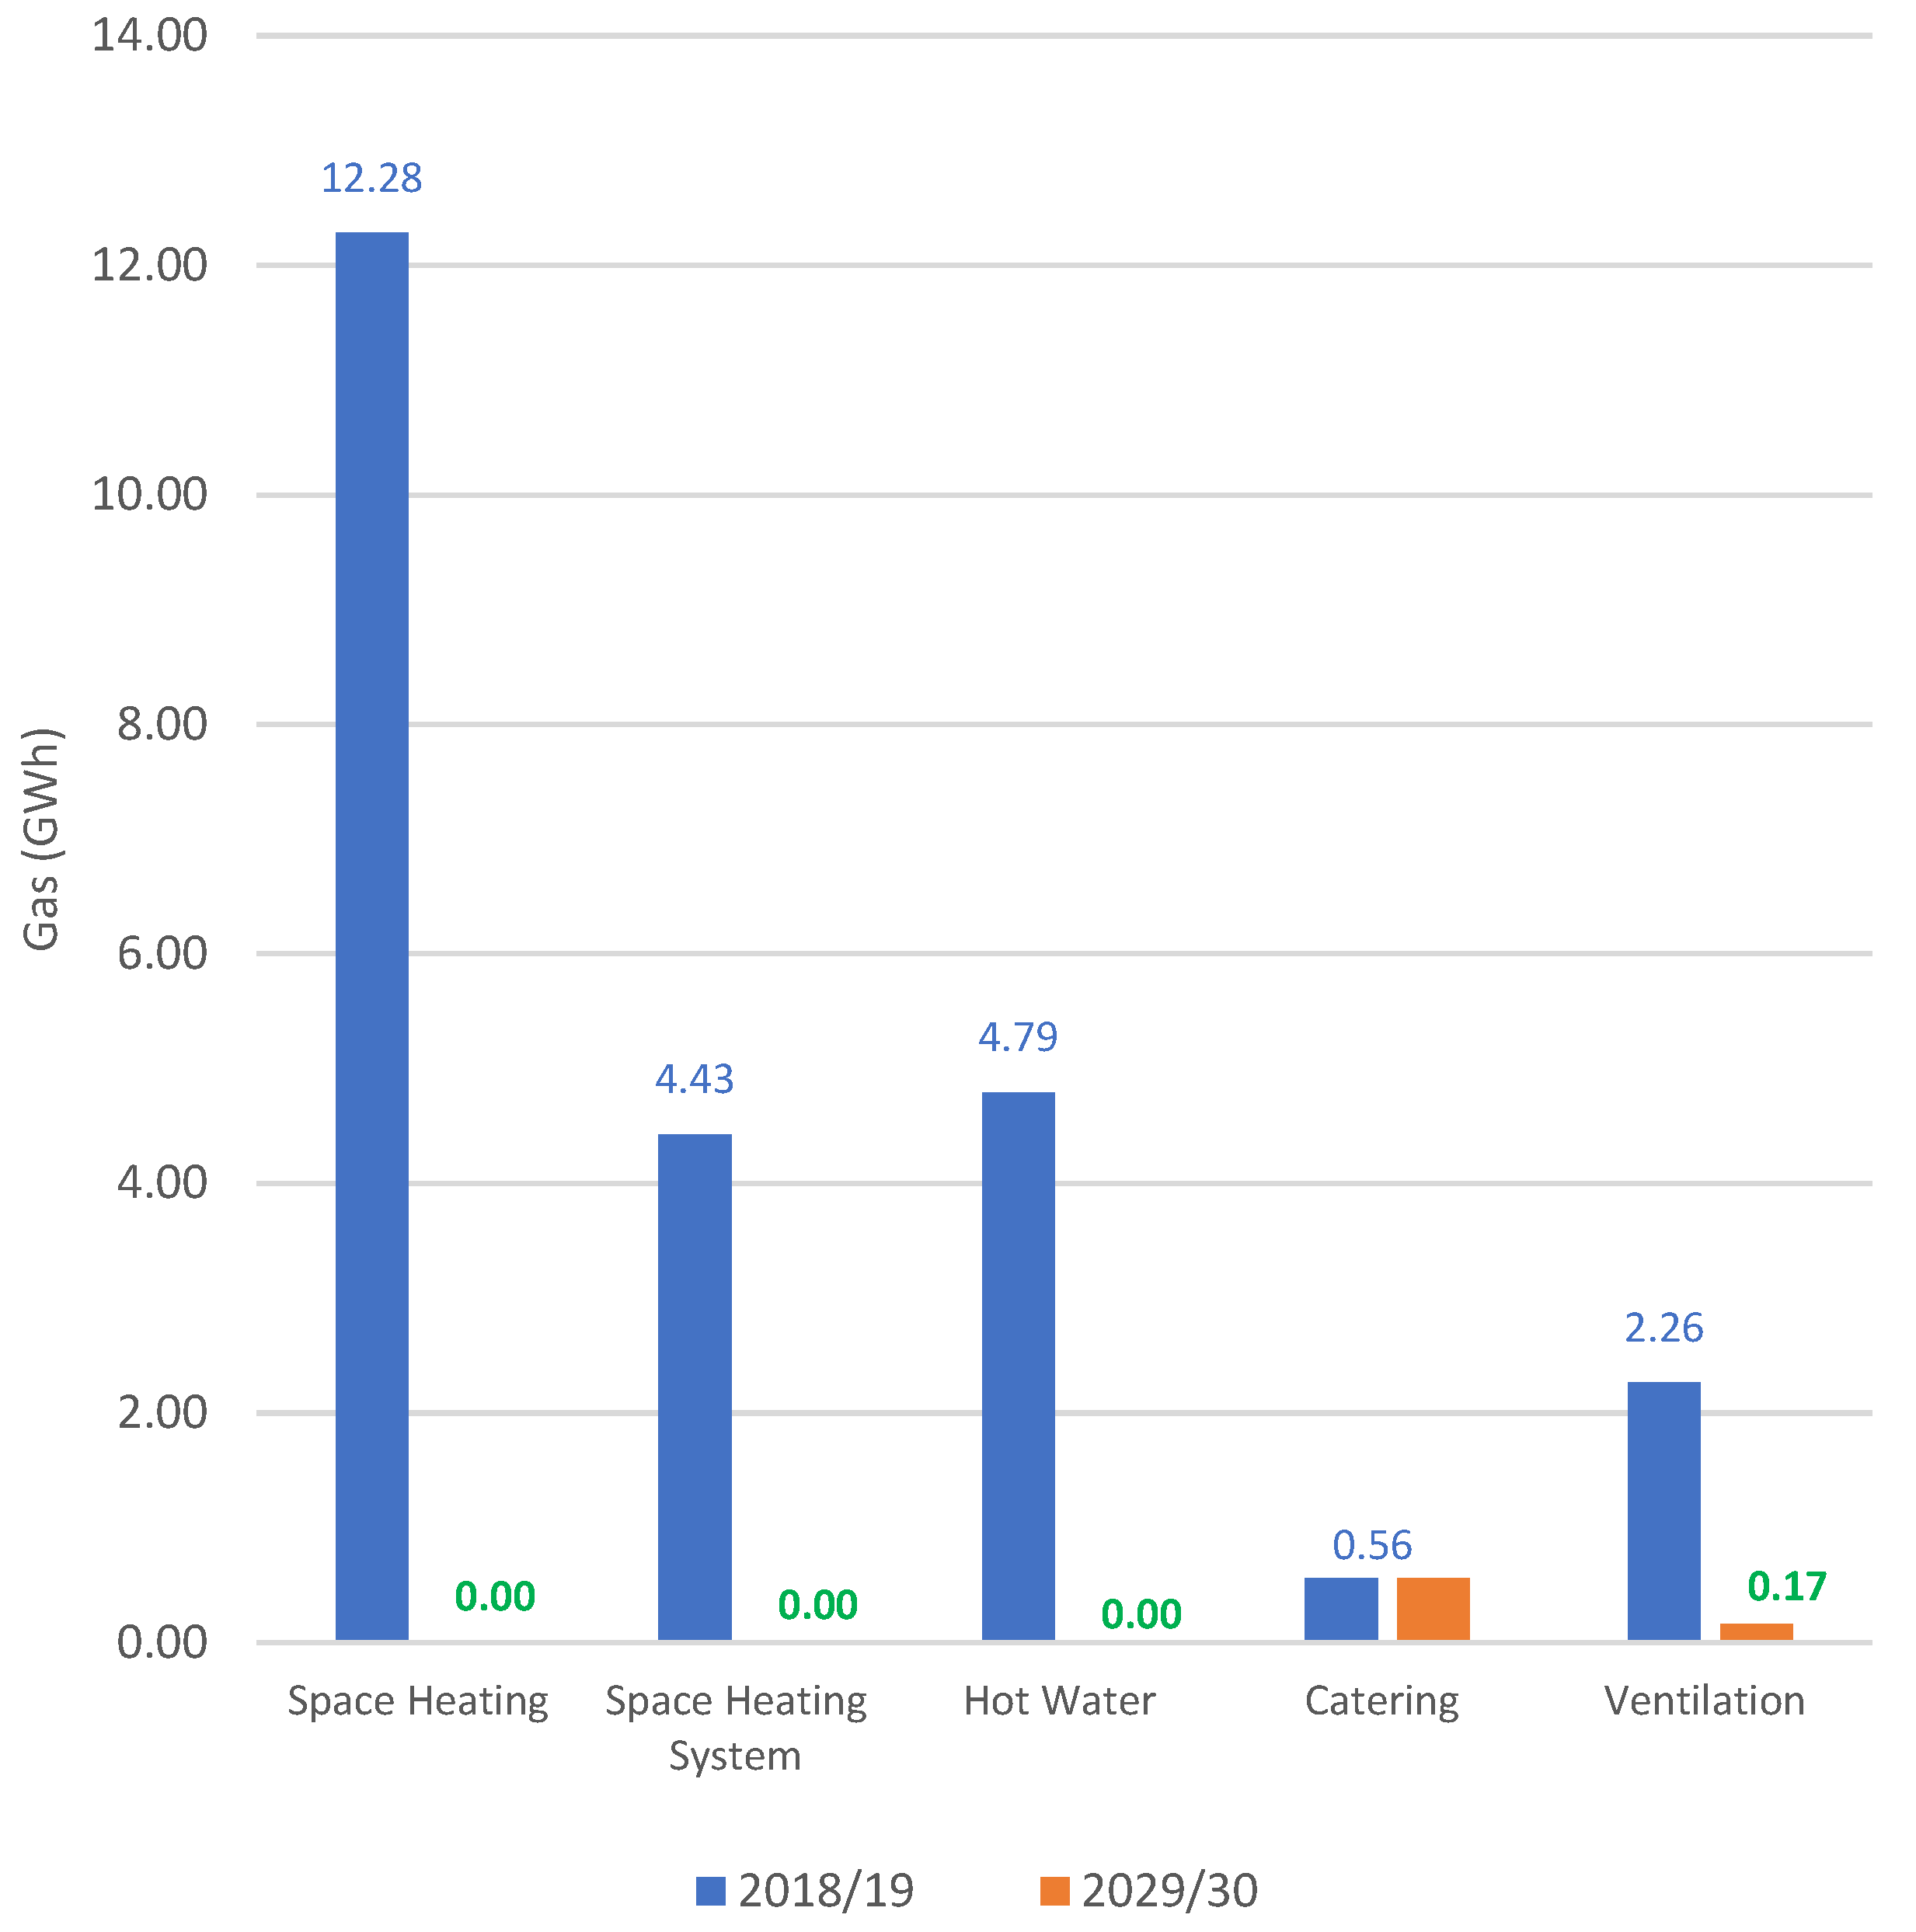
5.1.1. Heating/Hot Water
5.1.2. Ventilation
5.1.3. Vehicle Fleet Changes
5.1.4. Oil
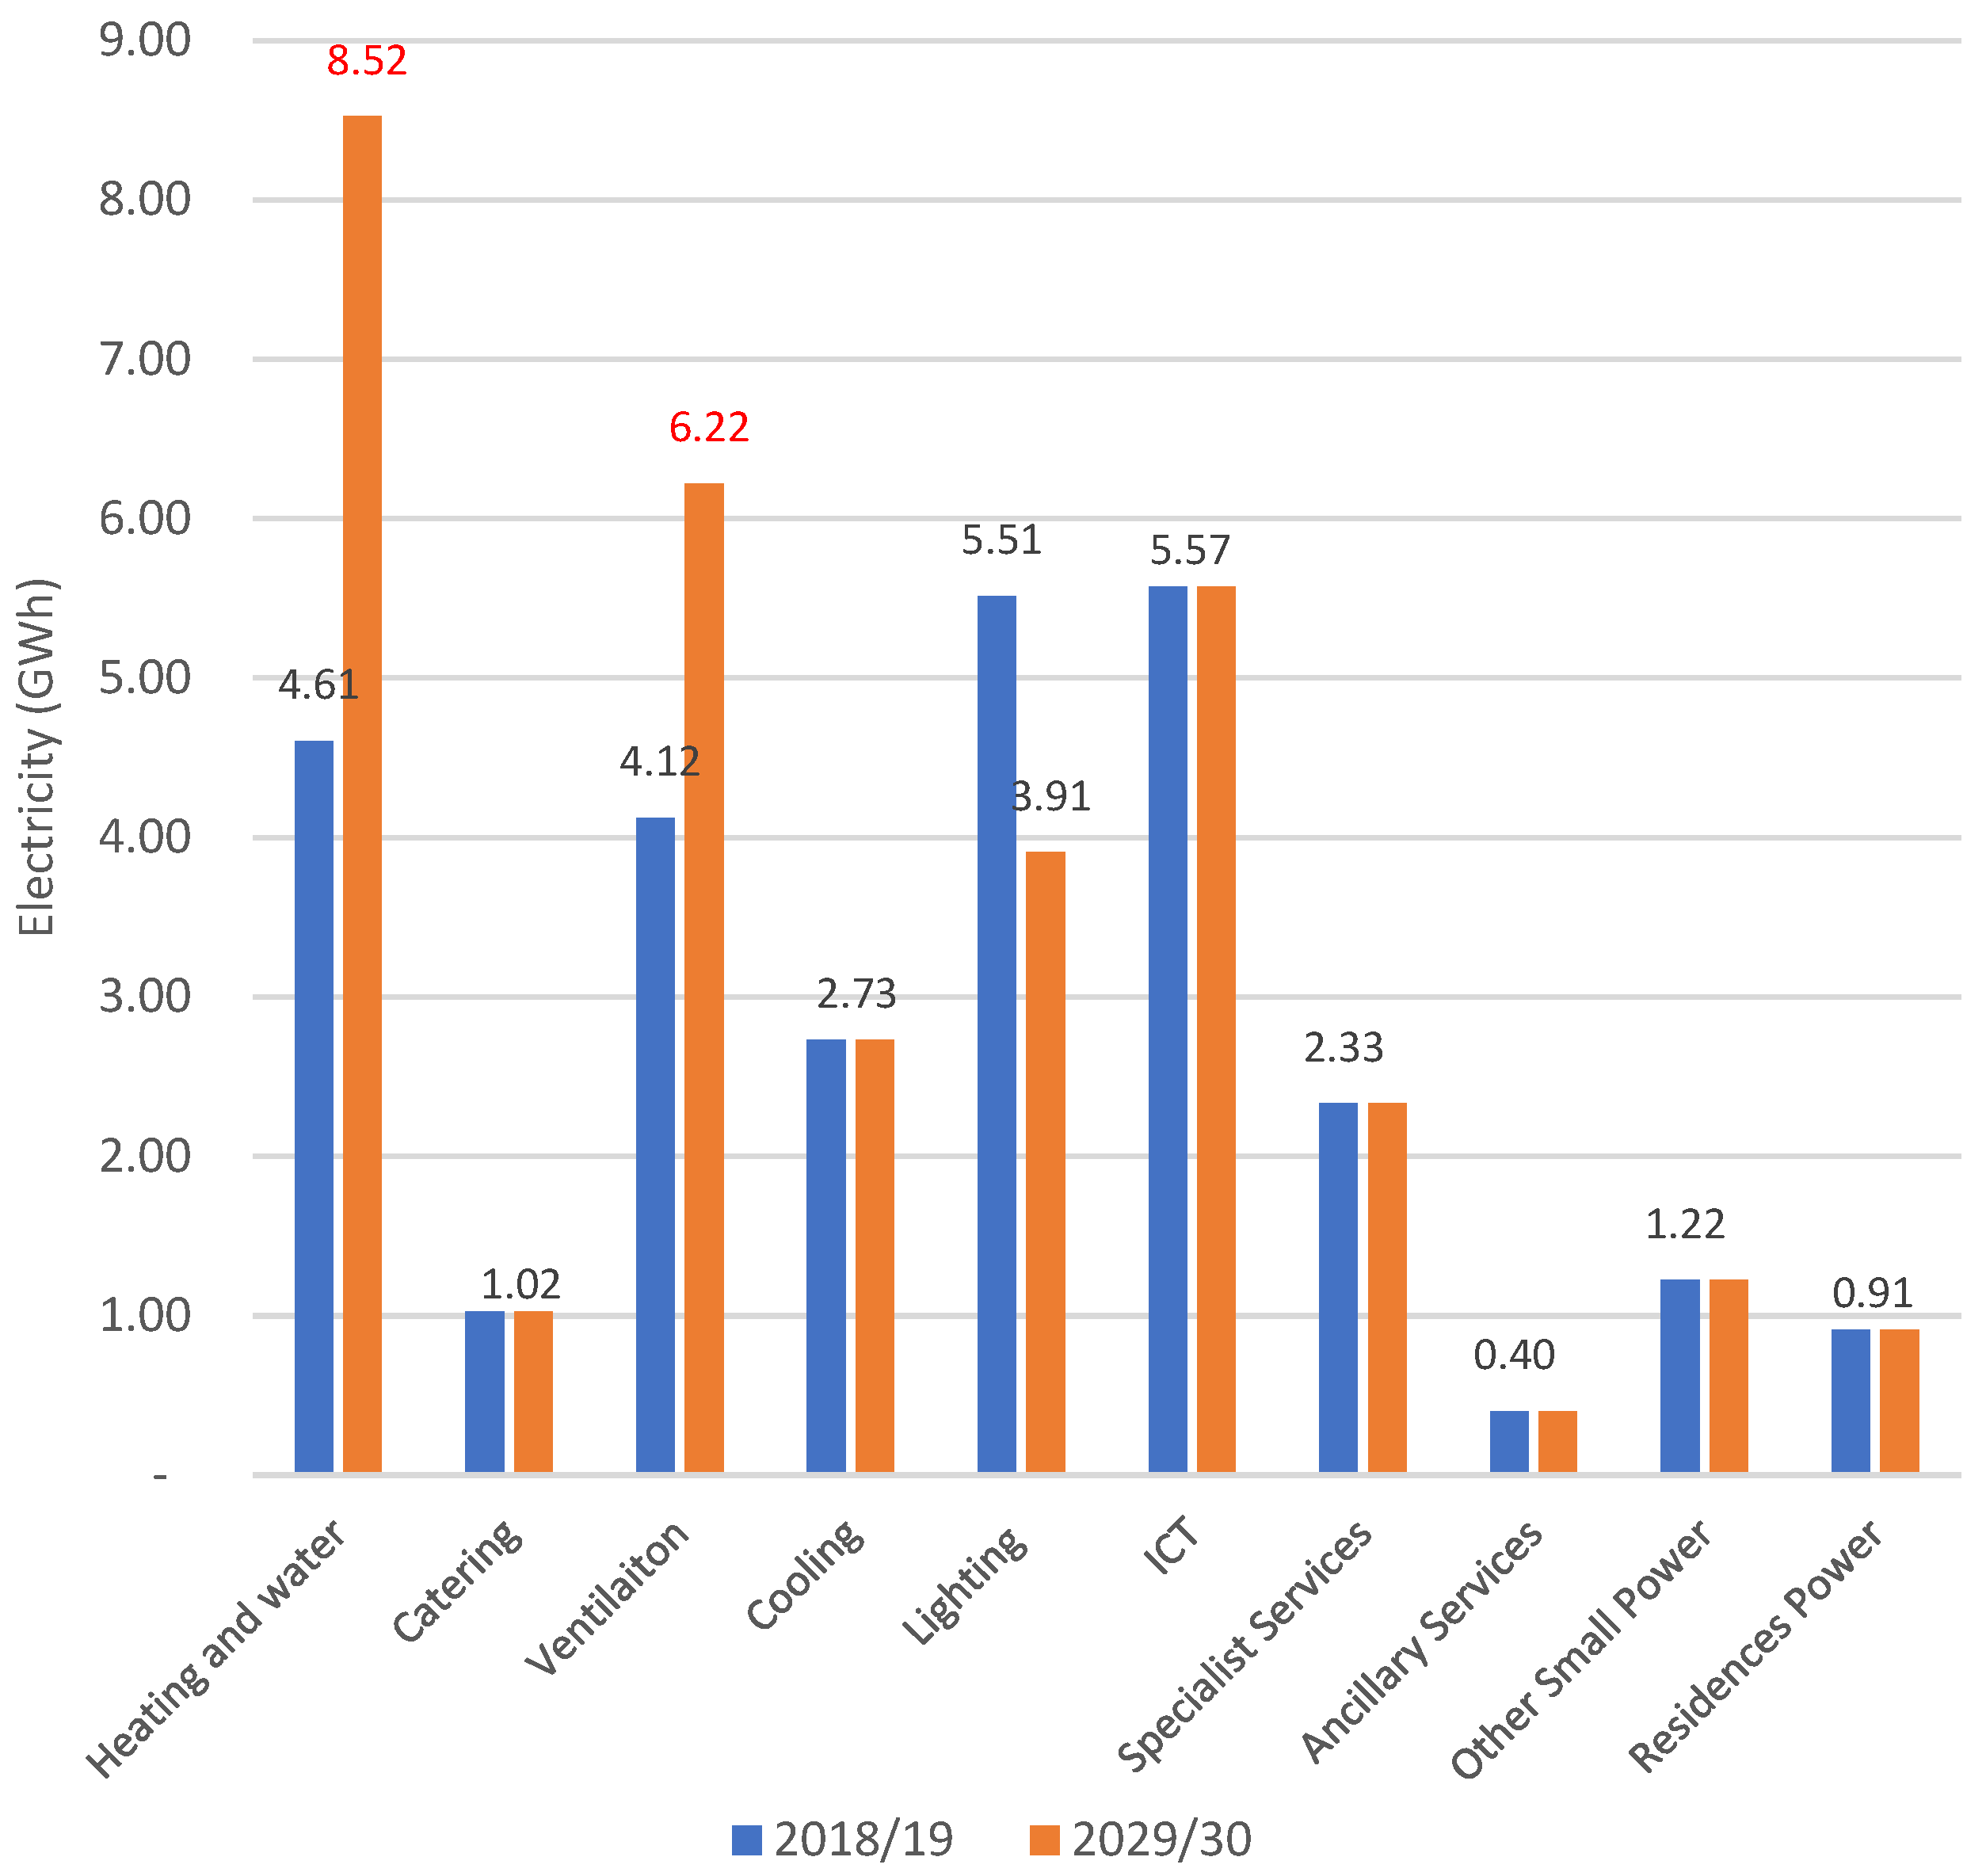
5.2. Scope 2
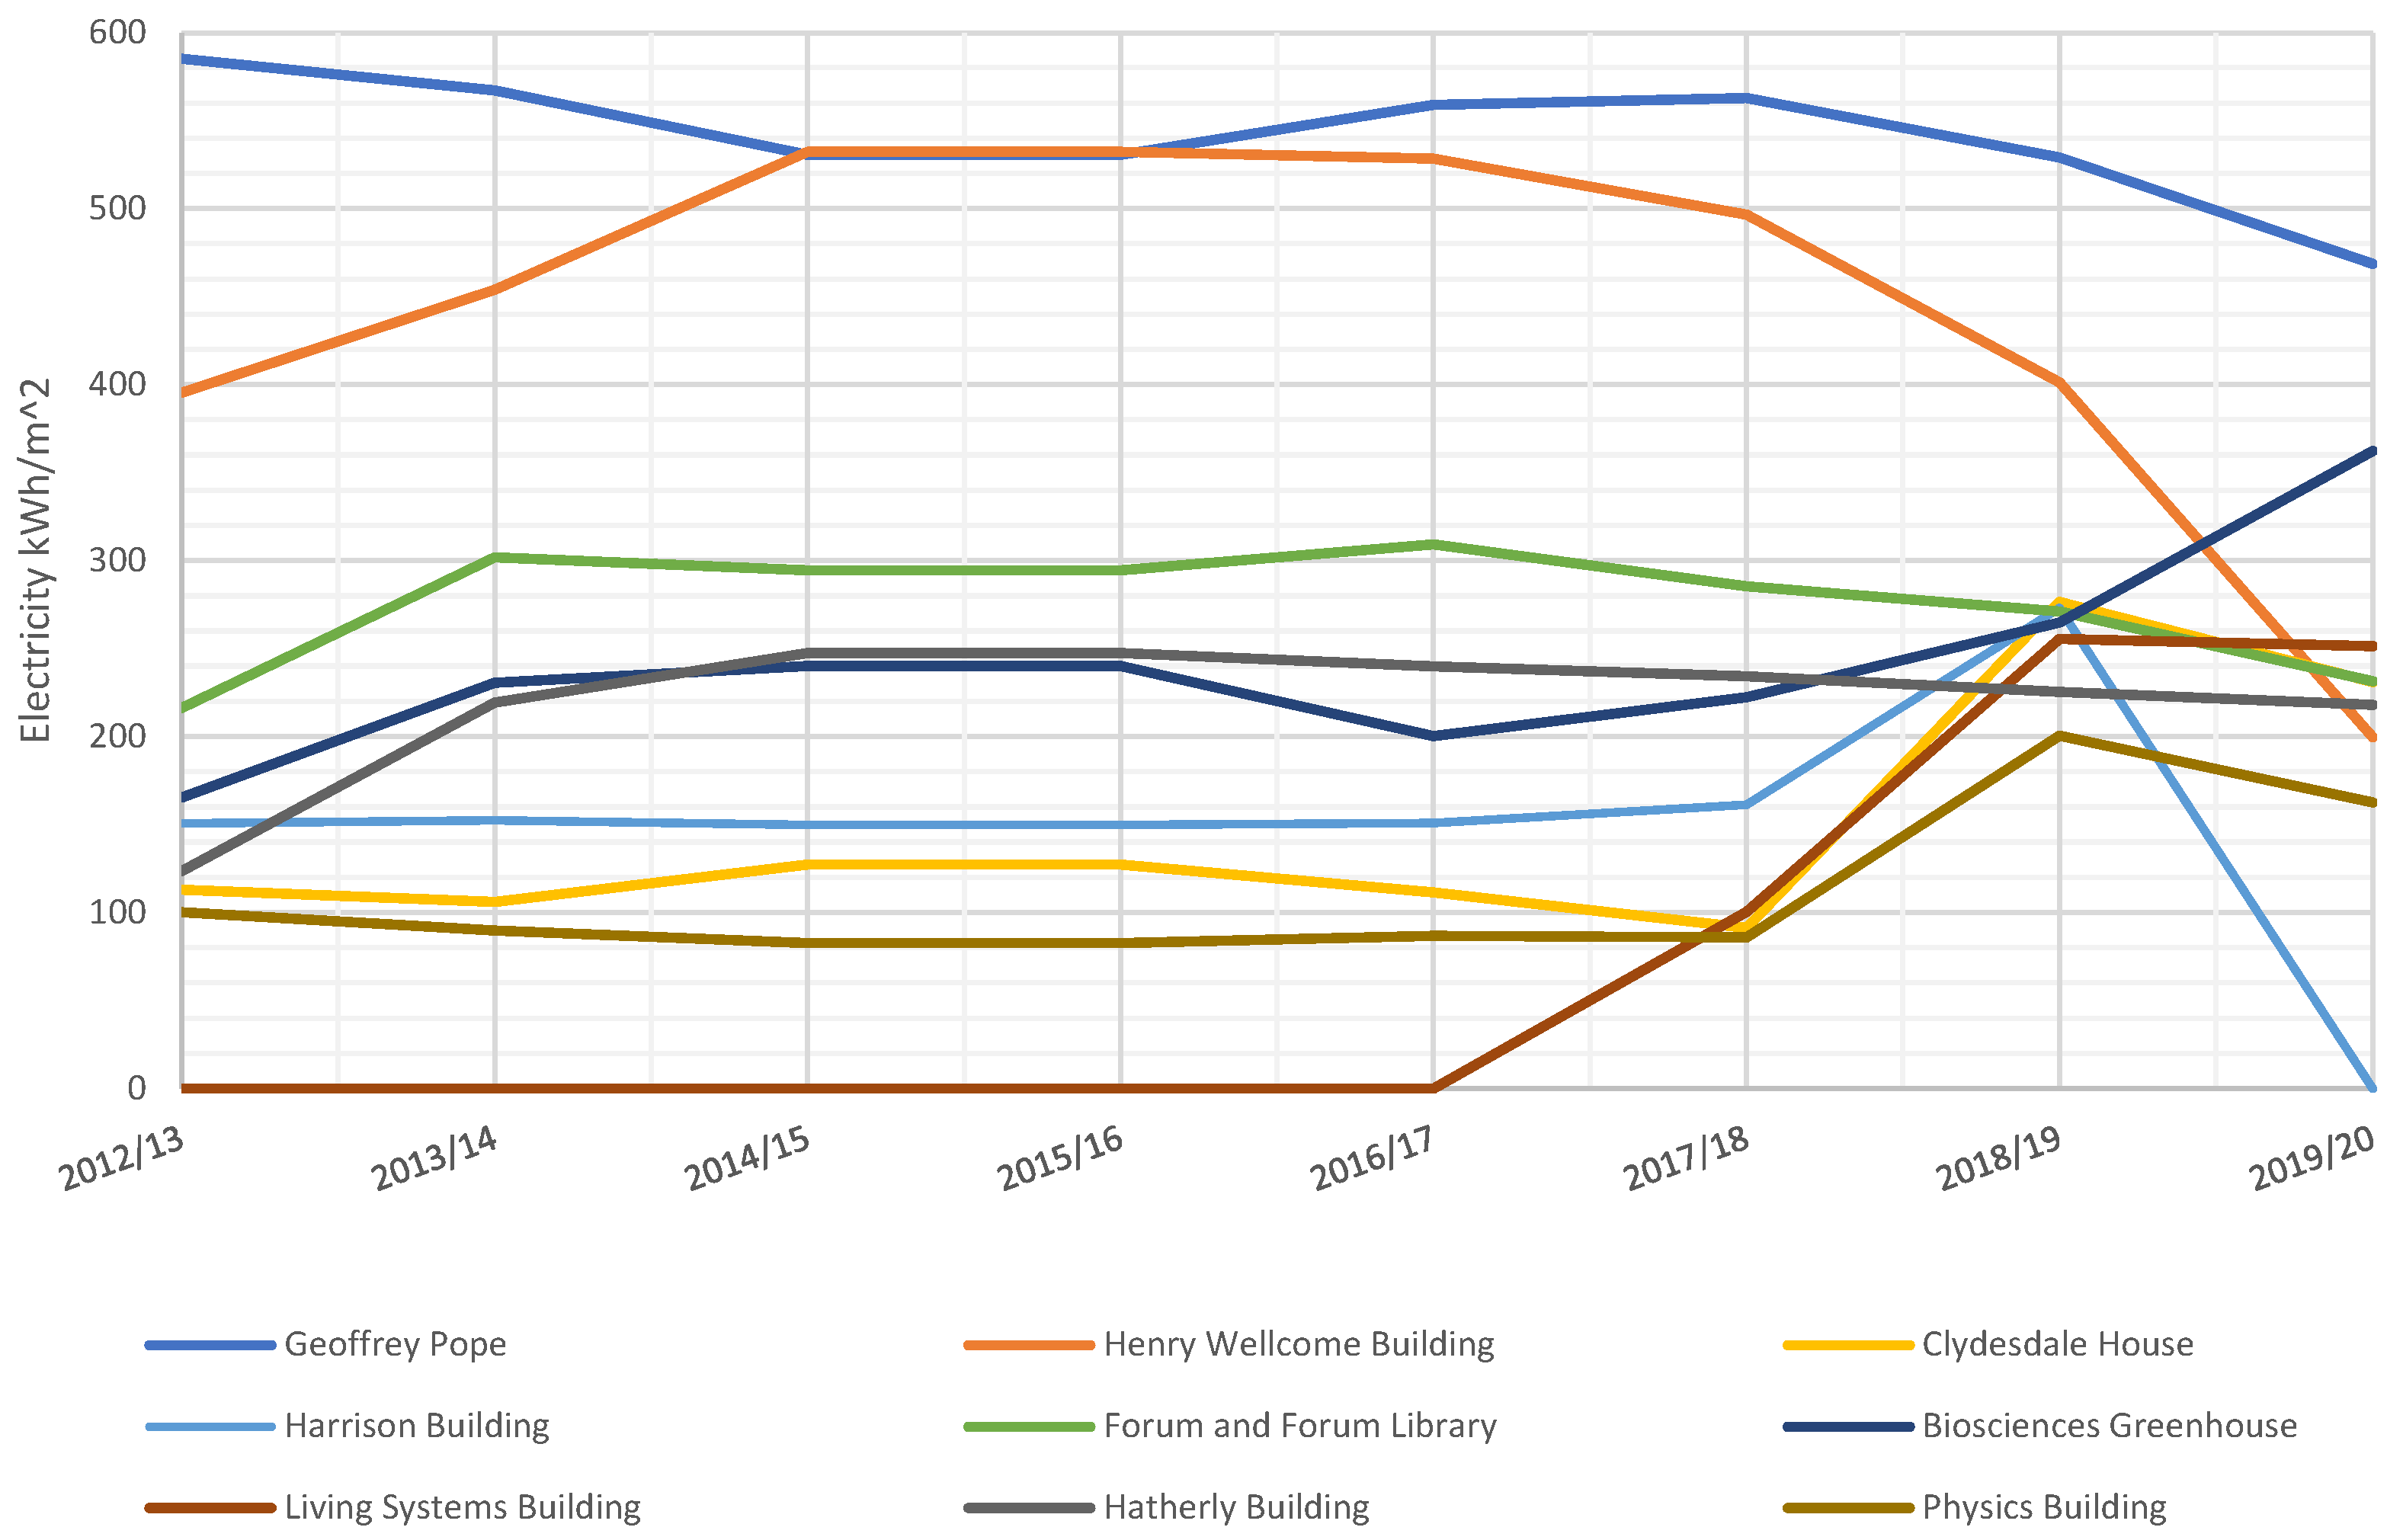
5.2.1. Heating
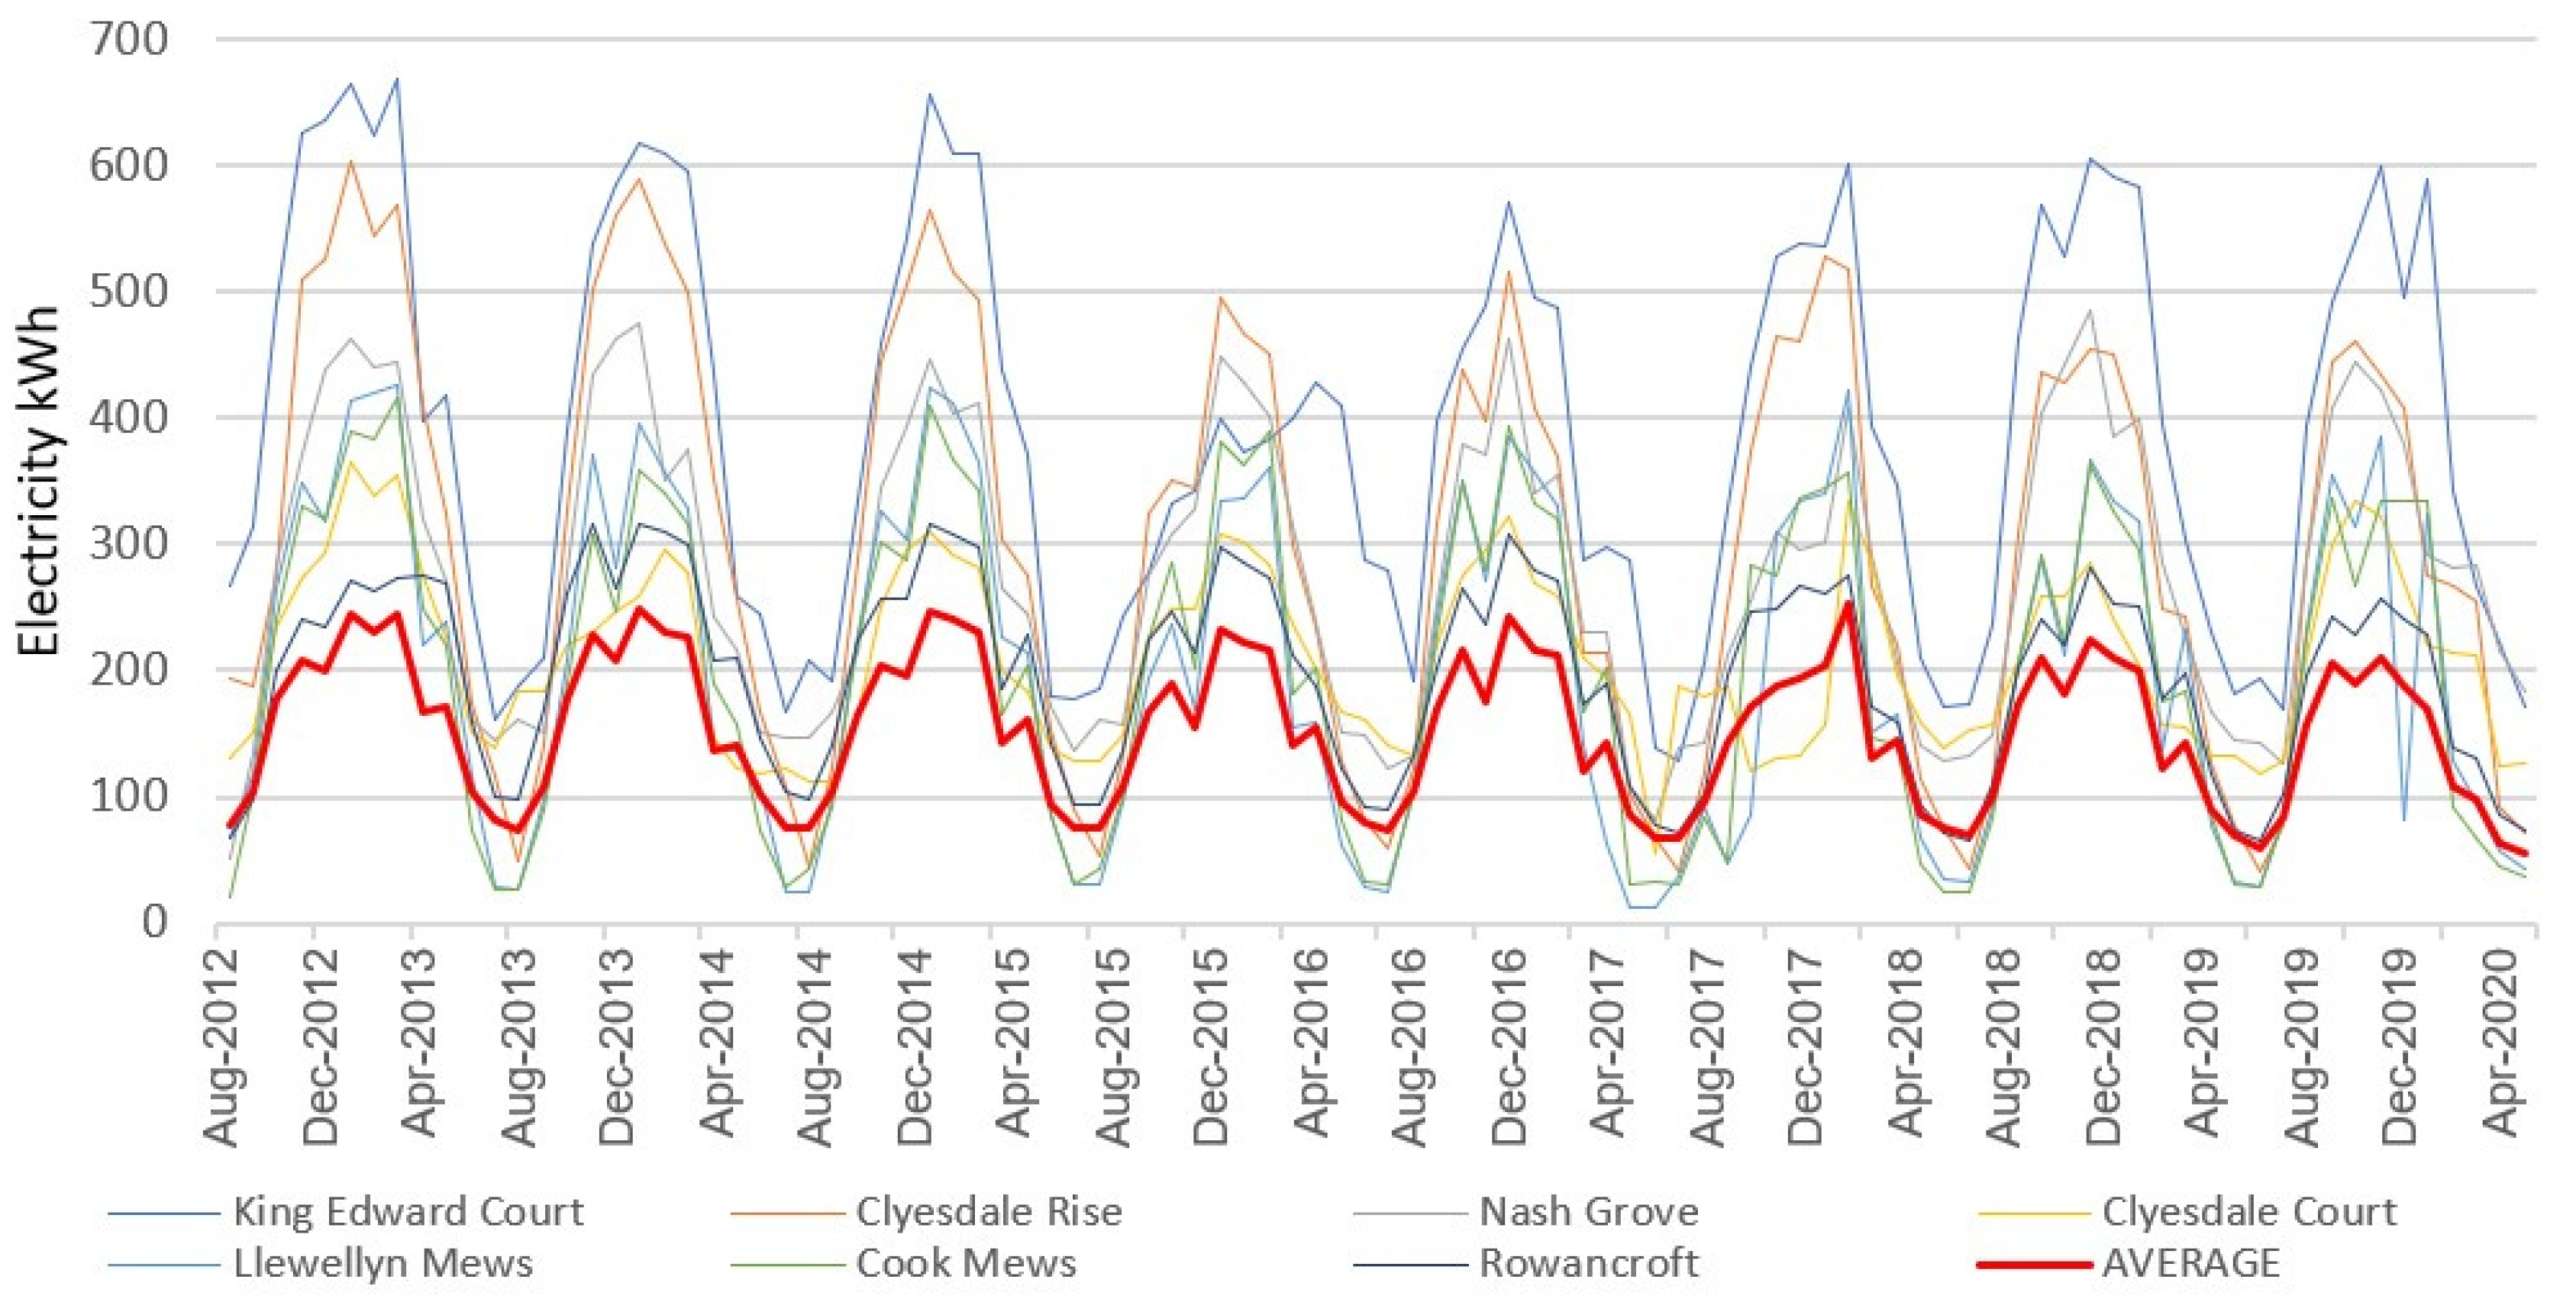
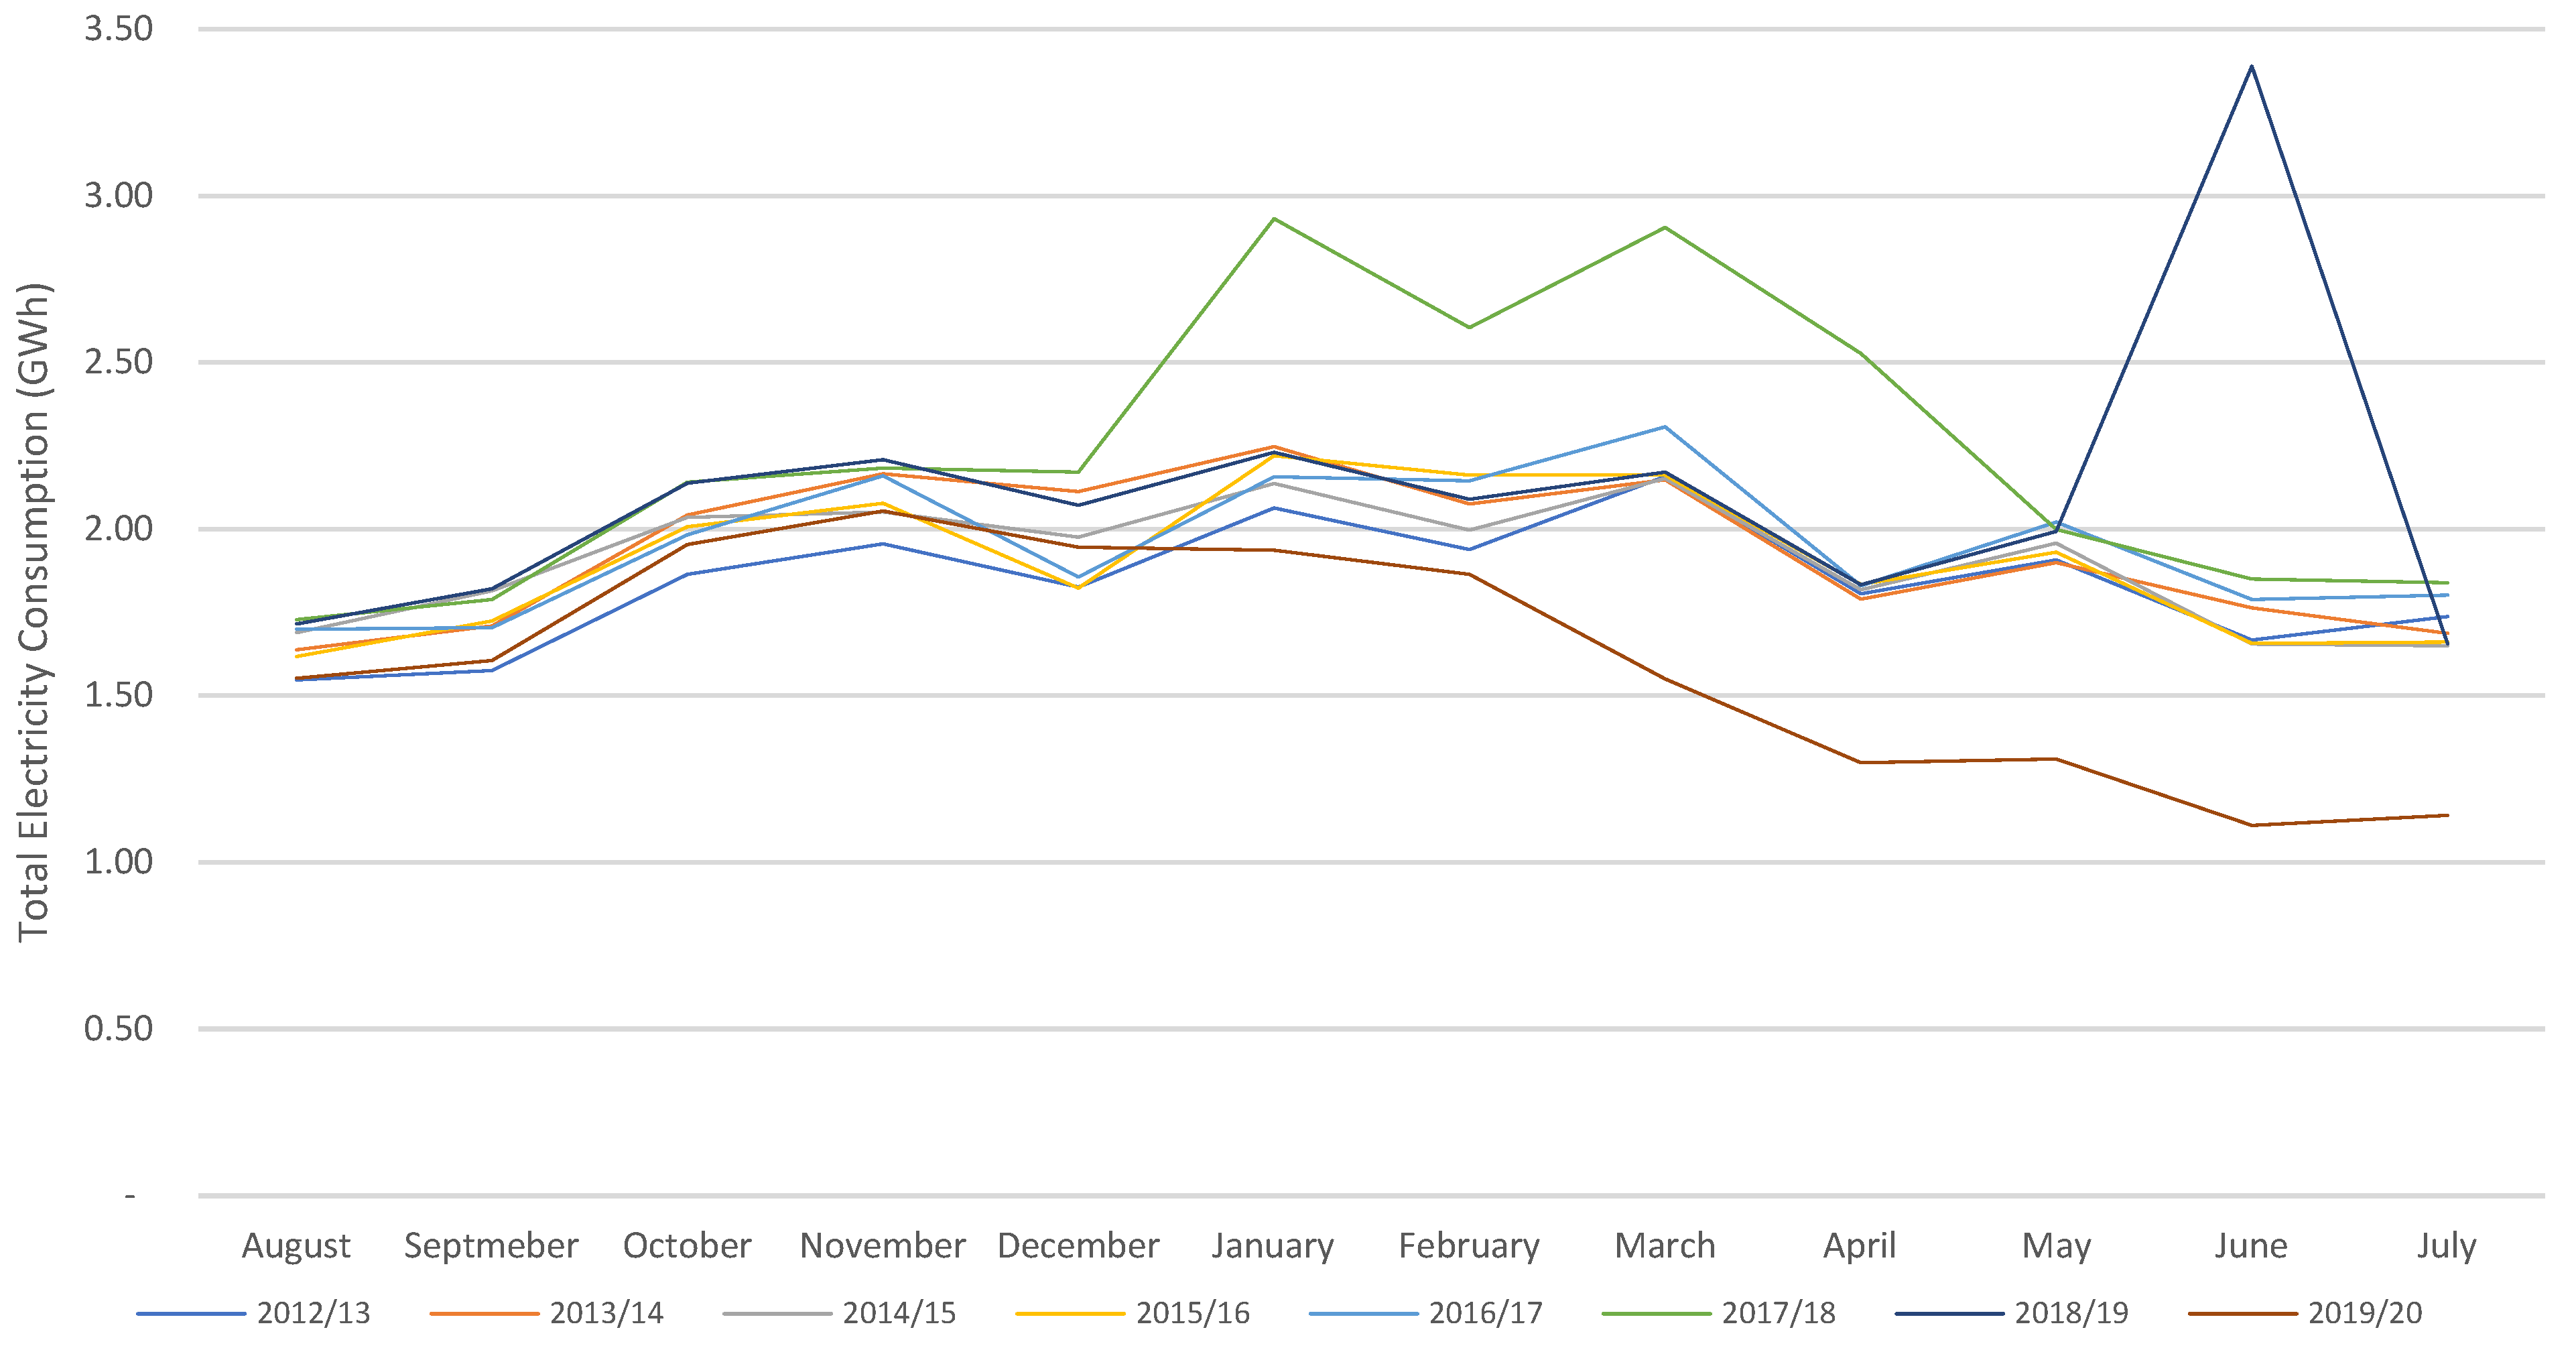
5.2.2. Lighting
5.2.3. Cooling
5.2.4. EV Chargers
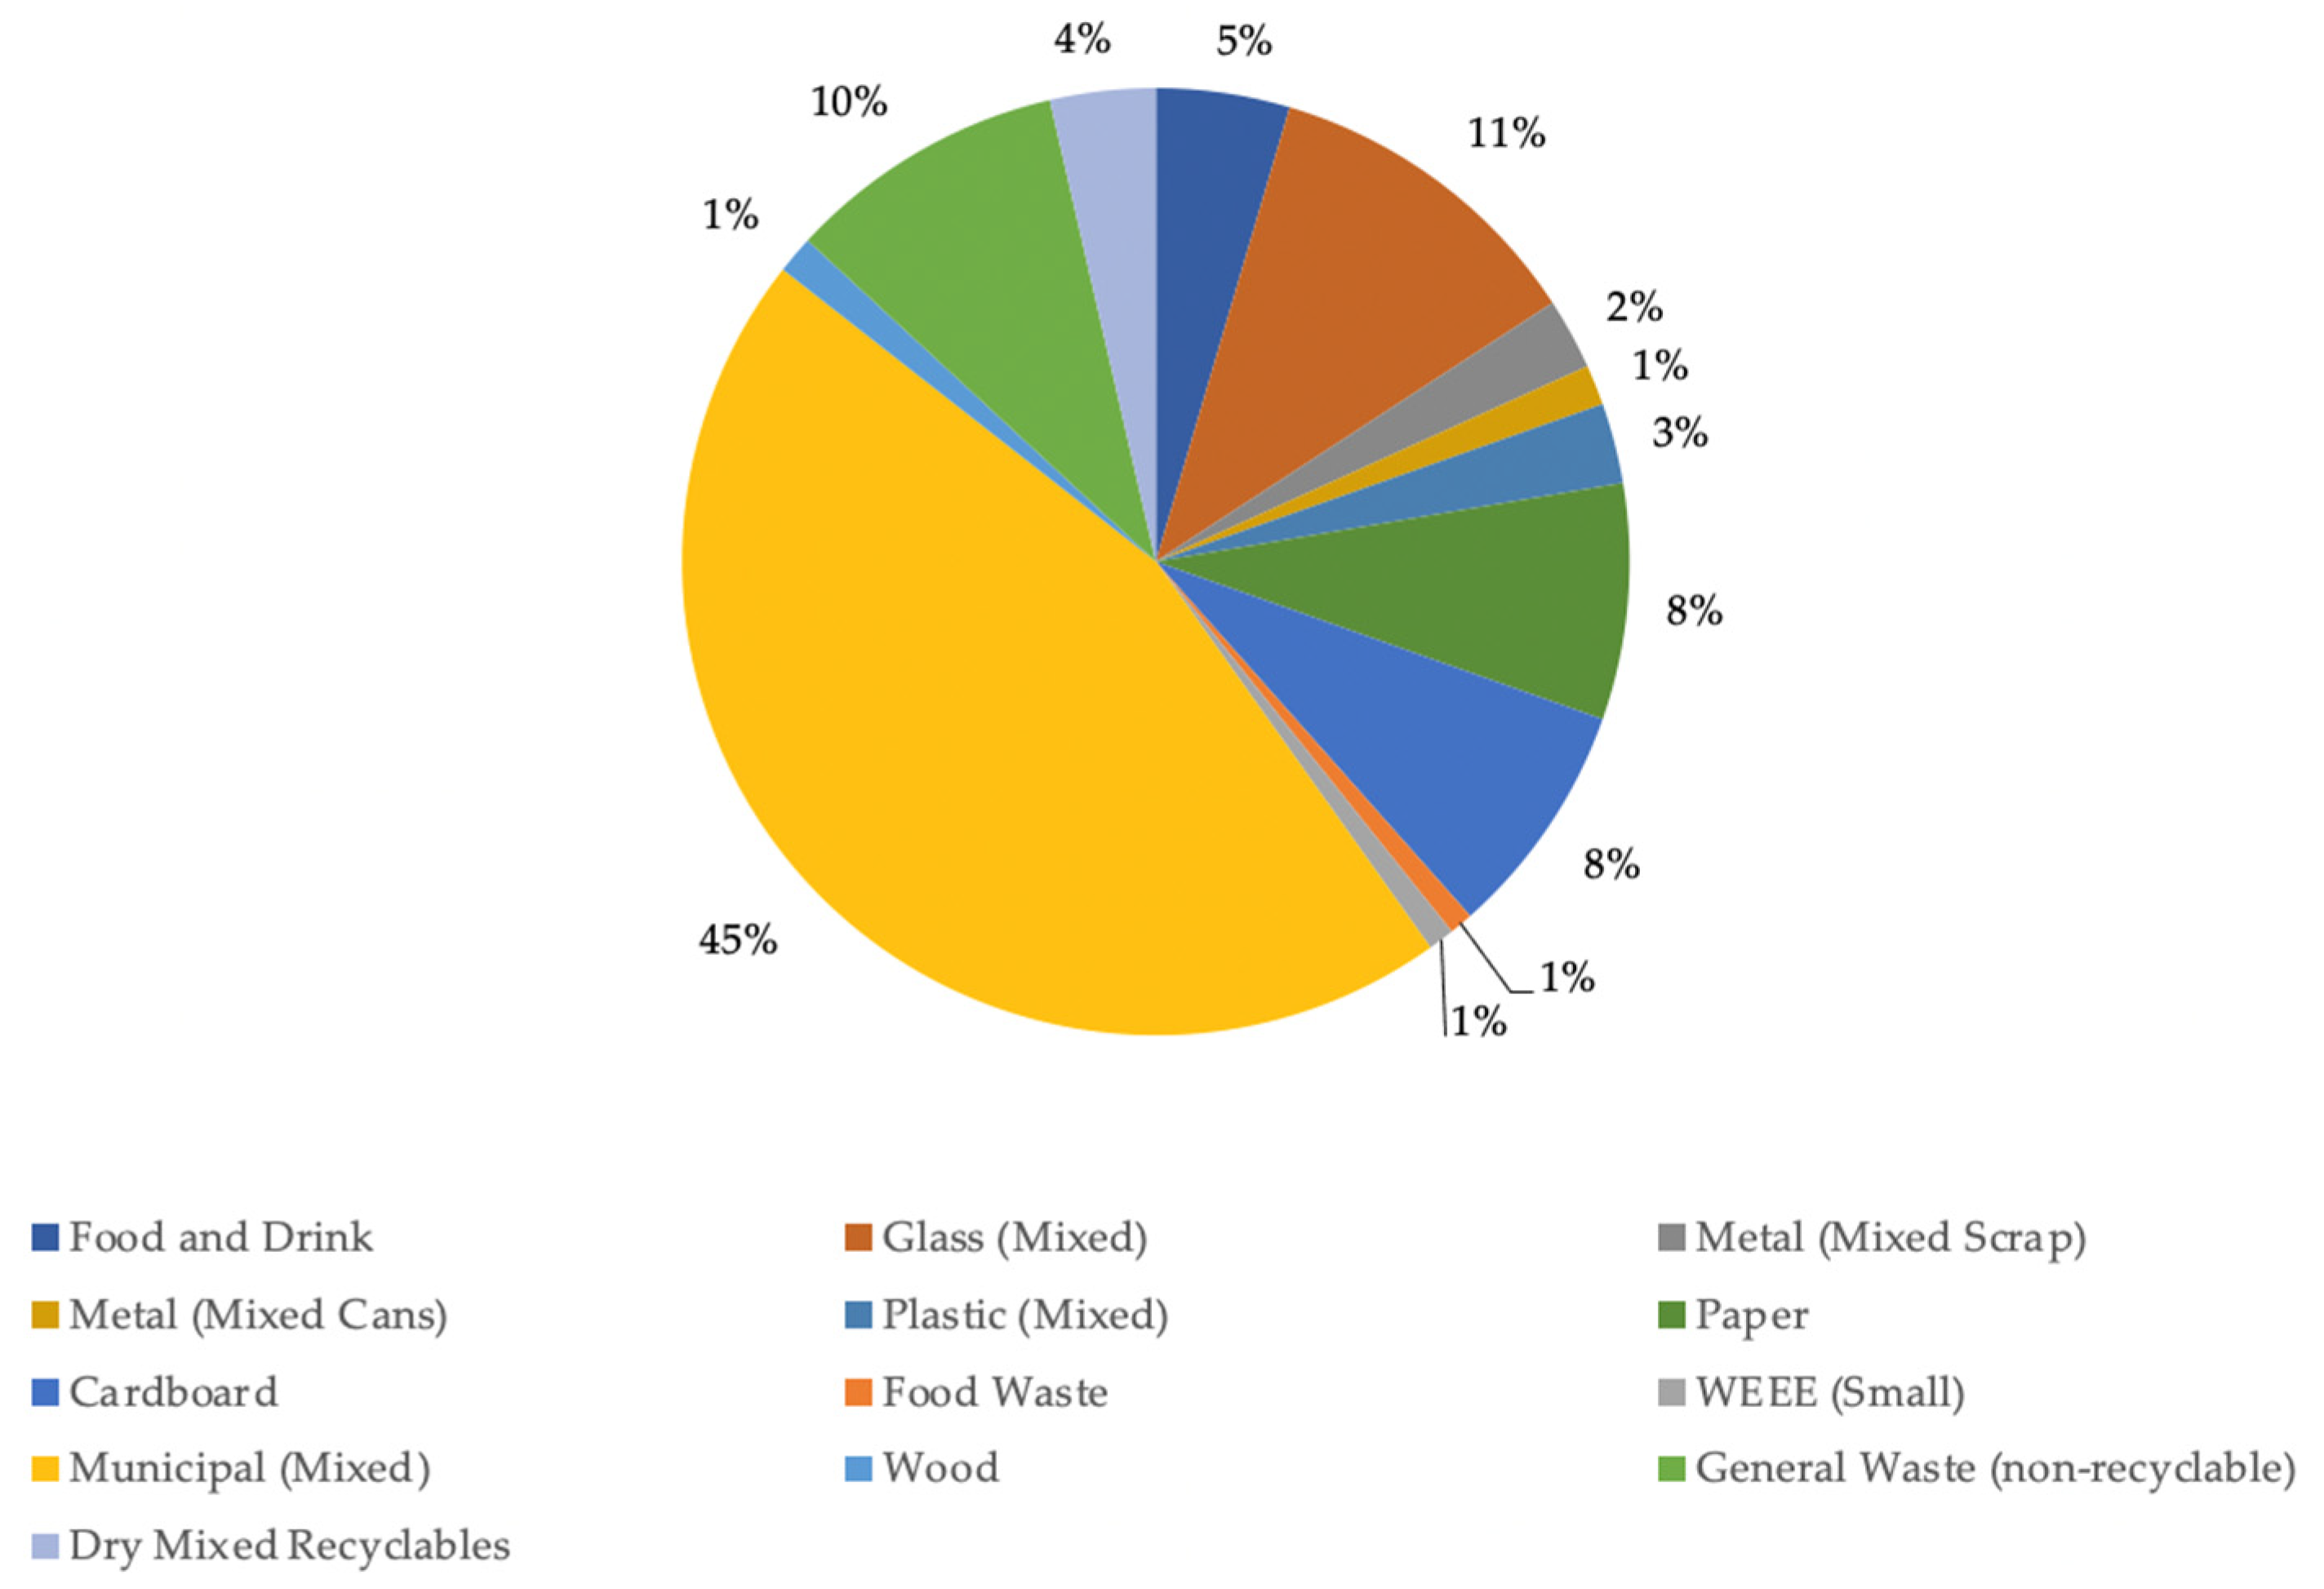
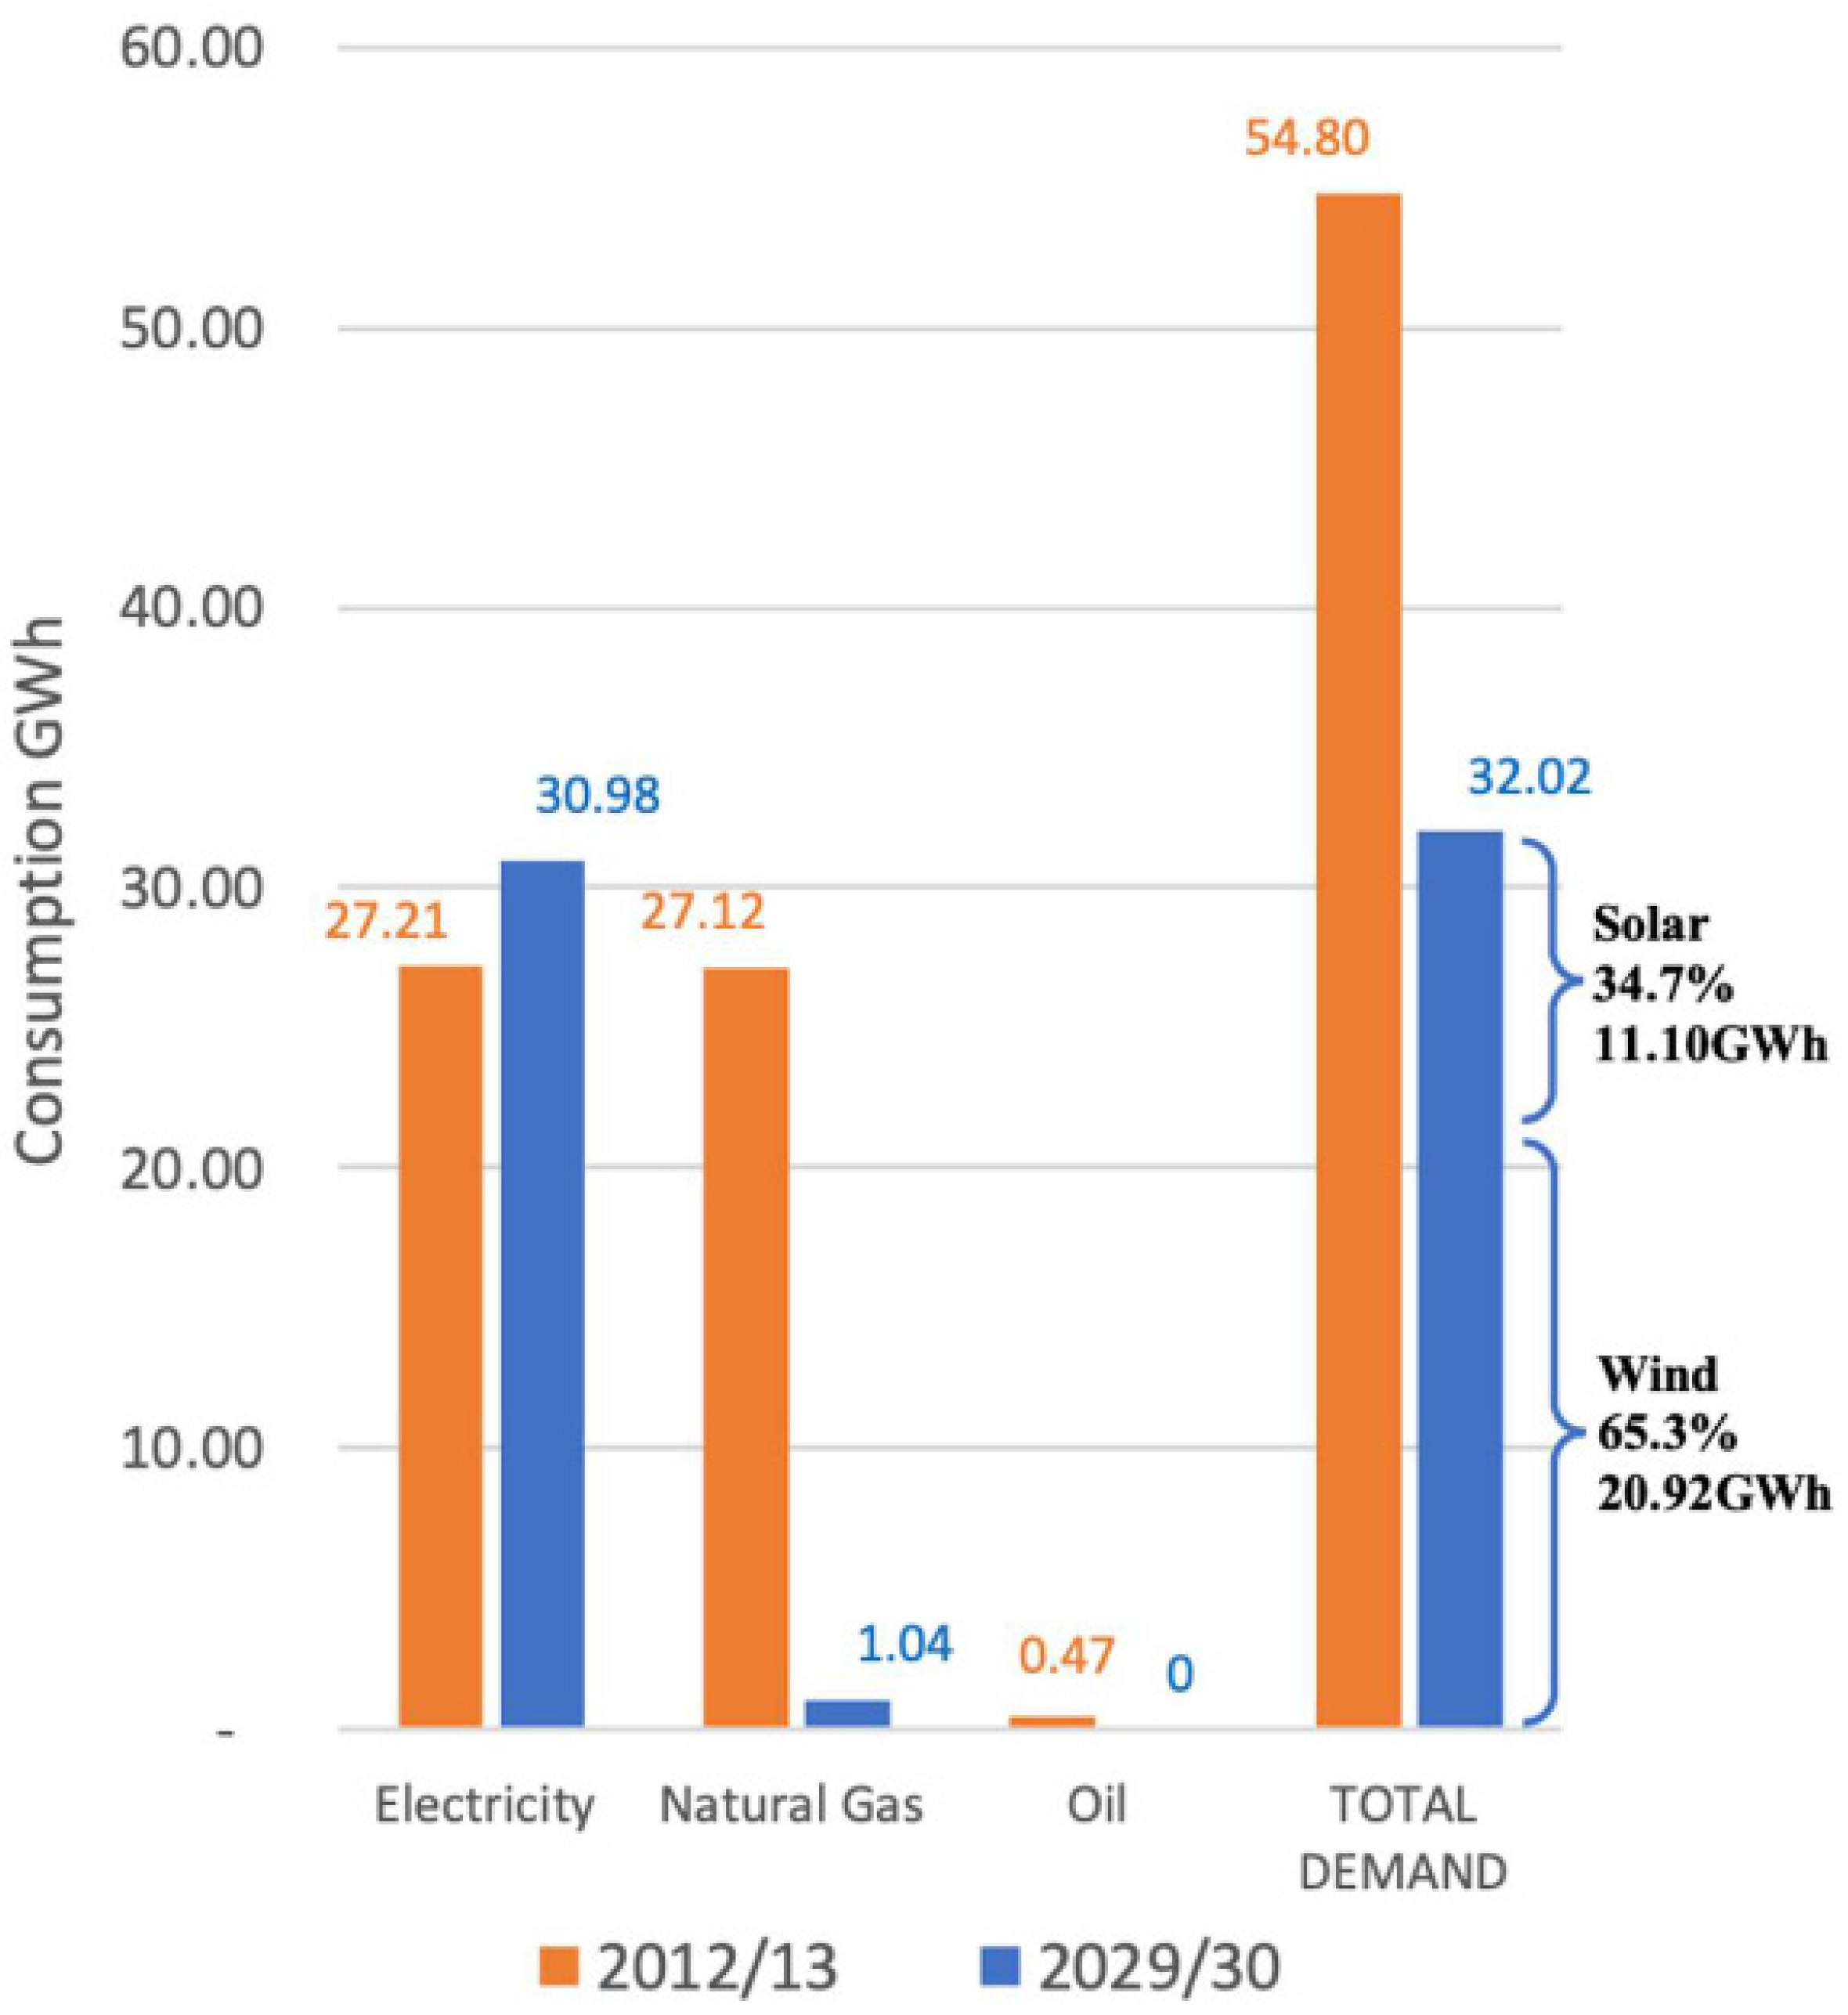
5.3. Scope 3
5.4. Solar
5.5. Wind
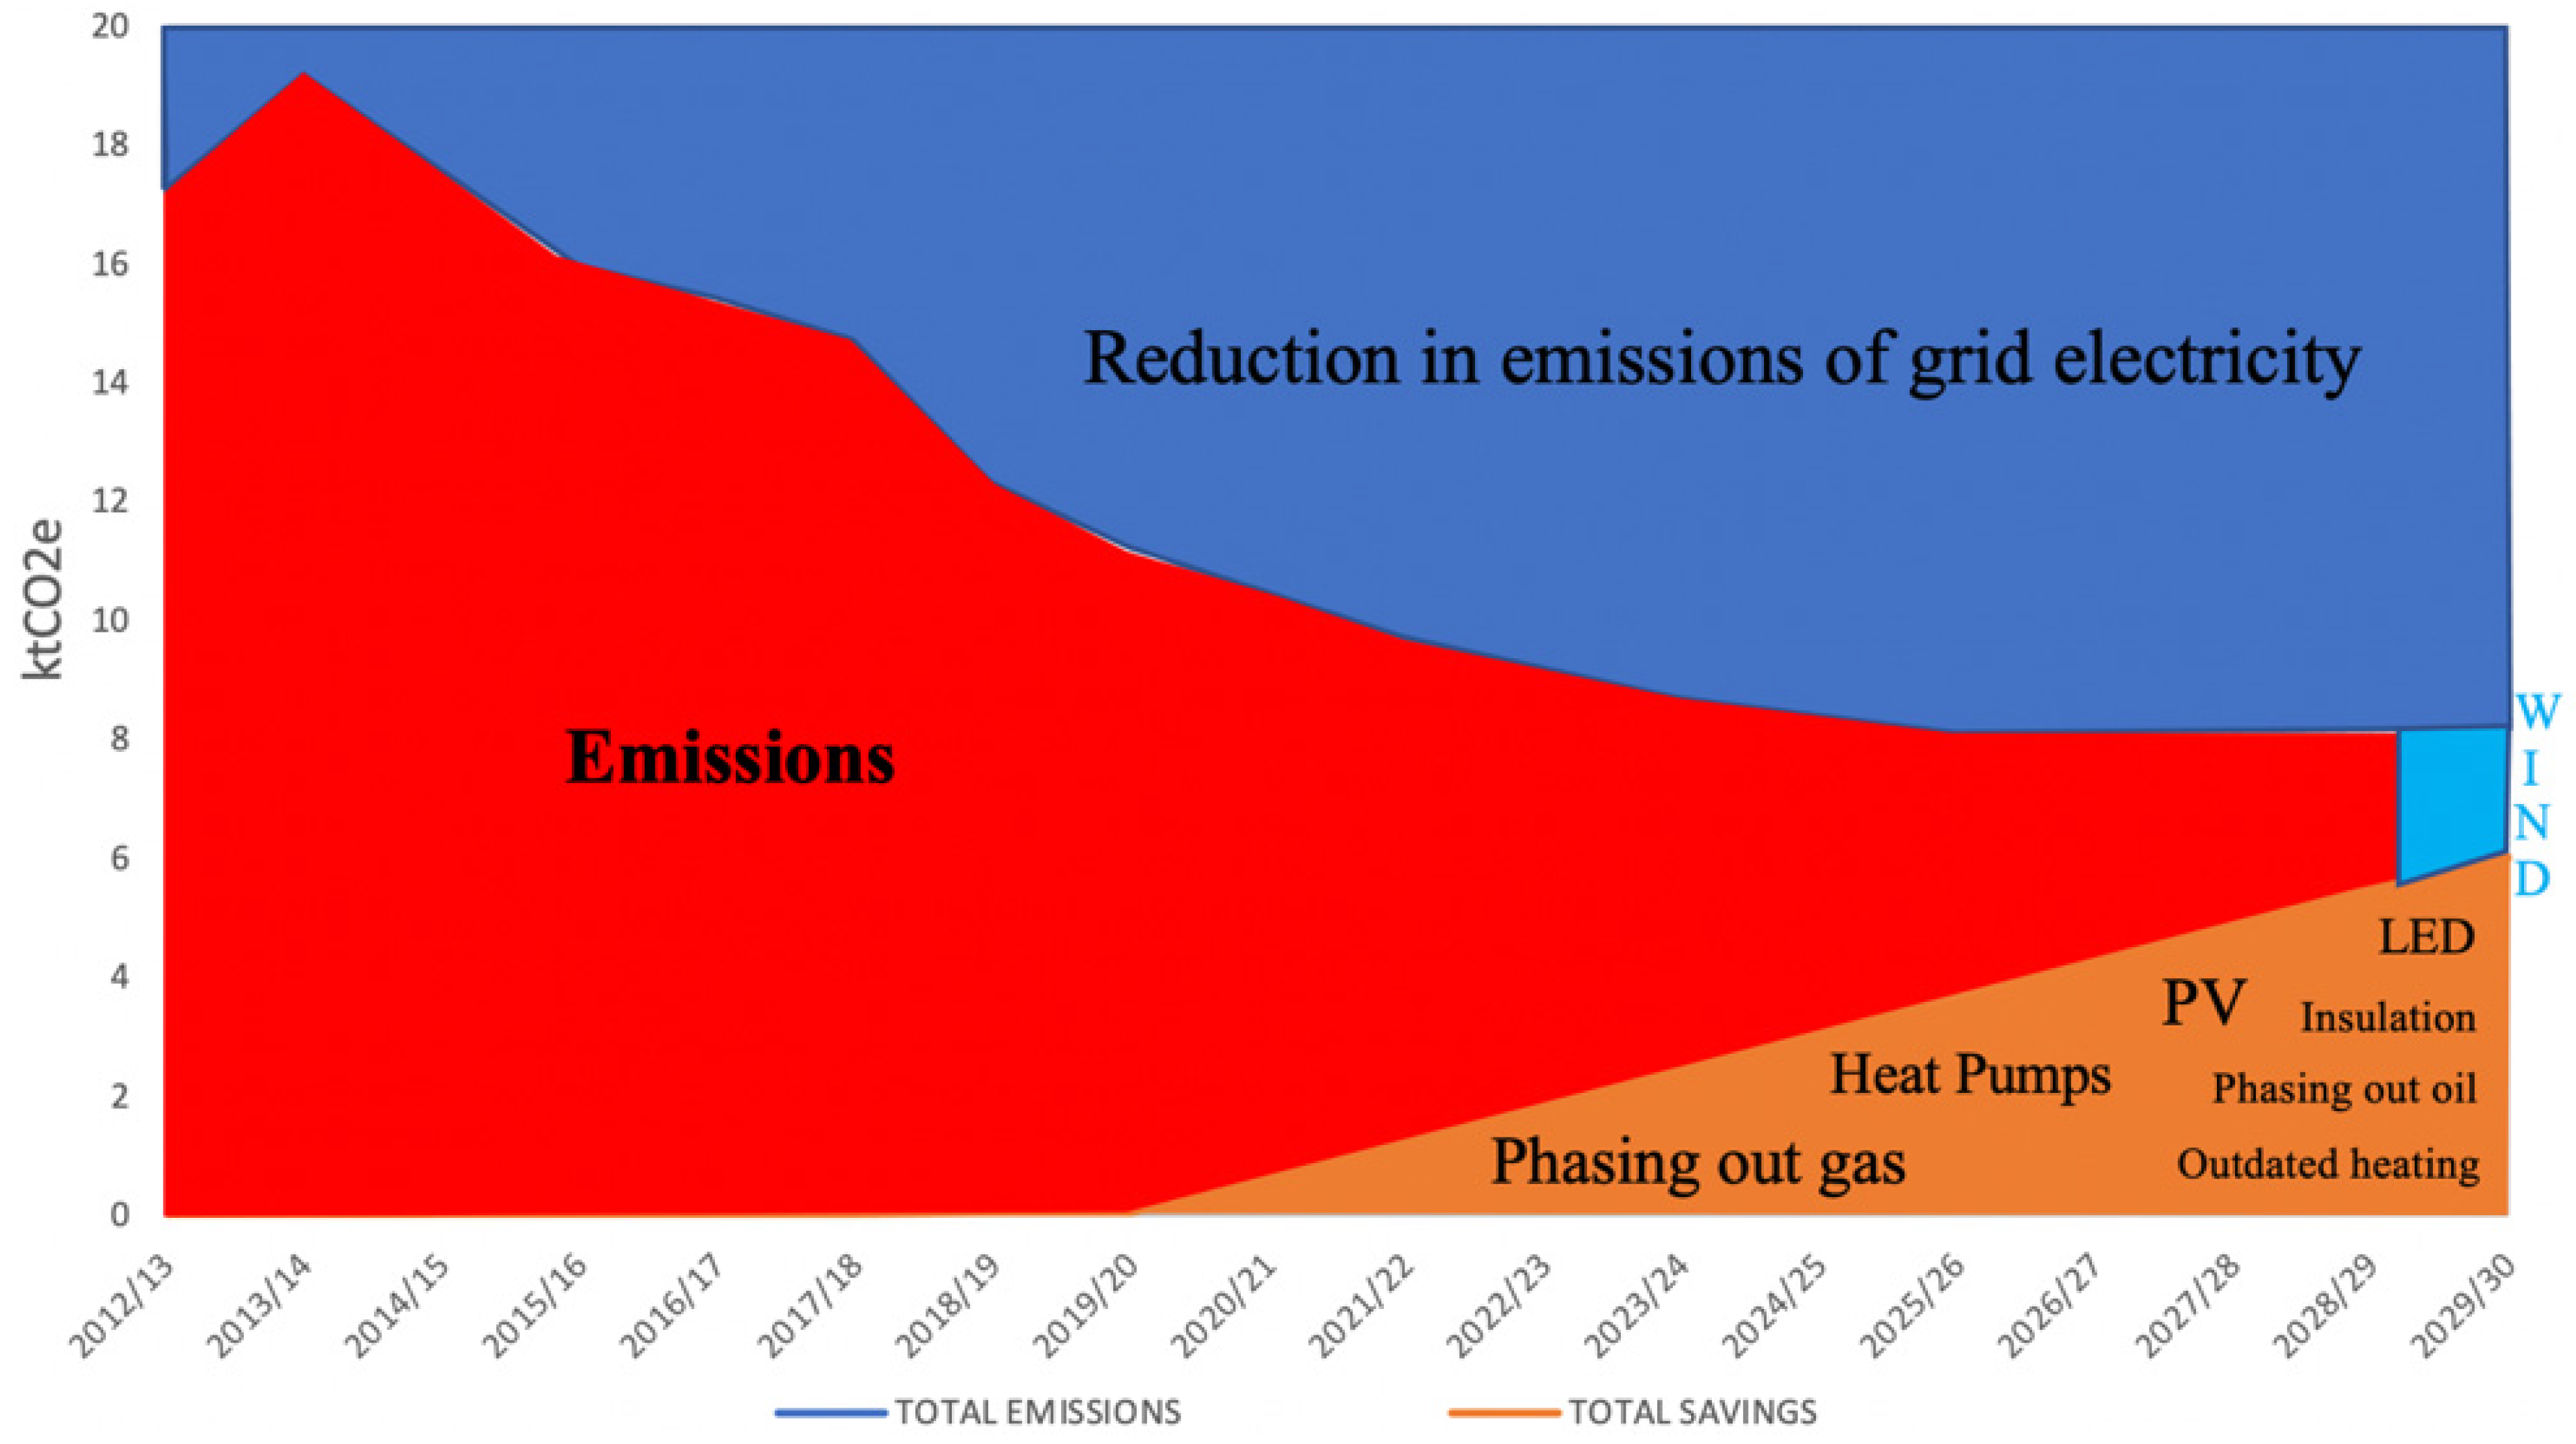
6. Discussion
6.1. Building Trends & Reductions
6.2. Consumption & Emissions Results Overview
7. Conclusions
Author Contributions
Funding
Institutional Review Board Statement
Informed Consent Statement
Data Availability Statement
Acknowledgments
Conflicts of Interest
Nomenclature
| AD | anaerobic digestion |
| AHU | air handling unit |
| CO2 | Carbon Dioxide |
| DBEIS | Department for Business, Energy, and Industrial Strategy |
| ECEPS | Environment & Climate Emergency Policy Statement |
| EfW | Energy from Waste |
| EV | electric vehicle |
| GIA | gross internal area |
| HEA | Higher Education Academy |
| HEI | higher education institution |
| ktCO2e | kiloton Carbon Dioxide equivalent |
| kWh | kilowatt hour |
| kWh/m2/a. | kilowatt hour per metre squared per annum |
| kWh/r/a. | Kilowatt hour per person per annum |
| NUS | National Union of Students (UK) |
| PPA | Power Purchase Agreement |
| PV | photovoltaic |
| UoE | University of Exeter |
| UPP | University Partnership Programme |
| USDE | U.S. Department of Energy |
| WtE | Waste to Energy |
References
- WMO. A History of Climate Activities. 1 January 2021. Available online: https://public.wmo.int/en/bulletin/history-climate-activities (accessed on 8 January 2021).
- GOV.UK. How We Are Educating the Next Generation about the Battle on Climate Change. 24 May 2019. Available online: https://educationhub.blog.gov.uk/2019/05/24/how-we-are-educating-the-next-generation-about-the-battle-on-climate-change/ (accessed on 23 January 2021).
- Wren, S.; Rooney, M. The Challenges of Decarbonising the University Sector. 27 November 2019. Available online: https://www.imeche.org/news/news-article/the-challenges-of-decarbonisation-in-the-university-sector (accessed on 8 February 2021).
- Robinson, O.; Kemp, S.; Williams, I. Carbon management at universities: A reality check. J. Clean. Prod. 2015, 106, 109–118. [Google Scholar] [CrossRef]
- Lozano, R.; Lukman, R.; Lozano, F.J.; Huisingh, D.; Lambrechts, W. Declarations for sustainability in higher education: Becoming better leaders, through addressing the university system. J. Clean. Prod. 2013, 48, 10–19. [Google Scholar] [CrossRef]
- What Are Scopes 1, 2 and 3 of Carbon Emissions? 12 August 2020. Available online: https://plana.earth/academy/what-are-scope-1-2-3-emissions/ (accessed on 16 October 2020).
- Hammond, P. Spring Statement 2019. 3 March 2019. Available online: https://www.gov.uk/government/speeches/spring-statement-2019-philip-hammonds-speech (accessed on 28 April 2021).
- Forster, P. For a Carbon-Neutral UK, the Next Five Years Are Critical—Here’s What Must Happen. The Conversation. 9 Decemeber 2020. Available online: https://theconversation.com/for-a-carbon-neutral-uk-the-next-five-years-are-critical-heres-what-must-happen-151708 (accessed on 29 April 2021).
- Vourvoulias, A. Boilers vs. Heat Pumps. Greenmatch. 26 March 2021. Available online: https://www.greenmatch.co.uk/blog/2015/09/boilers-vs-heat-pumps (accessed on 28 April 2021).
- GOV.UK. GHG Conversion Factors for Company Reporting. 9 June 2020. Available online: https://www.gov.uk/government/collections/government-conversion-factors-for-company-reporting (accessed on 24 November 2020).
- DBEIS. Electricity Emissions Factors to 2100. 2019. Available online: https://assets.publishing.service.gov.uk/government/uploads/system/uploads/attachment_data/file/1024043/data-tables-1-19.xlsx (accessed on 28 April 2021).
- Greenage, T. Running Costs of Infrared Heating. 28 August 2015. Available online: https://www.thegreenage.co.uk/the-running-costs-of-infrared-heating/ (accessed on 29 April 2021).
- GrennMatch. Ground Source Heat Pump Prices. 2021. Available online: https://www.greenmatch.co.uk/heat-pump/ground-source-heat-pumps-in-the-uk/ground-source-heat-pump-prices (accessed on 23 March 2021).
- Heat Pump Source. Student Accomodation Heat Pump Service. Available online: https://www.heatpumpsource.co.uk/building/student-accommodation (accessed on 23 March 2021).
- SMMT. New Car CO2 Rpoert 2019. 2019. Available online: https://www.smmt.co.uk/reports/co2-report/ (accessed on 23 January 2021).
- GOV.UK. 2019 UK Greenhouse Gas Emissions. 2019. Available online: https://assets.publishing.service.gov.uk/government/uploads/system/uploads/attachment_data/file/957687/2019_Final_emissions_statistics_one_page_summary.pdf (accessed on 14 December 2020).
- SMMT. CO2 Report. 2019. Available online: https://www.smmt.co.uk/wp-content/uploads/sites/2/SMMT-CO2-Summary-2019.pdf (accessed on 21 April 2021).
- Bairstow, J. Impressive Proportion of UK Universities Have Elctrified Their Fleet. 20 October 2019. Available online: https://www.energylivenews.com/2019/10/20/impressive-proportion-of-uk-universities-have-electrified-their-fleet/ (accessed on 28 April 2021).
- EDF. UK Gas Boiler Ban. 2020. Available online: https://www.edfenergy.com/heating/advice/uk-boiler-ban (accessed on 23 April 2021).
- CPS Fukes. Fake News: No Oil Boilers by 2030. 11 January 2019. Available online: https://www.cpsfuels.co.uk/news/fake-news-no-oil-boilers-by-2030 (accessed on 25 April 2021).
- D.R. Plumbing & Heating. What’s the Future of Oil Boilers in 2021. 2021. Available online: https://www.drplumbingandheating.co.uk/whats-the-future-of-oil-boilers-in-2021/ (accessed on 2 May 2021).
- Haverland. Why It’s Time to Replace Storage Heaters. 19 October 2020. Available online: https://haverland.co.uk/time-to-replace-storage-heaters/ (accessed on 28 April 2021).
- Barker, A. How to Improve Energy Efficiency. 2017. Available online: https://www.barker-associates.co.uk/energy-efficient-commercial-buildings-guide/ (accessed on 28 April 2021).
- Yüksek, I.; Karadayi, T.T. Energy-Efficient Building Design in the Context of Building Life Cycle. IntechOpen. 18 January 2017. Available online: https://www.intechopen.com/books/energy-efficient-buildings/energy-efficient-building-design-in-the-context-of-building-life-cycle (accessed on 28 April 2021).
- BREEAM. 2020. Available online: https://www.breeam.com/ (accessed on 18 November 2020).
- What Is Passivhaus. 2021. Available online: https://www.passivhaustrust.org.uk/what_is_passivhaus.php#2 (accessed on 20 April 2021).
- Clancy, R. Owners of New Homes Save Almost £700 a Year as They Are More Energy Efficient. PropertyWire. 23 October 2017. Available online: https://www.propertywire.com/news/uk/owners-new-homes-save-almost-700-year-energy-efficient/ (accessed on 30 April 2021).
- Ferronato, N.; Torretta, V. Waste Mismanagement in Developing Countries: A Review of Global Issues. Int. J. Environ. Res. Public Health 2019, 16, 1060. [Google Scholar] [CrossRef] [PubMed] [Green Version]
- Energy from Waste. 1 January 2021. Available online: https://www.recycledevon.org/energy-from-waste/ (accessed on 18 November 2020).
- Penner, S. Waste-to-Energy (WTE) Systems. Encylopedia Phys. Sci. Technol. 2003, 3, 631–688. [Google Scholar]
- De La Grée, G.D.; Florea, M.; Keulen, A.; Brouwers, H. Contaminated biomass fly ashes–Characterization and treatment optimization for reuse as building materials. Waste Manag. 2016, 49, 96–109. [Google Scholar] [CrossRef] [PubMed]
- Pehl, M.; Arvesen, A.; Humpenöder, F.; Popp, A.; Hertwich, E.G.; Luderer, G. Understanding future emissions from low-carbon power systems by integration of life-cycle assessment and integrated energy modelling. Nat. Energy 2017, 2, 939–945. [Google Scholar] [CrossRef]
- The Open University. Can Nuclear Power Solve the Energy Gap? Future Learn. 30 June 2015. Available online: https://www.futurelearn.com/info/blog/can-nuclear-power-solve-the-energy-gap (accessed on 26 April 2021).
- Goodman, G.; Martin, V. Wind Powered Electricity in the UK. 2019. Available online: https://assets.publishing.service.gov.uk/government/uploads/system/uploads/attachment_data/file/875384/Wind_powered_electricity_in_the_UK.pdf (accessed on 20 March 2021).
- Vaughan, A. The Guardian. 2019. Available online: https://www.theguardian.com/business/2017/jan/06/uk-wind-power-coal-green-groups-carbon-taxes (accessed on 26 April 2021).
- GOV.UK. Provisional Emissions. 2019. Available online: https://assets.publishing.service.gov.uk/government/uploads/system/uploads/attachment_data/file/875485/2019_UK_greenhouse_gas_emissions_provisional_figures_statistical_release.pdf (accessed on 17 February 2021).
- European Comission. The Registry. 2021. Available online: https://inspire.ec.europa.eu/codelist/WindPotentialValue/averageMeanWindPowerDensity (accessed on 26 April 2021).
- Global Wind Atlas. 2021. Available online: https://globalwindatlas.info/ (accessed on 26 April 2021).
- DBEIS. UK Energy Statistics 2019. National Statistics. Available online: https://www.gov.uk/government/statistics/digest-of-uk-energy-statistics-dukes-2019 (accessed on 26 April 2021).
- University of Sussex. Energy. 2021. Available online: https://www.sussex.ac.uk/about/sustainable-university/energy (accessed on 27 April 2021).
- Solarsense. Solar PV Cells for Universities and the Educational Sector. 2021. Available online: https://www.solarsense-uk.com/filter_sector/universities/ (accessed on 27 April 2021).
- Global Solar Atlas. 2021. Available online: https://globalsolaratlas.info/map?c=52.776186,-1.933594,5 (accessed on 26 April 2021).
- The GreenAge. 22 April 2014. Available online: https://www.thegreenage.co.uk/renewables-to-heat-your-swimming-pool/ (accessed on 5 December 2020).
- Ekins, D. Indoor vs Outdoor Swimming Pools. Eagle Leisure. 14 March 2019. Available online: https://eagleleisure.co.uk/indoor-vs-outdoor-swimming-pool/ (accessed on 20 January 2021).
- UoE. Residences. 1 January 2021. Available online: https://www.exeter.ac.uk/accommodation/residences/ (accessed on 5 March 2021).
- Vent-Axia. Heat Save. 2020. Available online: https://www.vent-axia.com/sites/default/files/vent-axia_heat_save_pro_datasheet.pdf (accessed on 3 May 2021).
- Ford. Innovative Transit Smart Energy Concept. 4 November 2019. Available online: https://media.ford.com/content/fordmedia/feu/en/news/2019/04/11/innovative-transit-smart-energy-concept-is-helping-ford-find-new.html (accessed on 16 April 2021).
- DBEIS. 2020 Government Greenhouse Gas Conversion Factors for Company Reporting. GOV.UK. 2020. Available online: https://assets.publishing.service.gov.uk/government/uploads/system/uploads/attachment_data/file/901692/conversion-factors-2020-methodology.pdf (accessed on 16 April 2021).
- National Grid. Live Status. 2021. Available online: https://grid.iamkate.com/ (accessed on 24 April 2021).
- Leslie, J. Zero Carbon Operation 2025. nationalgridESO. 2019. Available online: https://www.nationalgrideso.com/document/141031/download (accessed on 24 April 2021).
- GOV.UK. Historical Electricity Data. 2020. Available online: https://www.gov.uk/government/statistical-data-sets/historical-electricity-data (accessed on 24 April 2021).
- Green Journal. LED Lights in the Office: Good for Employees and Good for the Environment. 18 December 2018. Available online: https://www.greenjournal.co.uk/2018/12/led-lights-in-the-office-good-for-employees-and-good-for-the-environment/ (accessed on 25 November 2020).
- U.S. Department of Energy. Lighting Choices to Save You Money. 2020. Available online: https://www.energy.gov/energysaver/save-electricity-and-fuel/lighting-choices-save-you-money (accessed on 3 April 2021).
- Stouch, S. Lighting Comparison. StouchLighting. 13 January 2016. Available online: https://www.stouchlighting.com/blog/fluorescent-vs-led-vs-cfl (accessed on 23 March 2021).
- U.S. Department of Energy. Lighting Controls—Energy Saver. 2021. Available online: https://www.energy.gov/energysaver/save-electricity-and-fuel/lighting-choices-save-you-money/lighting-controls (accessed on 29 April 2021).


| 2010 | 2011 | 2012 | 2013 | 2014 | 2015 | 2016 | 2017 | 2018 | 2019 | |
|---|---|---|---|---|---|---|---|---|---|---|
| Onshore | 1.9% | 2.9% | 3.4% | 4.7% | 5.5% | 6.7% | 6.1% | 8.5% | 9.1% | 9.9% |
| Offshore | 0.8% | 1.4% | 2.1% | 3.2% | 4.0% | 5.1% | 4.8% | 6.2% | 8.0% | 9.9% |
| Total | 2.7% | 4.3% | 5.5% | 7.9% | 9.5% | 11.8% | 10.9% | 14.7% | 17.1% | 19.8% |
| Building Name | Gas Intensity 2018/19 (kWh/m2/a.) |
|---|---|
| Cornwall House Pool | 2012.4 |
| Hope Hall | 1265.1 |
| Estate Services Centre | 555.9 |
| Lafrowda House | 502.7 |
| Geoffrey Pope | 426.3 |
| Hatherly Building | 315.4 |
| Biosciences Greenhouse | 287.6 |
| Peter Chalk Centre | 233.1 |
| Cornwall House | 222.9 |
| Reed Hall | 203.1 |
| Building Name | Gas 2018/19 kWh/m2/a. | Building Name | Gas 2018/19 kWh/m2/a. |
|---|---|---|---|
| Henry Welcome Building for Biocatalysis | 156.5 | Queen’s Building | 83.8 |
| Newman Building | 145.8 | Xfi Building | 70.8 |
| Living Systems Building | 140.6 | Streatham Court | 70.1 |
| Forum and Forum Library | 138.3 | Building: One | 66.0 |
| Changing Pavilion (Hockey Pitch) | 135.9 | Clayden | 65.4 |
| Washington Singer | 120.2 | Kay House | 62.4 |
| Alexander Building and Thornlea Complex | 108.5 | Sports Hall | 60.8 |
| Knightley | 108.1 | Old Library | 60.4 |
| Amory Building | 106.9 | Lazenby | 56.7 |
| Clydesdale House | 105.7 | Russell Seal Fitness Centre | 50.8 |
| Devonshire House | 100.8 | Institute of Arab and Islamic Studies | 47.7 |
| Reed Mews Wellbeing | 100.5 | Great Hall | 35.8 |
| Physics Building | 93.5 | Sir Christopher Ondaatje Devon Cricket Centre | 35.2 |
| Laver Building | 90.7 | Higher Hoopern Farm | 33.2 |
| Roborough | 86.9 | Northcote House | 29.4 |
| Byrne House | 85.8 | Harrison Building | 3.8 |
| Residence | Total Gas 2018/19 kWh/r/a. | Residence | Total Gas 2018/19 kWh/r/a. |
|---|---|---|---|
| Garden Hill House | 8224 | Old Lafrowda | 2809 |
| Lopes Hall | 6006 | Nancherrow | 2537 |
| Pennsylvania Court | 4408 | Ransom Pickard | 2495 |
| Mardon Hall | 4086 | New Lafrowda | 2224 |
| Holland Hall | 4035 | Duryard T&Y | 2068 |
| Birks C | 3407 | Rowe House | 1640 |
| St Germans | 3182 | Nash Grove | 1594 |
| Rowancroft | 3067 | Clydesdale Rise | 1070 |
| Birks | 2907 | James Owen Court | 66 |
| Building Name | Electrical Intensity 2018/19 kWh/m2/a. |
|---|---|
| Computer Building | 1879 |
| Geoffrey Pope | 529 |
| Henry Welcome Building | 401 |
| Clydesdale House | 277 |
| Harrison Building | 273 |
| Forum and Library | 271 |
| Biosciences Greenhouse | 265 |
| Living Systems Institute | 256 |
| Hatherly Building | 225 |
| Physics Building | 201 |
| Building Name | Electricity Intensity 2018/19 kWh/m2/a. | Building Name | Electricity Intensity 2018/19 kWh/m2/a. |
|---|---|---|---|
| Peter Chalk Centre | 191.2 | Washington Singer | 71.0 |
| Kay Building (Labs) | 169.3 | Newman Building | 66.4 |
| Mary Harris Memorial Chapel | 167.7 | Amory Building | 64.3 |
| Cornwall House | 142.9 | Laver Building | 60.3 |
| Devonshire House | 138.7 | Byrne House | 60.1 |
| Cornwall House Pool | 136.7 | Lafrowda House | 59.0 |
| Clydesdale Rise—Blocks A–C | 125.2 | Hope Hall | 58.8 |
| Changing Pavilion (Hockey Pitch) | 124.9 | Streatham Farm | 58.5 |
| Reed Mews Wellbeing | 123.1 | Kay House | 56.2 |
| Building:One | 108.8 | Knightley | 54.3 |
| Xfi Building | 105.4 | Great Hall | 53.9 |
| Russell Seal Fitness Centre | 103.1 | Queen’s Building | 53.2 |
| Reed Hall | 98.4 | Alexander Building and Thornlea Complex | 49.6 |
| Sports Hall | 94.5 | Ransom Pickard—Blocks A–B | 47.7 |
| Old Library | 87.2 | Lazenby | 44.3 |
| Clayden | 79.6 | Estate Services Centre | 38.5 |
| Streatham Court | 75.9 | Higher Hoopern Farm | 37.8 |
| Institute of Arab and Islamic Studies | 75.6 | Roborough | 19.6 |
| Northcote House | 75.4 | Sir Christopher Ondaatje Devon Cricket Centre | 4.4 |
| Sir Henry Welcome Bdg for Mood Disorders Research | 72.3 |
| Residence | Total Electricity 2018/19 kWh/r/a. | Residence | Total Electricity 2018/19 kWh/r/a. |
|---|---|---|---|
| Holland Hall | 2489 | Brunel Close | 1223 |
| Lopes Hall | 2302 | New Lafrowda | 851 |
| Nancherrow | 2214 | Ransom Pickard | 885 |
| James Owen Court | 1964 | Mardon Hall | 745 |
| Rowe House | 1864 | Duryard | 697 |
| Birks | 1541 | Garden Hill House | 572 |
| Pennsylvania Court | 1400 | Birks | 376 |
| Kingdom Mews | 1313 | Old Lafrowda | 344 |
| Merrivale | 1230 |
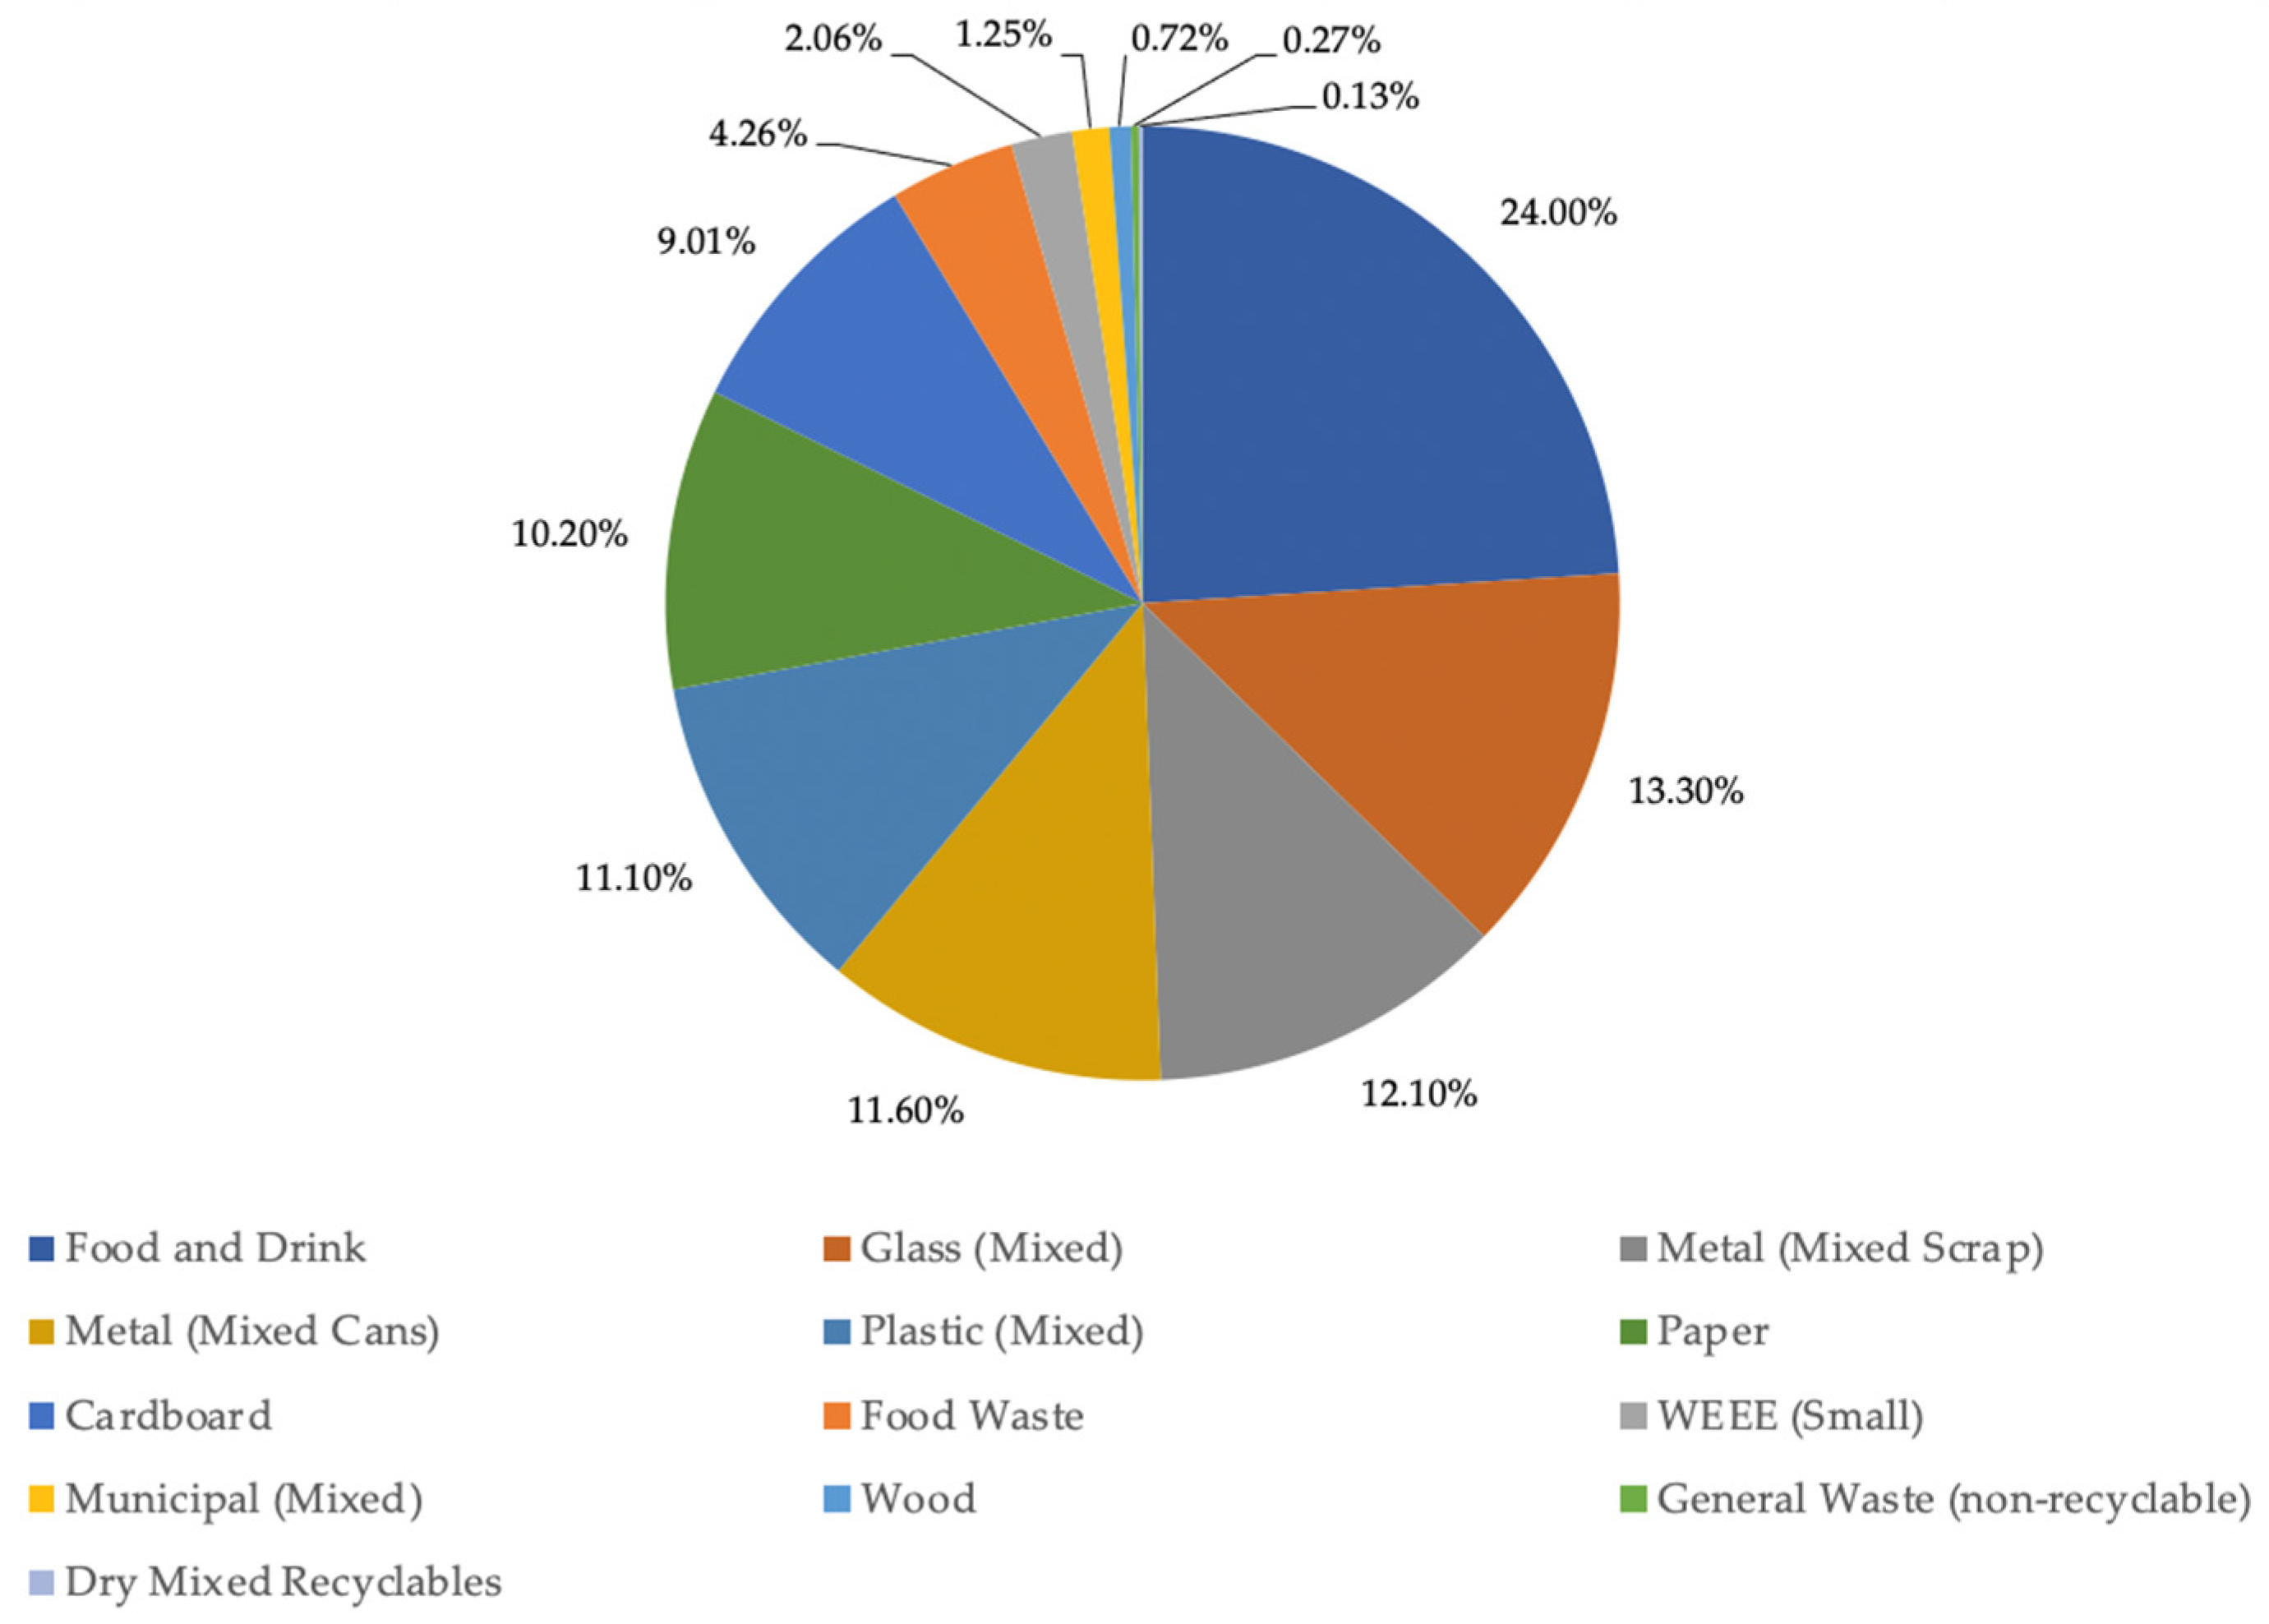
| Waste Type | tCO2e | % tCO2e | Tonnes | % Tonnes |
|---|---|---|---|---|
| Food and Drink | 275 | 24 | 67.4 | 5% |
| Glass (Mixed) | 152 | 13.3 | 166 | 11% |
| Metal (Mixed Scrap) | 139 | 12.1 | 36 | 2% |
| Metal (Mixed Cans) | 133 | 11.6 | 20.2 | 1% |
| Plastic (Mixed) | 127 | 11.1 | 40.5 | 3% |
| Paper | 116 | 10.2 | 119 | 8% |
| Cardboard | 103 | 9.01 | 119 | 8% |
| Food Waste | 48.9 | 4.26 | 12 | 1% |
| WEEE (Small) | 23.6 | 2.06 | 13.2 | 1% |
| Municipal (Mixed) | 14.3 | 1.25 | 671 | 45% |
| Wood | 8.27 | 0.72 | 19 | 1% |
| General Waste (non-recyclable) | 3.02 | 0.27 | 141 | 10% |
| Dry Mixed Recyclables | 1.13 | 0.13 | 53.1 | 4% |
| Total | 1144.22 | 100% | 1477.4 | 100% |
| Model | Quantity | Emissions (g/km) | Total per Model (g/km) | Replacement |
|---|---|---|---|---|
| Nisssan eNV200 | 17 | 0 | 0 | - |
| Renault Kangoo ZE | 1 | 0 | 0 | - |
| VW Transporter | 3 | 160 | 480 | eTransporter |
| Vauxhall Vivaro | 1 | 180 | 180 | eTransporter |
| Peugeot 207 | 1 | 133 | 133 | many options |
| BMW 730ld | 1 | 167 | 167 | many options |
| BMW 520d | 1 | 127 | 127 | many options |
| Ford Transit | 11 | 200 | 2200 | Nissan eNV200 |
| Volkswagen Caddy | 4 | 161 | 644 | Nissan eNV200 |
| Citroën Berlingo | 1 | 148 | 148 | Nissan eNV200 |
| Vauxhall Combo | 1 | 150 | 150 | Nissan eNV200 |
| Peugeot Partner Combi | 1 | 140 | 140 | Nissan eNV200 |
| Land Rover Defender | 2 | 255 | 510 | no alternative |
| IVECO Daily Luton | 1 | 300 | 300 | no alternative |
| Toyota Hilux | 3 | 242 | 726 | no alternative |
| Nissan D22 | 1 | 180 | 180 | no alternative |
| Nissan Navara | 1 | 180 | 180 | no alternative |
| Tractor | 11 | 400 | 4400 | no alternative |
| IVECO Minibus 17 seat | 4 | 200 | 800 | Transit SE Concept |
| TOTAL | 66 | 3323 | 11,465 | |
| Remaining Emission g/km | 7096 | |||
| Reduction | 38% | |||
| New Average Emissions | 107.5 | |||
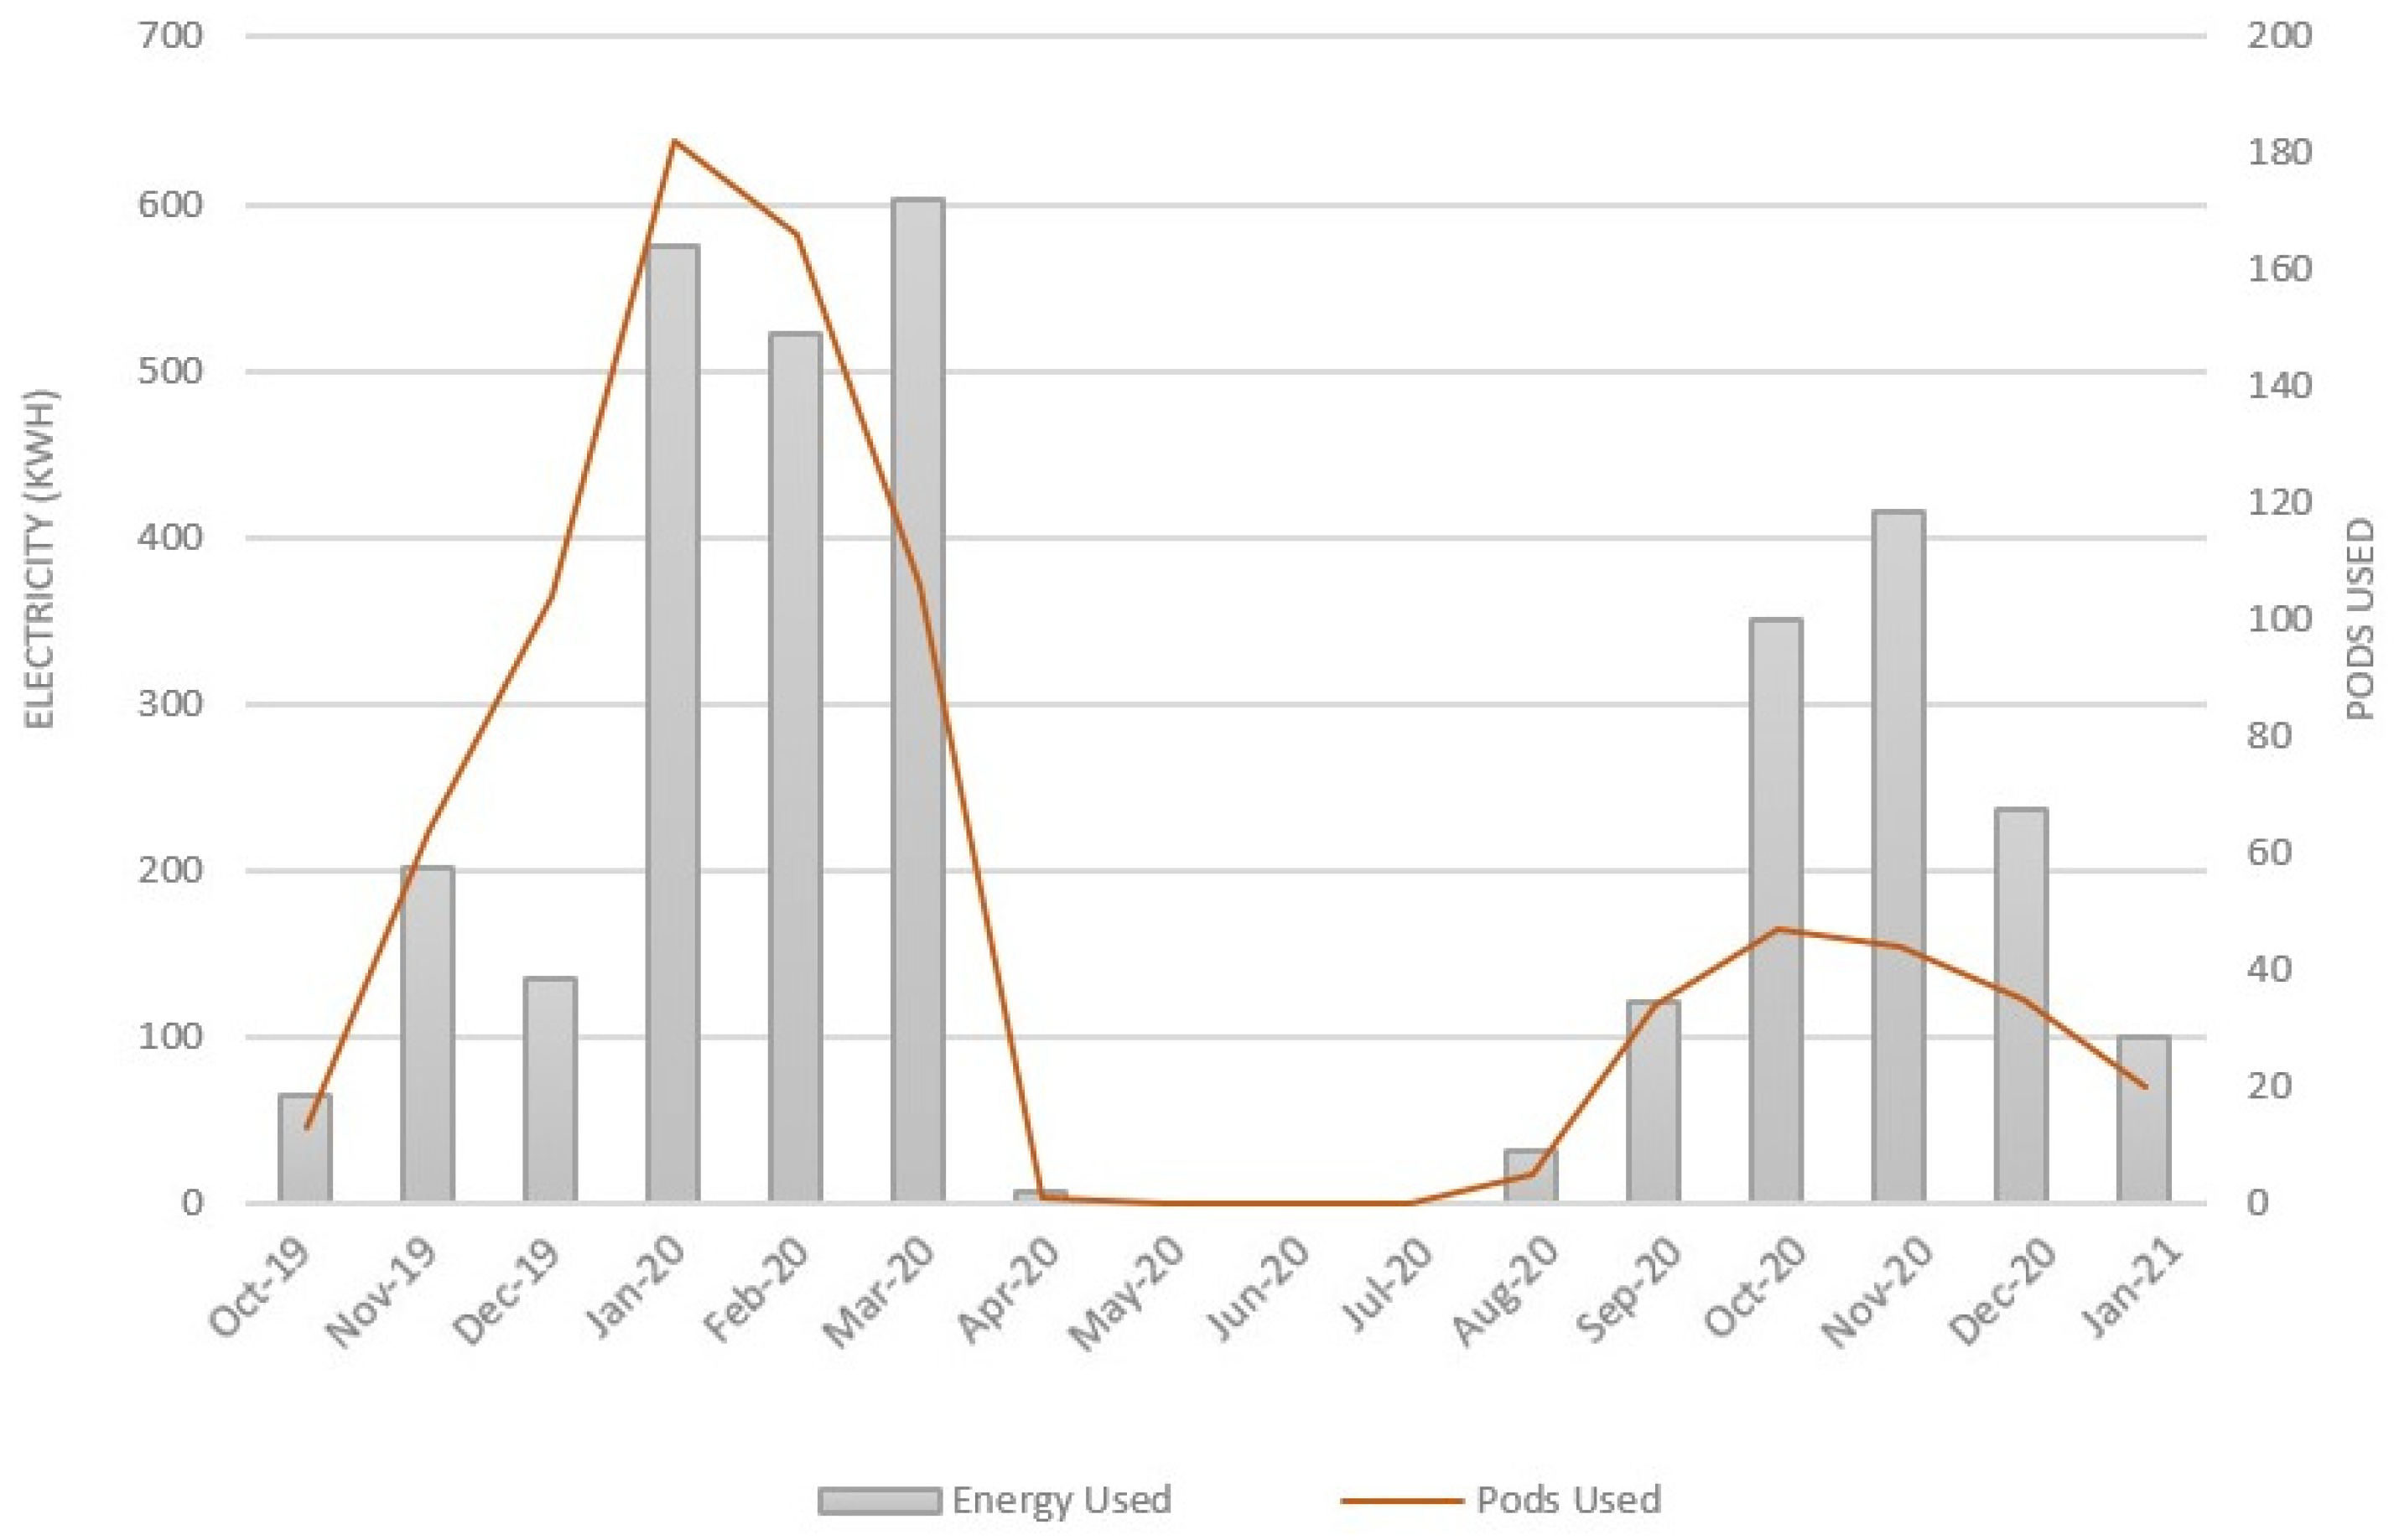
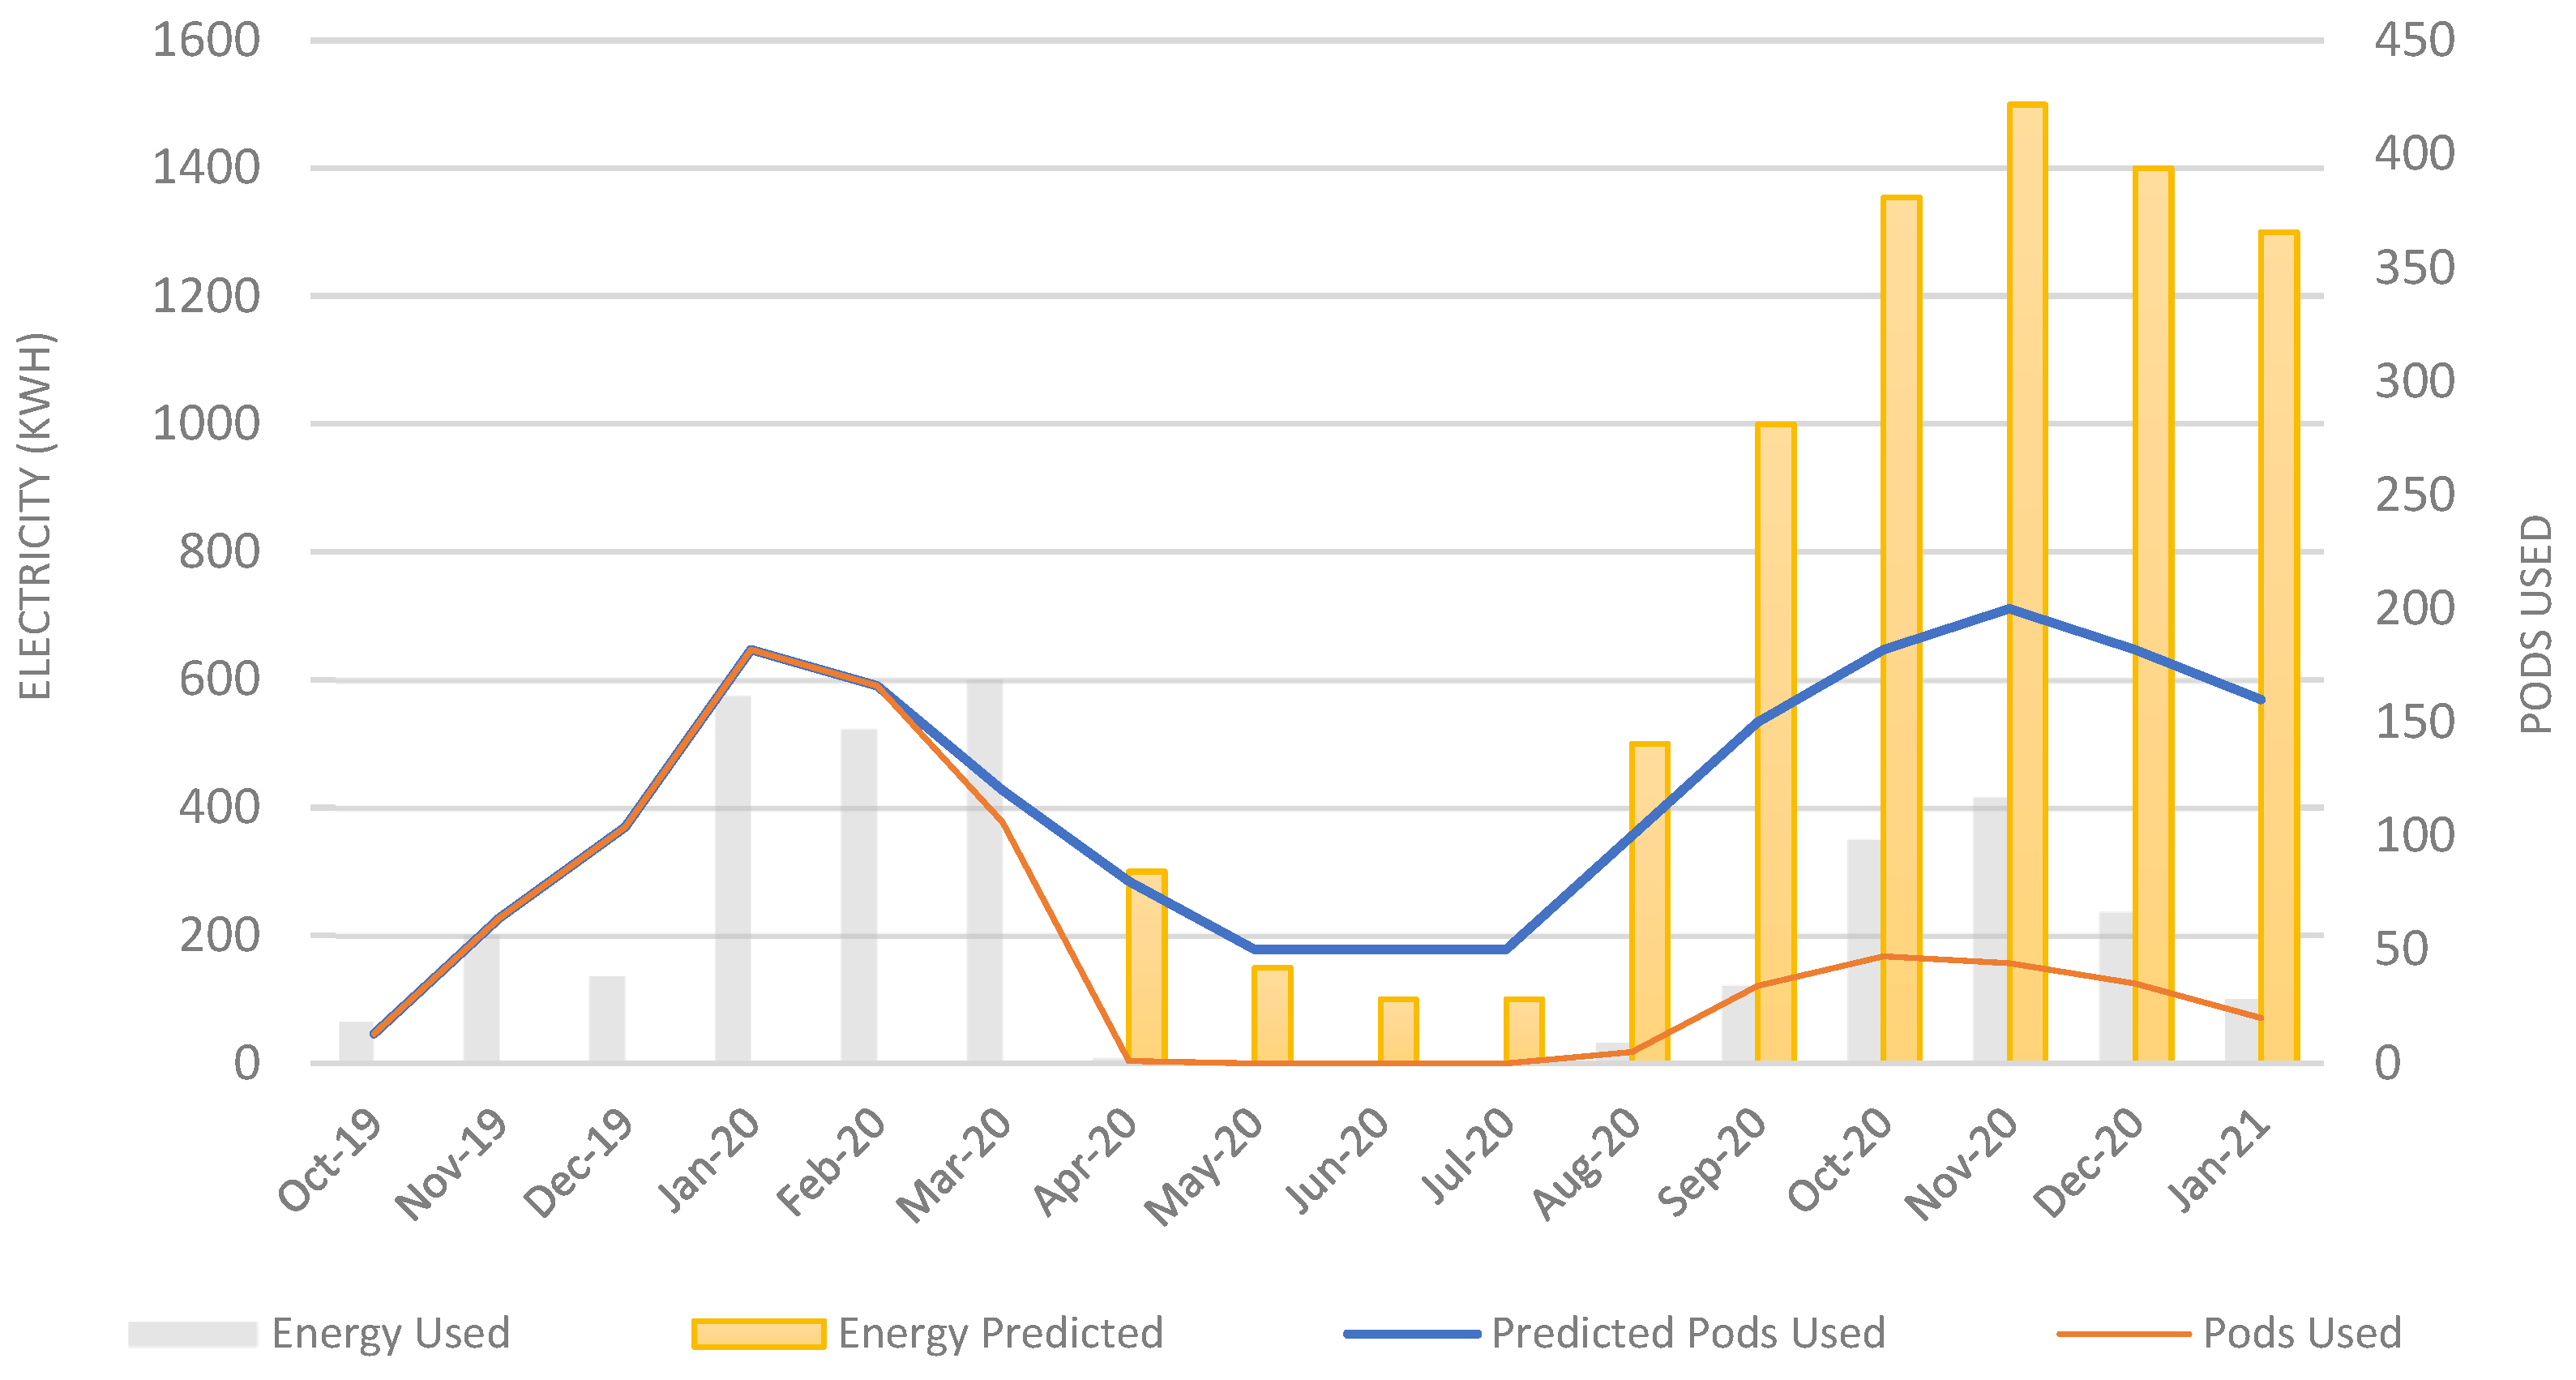
| Month | Energy Used (kWh) | Number Pods Used |
|---|---|---|
| Oct-19 | 65 | 13 |
| Nov-19 | 201 | 64 |
| Dec-19 | 136 | 104 |
| Jan-20 | 574.76 | 182 |
| Feb-20 | 522.6 | 166 |
| Mar-20 | 602.3 | 106 |
| Apr-20 | 8 | 1 |
| May-20 | 0 | 0 |
| Jun-20 | 0 | 0 |
| Jul-20 | 0 | 0 |
| Aug-20 | 31.8 | 5 |
| Sep-20 | 121.6 | 34 |
| Oct-20 | 349.8 | 47 |
| Nov-20 | 416.1 | 44 |
| Dec-20 | 236.6 | 35 |
| Jan-21 | 100.6 | 20 |
| TOTAL | 3366.16 kWh | |
| Year (August to July) | Electricity Generated on Site from Photovoltaic Panels (kWh) |
|---|---|
| 2012/13 | 0 |
| 2013/14 | 12,570 |
| 2014/15 | 29,119 |
| 2015/16 | 41,855 |
| 2016/17 | 34,182 |
| 2017/18 | 58,442 |
| 2018/19 | 153,852 |
| 2019/20 | 158,746 |
| Phase | Total Annual Yield (kWh) |
|---|---|
| 1 | 1,454,736 |
| 2 | 682,949 |
| 3 | 1,573,113 |
| 4 | 1,924,561 |
| 5 | 8,485,451 |
| TOTAL | 14,120,810 |
| Method of Decrease | How | Amount GWh | Emissions ktCO2e |
|---|---|---|---|
| PV | Introduction of 75% of solar plans | 11.1 | 1.118 |
| Phasing out gas | Phasing out all 96% of gas, transferring to electricity | 16.3 | 3.570 |
| LED | 30% reduction in lighting consumption | 1.608 | 0.163 |
| Insulation | Reducing heating load of pre-1990 buildings by 50% | 1.642 | 0.167 |
| Phasing out oil | All oil use to be discontinued | 0.518 | 0.133 |
| Old electric heating | Heat pumps swapped in, saving 70% of electric heating load | 1.325 | 0.135 |
| Grid Reduction | Conversion factor falls by 77% since 2012/13 | - | 8.508 |
| TOTAL Reduction | 32.493 | 13.9 |
Publisher’s Note: MDPI stays neutral with regard to jurisdictional claims in published maps and institutional affiliations. |
© 2022 by the authors. Licensee MDPI, Basel, Switzerland. This article is an open access article distributed under the terms and conditions of the Creative Commons Attribution (CC BY) license (https://creativecommons.org/licenses/by/4.0/).
Share and Cite
Chaplin, G.; Dibaj, M.; Akrami, M. Decarbonising Universities: Case Study of the University of Exeter’s Green Strategy Plans Based on Analysing Its Energy Demand in 2012–2020. Sustainability 2022, 14, 4085. https://doi.org/10.3390/su14074085
Chaplin G, Dibaj M, Akrami M. Decarbonising Universities: Case Study of the University of Exeter’s Green Strategy Plans Based on Analysing Its Energy Demand in 2012–2020. Sustainability. 2022; 14(7):4085. https://doi.org/10.3390/su14074085
Chicago/Turabian StyleChaplin, George, Mahdieh Dibaj, and Mohammad Akrami. 2022. "Decarbonising Universities: Case Study of the University of Exeter’s Green Strategy Plans Based on Analysing Its Energy Demand in 2012–2020" Sustainability 14, no. 7: 4085. https://doi.org/10.3390/su14074085
APA StyleChaplin, G., Dibaj, M., & Akrami, M. (2022). Decarbonising Universities: Case Study of the University of Exeter’s Green Strategy Plans Based on Analysing Its Energy Demand in 2012–2020. Sustainability, 14(7), 4085. https://doi.org/10.3390/su14074085