Abstract
China’s carbon reductions are of great significance to the realization of global temperature control targets. Carbon emission intensity (CEI) represents the degree of coordination between emissions and economic development to some extent. Nevertheless, there is a paucity of research on its spatial–temporal evolution and regional differences. To fill the gap, this study exploits the Theil index to shed light on the characteristics of its spatial–temporal distribution and regional disparities in China during the period of 2000–2019, and constructs a multi-regional spatial index decomposition model to analyze the differences in its drivers. The results indicate that the decreasing CEI during the period of 2000–2019 shows a distinctive imbalance in spatial–temporal distribution. The gap between north and south is greater than that between east and west. The expansion of the Theil index based on CEI reveals a widening tendency of the mismatch between emissions and economic development among provinces. CEI disparity is mainly due to growing intraregional differences. For most provinces, the energy intensity effect is the essential driver of spatial differences regarding CEI, with the energy structure and the industrial structure effects gradually changing from promoting to inhibiting effects. The carbon emission factor effect has no significant fluctuation, but regional differences are distinct.
1. Introduction
In recent decades, the high-speed economic development of China has been accompanied by a high-intensity consumption of resources, massive consumption of fossil energy, and rapid growth of pollutants and carbon dioxide emissions (CO2). As the world’s leading CO2 emitter [1], the share of China’s carbon emissions in global emissions reached 27.8% in 2018 [2]. The dramatic increase in carbon emissions in China has attracted more attention. Compared with western countries, China is under tremendous pressure to reduce carbon emissions and has adopted a series of aggressive carbon reduction plans. In this context, the Chinese government has committed to reduce the intensity of carbon emissions by 60–65% in 2030 compared to 2005 [3,4,5]. In particular, China proclaimed in 2020 that it would achieve a peak in CO2 emissions by 2030 and strive to move toward carbon neutrality by 2060 [6,7,8].
To achieve emission reduction targets and commitments, the Chinese government has been actively taking countermeasures to address the aggravating challenge of carbon emissions. Through a package of initiatives, including industrial transformation and upgrading [9], energy restructuring [10], and technological innovation [11], China has achieved prominent performance in carbon emission control. China’s carbon intensity decreased by 29.14% in 2007–2012 [12]. By the end of 2019, the goal to reduce carbon emission intensity (defined as carbon emissions per unit of gross domestic product) by 40–45% in 2020 had been achieved ahead of schedule. Although China has made impressive gains in reducing carbon emissions, it remains a huge challenge to further push emission reductions with the slowdown of carbon emission intensity (CEI) reduction. In particular, it has escalated the challenges of reducing emissions in light of the dramatic divergences in resource endowments, economic development, and energy consumption structures among provinces. In this context, it is necessary to gain an in-depth understanding of the characteristics and differences in the spatial–temporal distribution of CEI among provinces.
As a synthesis of energy structure, technology level, and industrial structure, carbon emission intensity represents, to some extent, the relationship between carbon emission and economic–social development. Hence, CEI is an essential benchmark for the formulation of emission reduction policies and initiatives, which are also in line with the emission reduction targets committed by the Chinese government to the international community. In the new normal stage of development characterized by growth slowdown in China [13], shedding light on the sources of interprovincial differences in CEI can clarify the geographic regions with greater potential for emission reduction and guide the design of emission reduction strategies. It is of utmost significance to investigate the spatial–temporal characteristics and inequality in CEI for the formulation of scientific energy conservation and emission reduction solutions.
Therefore, this study is dedicated to revealing the evolutionary path, regional differences, and driving force changes in carbon intensity in China during the period of 2000–2019 in order to provide support and reference for the achievement of China’s carbon reduction targets. Given the concerns, this study adopts CEI as an indicator reflecting the degree of coordination between economic development and emission levels, and attempts to unveil the disparity in CEI and its spatial–temporal distribution characteristics among provinces in China, as well as to further reveal the factors influencing CEI.
The main contributions and innovations of this study are as follows: (1) The temporal–spatial evolution characteristics of the CEI in China during the period of 2000–2019 are analyzed. Based on the Theil index, the trends of CEI disparities at the provincial level are dissected, and the mechanism of the role of intraregional and interregional differences in the total disparities is revealed. (2) By constructing a multi-regional spatial index decomposition analysis (M-R&S-IDA) model, this study explores the mechanism of factors influencing CEI, analyzes the differences in influencing factors at different spatial–temporal scales, and uncovers the underlying mechanism of CEI changes in a more comprehensive manner. (3) Relevant countermeasures are proposed based on empirical results, which provide support for the formulation of effective emission reduction in different regions and provide a basis for policy makers to fulfill emission reduction commitments.
2. Literature Review
CEI is not only a critical indicator in energy saving and emission reduction but also an effective reference for measuring the degree of low-carbon development. Research regarding the issue of regional disparities in CEI or carbon emissions is mainly divided into two categories in terms of research methods: the Gini coefficient [14,15,16] and the Theil index [17,18,19,20]. Recently, some scholars have applied the above inequality index to measure regional carbon emission disparity and explore the sources of inequality [21]. More specifically, Wang and Zhou [22] employed the Theil index and the IDA model to explore global carbon emission disparity during the period of 1995–2009. The results showed that the global carbon emissions disparity originates mainly from emerging economies, especially China and India. Based on the Theil index and Kaya identity, Pakrooh et al. [19] identified provincial differences in carbon emissions in Iran’s agricultural sector and further analyzed their drivers. Bianco et al. [23] revealed the inequality in energy and carbon emissions in the EU during the period of 2008–2016 via the Theil index. The results indicated that carbon emission disparity remained relatively stable over the study period and that the gross domestic product (GDP) was the main driver. Studies exploring spatial differences and spatial–temporal heterogeneity in carbon emissions also include [24,25,26].
However, it is not meaningful to solely measure the inequality in CEI or carbon emissions. Both policy makers and academics are actively exploring the causes of inequality to find an optimal action plan [27]. Consequently, it is more valuable to recognize the driving forces of carbon emission differences using appropriate methods. Currently, many scholars are focusing on the dynamic changes and factors that influence carbon emissions, and research methods include index decomposition methods [27,28,29,30,31], structural decomposition methods [28,32,33,34,35], and econometric regression analysis based on the STIRPAT model [36,37,38]. For example, based on multiplicative structural decomposition analysis (SDA), Su and Ang [12] proposed an aggregated embodied intensity indicator to analyze CEI from the demand perspective. Wang et al. [39] utilized a multi-regional SDA to discover the drivers of CEI at the global level, as well as at the national level.
However, the update cycle of the input–output tables on which SDA relies is long, and it is difficult to obtain data for the most recent year. In contrast to SDA, index decomposition analysis (IDA) allows for long-term, continuous time-series comparative analysis [40]. Given the flexibility and data requirements of IDA, IDA has been increasingly used in the field of energy research and carbon emissions. To eliminate the underlying impact of geographic regions, some scholars employ intensity indicators rather than absolute indicators to represent specific regional carbon emissions. Subsequently, an increasing number of studies have applied IDA to explore the drivers of IDA in multiple regions [41,42,43]. For example, Xu et al. [44] decomposed the influencing factors of national CEI at the multi-regional level and found that developed regions in China have a significant inhibitory effect on national CEI and that energy intensity exerts a noticeable impact on national carbon intensity. To better understand the CEI of the production-based and consumption-based sides, Xiao et al. [45] applied IDA to probe the changes in CEI influencing factors at global and national scales. Pan et al. [46] analyzed the influencing factors of CEI in 29 provinces of China during the period of 1998–2019, shedding light on the regional differences in technological progress, industrial structure, and regional scale effects.
Furthermore, Su and Ang [47] defined two types of decomposition analysis: temporal decomposition analysis and spatial decomposition analysis. With the expansion of regional differences, some scholars have dedicated themselves to exploring regional heterogeneity regarding the factors influencing carbon emissions based on spatial decomposition analysis [21,23,27,40]. Li et al. [48] explored the evolution of CO2 emission drivers using improved spatial IDA from national and regional perspectives in China. The results indicated that energy efficiency and economic scale are the leading contributors to the regional disparity in CO2 emissions. Based on panel data from Chinese provinces from 2000 to 2015, Song et al. [49] uncovered regional differences in CEI and the dynamics of influencing factors by applying temporal–spatial IDA.
Nowadays, there is still a need to further deepen the research on the evolutionary path of CEI and regional differences in China. The literature on CO2 emission reduction in China mostly applies the total carbon emissions as an indicator to measure the level of CO2 emission; however, another accounting indicator for carbon emission control targets and 2030 emission reduction commitment is CEI. For this reason, it is more meaningful to investigate the regional differences in China from the perspective of CEI. Furthermore, the available studies are mostly conducted from a national or regional perspective, which can reflect the evolution of the general national CEI, but it is difficult to reveal the disparities in provinces. For countries such as China, where there are significant regional differences, it is of more practical value to discover provincial disparity in carbon emissions. Finally, to accurately grasp the CEI of each province, it is also necessary to analyze the evolutionary path of province-level CEI with respect to the temporal–spatial dimension. To fill the gap, this article explores the path of CEI evolution in Chinese provinces and applies the Thiel index to reveal the main sources of regional disparity. Then, based on the M-R&S-IDA model, the influencing factors of CEI in each region and province are identified to disclose their changing dynamics.
3. Methodology and Data
3.1. Estimation of CO2 Emissions
To calculate CEI, we need to gain access to carbon emissions. According to the principles outlined by the Intergovernmental Panel on Climate Change (IPCC), carbon emissions are calculated by the following formula:
where C is CO2 emissions; k is the energy type; E is the consumption of the kth energy, obtained from the “Regional Energy Balance Sheet” in the China Energy Statistical Yearbook; NCV is the net calorific value of the kth energy, taken from the China Energy Statistical Yearbook; CEF is the carbon emission coefficient, obtained from IPCC 2006; and COF is the carbon oxidation factor. In this study, the energy types include raw coal, coke, crude oil, gasoline, kerosene, diesel, fuel oil, and natural gas.
3.2. Theil Index Decomposition
The Theil index is employed to further analyze the regional disparity and the magnitude of changes in CEI. The advantages of the Theil index, which can be fully group decomposed, are that it can fully decompose the aggregate regional inequality into internal and external differences at different spatial scales and accurately measure the contribution of its components. Therefore, the aggregate disparity index of CEI in China can be divided into within-group and between-group indexes [23,50]. The basic expression of the Theil index of CEI is
where t is the year, and and are the gross product and carbon emissions of province j in region i, respectively. and denote national-level GDP and total carbon emissions in year t.
Equations (3) and (4) represent the within-group and between-group Theil indexes , respectively, which decompose to evaluate the impacts of regional variations on the total value in Equation (5) [21].
After measuring the disparity, the development trend of regional differences can be judged based on the time dimension. The smaller the value of the Theil index, the narrower the regional disparity; the larger the value, the wider the regional disparity.
3.3. The Multi-Regional Spatial IDA Model
Spatial decomposition analysis is applied to investigate the explanation for disparities in carbon emissions among different regions at a specific time. Generally, the spatial decomposition analysis model is categorized into the bilateral-regional (B-R) model, the radial-regional (R-R) model, and the multi-regional (M-R) model, and the advantages of M-R spatial index decomposition analysis (M-R&S-IDA) models have been discussed in the related literature [47,50]. Therefore, this study adopts the M-R spatial IDA, as shown in Figure 1, to research the spatial disparity in factors influencing CEI. Ri denotes any region, and a is the reference region whose attribute is provided by the average of regions. Given the lack of energy data for Ningxia in 2000–2002, in this work, the average CEI of China in 2005 is regarded as the reference region.
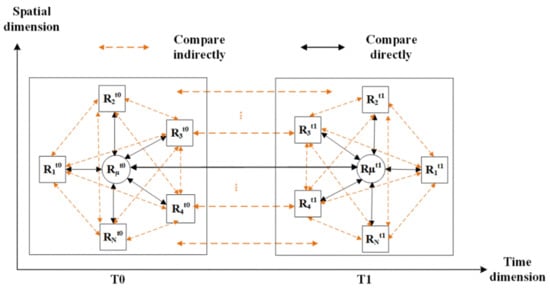
Figure 1.
Multi-regional spatial decomposition model.
Based on the Kaya identity [10,46], the carbon intensity of each province or region is decomposed into the following factors:
where P is the industry (i.e., the primary, secondary, and tertiary industries), CF is the carbon emission factor, ES is the energy structure, EI indicates the energy intensity, and IS represents the industrial structure.
The disparity in CEI between the target region or province and the benchmark region in a given year is calculated in the following equations [45]:
The disparity between two regions (R1 and R2) in year t0 in the influencing factor I (i.e., CF, ES, EI, IS) is given as [47]
Regarding the temporal change in a region R1 in the factors influencing I between year t0 and year t1, the difference can be shown as [47]
The same procedure can be applied to all other regions/provinces and periods.
3.4. Data Sources
This work is conducted in 30 provinces of China (excluding Tibet, Taiwan, Hong Kong, and Macau for reasons of data availability). The time span is 2000–2019. The data involved in the model include CO2 emissions, GDP, energy consumption, energy structure, and the industrial structure of 30 provinces. Among them, the data of energy consumption associated with the calculation of carbon emissions and energy structure are obtained from the China Energy Statistical Yearbook (2001–2020), and all kinds of energy consumption data are converted into standard coal. The GDP of each province is collected from the China Statistical Yearbook (2000–2019) and converted into constant prices in 2000. The industrial structure of each province is the share of the three industries in GDP (i.e., primary industry, secondary industry, and tertiary industry), and the data are taken from the China Statistical Yearbook.
In light of the comprehensive factors concerning economic and social development and geographical location, the 30 provinces are divided into six regions (see Figure 2), namely, northeast, north, east, central-south, southwest, and northwest.
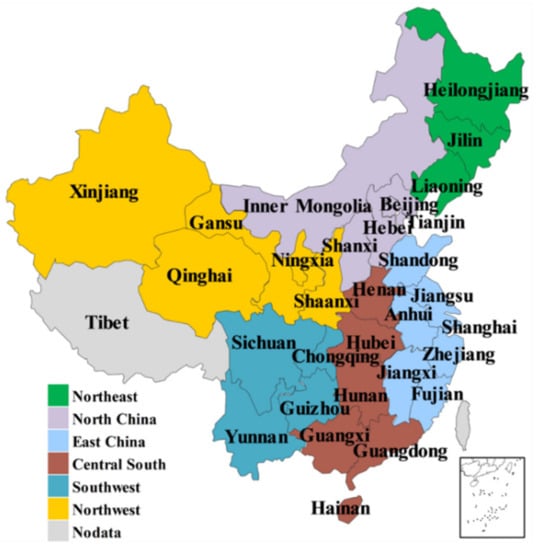
Figure 2.
The regional division of 30 provinces in China.
4. Results and Discussions
4.1. Analysis of the Spatial–Temporal Disparity in CEI
Figure 3 and Figure 4 present the spatial–temporal evolutionary paths of CEI for each province from 2000 to 2019. Generally, China’s CEI showed a pronounced downward trend from 2000 to 2019, with distinct differences among provinces. From a dynamic perspective, CEI showed an upward trend during the period of 2000–2005, peaking at approximately 4 t/104 CNY. During the period of 2005–2019, the CEI in China experienced a rapid decline, especially from 2005 to 2010, and, thereafter, the decline began to slow down. The phenomenon above is attributed to the fact that during the 10th Five-Year Plan (2000–2005), China was in the rapid industrial development stage. Therefore, the growth of the economy was heavily dependent on large-scale resource consumption, coupled with inefficient technology management and a sloppy development pattern, which generated substantial carbon emissions. Afterward, the Chinese government began to emphasize energy conservation and emission reduction, and China’s CEI presented a significant reduction. Up to 2019, China’s CEI dropped by more than 45% from 2005 (from 3.926 t/104 CNY to 1.938 t/104 CNY), reaching the 2020 reduction target earlier than expected.
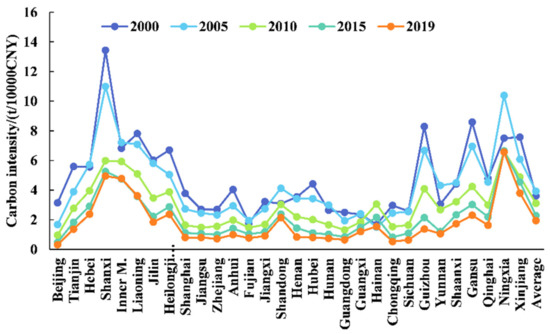
Figure 3.
The evolution of carbon intensity in 30 provinces.
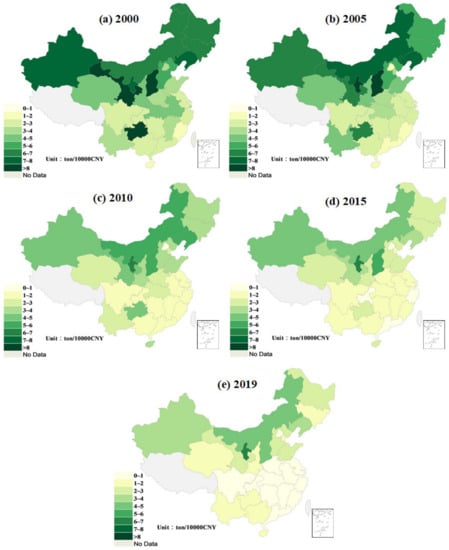
Figure 4.
The spatial evolution of carbon intensity in 30 provinces: (a) carbon intensity in 2000; (b) carbon intensity in 2005; (c) carbon intensity in 2010; (d) carbon intensity in 2015; (e) carbon intensity in 2019.
Concerning regional differences, CEI showed a reduction from the west to east and from the north to south in general. CEI stabilized in the east (except Shandong), central-south (except Guangxi), and Beijing–Tianjin regions. CEI in the north and northeast dropped unremarkably from 2015 to 2019 after a dramatic decline during the period of 2000–2015. However, the CEI of most provinces in the northwest and southwest is continuously decreasing, which is related to the gradual optimization of the regional industrial structure and the increasingly scientific pattern of economic development. Interestingly, CEI in the northwest and north increased and then decreased during the period of 2000–2005. This phenomenon is attributed to the fact that the regions mentioned above gave insufficient priority to the industrial structure and scientific development. Consequently, the growth of carbon emissions exceeded that of the national economy, which led to an upward trend of carbon intensity. Since 2005, the industrial structure of northern and northwestern provinces has been gradually considered, and an increasingly scientific development strategy has been accepted and applied, resulting in a slight decrease in carbon intensity. However, there are still a few provinces, such as Ningxia, Shanxi, and Inner Mongolia, whose CEI remains high. Uniquely, Hainan showed an upward trend in its CEI during the period of 2000–2019.
With respect to provincial perspectives, most provinces show a considerable downward trend, yet there are tremendous spatial disparities. In 2000, there were eight provinces with a CEI greater than 6 t/104 CNY, namely, Shanxi, Gansu, Inner Mongolia, Ningxia, Xinjiang, Guizhou, Heilongjiang, and Liaoning, most of which are located in the northern region (northwest, north China, and northeast). Only Fujian and Hainan were the provinces with a CEI below 2 t/104 CNY. In this sense, the CEI of Shanxi, which is the highest, is 7.6 times higher than that of Fujian, which has the lowest intensity. In 2010, there were three provinces with a CEI of about 6 t/104 CNY, namely, Ningxia, Shanxi, and Inner Mongolia. During this period, Beijing, the most impressive performer, experienced a sharp decline. By 2019, the CEI of all provinces in the eastern and central-south regions had fallen below 2 t/104 CNY, with the exception of Shandong. The highest CEI is in Ningxia and the lowest is in Beijing, with the former being 20.7 times higher than the latter. It is clear that the CEI in China shows a pronounced difference of “high in the west and low in the east” and “high in the north and low in the south”, and the difference between the north and south is even wider than that between the east and west.
The differences in the spatial–temporal distribution of CEI are intimately associated with economic development, technological constraints, and resource endowment. Provinces with a low CEI, such as Beijing, Tianjin, Shanghai, and Chongqing, boast highly developed economies (shown in Figure 5) and are typical energy-importing provinces. The provinces of Shandong, Guangdong, and Zhejiang, in contrast, generate a lower CEI despite their massive carbon emissions, primarily owing to their vast economic scale. The provinces with a high CEI are mostly located in the west and north (e.g., Liaoning, Shanxi, and Hebei), which are the main coal bases of China and are typically energy-exporting provinces. Provinces such as Shanxi, Inner Mongolia, Ningxia, Jilin, and Hebei, where the proportion of coal exceeds 70%, are excessively dependent on resources and heavy industry for their economic development, and they suffer from low energy efficiency and high carbon emissions.
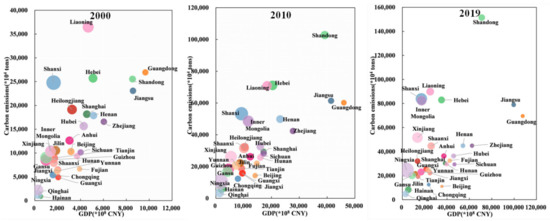
Figure 5.
Distribution of GDP and carbon emissions in 30 provinces (in 2000, 2010, and 2019). Note: The size of the circle represents CEI. The higher the CEI, the larger the circle.
Given the disparity in CEI across provinces, applying the Theil index to measure the gap allows for an understanding of the dynamic relationship between economic growth and carbon emissions in different regions. Figure 6 presents the disparity in CEI across Chinese provinces over the period of 2000–2019. In general, the disparity in CEI across China’s provinces showed an upward trend, especially after 2010, when the gap widened significantly. The Theil index increased from 0.1143 in 2000 to 0.1999 in 2020. As seen in Figure 6, the expansion of such inequality is predominantly triggered by the increasing within-group disparity. In 2019, within-group differences contributed more than 55% to aggregate inequality. Furthermore, the between-group Theil index showed a decreasing trend, indicating that within-group CEI diverged heavily.
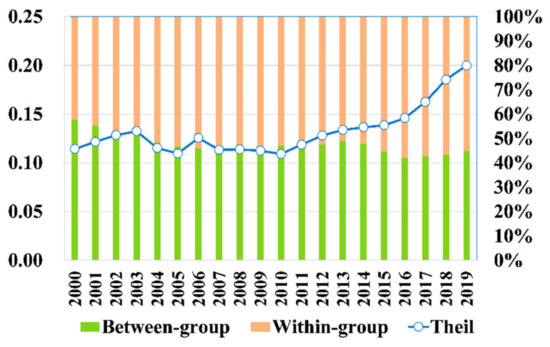
Figure 6.
The evolution of CEI disparity among provinces in China (2000–2019).
Figure 7 presents the trend regarding the contribution of regional CEI disparities to aggregate disparity. The Theil index exhibits distinct features in each region. The contribution of regional disparities concerning CEI to aggregate disparity varies dramatically. The northern region consistently contributes the most, with a solid share of some 35%. The contribution of the northwest region has been increasing since 2005, while that of the northeast and east has been decreasing year by year. Throughout the study period, the Theil index in the southwest remained fairly flat, and the contribution rate was rather moderate, indicating that the CEI in this region was rather balanced.
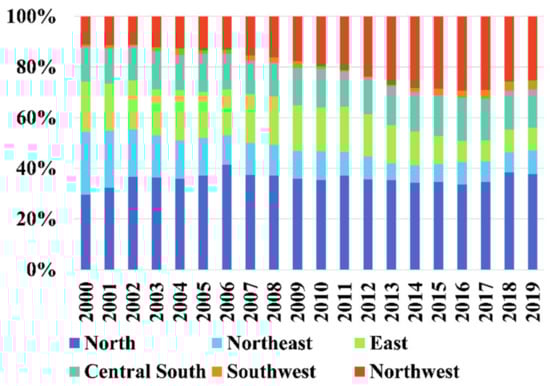
Figure 7.
Contribution of regional differences to aggregate disparity.
4.2. Analysis of the Decomposition of the Regional Carbon Intensity Dynamics
The specific spatial decomposition results for each region are shown in Figure 8. The influencing factors of CEI in each region are compared with the reference region. Regarding the decomposition results, if the decomposition value of the influencing factor is less than 1, it implies that the factor-induced reduction in CEI and the region performs better than the reference region; if the decomposition value is greater than 1, it denotes that the effect leads to an increase in CEI and that the region performs worse than the reference region.
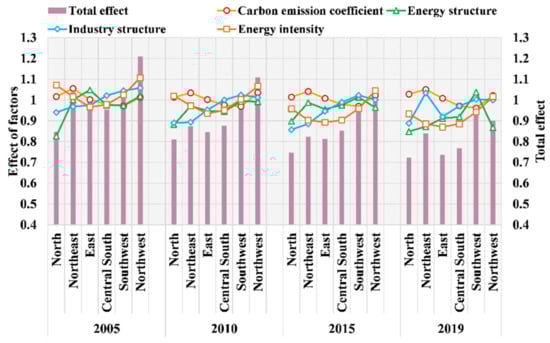
Figure 8.
Results of the spatial decomposition of the factors influencing regional CEI.
Regarding energy intensity, the effect of energy intensity is greater than 1 for all regions (except for certain years), with the exception of the eastern and central-south regions, indicating that such regions are lagging behind the performance of the reference regions. This phenomenon is particularly apparent in the northwest. It is primarily ascribed to the relatively underdeveloped economy of the northwest, the high proportion of resource-intensive enterprises, and the heavy dependence of the economy on energy. Consequently, energy intensity plays a catalytic role in carbon emission intensity. In contrast, the value of the energy intensity effect in the northeast was greater than 1 before 2015, but this effect declined annually and dropped to 0.9959 in 2015. This change reveals that the performance of energy intensity in the northeast has exceeded that of the reference region in recent years.
Concerning the energy structure, the effect of the energy structure exceeds that of the reference in all regions apart from the northwest, southwest, and northeast. Despite the effects’ values being greater than 1 in the northwest and northeast from 2000 to 2015, fortunately, they began to be less than 1 in 2019 for both of these regions, implying that through continuous countermeasures and technologies regarding energy conservation and emission reduction, the performance of the above regions began to surpass that of the reference regions. In particular, the value of the energy structure effect in the southwest region increased from 0.9749 in 2000 to 1.0773 in 2019, indicating that the energy mix effect in the region promoted the growth of carbon intensity. Accordingly, provinces in the southwest, such as Yunnan and Guizhou, should pay more attention to optimizing the energy structure along with economic development. The northern, eastern, and south-central regions generally perform better than the reference region with respect to the energy structure.
For carbon emission factors, the decomposition values of the north, northeast, and northwest are consistently greater than 1, which denotes that the regions perform behind the reference. Their counterparts in the central-south and southwest regions are in the opposite direction. Although the values for the eastern region are greater than 1, the effect is rather weak (from 1.0022 to 1.0071), indicating that the effect of carbon emission factors in the east is almost close to the reference region.
As for the industrial structure, the north, northeast, and east regions outperformed the reference regions, with the exception of the northeast in 2019. The opposite is true for the central-south, southwest, and northwest. It should be noted that the effect in the central and southwest regions shows a downward trend, while its counterparts in the northwest are increasing annually. This reflects that the industrial structure of the northwest is critically hindering the reduction in its carbon intensity.
4.3. Decomposition Analysis of Provincial Carbon Intensity Dynamics
Figure 9 presents the spatial decomposition results of the carbon intensity for 30 provinces within the six regions in China in 2005, 2010, 2015, and 2019. Most provinces, in general, experienced a decreasing trend in carbon intensity. This indicates that the provinces perform better than the reference region in terms of carbon intensity, except for only a few provinces such as Ningxia, Xinjiang, Shanxi, Gansu, Inner Mongolia, Hebei, and Liaoning.
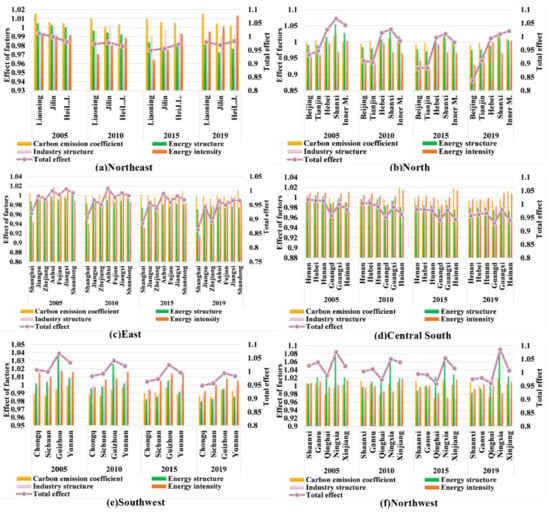
Figure 9.
Results of the spatial decomposition of the factors influencing provincial CEI: (a) decomposition results of CEI in the northeast; (b) decomposition results of CEI in the northwest; (c) decomposition results of CEI in the east; (d) decomposition results of CEI in the south; (e) decomposition results of CEI in the southwest; (f) decomposition results of CEI in the northwest.
Regarding the factors influencing carbon intensity, energy intensity plays a positive part in promoting the reduction in aggregate carbon intensity, excluding in Hebei, Inner Mongolia, Heilongjiang, Hainan, and Xinjiang. Similarly, the energy mix effect suppresses the growth of carbon intensity in most provinces (especially in Beijing and Tianjin), with the exception of Hebei, Shanxi, Inner Mongolia, Guizhou, Qinghai, Ningxia, and Xinjiang. The effect of the industrial structure is an essential engine to boost the growth of carbon intensity in provinces such as Shanxi, Hebei, Chongqing, Sichuan, Shanxi, and Qinghai in 2019. Despite curbing the carbon intensity growth in many provinces other than Liaoning, Shanxi, Shandong, and Ningxia, the carbon emission factor effect is quite limited.
4.4. Policy Implementation
Policy recommendations include (1) the optimization of the energy structure and upgrade the efficiency and performance of energy utilization, and the further promotion of the development of clean energy to reduce the proportion of coal and other high-carbon sources in energy consumption and to achieve a cleaner energy supply. Specifically, this involves developing hydropower and nuclear energy in the southwest, photovoltaic and wind power in the northwest, north, northeast, etc. However, emission reduction technologies should be innovated and clean and sustainable development mechanisms should be conducted. Aggressive actions should be adopted to accelerate the development of renewable energy technologies and the efficient utilization of coal technologies. It is imperative to accelerate the development and innovation of carbon capture and storage technologies.
They also include (2) the promotion of the upgrading of industrial structure and the enacting of location-based countermeasures to control carbon intensity. For provinces with high carbon intensity (e.g., Ningxia, Shanxi, and Hainan), it is urgent to optimize and upgrade the industrial structure, change the trade pattern of resource-intensive products, and break the “spatial lock” of high carbon intensity. Simultaneously, this should enhance the transformation of traditional heavy industries to low-pollution industries, eliminate backward production capacity, and suppress the convergence effect of carbon intensity on the share of carbon emissions. Moreover, the exchange and cooperation between developed regions (e.g., Beijing and Zhejiang) and undeveloped regions (e.g., Xinjiang and Ningxia) should be strengthened.
They also include (3) the strengthening of the coordination of regional development and the constructing of a cross-regional mechanism for carbon reduction to narrow the gap among regions. Regarding regions with notable spatial aggregation of carbon emissions, such as the five northwestern provinces, Hebei, and Shanxi, a sound cross-regional functional layout and collaborative governance should be conducted. By creating an efficiently coordinated development mechanism to control the carbon intensity of the aggregation area, the division of labor and optimal combination of resources among different functional districts will be attained. Furthermore, by facilitating the integration of regional development, the dispersion effect of regional carbon intensity on carbon emission share will be further reinforced. Additionally, the establishment of a carbon trading market mechanism should be hastened by making the most of market-based instruments.
5. Conclusions
As the main driver of global warming, carbon emissions have been a focus of high concern in economic, social, and environmental areas. China has actively taken countermeasures to address the aggravating challenge of carbon emissions and has made a significant contribution to the achievement of global carbon reduction targets. This study measured the spatial–temporal evolution characteristics of energy-related CEI for 30 provinces in China during the period of 2000–2019. In addition, the Theil index was applied to portray the disparities in CEI among the possible provinces. Furthermore, a multi-regional spatial IDA model was constructed to unveil the factors influencing CEI in each province. Based on the results, the main conclusions obtained are as follows:
(1) The majority of provinces, excluding Hainan, Ningxia, Shanxi, and Xinjiang, experienced a significant downtrend in CEI during the period of 2000–2019. Nevertheless, the spatial–temporal distribution of CEI features a dramatic unevenness, which is characterized by the coexistence of “high in the west and low in the east” and “high in the north and low in the south”, and the gap between the north and the south appears to be substantially greater than that between the east and the west.
(2) The expansion of the Theil index based on the CEI of 30 provinces has been pronounced since 2010, indicating that the inconsistency between carbon emissions and economic development has strengthened. Therefore, there is still substantial potential to boost the coordination of regional economic and environmental protection in China. Disparities in CEI primarily originate from within-group differences, and their contribution to the aggregate disparity tends to ascend annually. Meanwhile, the contribution rates of the northeast and east keep decreasing and, in contrast, that of the west has been expanding in recent years.
(3) Regarding the factors influencing CEI, for the majority of provinces/regions, the energy intensity effect is the most essential driver for the spatial disparity in carbon intensity, especially in the northwest. Generally, the energy structure effect and the industrial structure effect have changed gradually from facilitating effects to suppressing effects accordingly. Remarkably, the energy structure effect in the southwest has converted to promote CEI growth from 2000 to 2019. Consequently, Yunnan, Guizhou, and other southwestern provinces should pay more attention to optimizing the energy structure with their economic development. Although there is no considerable fluctuation in the carbon emission factor effect in all regions/provinces, the east and central-south perform better than the three northern regions.
Despite the regional disparity in CEI and the driving factors that were discussed in depth in this study, certain issues still need to be further explored. First, given the data limitations, the geographical units selected for the study lie in the provinces only. It is necessary to conduct research on the scale of cities or smaller. Second, considering the great differences in the influencing factors of CEI in different industries, it will be better to conduct research in different industries, which can enhance the accuracy of energy saving and emission reduction solutions for the industries.
Author Contributions
Conceptualization, Y.L. and M.Y.; methodology and writing, M.Y.; software, F.C. and J.T.; data curation and formal analysis, P.S. All authors have read and agreed to the published version of the manuscript.
Funding
This research was funded by the National Natural Science Foundation of China, grant number No. 71871014.
Institutional Review Board Statement
Not applicable.
Informed Consent Statement
Not applicable.
Data Availability Statement
Not applicable.
Conflicts of Interest
The authors declare no conflict of interest.
References
- Wang, Y.; Yang, H.; Sun, R. Effectiveness of China’s Provincial Industrial Carbon Emission Reduction and Optimization of Carbon Emission Reduction Paths in “Lagging Regions”: Efficiency-Cost Analysis. J. Environ. Manag. 2020, 275, 111221. [Google Scholar] [CrossRef]
- Yang, H.; Lu, Z.; Shi, X.; Mensah, I.A.; Luo, Y.; Chen, W. Multi-Region and Multi-Sector Comparisons and Analysis of Industrial Carbon Productivity in China. J. Clean. Prod. 2021, 279, 123623. [Google Scholar] [CrossRef]
- Yang, C.; Hao, Y.; Irfan, M. Energy Consumption Structural Adjustment and Carbon Neutrality in the Post-COVID-19 Era. Struct. Chang. Econ. Dyn. 2021, 59, 442–453. [Google Scholar] [CrossRef] [PubMed]
- Yang, L.; Yang, Y.; Zhang, X.; Tang, K. Whether China’s Industrial Sectors Make Efforts to Reduce CO2 Emissions from Production?—A Decomposed Decoupling Analysis. Energy 2018, 160, 796–809. [Google Scholar] [CrossRef]
- Yu, A.; Lin, X.; Zhang, Y.; Jiang, X.; Peng, L. Analysis of Driving Factors and Allocation of Carbon Emission Allowance in China. Sci. Total Environ. 2019, 673, 74–82. [Google Scholar] [CrossRef]
- Qiu, S.; Lei, T.; Wu, J.; Bi, S. Energy Demand and Supply Planning of China through 2060. Energy 2021, 234, 121193. [Google Scholar] [CrossRef]
- Ren, F.; Long, D. Carbon Emission Forecasting and Scenario Analysis in Guangdong Province Based on Optimized Fast Learning Network. J. Clean. Prod. 2021, 317, 128408. [Google Scholar] [CrossRef]
- Xu, W.; Xie, Y.; Xia, D.; Ji, L.; Huang, G. A Multi-Sectoral Decomposition and Decoupling Analysis of Carbon Emissions in Guangdong Province, China. J. Environ. Manag. 2021, 298, 113485. [Google Scholar] [CrossRef] [PubMed]
- Mao, Z.; Bai, Y.; Meng, F. How Can China Achieve the Energy and Environmental Targets in the 14th and 15th Five-Year Periods? A Perspective of Economic Restructuring. Sustain. Prod. Consum. 2021, 27, 2022–2036. [Google Scholar] [CrossRef]
- Wang, D.; He, W.; Shi, R. How to Achieve the Dual-Control Targets of China’s CO2 Emission Reduction in 2030? Future Trends and Prospective Decomposition. J. Clean. Prod. 2019, 213, 1251–1263. [Google Scholar] [CrossRef]
- Lv, Y.; Liu, J.; Cheng, J.; Andreoni, V. The Persistent and Transient Total Factor Carbon Emission Performance and Its Economic Determinants: Evidence from China’s Province-Level Panel Data. J. Clean. Prod. 2021, 316, 128198. [Google Scholar] [CrossRef]
- Su, B.; Ang, B.W. Multiplicative Structural Decomposition Analysis of Aggregate Embodied Energy and Emission Intensities. Energy Econ. 2017, 65, 137–147. [Google Scholar] [CrossRef]
- Fan, X.; Xu, Y.; Nan, Y.; Li, B.; Cai, H. Impacts of High-Speed Railway on the Industrial Pollution Emissions in China: Evidence from Multi-Period Difference-in-Differences Models. Kybernetes 2020, 49, 2713–2735. [Google Scholar] [CrossRef]
- Grunewald, N.; Jakob, M.; Mouratiadou, I. Decomposing Inequality in CO2 Emissions: The Role of Primary Energy Carriers and Economic Sectors. Ecol. Econ. 2014, 100, 183–194. [Google Scholar] [CrossRef] [Green Version]
- Mussini, M.; Grossi, L. Decomposing Changes in CO2 Emission Inequality over Time: The Roles of Re-Ranking and Changes in per Capita CO2 Emission Disparities. Energy Econ. 2015, 49, 274–281. [Google Scholar] [CrossRef]
- Liu, J.; Li, S.; Ji, Q. Regional Differences and Driving Factors Analysis of Carbon Emission Intensity from Transport Sector in China. Energy 2021, 224, 120178. [Google Scholar] [CrossRef]
- Chen, J.; Xu, C.; Cui, L.; Huang, S.; Song, M. Driving Factors of CO2 Emissions and Inequality Characteristics in China: A Combined Decomposition Approach. Energy Econ. 2019, 78, 589–597. [Google Scholar] [CrossRef]
- Cui, Y.; Khan, S.U.; Deng, Y.; Zhao, M. Spatiotemporal Heterogeneity, Convergence and Its Impact Factors: Perspective of Carbon Emission Intensity and Carbon Emission per Capita Considering Carbon Sink Effect. Environ. Impact Assess. Rev. 2022, 92, 106699. [Google Scholar] [CrossRef]
- Pakrooh, P.; Hayati, B.; Pishbahar, E.; Nematian, J.; Brännlund, E.R. Focus on the Provincial Inequalities in Energy Consumption and CO2 Emissions of Iran’s Agriculture Sector. Sci. Total Environ. 2020, 715, 137029. [Google Scholar] [CrossRef]
- Wang, S.; Wang, J.; Fang, C.; Feng, K. Inequalities in Carbon Intensity in China: A Multi-Scalar and Multi-Mechanism Analysis. Appl. Energy 2019, 254, 113720. [Google Scholar] [CrossRef]
- Wang, Y.; Yan, Q.; Li, Z.; Baležentis, T.; Zhang, Y.; Gang, L.; Streimikiene, D. Aggregate Carbon Intensity of China’s Thermal Electricity Generation: The Inequality Analysis and Nested Spatial Decomposition. J. Clean. Prod. 2020, 247, 119139. [Google Scholar] [CrossRef]
- Wang, H.; Zhou, P. Assessing Global CO2 Emission Inequality From Consumption Perspective: An Index Decomposition Analysis. Ecol. Econ. 2018, 154, 257–271. [Google Scholar] [CrossRef]
- Bianco, V.; Cascetta, F.; Marino, A.; Nardini, S. Understanding Energy Consumption and Carbon Emissions in Europe: A Focus on Inequality Issues. Energy 2019, 170, 120–130. [Google Scholar] [CrossRef]
- Wang, R.; Wang, Q.; Yao, S. Evaluation and Difference Analysis of Regional Energy Efficiency in China under the Carbon Neutrality Targets: Insights from DEA and Theil Models. J. Environ. Manag. 2021, 293, 112958. [Google Scholar] [CrossRef] [PubMed]
- Li, H.; Qiu, P.; Wu, T. The Regional Disparity of Per-Capita CO2 Emissions in China’s Building Sector: An Analysis of Macroeconomic Drivers and Policy Implications. Energy Build. 2021, 244, 111011. [Google Scholar] [CrossRef]
- Zhang, H.; Li, S. Carbon Emissions’ Spatial-Temporal Heterogeneity and Identification from Rural Energy Consumption in China. J. Environ. Manag. 2022, 304, 114286. [Google Scholar] [CrossRef] [PubMed]
- Liu, Y.; Wang, M.; Feng, C. Inequalities of China’s Regional Low-Carbon Development. J. Environ. Manag. 2020, 274, 111042. [Google Scholar] [CrossRef] [PubMed]
- Wang, C.; Zhan, J.; Li, Z.; Zhang, F.; Zhang, Y. Structural Decomposition Analysis of Carbon Emissions from Residential Consumption in the Beijing-Tianjin-Hebei Region, China. J. Clean. Prod. 2019, 208, 1357–1364. [Google Scholar] [CrossRef]
- Wang, H.; Ang, B.W.; Su, B. Assessing Drivers of Economy-Wide Energy Use and Emissions: IDA versus SDA. Energy Policy 2017, 107, 585–599. [Google Scholar] [CrossRef]
- Yang, Y.; Yuan, Z.; Yang, S. Difference in the Drivers of Industrial Carbon Emission Costs Determines the Diverse Policies in Middle-Income Regions: A Case of Northwestern China. Renew. Sustain. Energy Rev. 2022, 155, 111942. [Google Scholar] [CrossRef]
- Zhang, X.; Su, B.; Yang, J.; Cong, J. Index Decomposition and Attribution Analysis of Aggregate Energy Intensity in Shanxi Province (2000–2015). J. Clean. Prod. 2019, 238, 117897. [Google Scholar] [CrossRef]
- Sajid, M.J. Structural Decomposition and Regional Sensitivity Analysis of Industrial Consumption Embedded Emissions from Chinese Households. Ecol. Indic. 2021, 122, 107237. [Google Scholar] [CrossRef]
- Tian, K.; Dietzenbacher, E.; Yan, B.; Duan, Y. Upgrading or Downgrading: China’s Regional Carbon Emission Intensity Evolution and Its Determinants. Energy Econ. 2020, 91, 104891. [Google Scholar] [CrossRef]
- Wu, F.; Huang, N.; Zhang, Q.; Qiao, Z.; Zhan, N. Multi-Province Comparison and Typology of China’s CO2 Emission: A Spatial–Temporal Decomposition Approach. Energy 2020, 190, 116312. [Google Scholar] [CrossRef]
- Zheng, J.; Mi, Z.; Coffman, D.; Shan, Y.; Guan, D.; Wang, S. The Slowdown in China’s Carbon Emissions Growth in the New Phase of Economic Development. One Earth 2019, 1, 240–253. [Google Scholar] [CrossRef] [Green Version]
- Fang, K.; Li, C.; Tang, Y.; He, J.; Song, J. China’s Pathways to Peak Carbon Emissions: New Insights from Various Industrial Sectors. Appl. Energy 2022, 306, 118039. [Google Scholar] [CrossRef]
- Fang, K.; Tang, Y.; Zhang, Q.; Song, J.; Wen, Q.; Sun, H.; Ji, C.; Xu, A. Will China Peak Its Energy-Related Carbon Emissions by 2030? Lessons from 30 Chinese Provinces. Appl. Energy 2019, 255, 113852. [Google Scholar] [CrossRef]
- Wang, Z.; Zhang, B.; Liu, T. Empirical Analysis on the Factors Influencing National and Regional Carbon Intensity in China. Renew. Sustain. Energy Rev. 2016, 55, 34–42. [Google Scholar] [CrossRef]
- Wang, H.; Ang, B.W.; Su, B. A Multi-Region Structural Decomposition Analysis of Global CO2 Emission Intensity. Ecol. Econ. 2017, 142, 163–176. [Google Scholar] [CrossRef]
- Liu, X.; Peng, R.; Zhong, C.; Wang, M.; Guo, P. What Drives the Temporal and Spatial Differences of CO2 Emissions in the Transport Sector? Empirical Evidence from Municipalities in China. Energy Policy 2021, 159, 112607. [Google Scholar] [CrossRef]
- Chen, C.; Zhao, T.; Yuan, R.; Kong, Y. A Spatial-Temporal Decomposition Analysis of China’s Carbon Intensity from the Economic Perspective. J. Clean. Prod. 2019, 215, 557–569. [Google Scholar] [CrossRef]
- Liu, N.; Ma, Z.; Kang, J.; Su, B. A Multi-Region Multi-Sector Decomposition and Attribution Analysis of Aggregate Carbon Intensity in China from 2000 to 2015. Energy Policy 2019, 129, 410–421. [Google Scholar] [CrossRef]
- Yu, X.; Liang, Z.; Fan, J.; Zhang, J.; Luo, Y.; Zhu, X. Spatial Decomposition of City-Level CO2 Emission Changes in Beijing-Tianjin-Hebei. J. Clean. Prod. 2021, 296, 126613. [Google Scholar] [CrossRef]
- Xu, S.-C.; Han, H.-M.; Zhang, W.-W.; Zhang, Q.-Q.; Long, R.-Y.; Chen, H.; He, Z.-X. Analysis of Regional Contributions to the National Carbon Intensity in China in Different Five-Year Plan Periods. J. Clean. Prod. 2017, 145, 209–220. [Google Scholar] [CrossRef]
- Xiao, H.; Sun, K.-J.; Bi, H.-M.; Xue, J.-J. Changes in Carbon Intensity Globally and in Countries: Attribution and Decomposition Analysis. Appl. Energy 2019, 235, 1492–1504. [Google Scholar] [CrossRef]
- Pan, X.; Guo, S.; Xu, H.; Tian, M.; Pan, X.; Chu, J. China’s Carbon Intensity Factor Decomposition and Carbon Emission Decoupling Analysis. Energy 2022, 239, 122175. [Google Scholar] [CrossRef]
- Su, B.; Ang, B.W. Multi-Region Comparisons of Emission Performance: The Structural Decomposition Analysis Approach. Ecol. Indic. 2016, 67, 78–87. [Google Scholar] [CrossRef]
- Li, H.; Zhao, Y.; Qiao, X.; Liu, Y.; Cao, Y.; Li, Y.; Wang, S.; Zhang, Z.; Zhang, Y.; Weng, J. Identifying the Driving Forces of National and Regional CO2 Emissions in China: Based on Temporal and Spatial Decomposition Analysis Models. Energy Econ. 2017, 68, 522–538. [Google Scholar] [CrossRef]
- Song, C.; Zhao, T.; Wang, J. Spatial-Temporal Analysis of China’s Regional Carbon Intensity Based on ST-IDA from 2000 to 2015. J. Clean. Prod. 2019, 238, 117874. [Google Scholar] [CrossRef]
- Ang, B.W.; Xu, X.Y.; Su, B. Multi-Country Comparisons of Energy Performance: The Index Decomposition Analysis Approach. Energy Econ. 2015, 47, 68–76. [Google Scholar] [CrossRef]
Publisher’s Note: MDPI stays neutral with regard to jurisdictional claims in published maps and institutional affiliations. |
© 2022 by the authors. Licensee MDPI, Basel, Switzerland. This article is an open access article distributed under the terms and conditions of the Creative Commons Attribution (CC BY) license (https://creativecommons.org/licenses/by/4.0/).