1. Introduction
All discussions about the built environment bring up the point of adequate internal air quality (IAQ), as poor air quality badly affects the health of the building’s occupants [
1]. This effect is defined by McMullan [
2] as a temporary illness referred to as building-related illness, tight building syndrome, office eye syndrome, or sick building syndrome (SBS) [
3]. Catching the cool breeze with the windcatcher is determined mainly by orientation, air movement by pressure differential, and stack effect phenomenon. The main element disrupting the ventilation function of the windcatcher structure is height, cross-section of the air passages, and the position and amount of openings [
4]. Previously [
5], the research expressed several methods to treat the windcatcher. Some designs cool the drafts from the Malqaf “
Malqaf: is an Arabic term means Windcacher” outlet by going over water in the basement. Evaporation can accelerate even further when implementing the Bernoulli effect or Venturi action with blockades of charcoal panels positioned inside the Malqaf. The barricades can be fashioned using metal trays with wet charcoal. Air humidity can be increased, utilizing targeting air over a Salsabil “
Salsabil is an Arabic term means a water-fed cooling plate”, which is a fountain or a basin of still water, the components of which will be discussed further ahead. The baffles are similarly useful in filtering out dust and sand from the wind [
1].
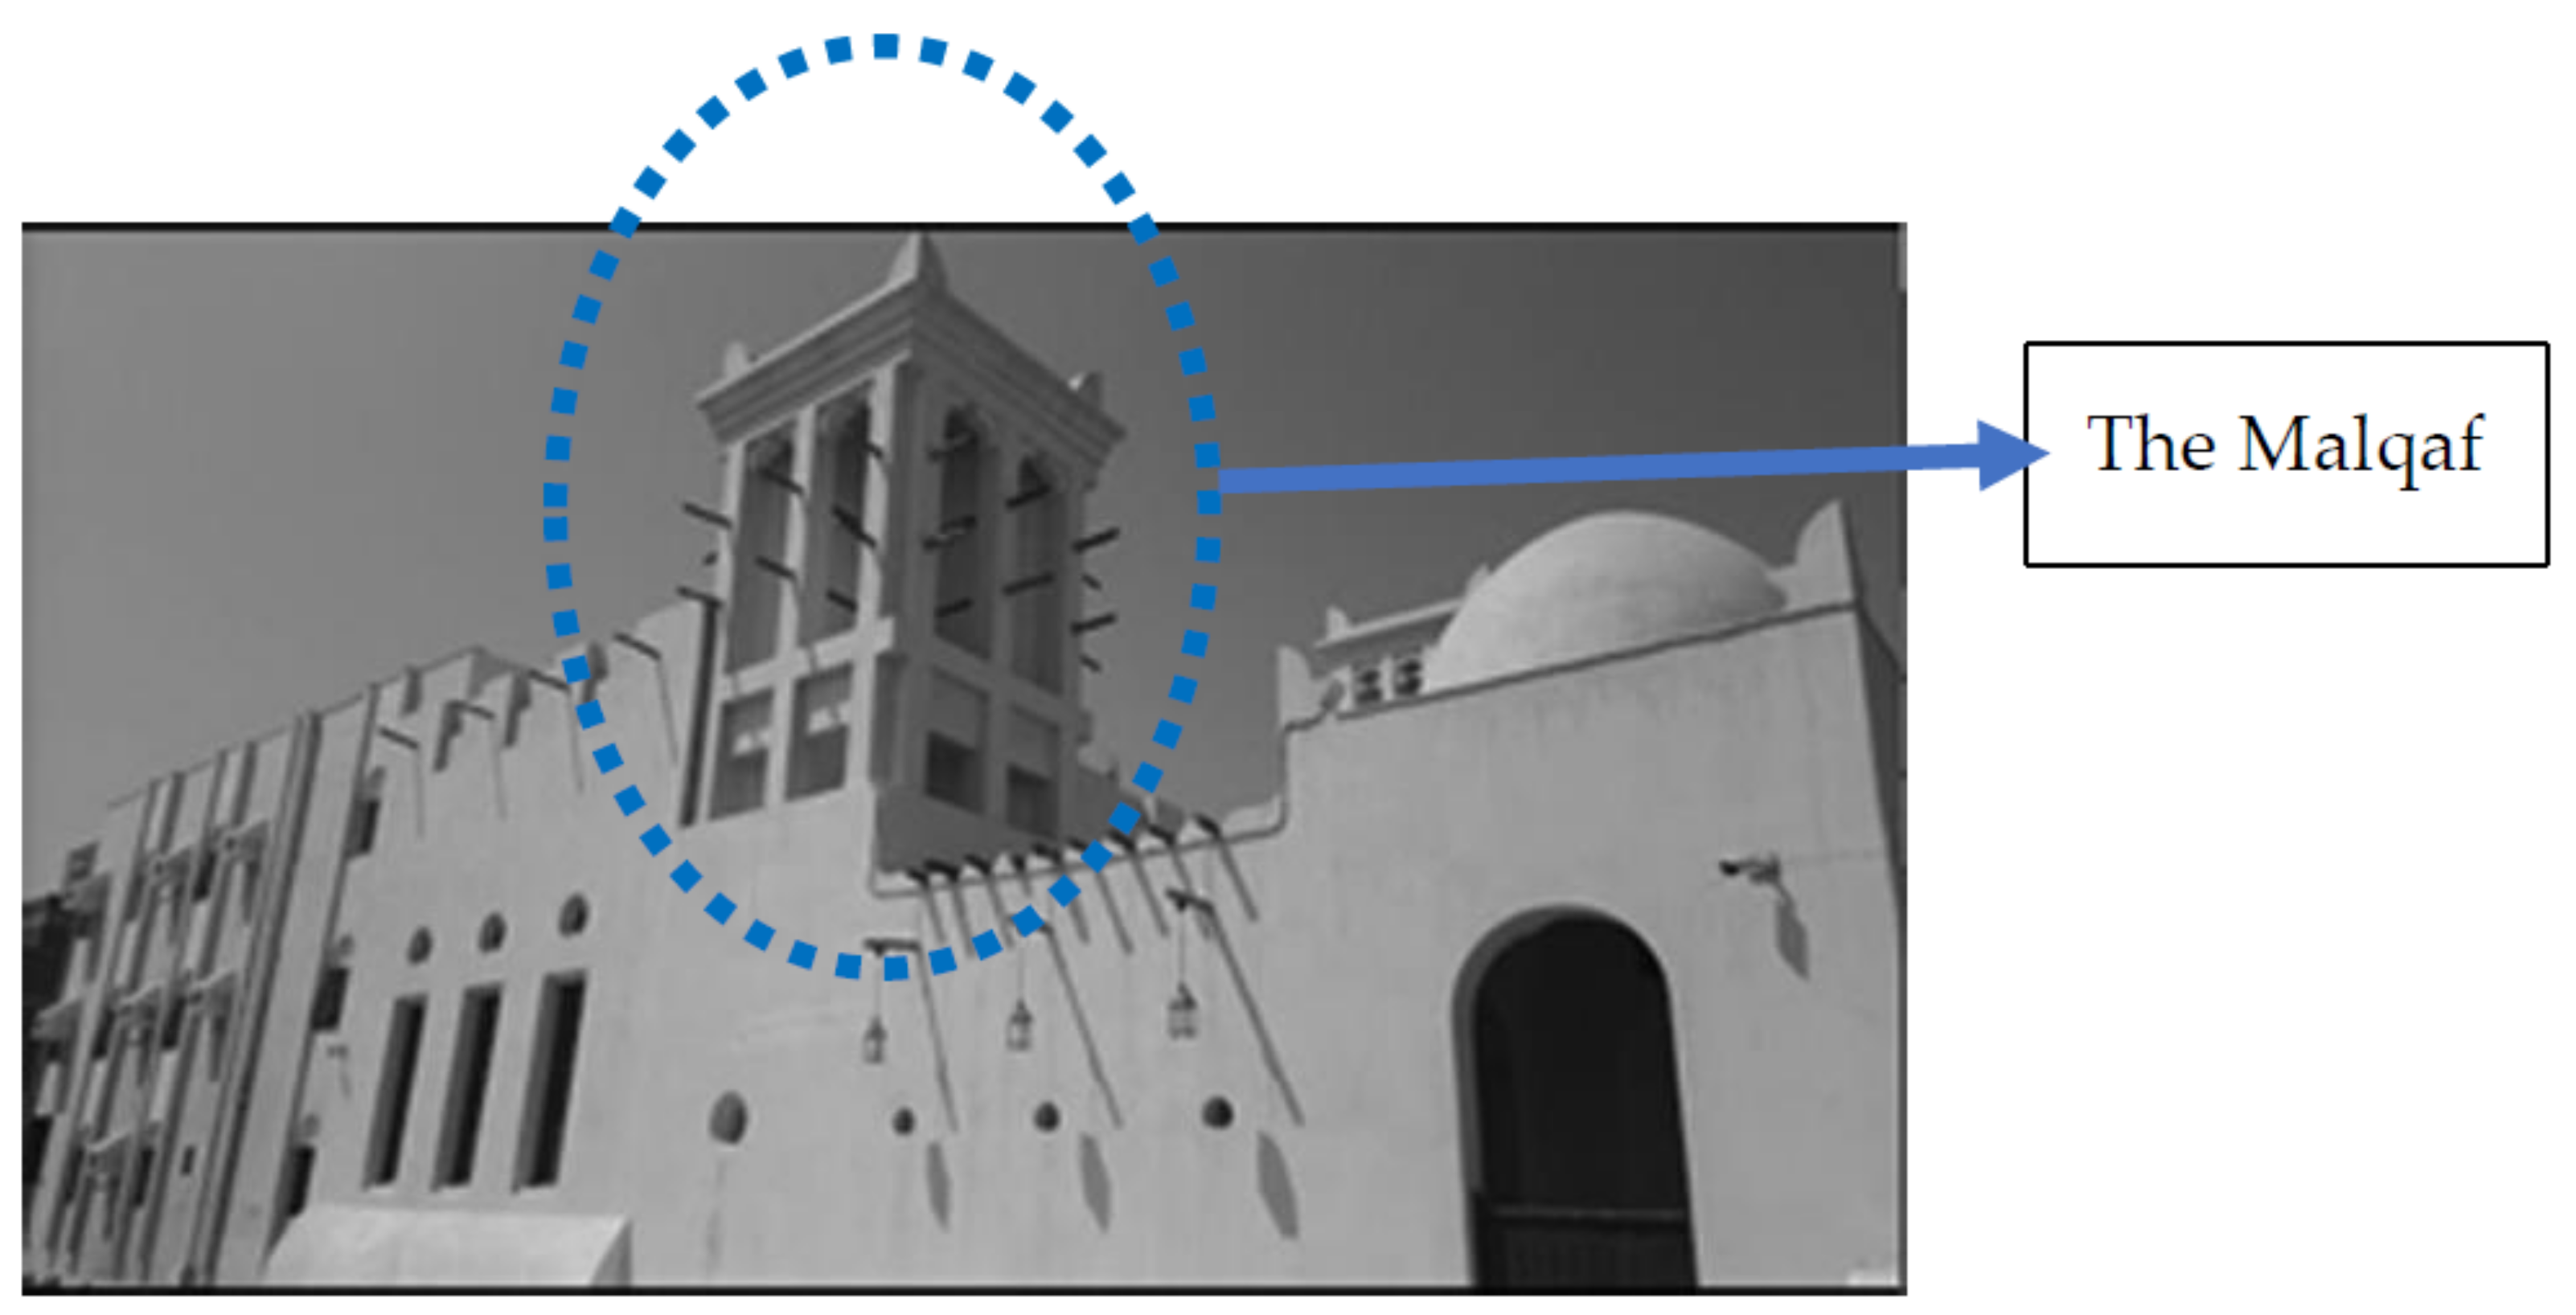
If we can find ways to capture the wind we want, we can orient the building optimally toward the sun. The Malqaf is one of those ways, which can mean windcatcher. It rises high above the building with an opening facing the prevailing wind. It captures the wind from high above the building, where it is cooler and more robust, and directs it down into the interior of the building. The Malqaf is also useful for reducing sand and dust in prevailing winds. The wind that is caught above the building contains less solid material than the wind at lower altitudes, and much of the sand that does enter is dumped at the bottom of the Malqaf. It is also instrumental in cave cities where the wind speed is very slow near the windows. It can also serve as a wind escape when its opening is opposite the prevailing wind direction [
2,
3]. The windcatcher is known as an architectural tool that achieves indoor thermal comfort, a Persian element that has been used for decades. It is a tower with air vents that rises above the building facades to pull cold air down to enter the home interiors. The air movement from the outside of its dome creates a pressure differential that helps draw more air inside. It is often pointed in the direction of the prevailing wind to catch air flowing over the building, which is normally cooler and is being pushed into the building. It is a tower with wind openings over the building facades to draw cold air down into the interiors of the house. The external air movement of its dome creates pressure differences that help draw more air from inside, so its presence with the Mashrabiya that opens onto the courtyard ensures the constant renewal of the cabin air. Some windcatchers come with a soft or coarse wire mesh to clean the air of dust, debris, and bugs, while others come with burnt charcoal, which helps absorb unpleasant odors from the air.
The size of the windcatcher depends on the outside air temperature. If the temperature at the entrance to the outlet is low, then the area of its horizontal section should be large. When the temperature is higher than the maximum comfort of the thermal perimeter, the area of its horizontal section should be small when the air inside is cooled by using a wet or wet sheet of charcoal placed between two metal grid plates. The air flowing over a water element like the fountain can be directed to increase its moisture content [
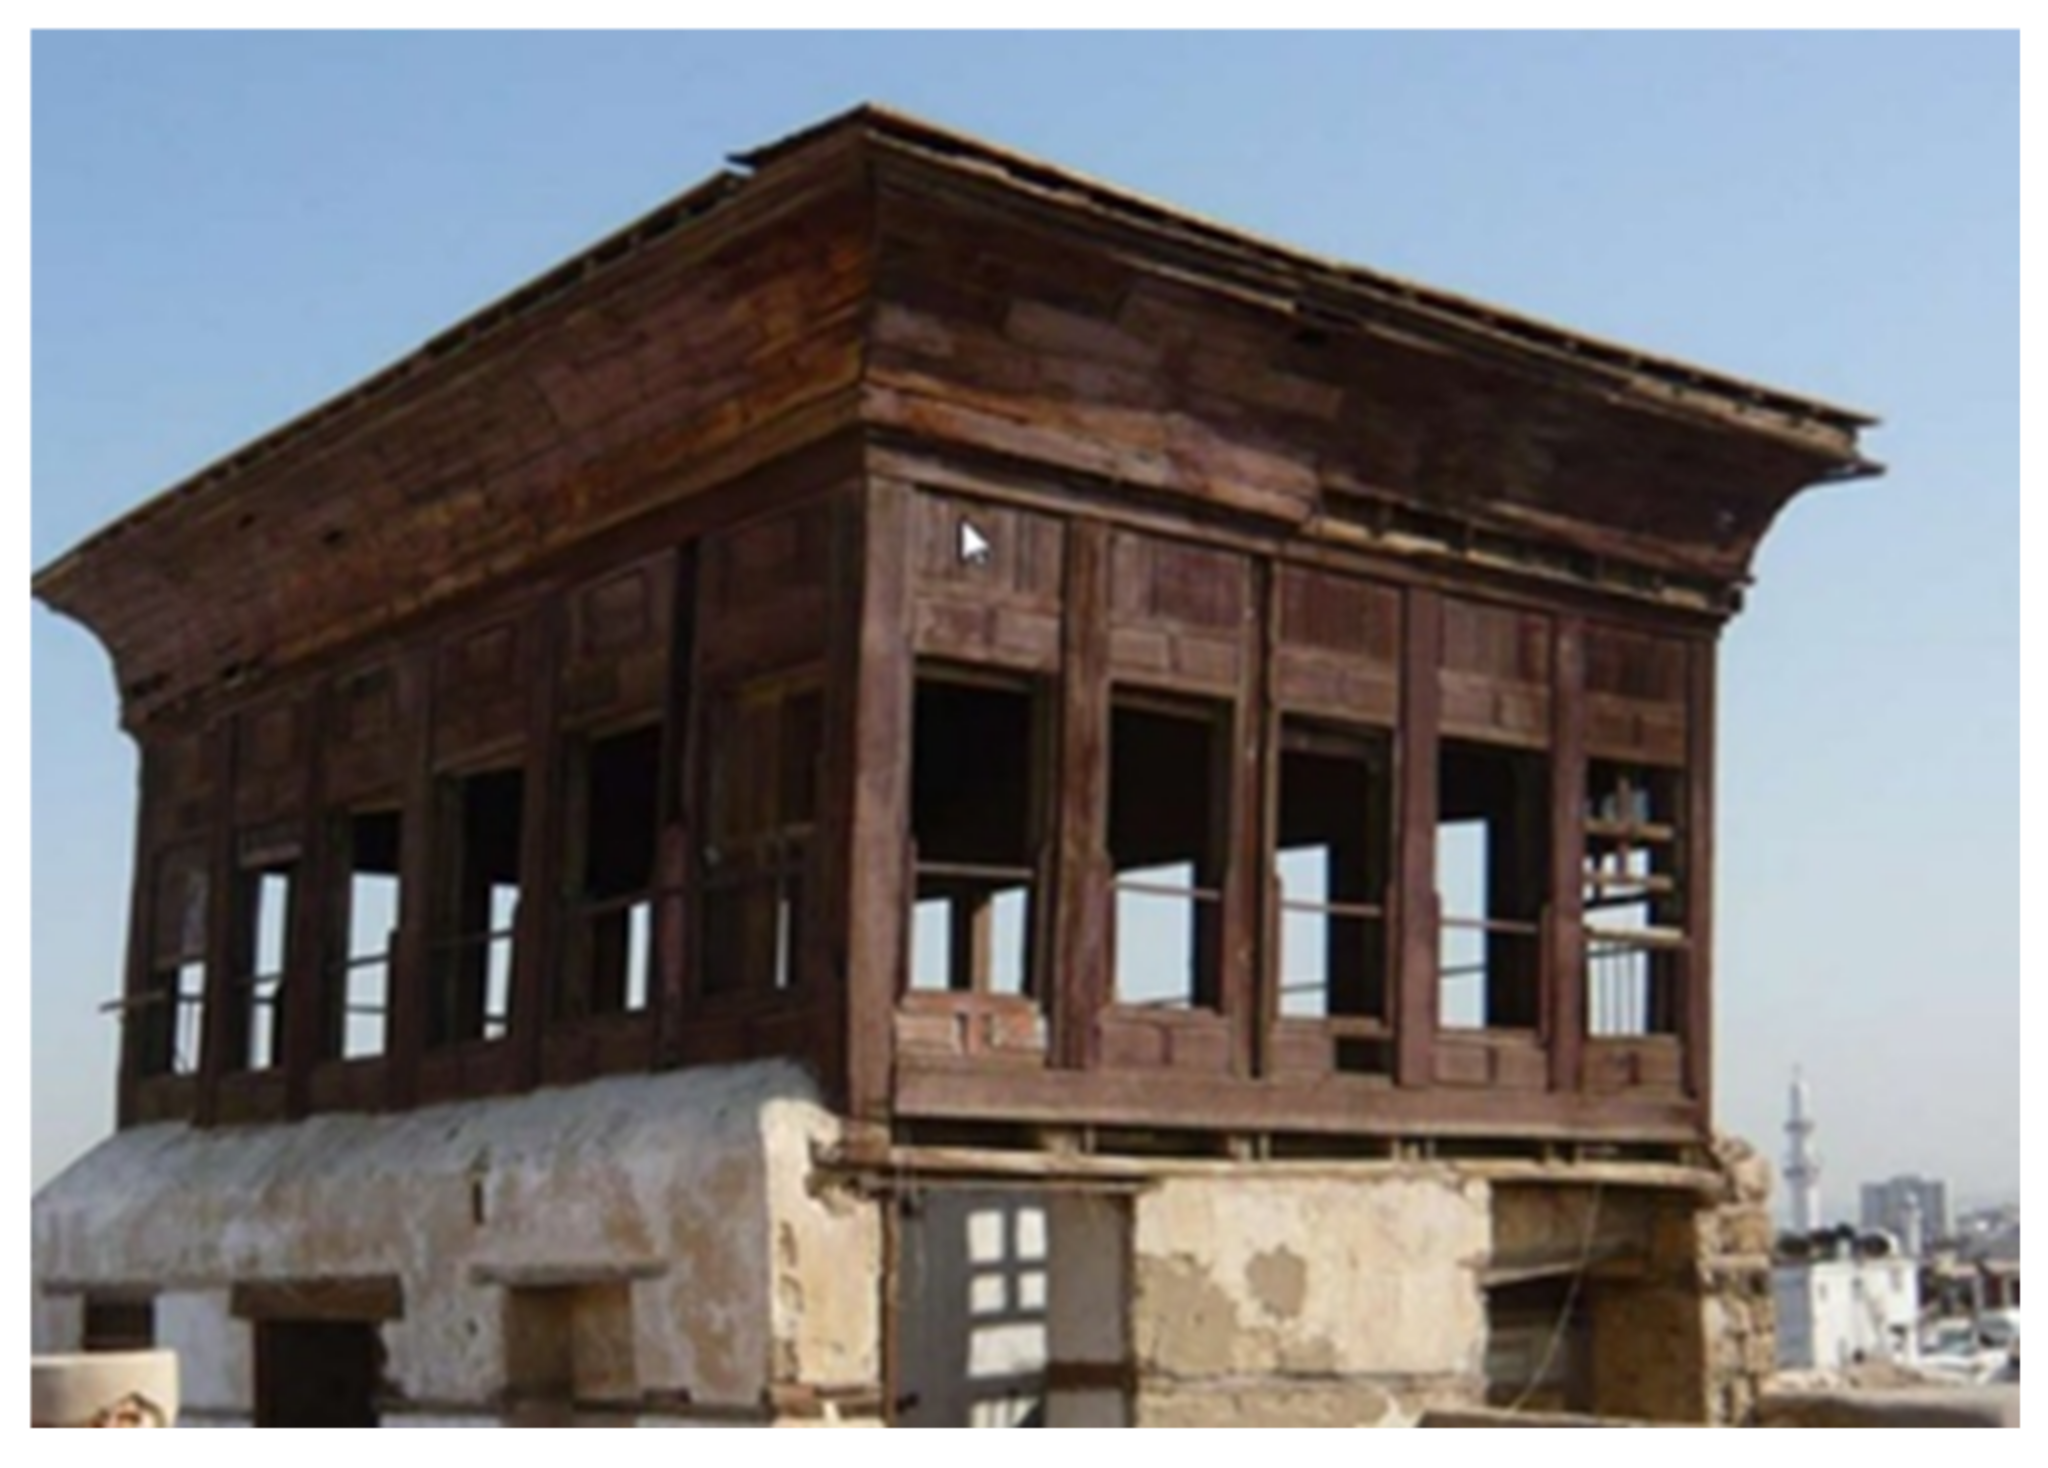
4]. The historical district of Jeddah is known for buildings decorated with ornaments and inscriptions famous for Islamic architectural style, besides the Hijazi heritage, especially the main entrances of these buildings designed in the wooden style and beautiful woods form shapes that cover these entrances and most parts of the buildings from the outside, making them the focus of researchers in the field of Arabic and Islamic architecture (
Figure 1) [
5].
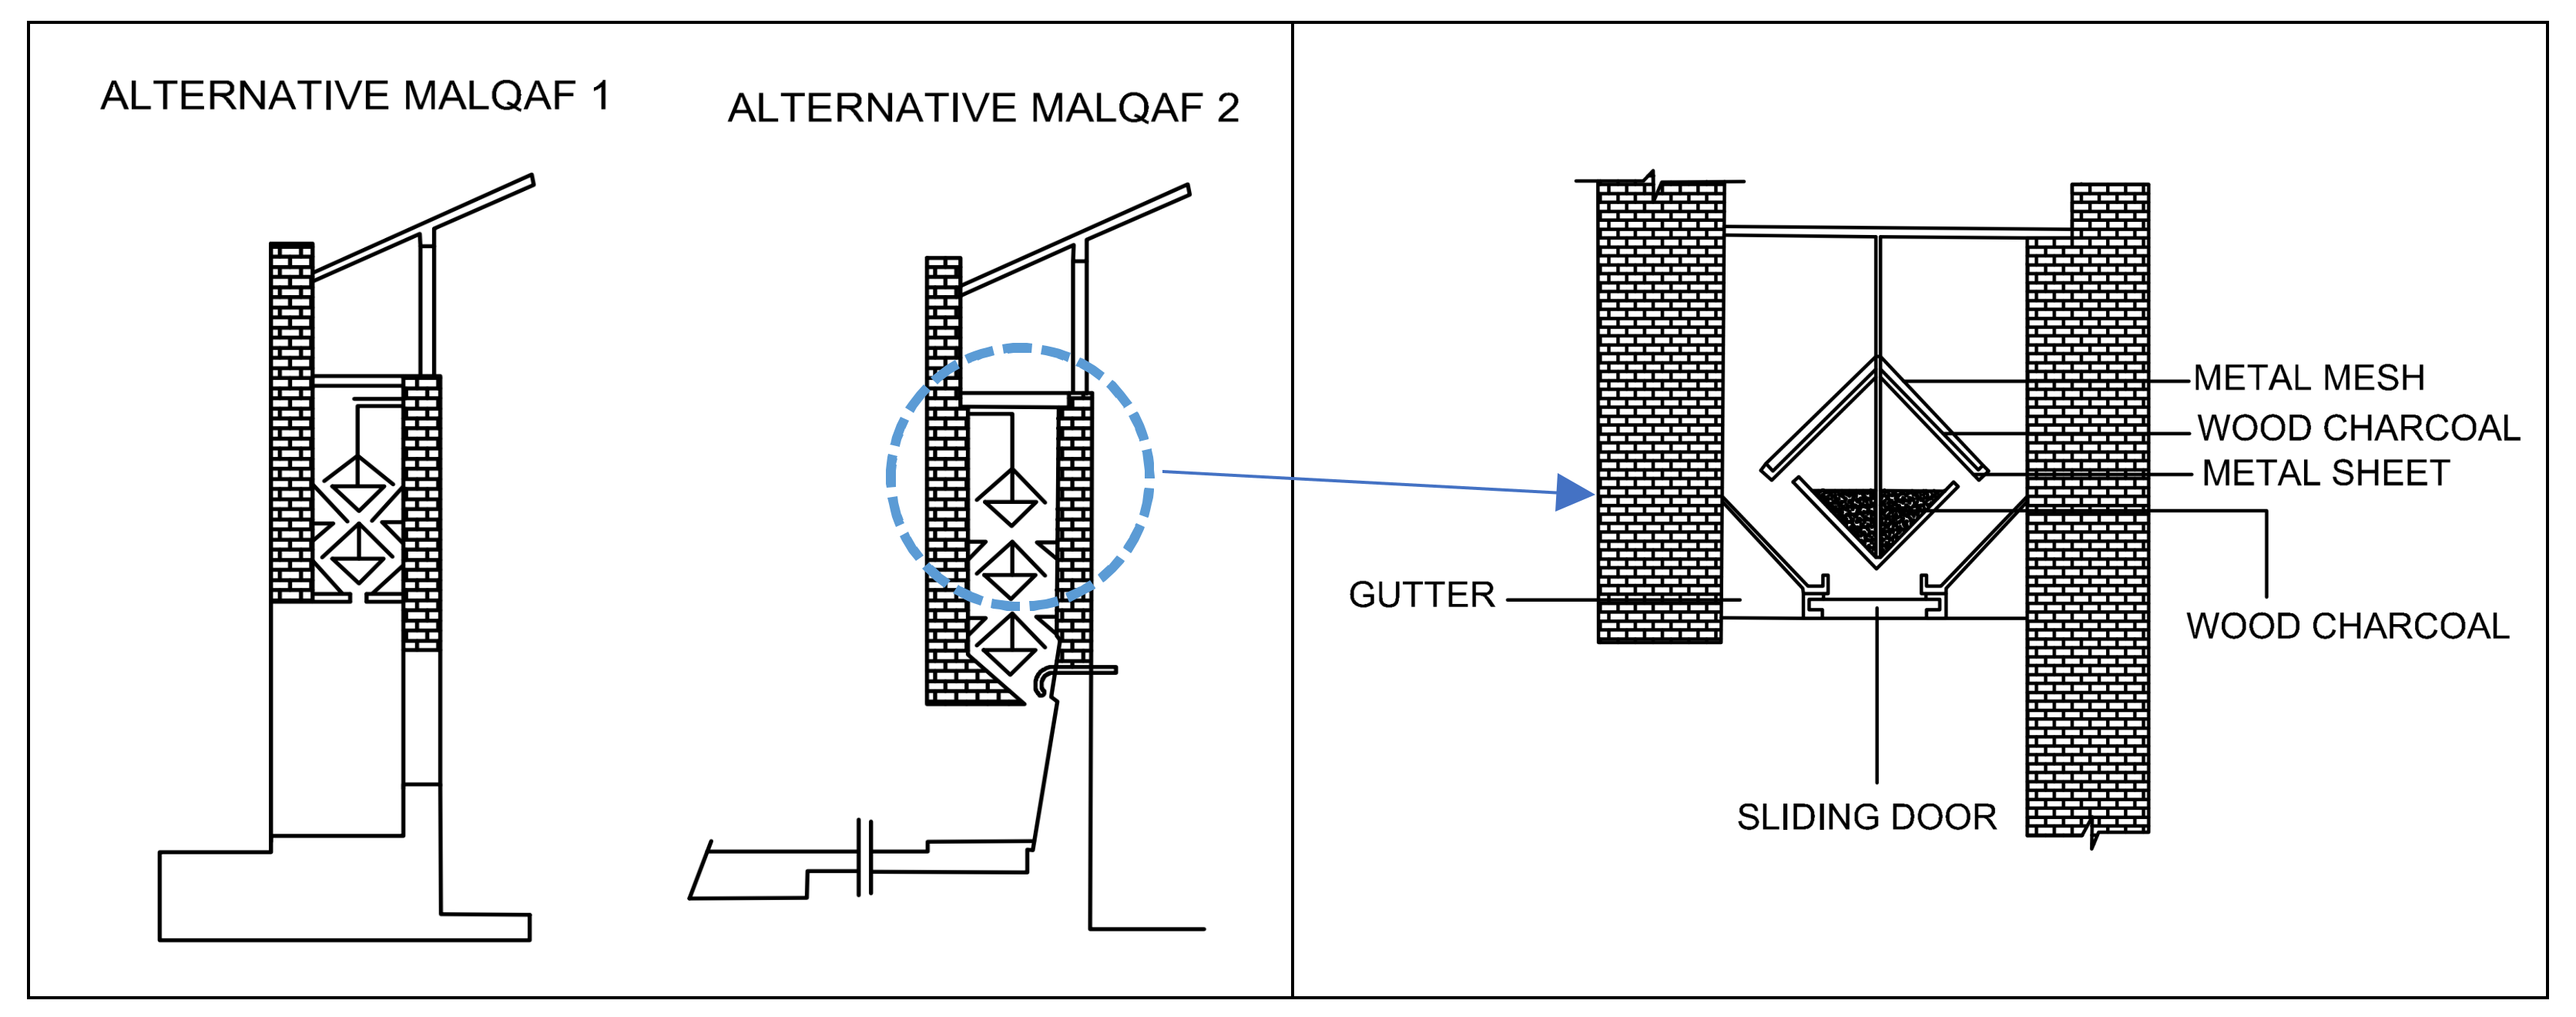
In some designs, the drafts from the Malqaf outlet are cooled by passing them over water in the basement. Furthermore, by increasing the size of the Malqaf and hanging wetted mats inside it, the air flow rate can be increased while providing effective cooling. A few sheets of wet charcoal held between sheets of wire mesh may be added to the Malqaf (
Figure 2).
Evaporation can be further accelerated by using the Bernoulli effect or the venturi action with charcoal plate barricades inside the Malqaf. The wind blowing through the Malqaf reduces the air pressure under the barricade, which increases airflow and thus accelerates evaporation. Metal bowls of wet charcoal can be used to advantage as barricades. Air can be directed over a Salsabil, fountain, or pool of still water to maintain humidity. These components are discussed next. The baffles also effectively filter dust and sand from the wind [
1].
Contemporary wind tower designs incorporate advanced construction techniques, for example [
3,
6,
7,
8,
9]:
Towers with evaporative cooling columns can increase the cooling potential of the incoming air. This can require small pumps to inject the moisture into the system, reducing the passive advantage of wind towers.
Natural ventilation principles can dictate the exact height and cross section of the towers to accommodate the target users in each building.
Tower heads can accept wind from all directions without shorting out airflow.
Control flaps and diffusers can modulate the volume flow.
Solar panels can be used to promote chimney effect ventilation during periods or areas of low wind speed.
This research provides a comprehensive look at previous studies produced by the first author and others. This research was sponsored by KACST (King Abdul-Aziz City for Science and Technology) to examine methods of adopting traditional building techniques to newly built residences in Jeddah [
5,
6,
7]. Three research papers looked at the mechanism of the windcatcher in several case studies, which aided them in proposing windcatcher design guidelines and identifying the causes for neglecting these tools through subjective study.
After conducting 109 questionnaires, where the participants validated the importance of natural ventilation in buildings, it was determined that there is much potential in implementing passive strategies and measures in future building designs. It was also found that the windcatcher effectively decreases air temperature throughout multiple floors; nonetheless, it is recommended to limit it to one or two floors and to instead increase the outward opening to 200% relative to the inward opening and apply side opening in the upper floors [
6].
The main aim of the research is fulfilled through the following objectives:
Investigate the previous related works and the literature review to determine the most common design guidelines.
Acquire information regarding the hourly climate in Jeddah to perform simulation experiments.
Analyze the effectiveness of the proposed design guidelines for the windcatcher.
2. Previous Work
Efforts were made to examine traditional methods of navigating hot arid climates [
5]. Oliver [
8,
9] discussed the structure, materials, and styles used in traditional Egyptian buildings. Fathy [
1] showed sources of natural energy and different vernacular architecture located in hot arid climates. Mohamed [
10] confirmed that the thermal performance could be enhanced by 13% through passive strategies and measures made within the façade skin. Mohamed et al. [
11] investigated the technical and social factors that declined the earth architecture in the Sahara Desert. Results showed a likelihood of reusing earth architecture from the environmental perspective. Filippi [
12] evaluated the main features of the typologies of the urban pattern and buildings of traditional earth architecture in two settlements in the El-Dakhla oasis to aid in measuring the effects of energy consumption levels with the implementation of passive and renewable energy. Other studies were developed to reduce energy consumption levels in educational buildings [
13]. Iscandar [
14] showed case studies of neo-vernacular architecture based on studies from Michael Graves, Hassan Fathy, and Ramses Wissa Wassef. According to Givoni [
15], several design methods of buildings located in hot arid climates influence thermal performance, affecting human thermal comfort. These design methods are internal and attached open spaces, the orientation of main spaces and windows, the size, location, and details of the windows, the layout of the building’s plan, shading devices, the building’s envelope color, the building’s materials, vegetation around and inside the buildings, ventilation devices, roof construction, and humidification strategies [
10]. Passive cooling devices that can improve the thermal comfort in buildings are shown in
Table 1 [
1].
Abdel-Rahman Nassif House (1974), in Jeddah, Saudi Arabia, is an example of a traditional house that uses the windcatcher in the design [
5]. Additionally, Al Diwanyia Rest House in Al Rawdah District, Jeddah is another example of a traditional house that features contemporary vernacular architecture [
16]. The wind tower is implemented in the building’s context and within the internal courtyard (
Figure 3). Sanij et al. [
17] suggested a new wind tower design that ventilates passively and decreases energy consumption in windy climates. According to Dipak [
18], having a multi-directional windcatcher presented schematically stimulates airflow and is an economical method of constructing comfortable buildings.
According to Agha Khan [
19], natural ventilation systems, as uniquely used in the Hijazi style of Al-Makkiyah Residential Villa (built in 1980), eliminate air conditioning throughout the year. Functional space arrangements show that natural ventilation and lighting connect vertical tower openings, and shaded courts and ‘Rawasheens’ offer openings, thus providing indoor comfort for building residents. A study for Al Sulaimania Palace, in El Hamra District, by Abdel-Wahed El-Wakil (architect/planner) and AghaKhan Trust for Culture [
20] reflects the incorporation of passive strategies and related solutions to give natural indoor ventilation by using vaulted spaces, domes, and wind-catchers.
Various research studies [
21,
22,
23,
24,
25] confirmed that ignorance toward the vitality of preserving historic sites and landmarks and depending on government action has continued their ongoing deterioration. Another study [
21] showed that the inexperience of current oasis inhabitants and the shortcomings from the Egyptian Supreme Council of Antiquities have decayed the traditional architecture. This emphasizes the necessity of deliberating the issue and discussing the prospects of earthy construction and what is regarded as ‘modern’.
Few researchers considered changing the design guidelines of the windcatcher. Bahadori et al. explored enhancing wind towers for natural ventilation and passive cooling. He [
26] proposed three alterations: (a) a tower head that receives wind that blows in all directions and keeps air from escaping through other tower openings; (b) a system that saves energy or a column with an increase in heat transfer; and (c) wetting the column walls to use all potential of evaporative air cooling. Elmualim [
27] analyzed the experimental, theoretical investigations, and computational fluid dynamics (CFD) modeling considerations to measure the performance of a square section windcatcher system connected to the top of a test room for natural ventilation. He confirmed that CFD is optimal, as it is cost effective and less time consuming, but the results obtained using CFD models should be carefully regarded, particularly with a lack of observed data. He stresses utilizing natural ventilation systems of windcatchers when possible, especially during the summer, as it reduces energy and the cost of the whole operation of air conditioning.
Montazeri and Azizian [
28] studied the hydrodynamic performance of a single-sided windcatcher by examining wind tunnel and smoke visualization. The one-sided windcatcher has one channel set toward the wind direction to allow induced air to go through. They tested a real case from the Kharmani’s School, which had a 1:40 scale model of a windcatcher where the pressure coefficients around surfaces of the channel, measuring different values of approaching air incident angles. The theoretical values of ventilation air flow were used to estimate pressure coefficients and measure the capability of simplified models in natural ventilation studies. Results showed that an isolated windcatcher reaches its maximum zero air incident angle. Montazeri [
4] later used new methods to study the ventilation performance of windcatchers with a different numbers of openings, experimental wind tunnel, smoke visualization testing, and computational fluid dynamic (CFD) to determine how the number of openings influences the hydrodynamic behavior of windcatchers. He used five cylindrical models that had the same heights and identical cross-section areas. The cross sections were divided into segments to achieve multi-sided windcatchers, specifically two-, three-, four-, six-, and twelve-sides ones. The findings are as follows: (1) a larger number of openings decreases the sensitivity of the wind angle, and (2) the rectangular section is more effective than the circular one. Drach et al. [
29] compared two different scenarios of windcatchers in Rio de Janeiro (long and short windcatchers) to the base case. Results showed that the short windcatcher was more effective on the upper floors and the long windcatcher was less effective on the ground floor. Afshin and Sohankar [
30] used a 1:50 scale model of an experimental wind tunnel to test the efficiency of the air flow in a two-sided wind-catcher. The findings determined that the direction of the inlet of the wind-catcher was crucial in furthering its efficiency. The maximum pressure coefficient on the inlet of the windcatcher is at a wind zero angle, decreasing when increasing the angle, but angling it to 55° or more against the prevailing wind direction allows it to function as a wind-scape (wind chimney).
Other researchers examined energy-saving methods that affect the overall yearly consumption rate of a residential building in climates that are hot, humid, and arid [
31,
32,
33,
34]. These studies suggested that energy consumption lowered through passive cooling strategies. Current approaches hope to utilize traditional techniques in their designs [
18,
35,
36]. Many Saudi Arabian regions are born out of their heritage districts. They are individualized by their vernacular and traditional buildings, which reflect social, cultural and environmental expressions of the relationship between natural and cultural forces [
25]. The cultural value of Saudi Arabian cities has faded due to urbanization and disinterested locals. Many traditional buildings are being demolished, threatening the loss of identity and diversity [
35]. Other researchers [
25,
36,
37] suggested adding passive architectural solutions in Jeddah by integrating traditional features to modern buildings and making old buildings more accessible through improving their thermal comfort. The methods mentioned are adding ‘Rawasheens’ (wooden windows), courtyards, and shaded open spaces in Old Balad and modern places in Jeddah, like King Abdallah University for Science and Technology (KAUST).
From the above previous work, we can conclude the following design guidelines for windcatchers:
CFD could be the best option in terms of cost and time consuming; however, results obtained using CFD models should be considered with care, especially in the absence of empirical data. The natural ventilation system of windcatchers should be exploited whenever possible, particularly in the hot summer months, to reduce the energy and environmental cost of full operation of an air-conditioning system.
The evaporative cooling of air by wetting the wall areas of the windcatcher column could be utilized to cool down the air temperature.
The number of openings plays an important role since a larger number of openings decreases the sensitivity of the performance related to the wind angle.
The rectangular section is more efficient than the circular section.
The better performance of the short windcatcher on the upper floors while confirming the lower effect on the ground floor in the case of the long one.
The maximum pressure coefficient on the inlet of the windcatcher occurs at wind zero angle and decreases by increasing the angle while it can work as a wind-scape (wind chimney) when it is oriented more than 55° against the prevailing wind direction. This means that the maximum efficiency is achieved at zero air incident angle.
However, no research quantified the effectiveness of the opening size and ratio of the windcatcher. This research presents a technical study to devise some guidelines for the windcatcher opening in terms of the appropriate ratio between the inward and outward openings.
3. Materials and Methods
The study is fulfilled by the use of a detailed designed research scientific methodology published by the first investigator [
38,
39,
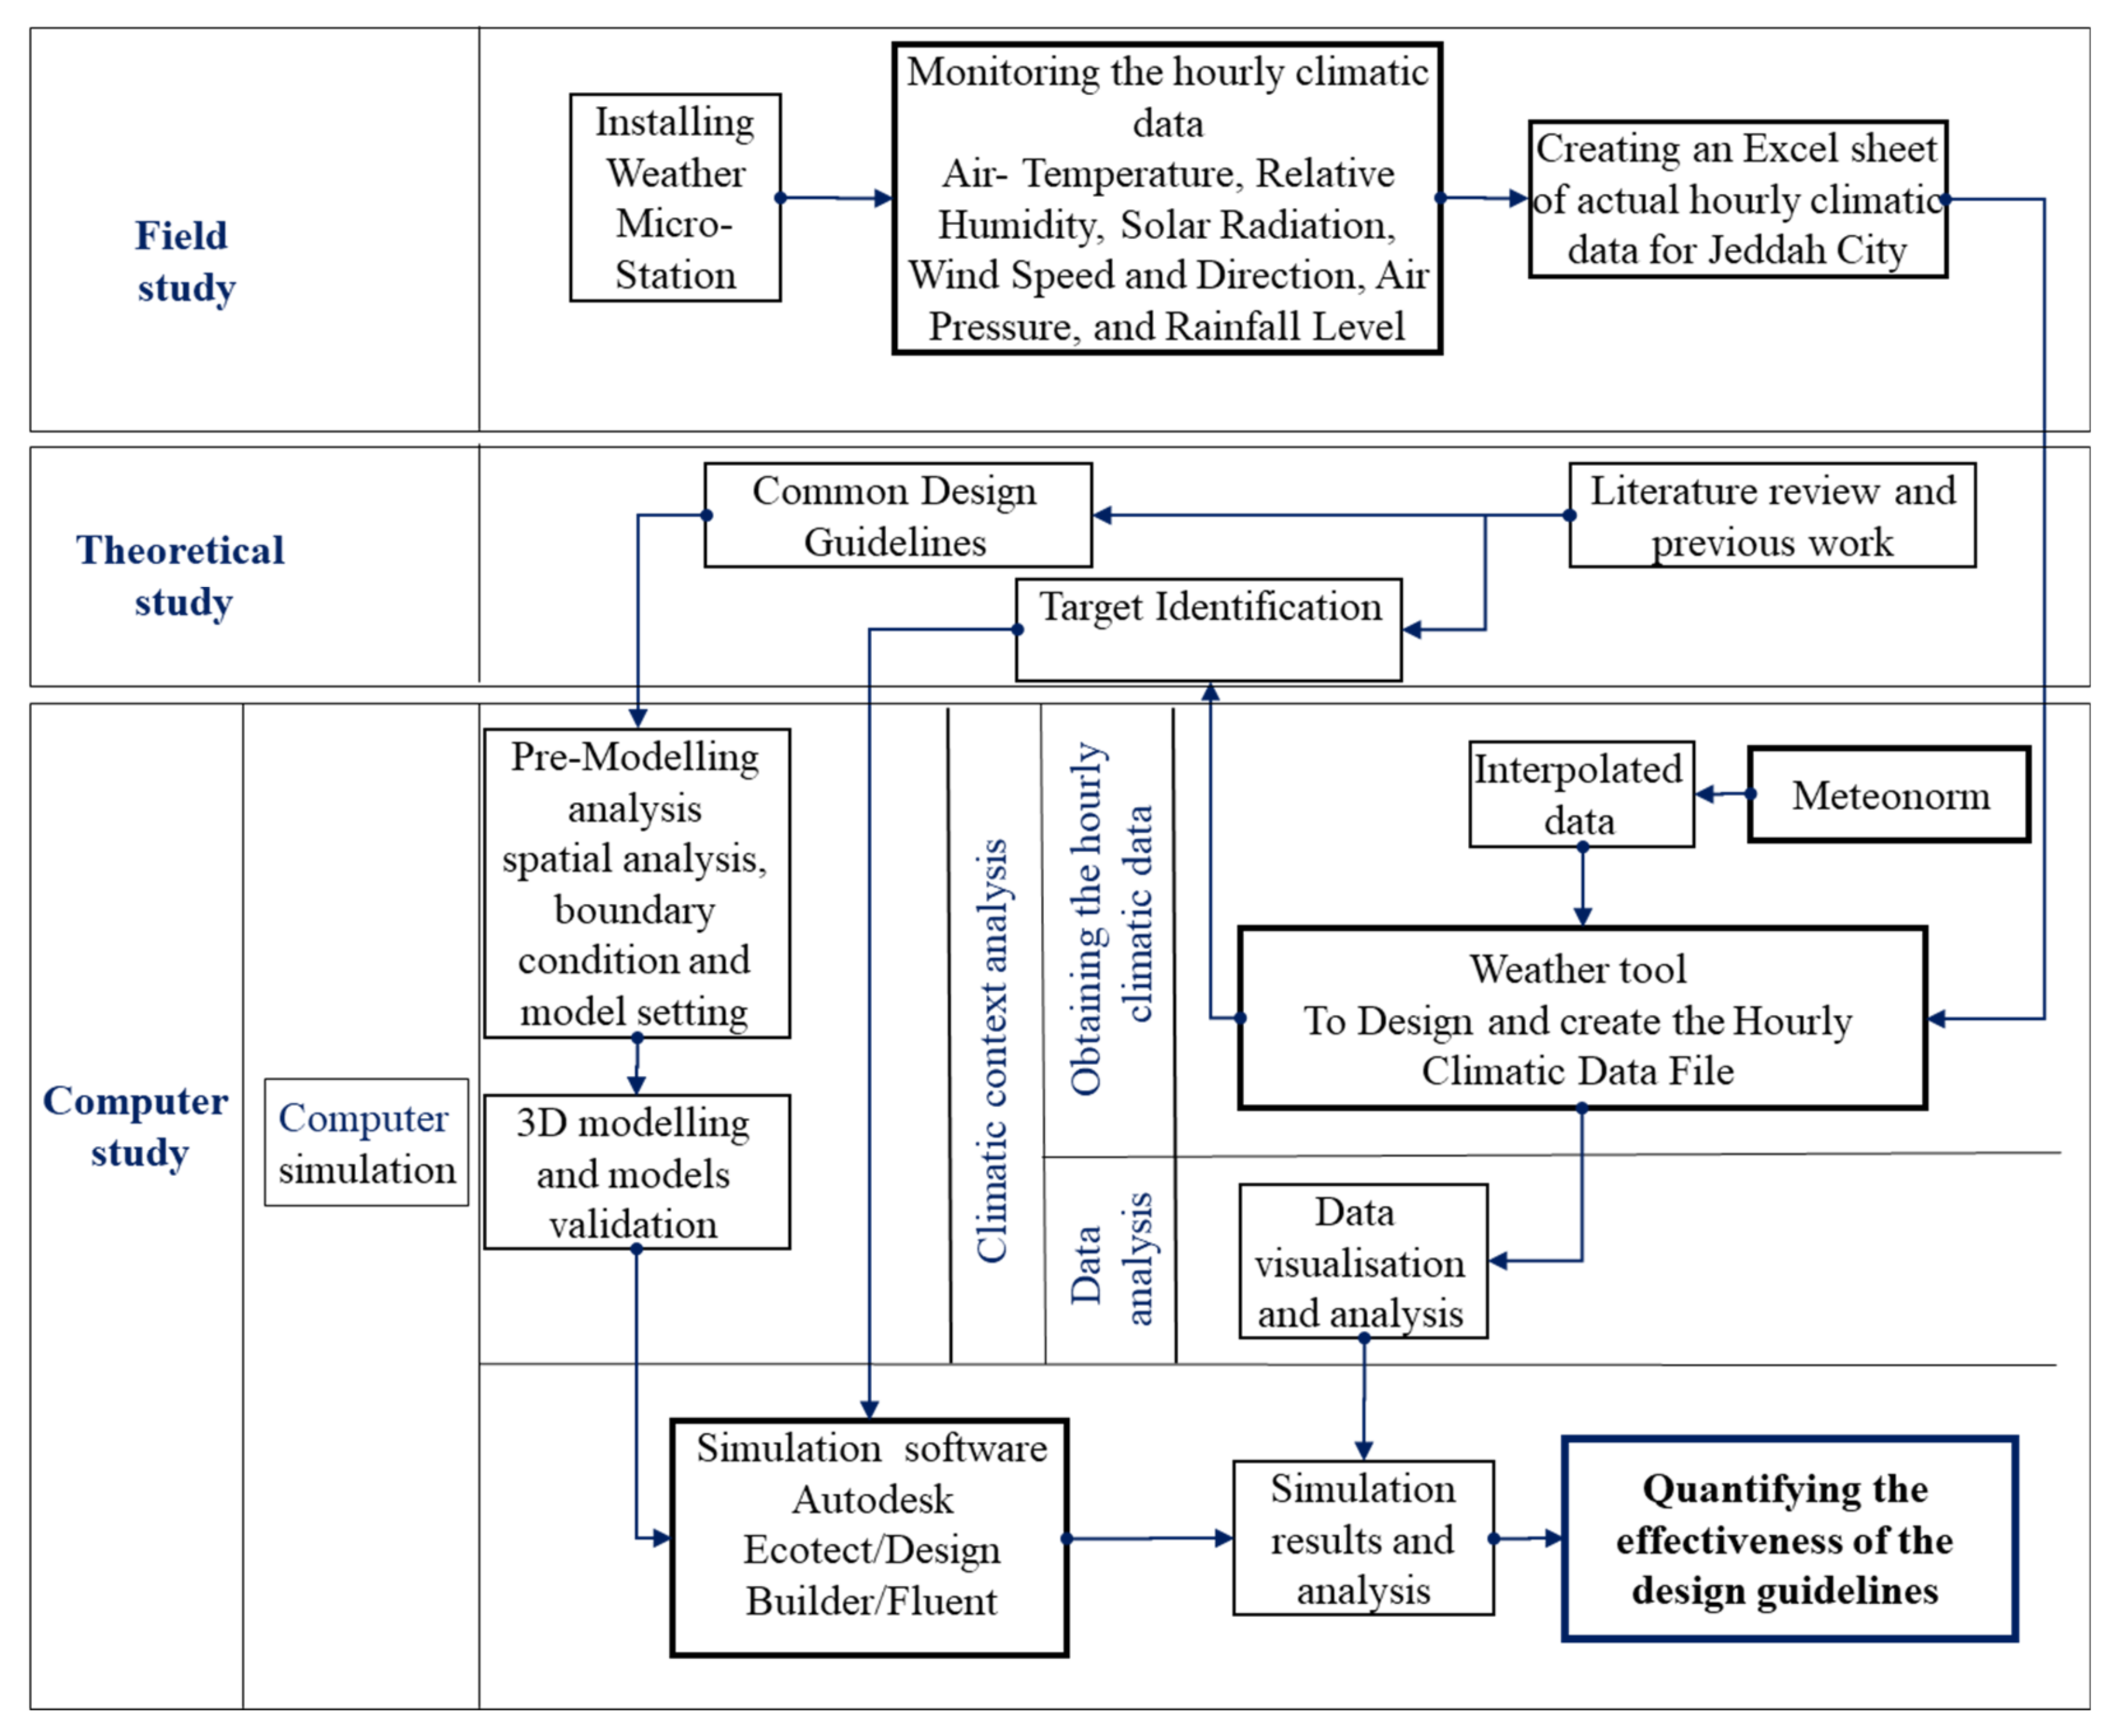
40] and applied in real projects. The methodology quantified the efficiency of passive techniques and included theoretical, field and computer-based studies as seen in
Figure 4. The theoretical and field studies were conducted previously. This part only illustrated the computer-based study, which quantifies the efficiency of the suggested design scenarios of the windcatcher. This table details these studies.
This was accomplished through climatic context analysis and computer simulation. The climatic context was examined using a suitable set of climatic data of the investigated location. The hourly climatic data were attained by the following: (1) The hourly climatic data file synthesized from Meteonorm Software based on the nearest climatic stations was analyzed using Weather Tool. (2) Real hour data were recorded with a HOBO U30-NRC (Weather Station Starter Kit) installed at Effat Campus. The weather data were analyzed and compared. It included air temperature, relative humidity, solar radiation, wind speed and direction, air pressure, and rainfall level.
Weather Tool [
38] software is used to visualize and analyze the hourly climatic data. The simulation stage includes four main tasks: (1) pre-modeling analysis, (2) 3D modeling and models’ validation, (3) quantifying the effectiveness of proposed scenarios, and (4) results handling and presentation. The pre-modeling analysis includes a spatial analysis, boundary condition and model setting. The 3D modeling and model validation present the appropriate techniques and methods to build the models in Autodesk Ecotect and Flovent and validate the models’ accuracy through physical modeling. Results are then analyzed using spreadsheets and SPSS software to present the effectiveness of the proposed designs under investigation.
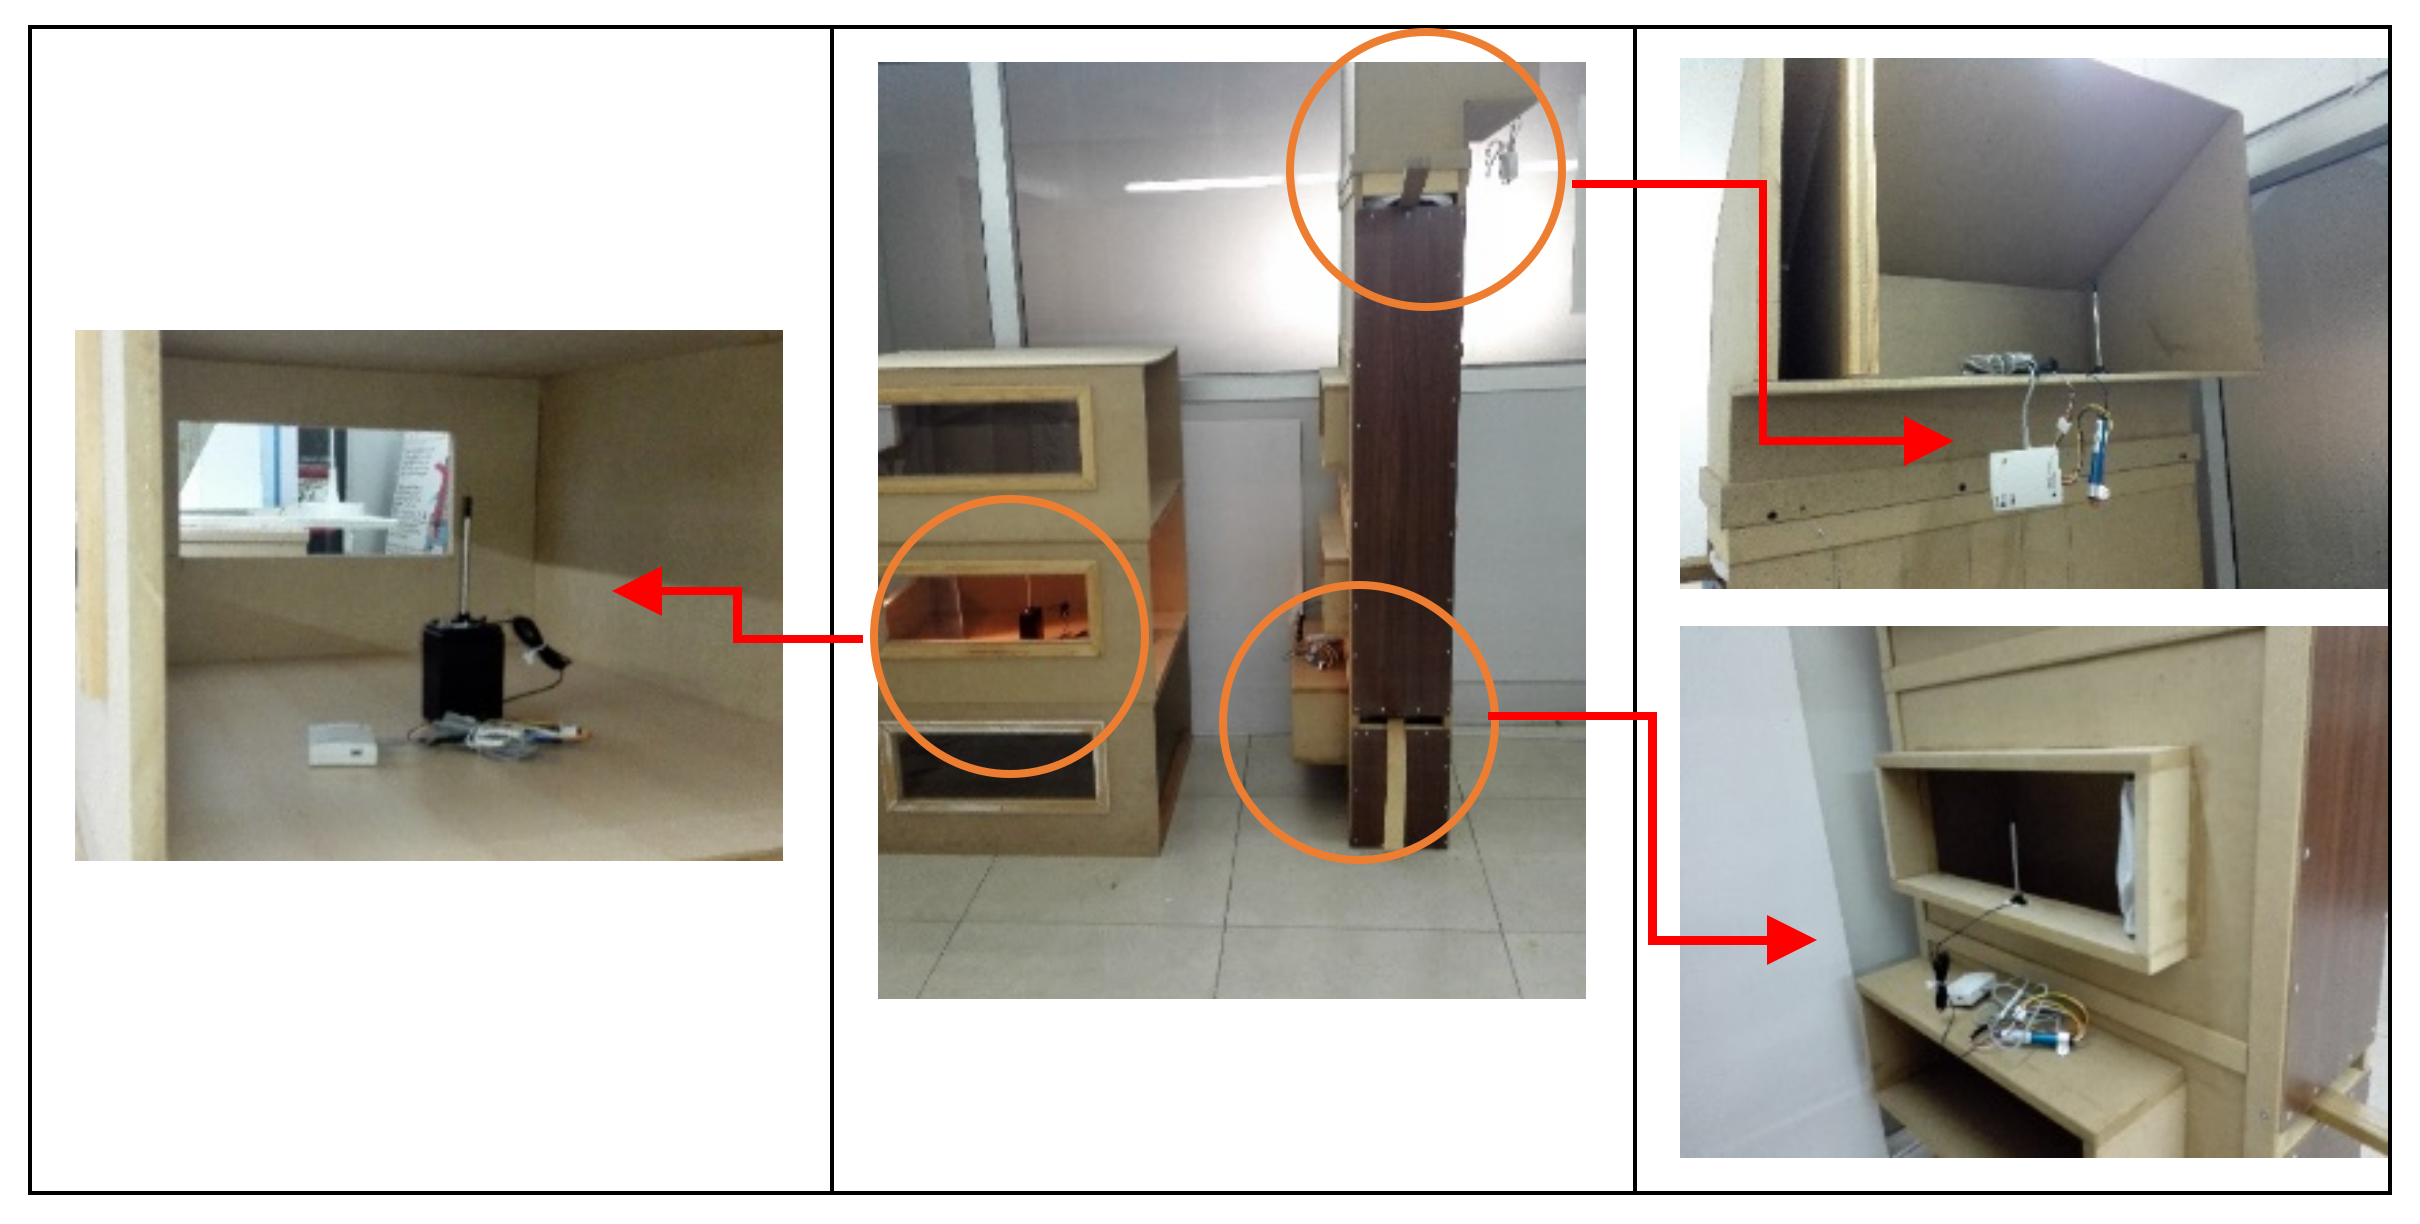
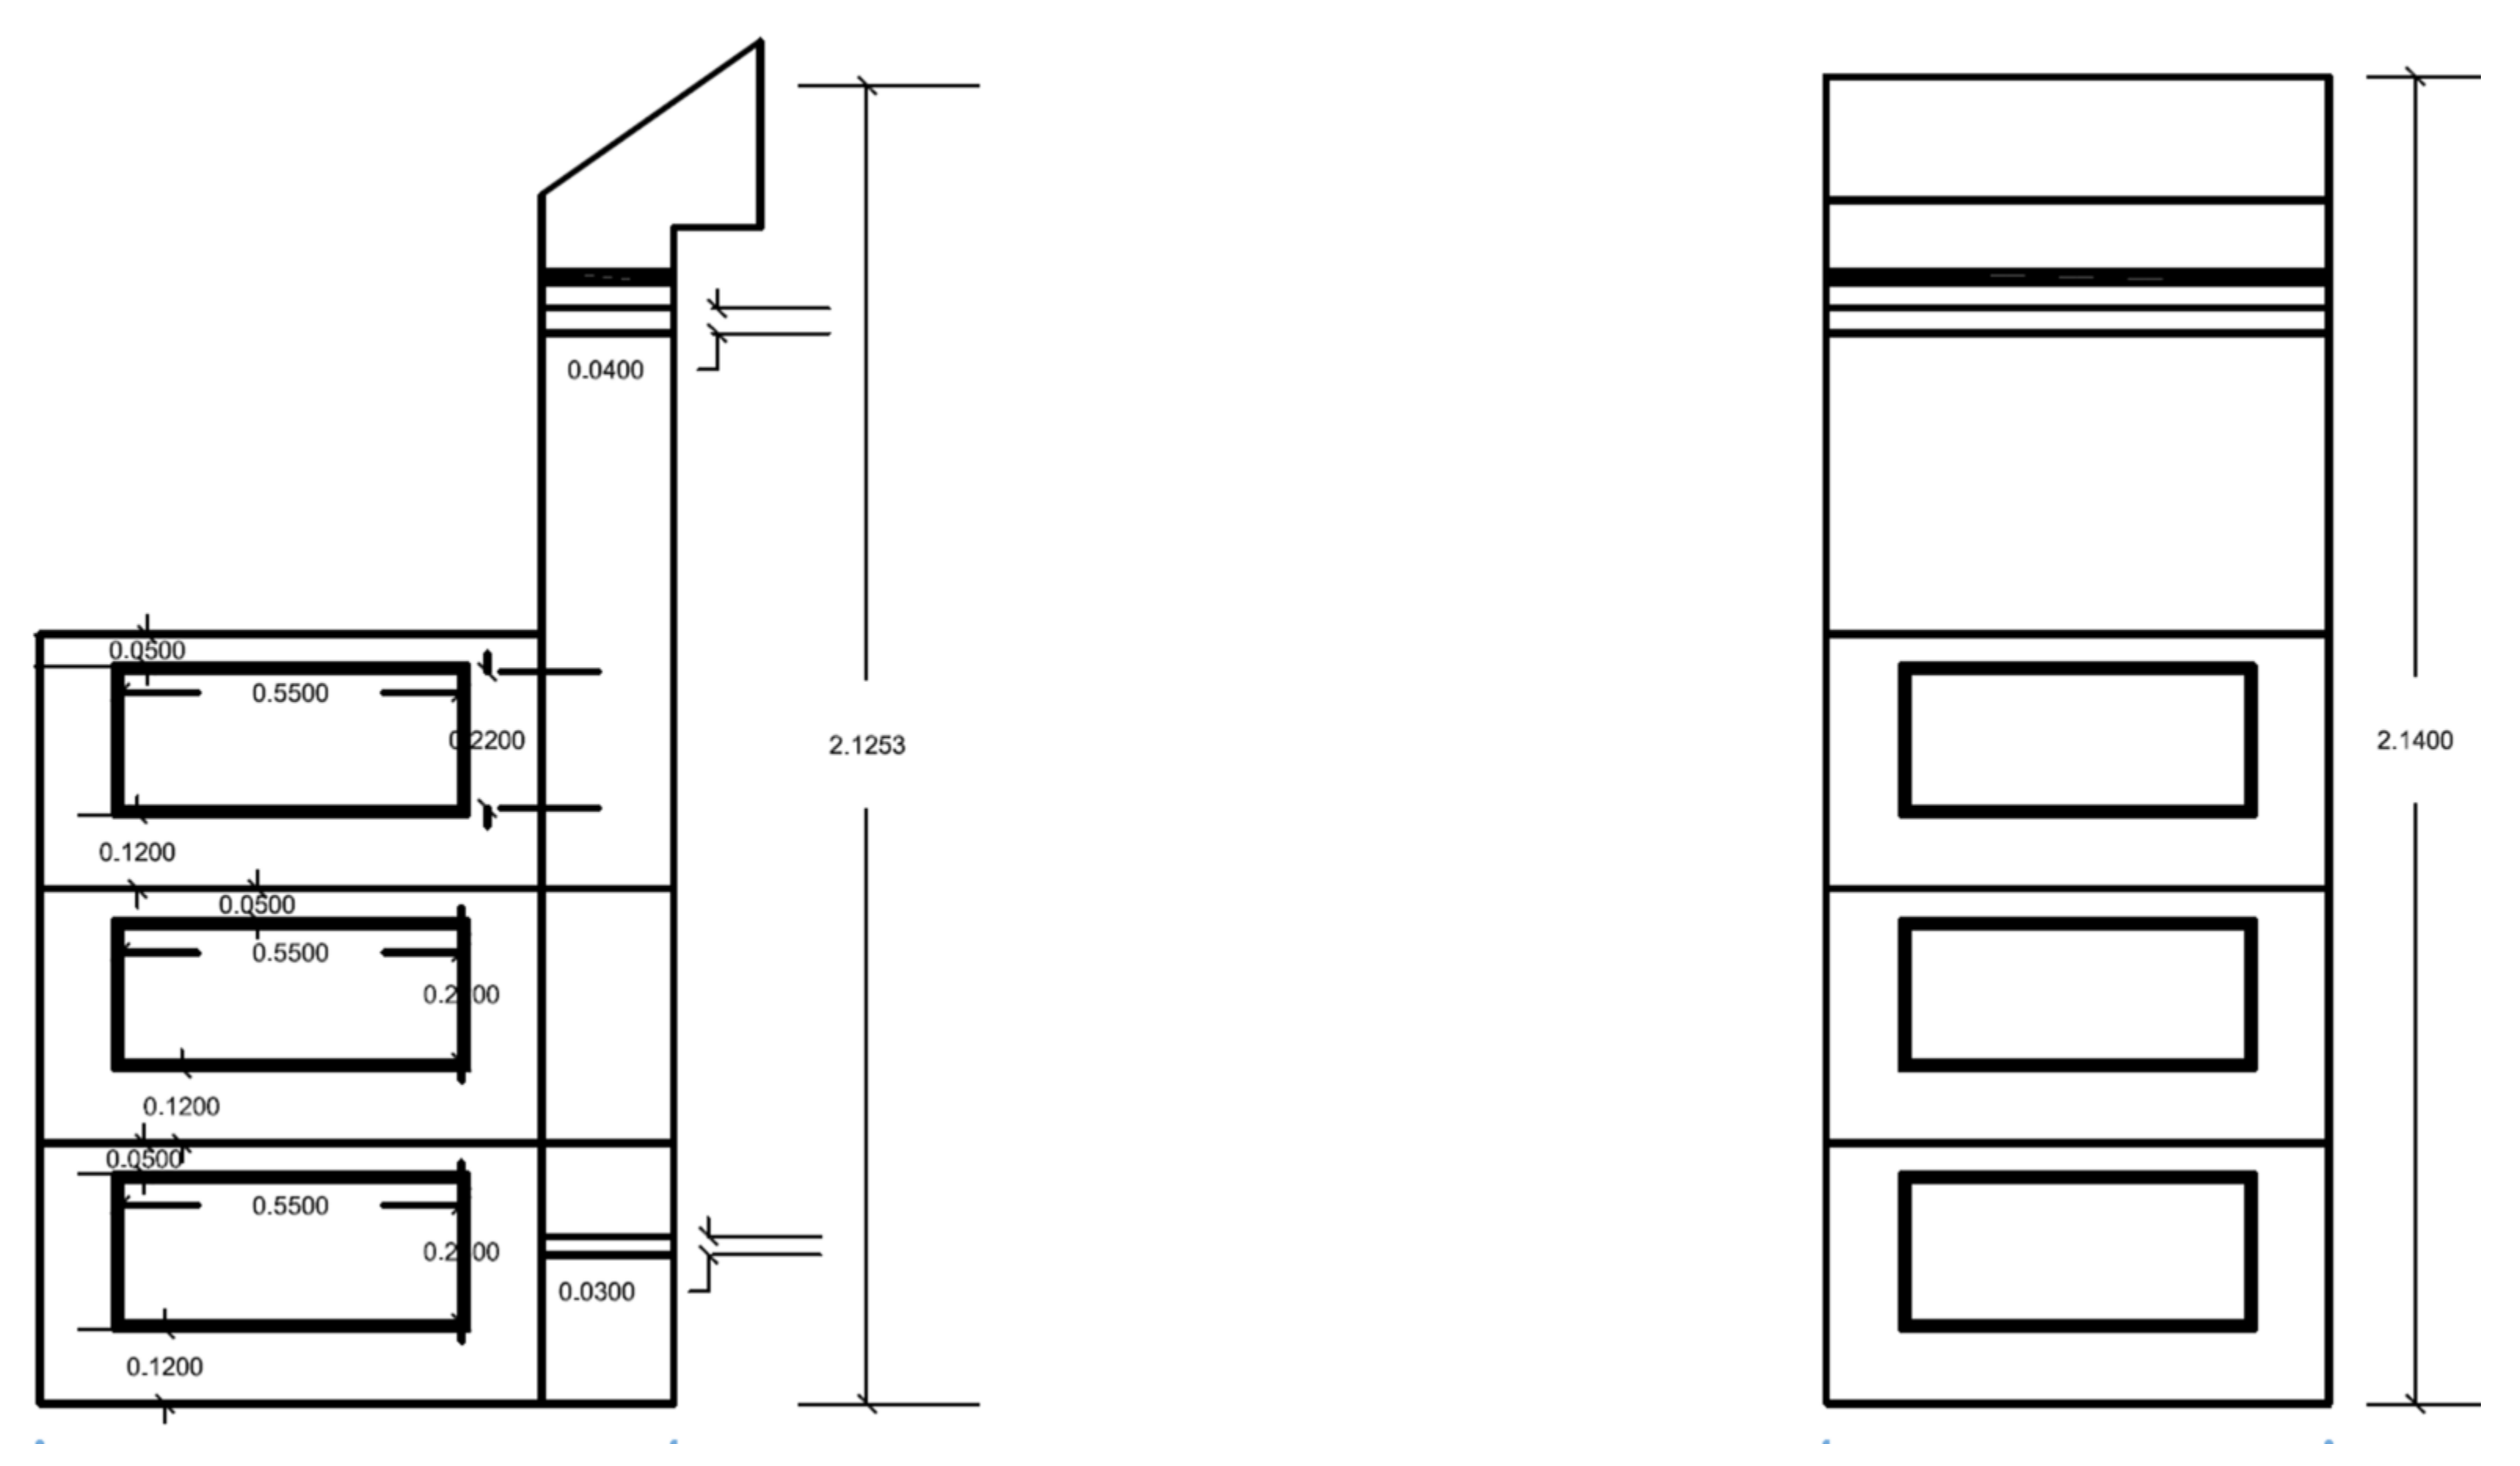
To verify the model’s accuracy, a 1:6 scale model of the windcatcher is built with attached three floors of spaces. The views of the scale model and the dimensions are shown in
Figure 5. The model was fabricated at Effat Workshops. The results of the numerical model are compared with the results of the physical model for validation.
3.1. Climatic Context Analysis
In visualizing the hourly climatic data, the Weather Tool software is used. Koppen’s climate classification classifies Jeddah as hot and dry. Jeddah is warm throughout the winter ranging from 15 °C at midnight and going up to 25 °C in the afternoon; this weather pattern is reserved for Jeddah, unlike neighboring cities in Saudi Arabia. Jeddah is extremely hot in the summer, reaching 40 °C midday before dropping to 30 °C with less than 3 °C monthly variations. Jeddah experiences heavy thunderstorms with rare amounts of rainfall and occasional hail. Its climate is tropical and moist with some precipitation throughout the year. Its hot and humid weather produces nearly daily afternoon clouds. The daily highs are about 32 °C and nights are about 22 °C. The suggested passive techniques and measures are decided using the Weather Tool and Mahoney tables. The climatic study using the Weather Tool and Olgay Chart establishes that natural ventilation improves the thermal performance of buildings during the summer significantly.
When analyzing the hourly climatic data, it is observed that the maximum frequency of the prevailing wind comes from the north in the morning and the northwest in the afternoon at 20 km/h and 25–30 °C with 55–65% humidity. Wind speed varies from 10 km/h at 9:00 am to 3:00 pm with the maximum speed being 48 km/h from 12:00 pm to 04:00 pm.
3.2. Computer Simulation
The computer-based study includes four main tasks:
- (1)
Pre-modeling analysis;
- (2)
3D modeling and model validation;
- (3)
Quantifying the effectiveness of the proposed scenarios;
- (4)
Results from handling and presentation. Pre-modeling analysis includes a spatial analysis, boundary condition and model setting.
Using 3D modeling and model validation shows techniques of building models in Design Builder and confirms the accuracy of the models through building a scale model (Scale 1:6) of the windcatcher with three attached floors of spaces. Comparing the findings produced from the numerical and physical model validates their accuracy. A total of three Hobo data loggers equipped with velocity sensors (T-DCI-F900-L-P) are installed, each in a different position. The positions at which the data loggers are placed are the entrance, exit, and middle of the windcatcher. In order to validate the numerical code, the inlet, outlet, and space windows are designed to have several dimensions to examine various scenarios (
Figure 6).
It is modeled by Autodesk Revit (and Environmental Software (Autodesk Ecotect). The windcatcher’s opening is 10 m higher than on the last floor, allowing it to collect cool, dust-free air. Using the hourly climatic data file of Jeddah, the Autodesk Ecotect model provides initial air temperatures—needed for the fluent model—inside the model. FLUENT software is evaluating the air movement inside the model.
Within the wind capture model, this section of the study aims to replicate both the temperature distribution and the flow field using mathematical modeling and numerical simulation.
3.2.1. Mathematical Modeling
The numerical simulation of the 3D windcatcher model is described in this section. The traditional k-ϵ model and other older models poorly forecast the turbulent flow’s spreading rate. The realizable k-ϵ model becomes the most powerful model. It involves an eddy-viscosity formula and a model equation for dissipation, ϵ. Equations (1) and (2) represent the Reynolds-averaged Navier–Stokes equations (RANS); Equation (3) represents the energy equation; and Equations (4) and (5) represent the turbulence equations. The mathematical model is described using the RANS and energy and the realizable k-ϵ turbulent equations [
41,
42,
43,
44,
45]. The governing partial differential equations with their algebraic constraints are listed below.
Turbulence kinetic energy (
k) equation:
Turbulence dissipation rate (
ϵ) equation:
where
t is the time,
ui, uj, i, j = 1, 2, 3 are the mean velocity components in the xi-directions,
p is the pressure,
gi = (0, 0, g) is the acceleration gravity,
ρ is the air density,
μ is the dynamic viscosity of the air,
ν is the kinematics viscosity of the air,
σk is the turbulent Prandtl number for k,
σϵ is the turbulent Prandtl number for ϵ,
κ is the thermal conductivity,
T is the temperature,
T0 is the operating temperature,
k is the turbulence kinetic energy of the turbulence fluctuations per unit mass,
is the turbulence viscosity,
is the eddy viscosity,
,
,
,
,
.
.
is the modulus of the mean strain rate tensor,
is the turbulence kinetic energy generation,
is the generation of turbulence due to buoyancy,
is the turbulent Prandtl number for energy,
,
is the thermal expansion coefficient.
3.2.2. Initial and Boundary Conditions
Velocity components are initially set to zero to represent the calm air inside the model. Autodesk Ecotect is used to calculate the interior air temperature degrees.
Table 2 shows the starting temperature readings (Hour 0).
Boundary conditions must be defined on all surfaces of the computing domain. The boundaries include inflow, outflow (windows), and walls. If
and
denote the inflow, window, and wall boundaries, respectively, the implemented inflow boundary conditions are
Additionally, at the inflow boundary, the following empirical turbulence intensity is used:
where
is the Reynolds number, and
D is the inlet diameter. Alternatively, we can use
and
values on the inflow boundary,
The no-slip boundary condition for velocities, zero-value for turbulent kinetic energy, and zero-gradient for temperature and energy dissipation rate are chosen as the wall boundary conditions, i.e.,
where
is the outward normal unit vector on the wall.
Finally, the windows (outflow boundary), from which air is discharged outside it freely, can be formulated as,
where
is the outward normal of the outlet boundary.
3.2.3. Solver and Convergence Aspects
The above highly nonlinear partial differential system is solved numerically for seeking full simulation with different scenarios in the fluent environment based on the control volume approach. In order to discretize time derivatives, the segregated implicit solver and the second-order implicit scheme are utilized. In all the governing equations, the second-order upwind technique is adopted. Pressure is subjected to the second-order discretization technique. On the other hand, under-relaxation strategies are used to achieve convergences in the computations of the velocity, pressure, energy, turbulent viscosity, kinetic energy, and turbulent dissipation. Additionally, the PISO algorithm addresses the velocity–pressure coupling, using the skewness–neighbor coupling correction parameters. The windcatcher’s walls are considered adiabatic boundaries. The numerical simulation does not consider the wall heat losses as an assumption. Moreover, the density of air, specific heat, thermal conductivity and viscosity are formulated as a piecewise-linear profile of temperature. Finally, the model constants are listed in
Table 3.
3.2.4. Numerical Discretization
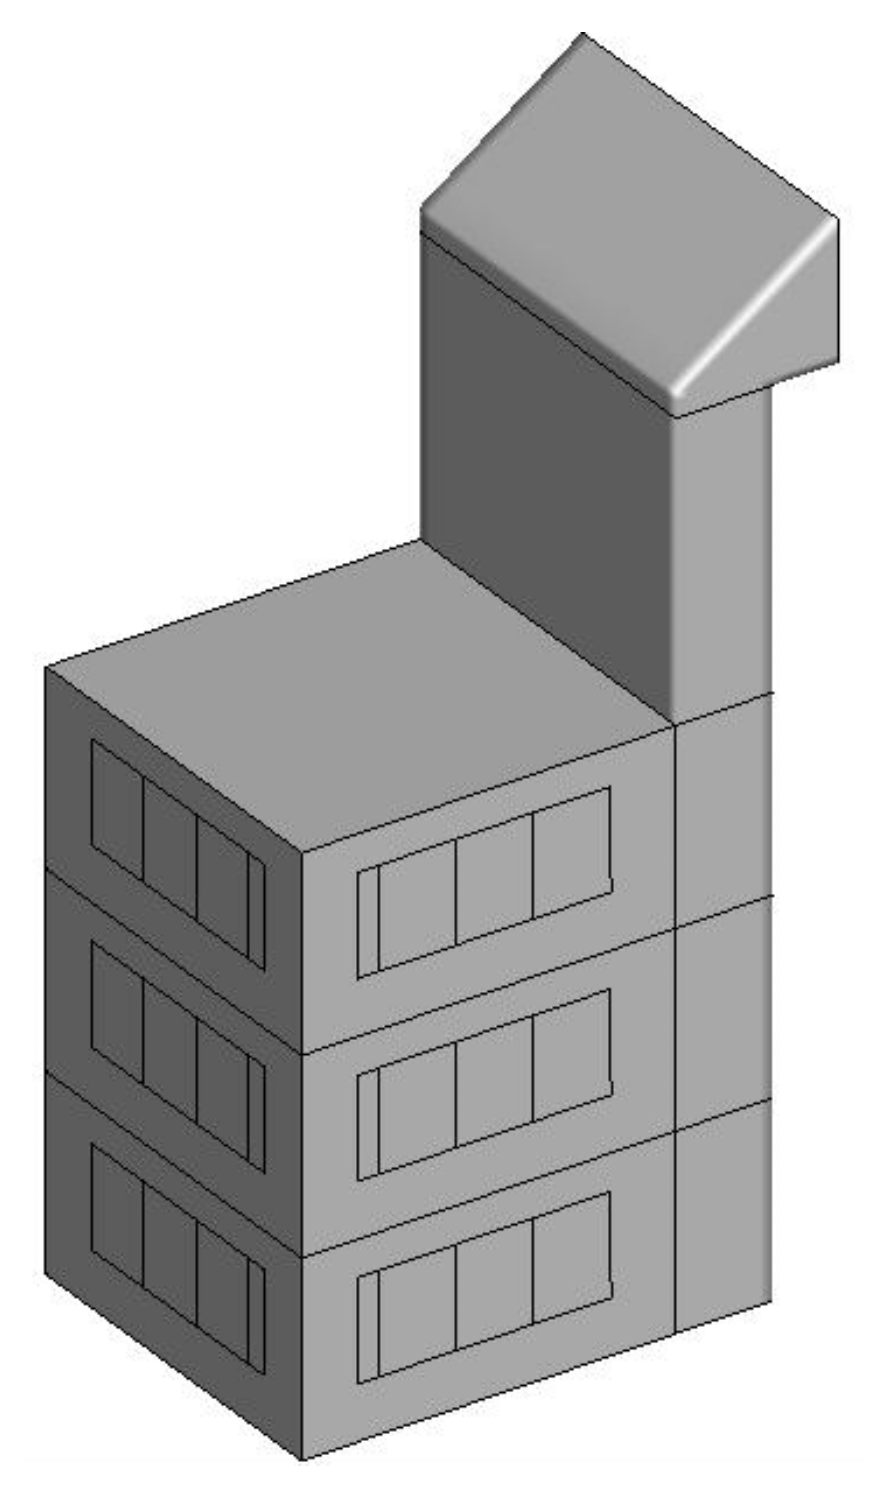
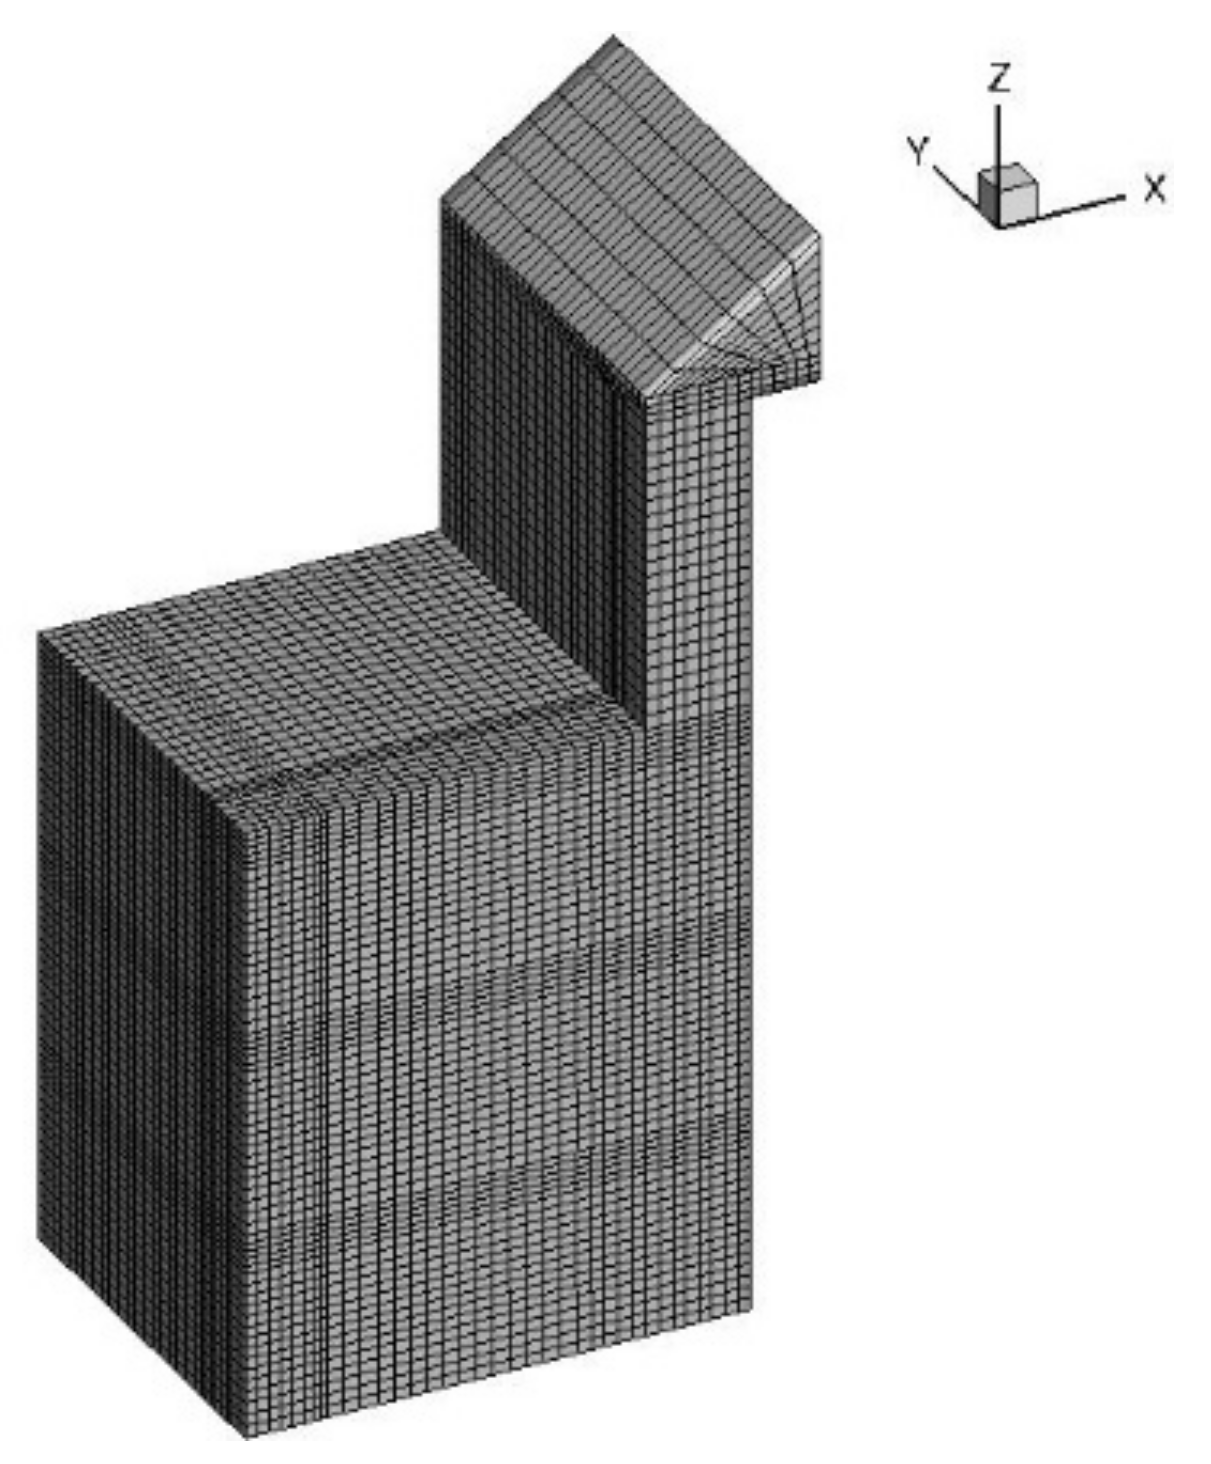
Discretization is essential in converting the continuous original partial differential equations to a stable, consistent, and accurate algebraic. The current research has implemented the finite volume approach for discretization. The finite volume method is the most natural based on the approximation of conservation laws directly in its formulation and is, therefore, flux conserving by construction. The CFD outline geometry is shown in
Figure 7 which illustrates the typical model used in the simulation. The corresponding numerical discretization (mesh) is presented in
Figure 8, which is divided into hexahedral cells.
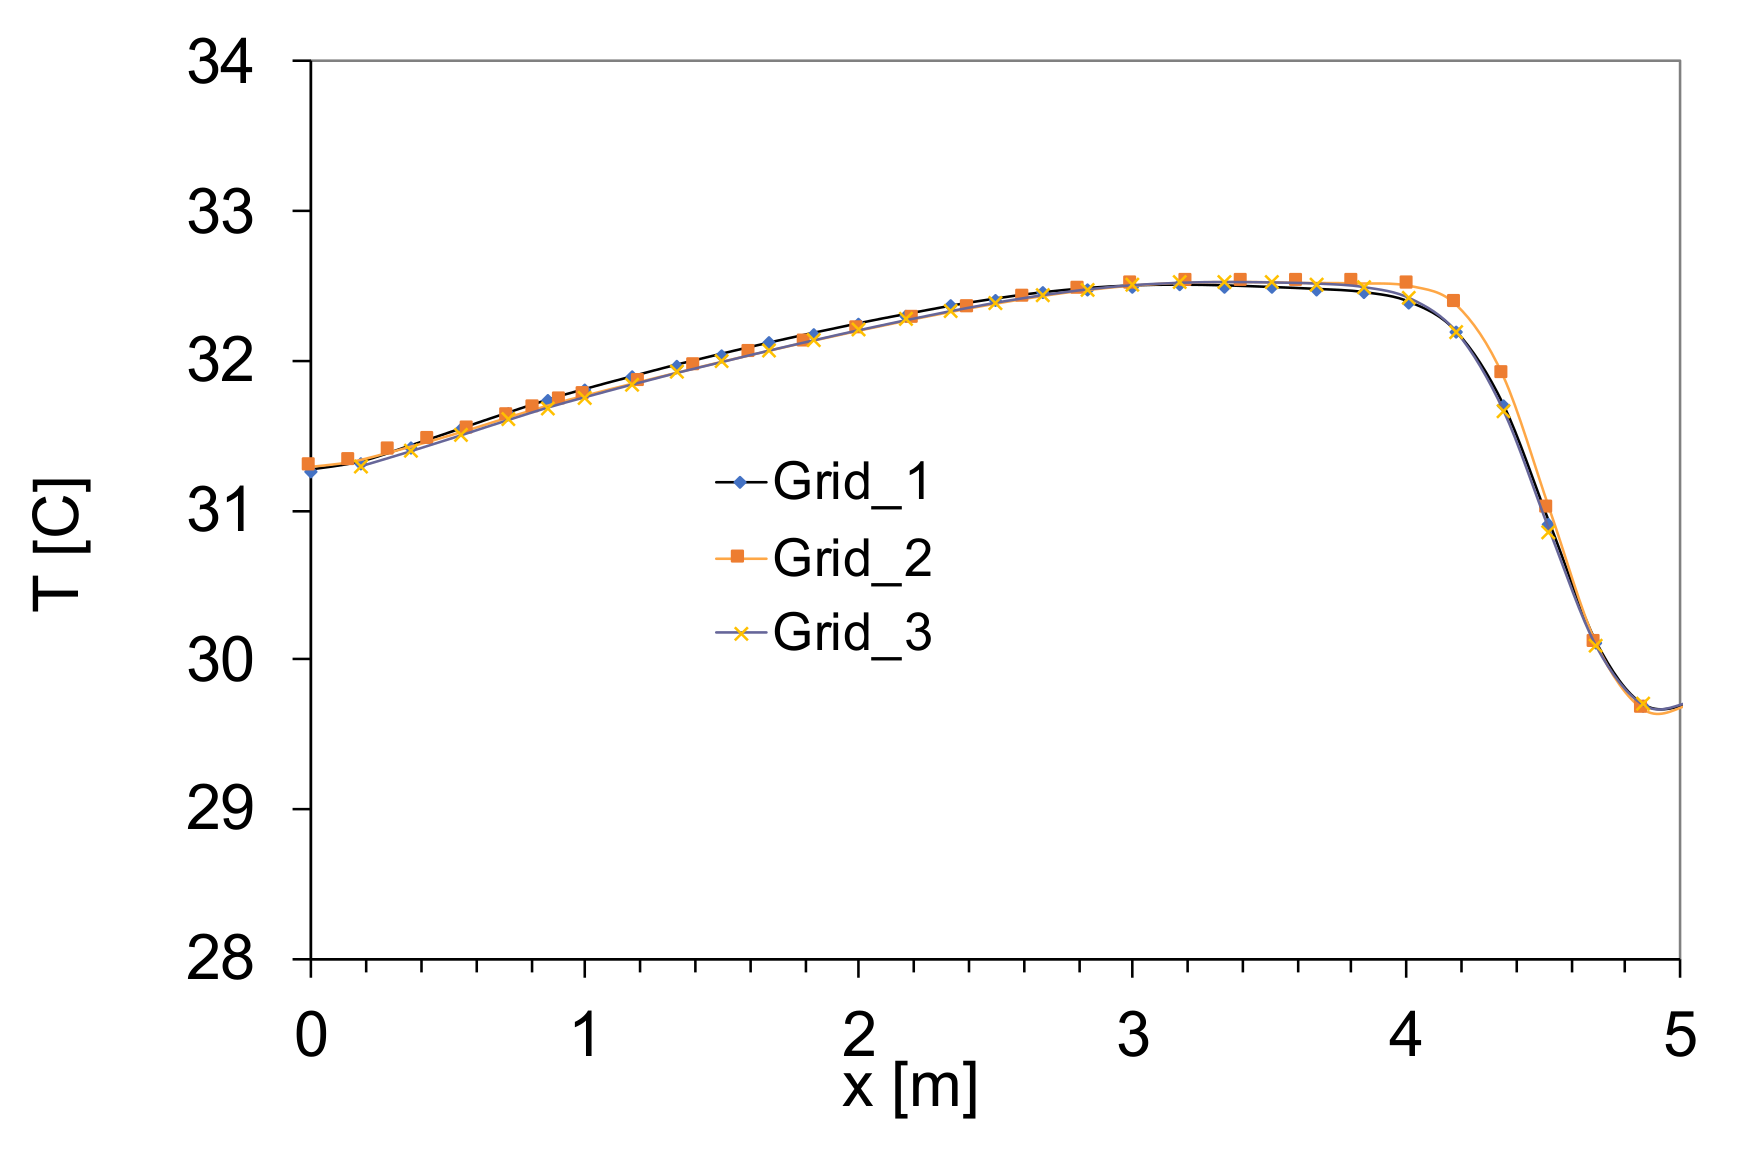
In a numerical solution, the number of cells in the discretized domain should not affect the accuracy. In order to perform this validation, the simulation is conducted three times with different grid sizes of quadrilateral cells systematically (grid-1, 53157; grid-2, 67480; grid-3, 85680). The grid refinement investigations for the temperature are shown in
Figure 9. The maximum deviation produced is roughly 0.11 K (2.4%) for grid-2, which is chosen in this calculation. The difference between the ambient and the initial temperature is used to compute the error.
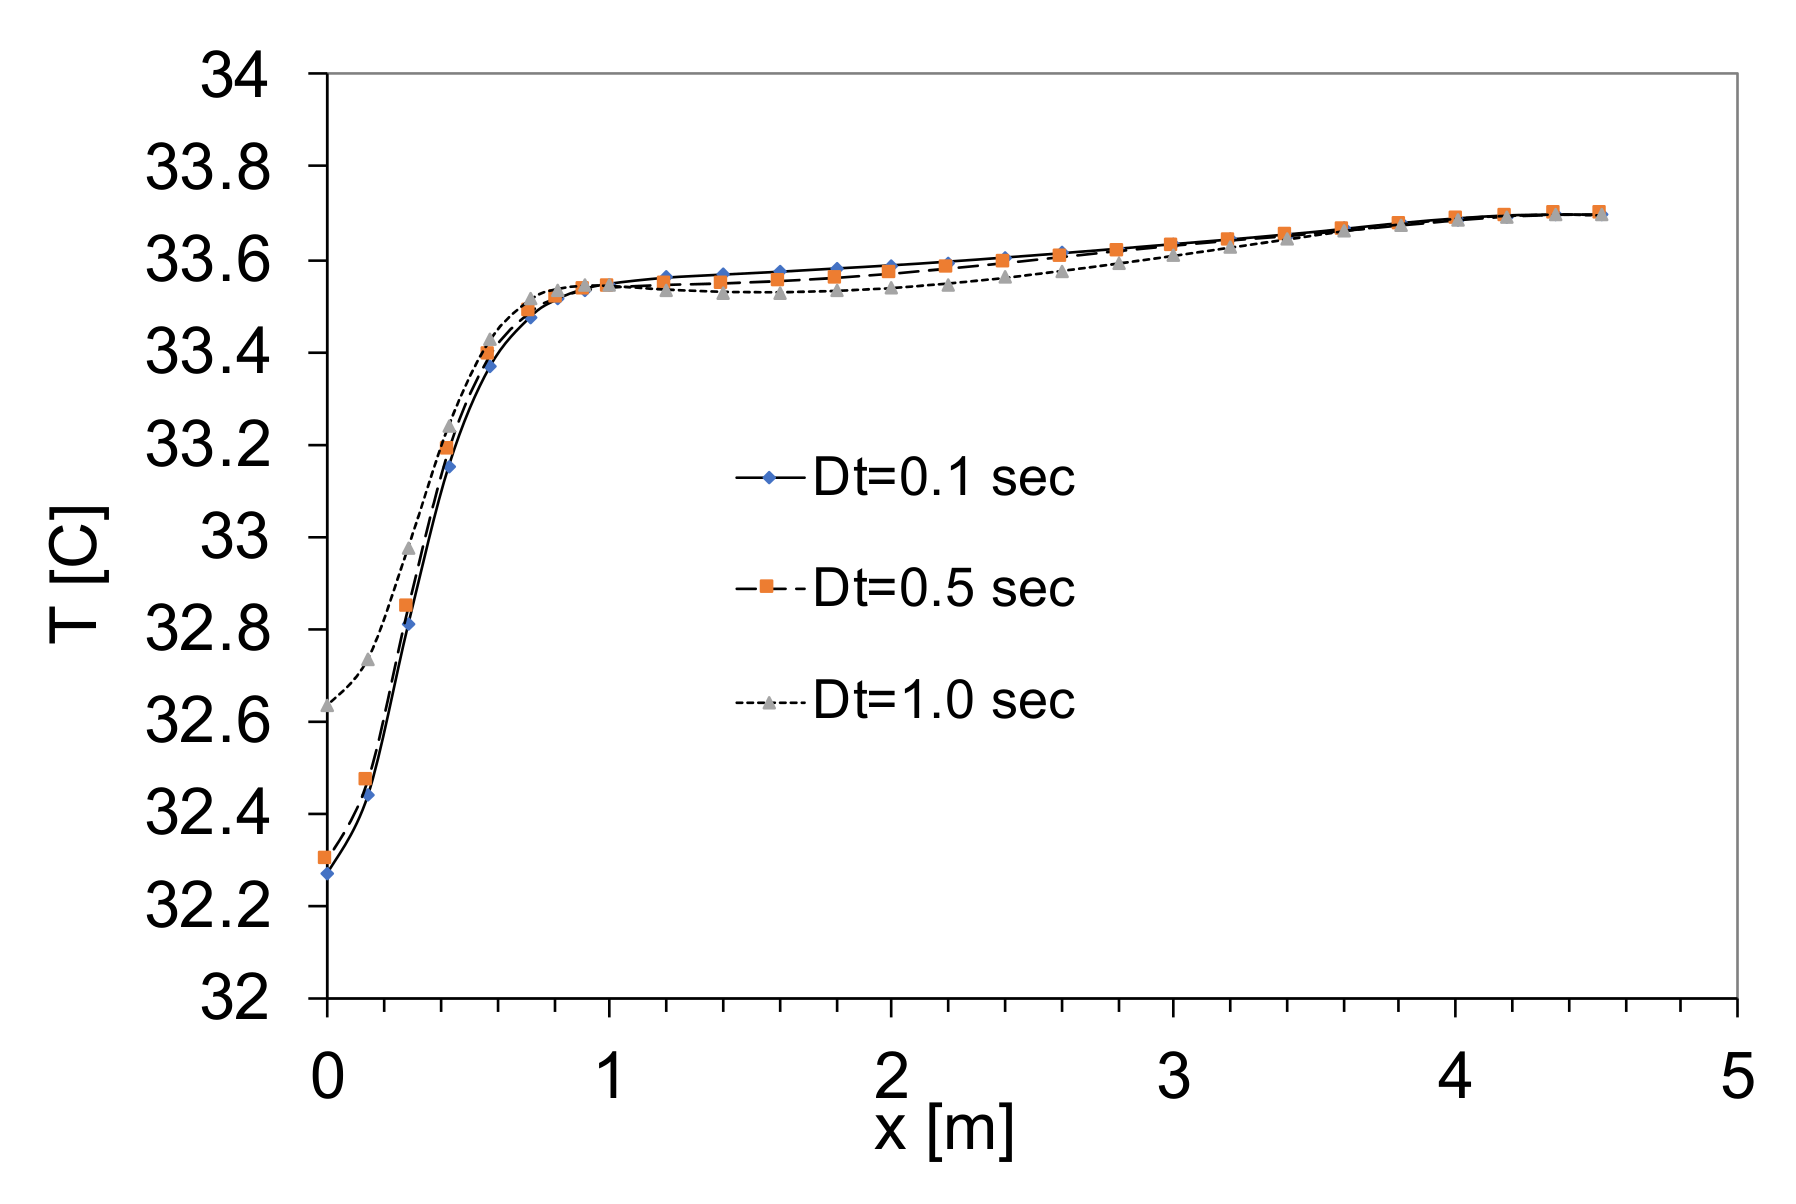
The present solution is unconditionally stable since the solver is fully implicit; nonetheless, the time-step size and number of iterations necessitate specialized techniques. Within 100 iterations, the time-step is set to 0.5 s, and convergence is obtained. Moreover, although the maximum number of iterations per time step is specified, the convergence requirements are met before the maximum number of iterations is reached. Additionally, we have to set a cap for the residual criterion. For the energy equation, it is chosen as
, and for the rest of the equations, it is selected as
. A suitable time-step is evaluated with temperature profiles as shown in
Figure 10 along the
x-axis in the center of the second floor and several time-step sizes (0.1, 0.5, and 1 s) after 20 s. Because the difference between the two time-step sizes, 1.0 and 0.5, is so tiny, we choose 0.5 s for the present simulation to save time.
4. Results and Discussion
In our previous work [
6], five scenarios were investigated for the different ratio for all openings of the windcatcher and the three floors building. The proposed scenarios depend on the literature review results and the scientific theories about airflow. Bernoulli’s principle states that an increase in the speed of a fluid occurs simultaneously with a decrease in pressure or a reduction in the fluid’s potential energy. Therefore, the different scenarios provide the space with varying ratios between the inward and the outward of the airflow. The scenarios gradually decreased the area of the inward and kept the outward opened completely [
6] (
Table 4).
It is concluded that sc#2 is better than sc#1. Since the same volume of air enters, the spaces should leave the spaces based on the Bernoulli effect. Therefore, decreasing the opening of the inward windows while the outward windows are opened completely helps to accelerate the airflow. Therefore, the third scenario decreased the inward to 50%. When sc#2 and 3 are compared, it is obvious that the performance of sc#3 is better than sc#2. The 50% opened inward was kept for the following two scenarios, while the airflow performance was tested with 50% opened side window and closed side window, respectively. The results revealed that sc#5 is better than sc#3 regarding the GF and the FF, while sc#3 is better than sc#5 with regard to the SF. This means that while it is preferable to open side window in the SF, it is not preferable to open it in the FF and the GF to avoid distraction for the airflow [
6].
The main recommendation from the previous work was to focus on two scenarios (Scenarios 3 and 5) (
Table 5). This section presents a full detailed simulation of the recommended two cases. However, let us call Scenario#3 Case#1 and Scenarios#5 as Case#2.
Table 3 shows an overview of the two mentioned scenarios such that IW refers to “Inward,” SW refers to “Side Window,” and BW refers to “Back Window”.
The presented scenarios are based on the literature research findings and scientific views concerning airflow. According to Bernoulli’s principle, a rise in a fluid’s velocity is accompanied by a drop in pressure or a decrease in the fluid’s potential energy. As a result, the various scenarios are designed to provide the area with variable internal and outward airflow ratios. The inner region of the scenarios steadily reduced, but the outside area remained entirely open. Based on the Bernoulli effect, the same amount of air entering the room should leave it. As a result, lowering the inside opening while fully opening the outer window helps to speed up circulation. As a result, the possibility was to reduce the inflow to 50%. In the following two situations, the airflow performance was evaluated with a 100% opened side window and a closed side window, respectively.
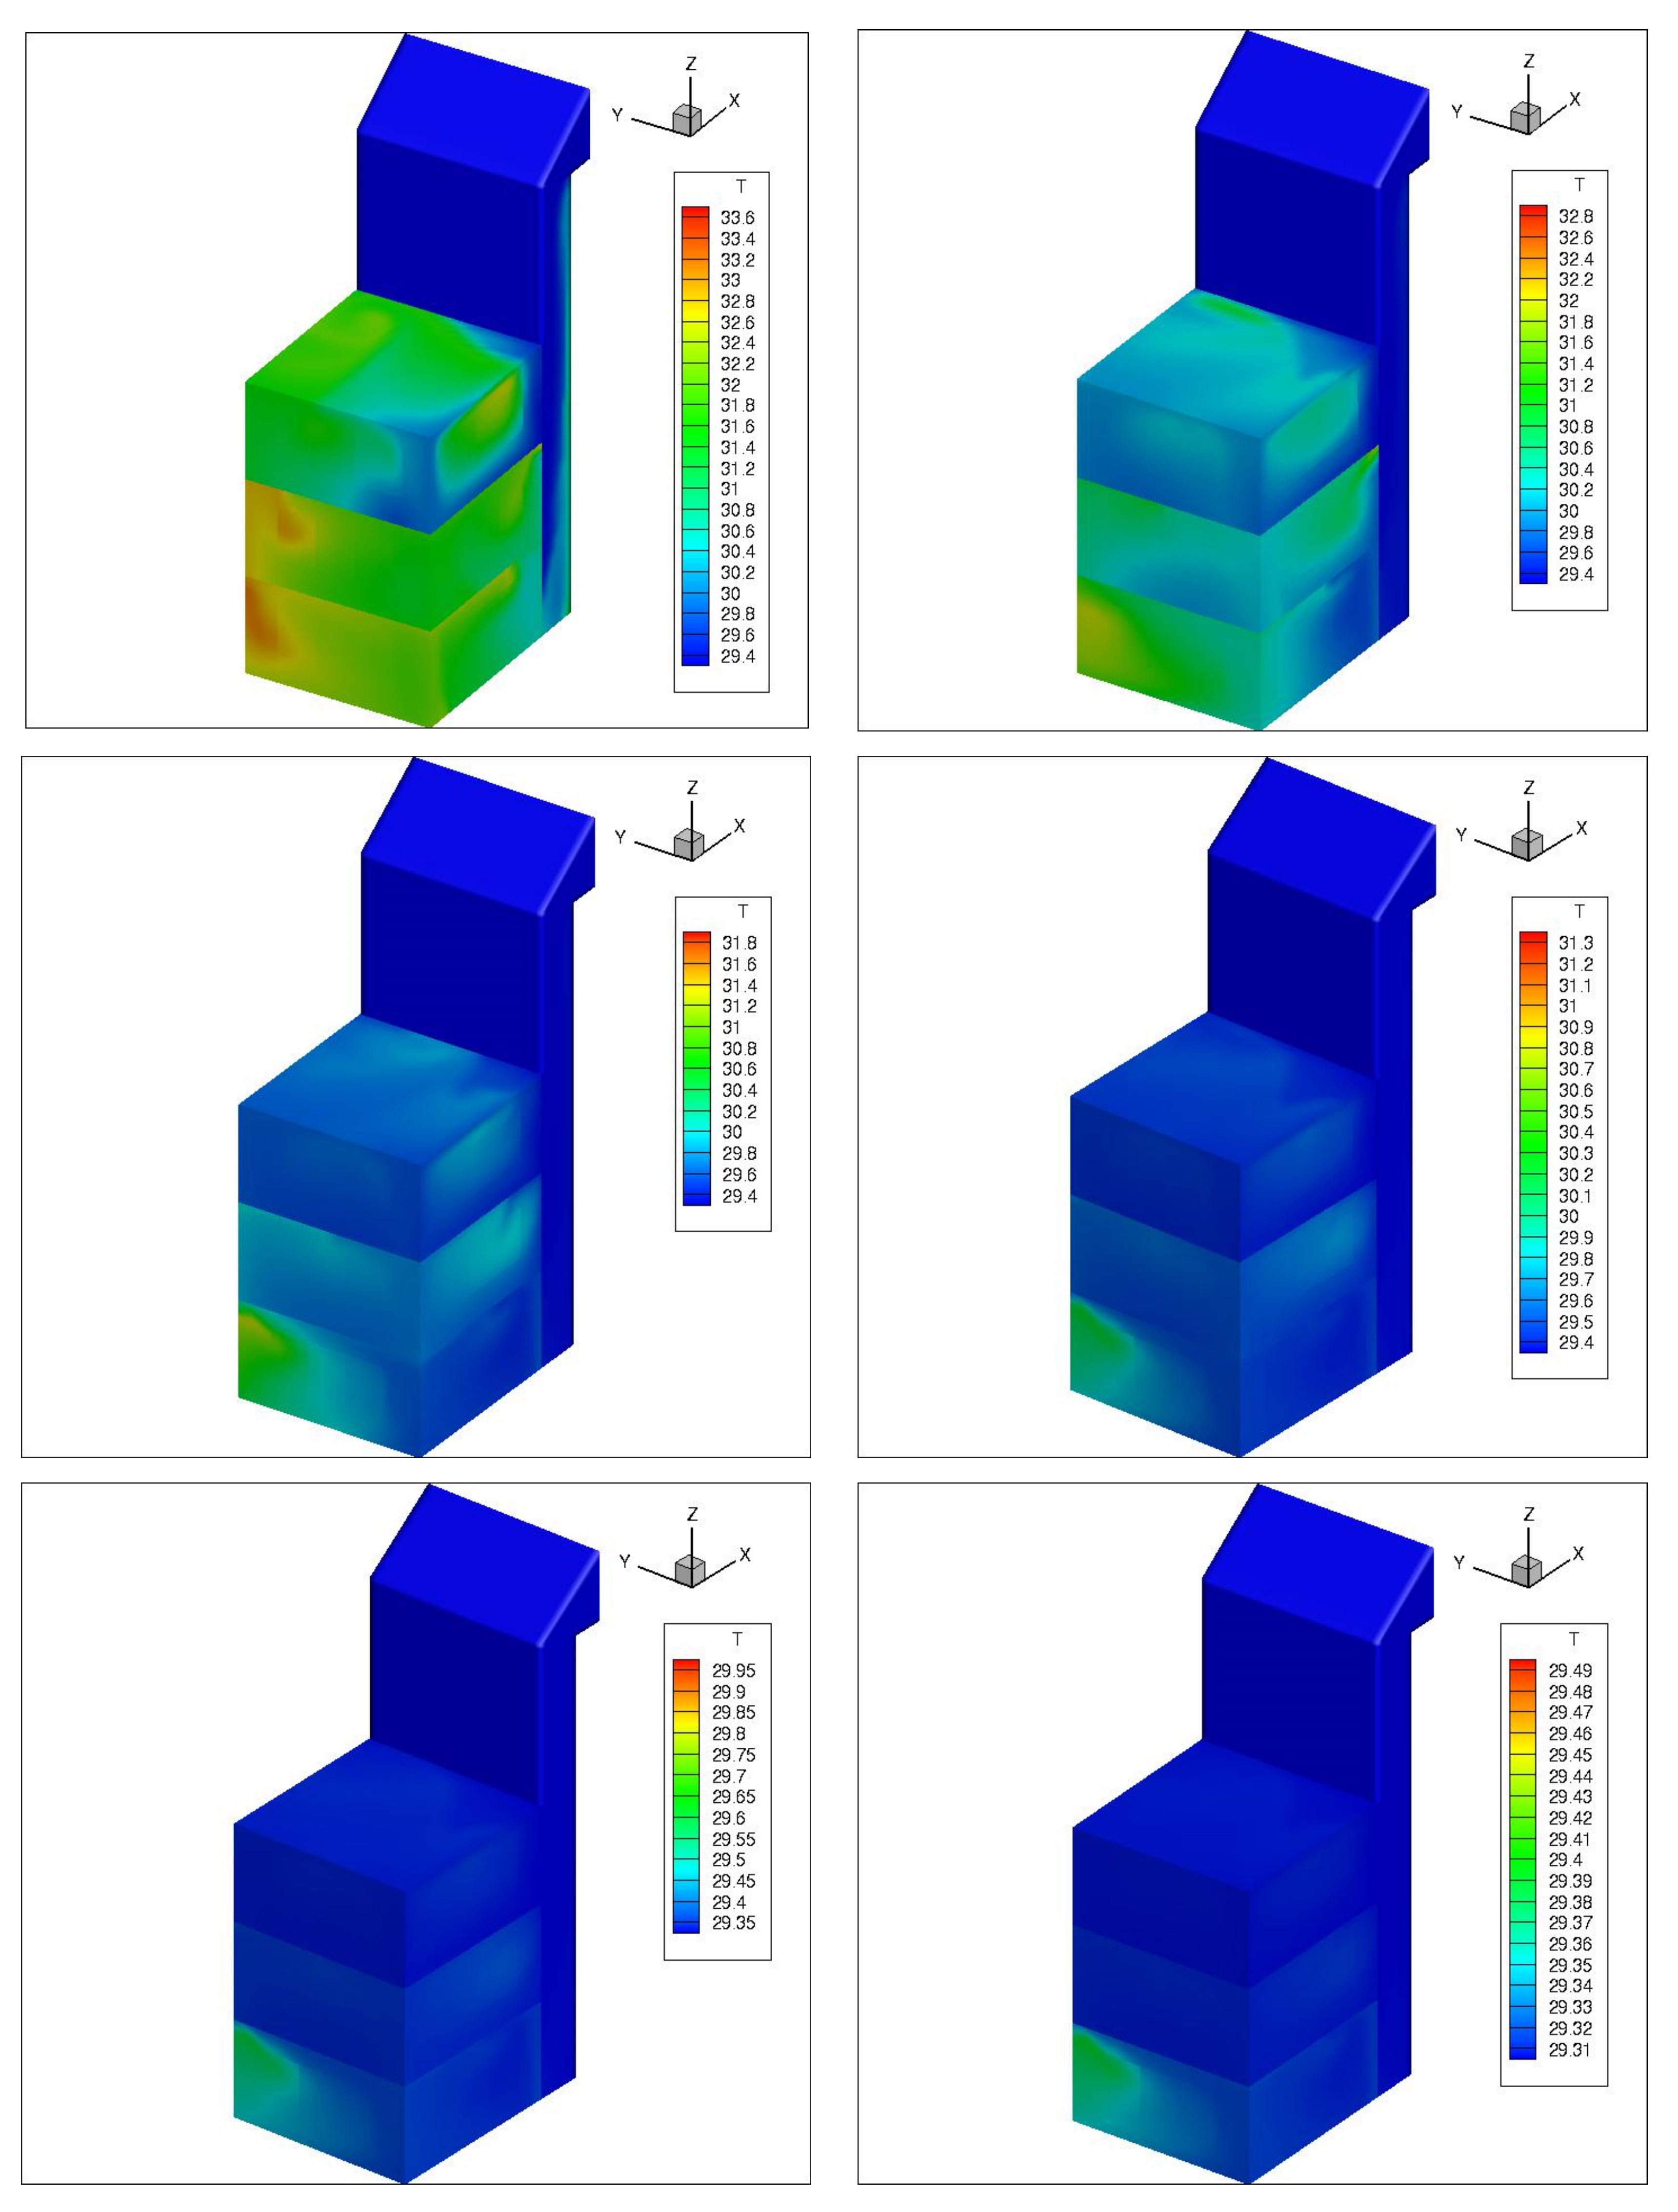
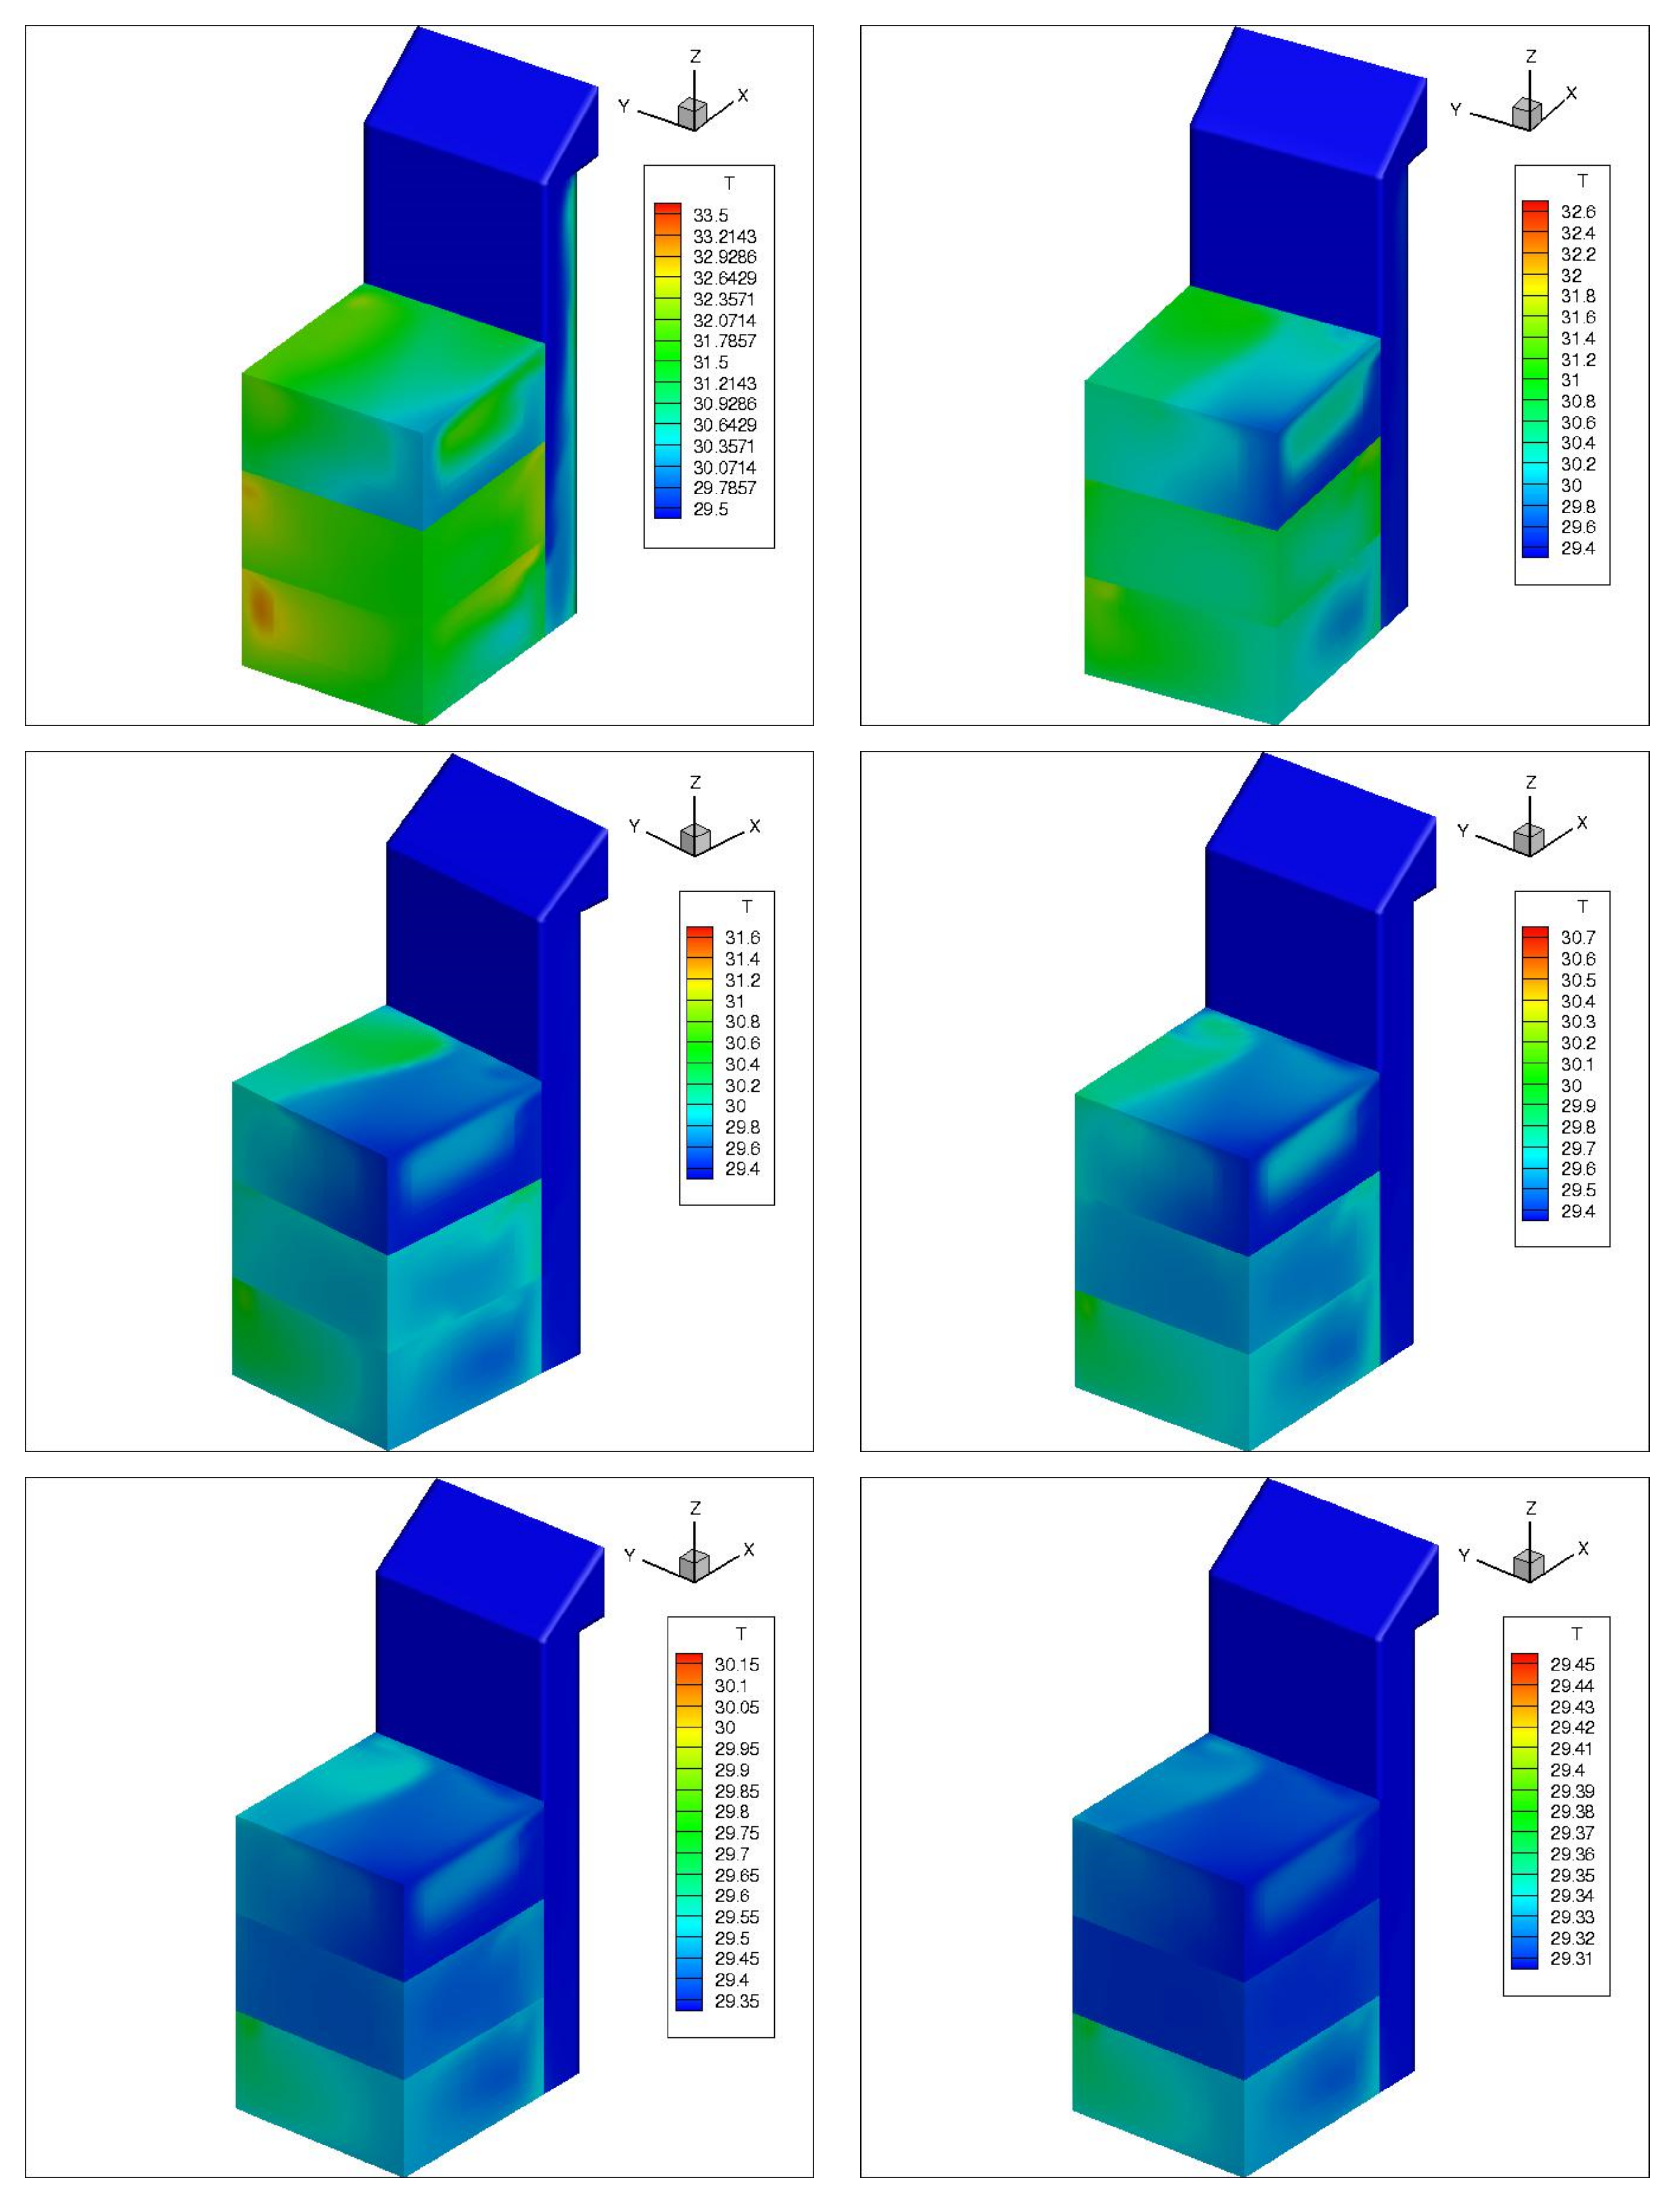
In the previous analysis, the values of the temperature and average air velocity inside at the middle point for each floor for the two cases under consideration showed that the cooling process of Case 1 is faster than in Case 2. Moreover, because the same volume of air enters and leaves the spaces, based on the Bernoulli effect, reducing the inner opening while leaving the exterior windows fully open speeds up the circulation. The findings indicated that Case 2 outperforms Case 1 in terms of GF and FF, but Case 1 outperforms Case 2 in terms of SF. Therefore, in the current study, more detailed phases are considered for analysis. The 3D temperature distribution of Cases 1 and 2 are investigated after 20, 40, 60, 80, 120, and 160 s (
Figure 11 and
Figure 12). As shown from the figures of Case#1, in around three minutes, the temperature is reduced by around three degrees. Additionally, one may notice that the third floor is cooled down faster than the other two floors. Similar results can be seen in
Figure 12, which also presents the 3D temperature distribution of Case 2, after 20, 40, 60, 80, 120, and 160 s. In this case, the temperature is reduced by one degree only in three minutes. This indicates that Case 1 is doing much better than Case 2.
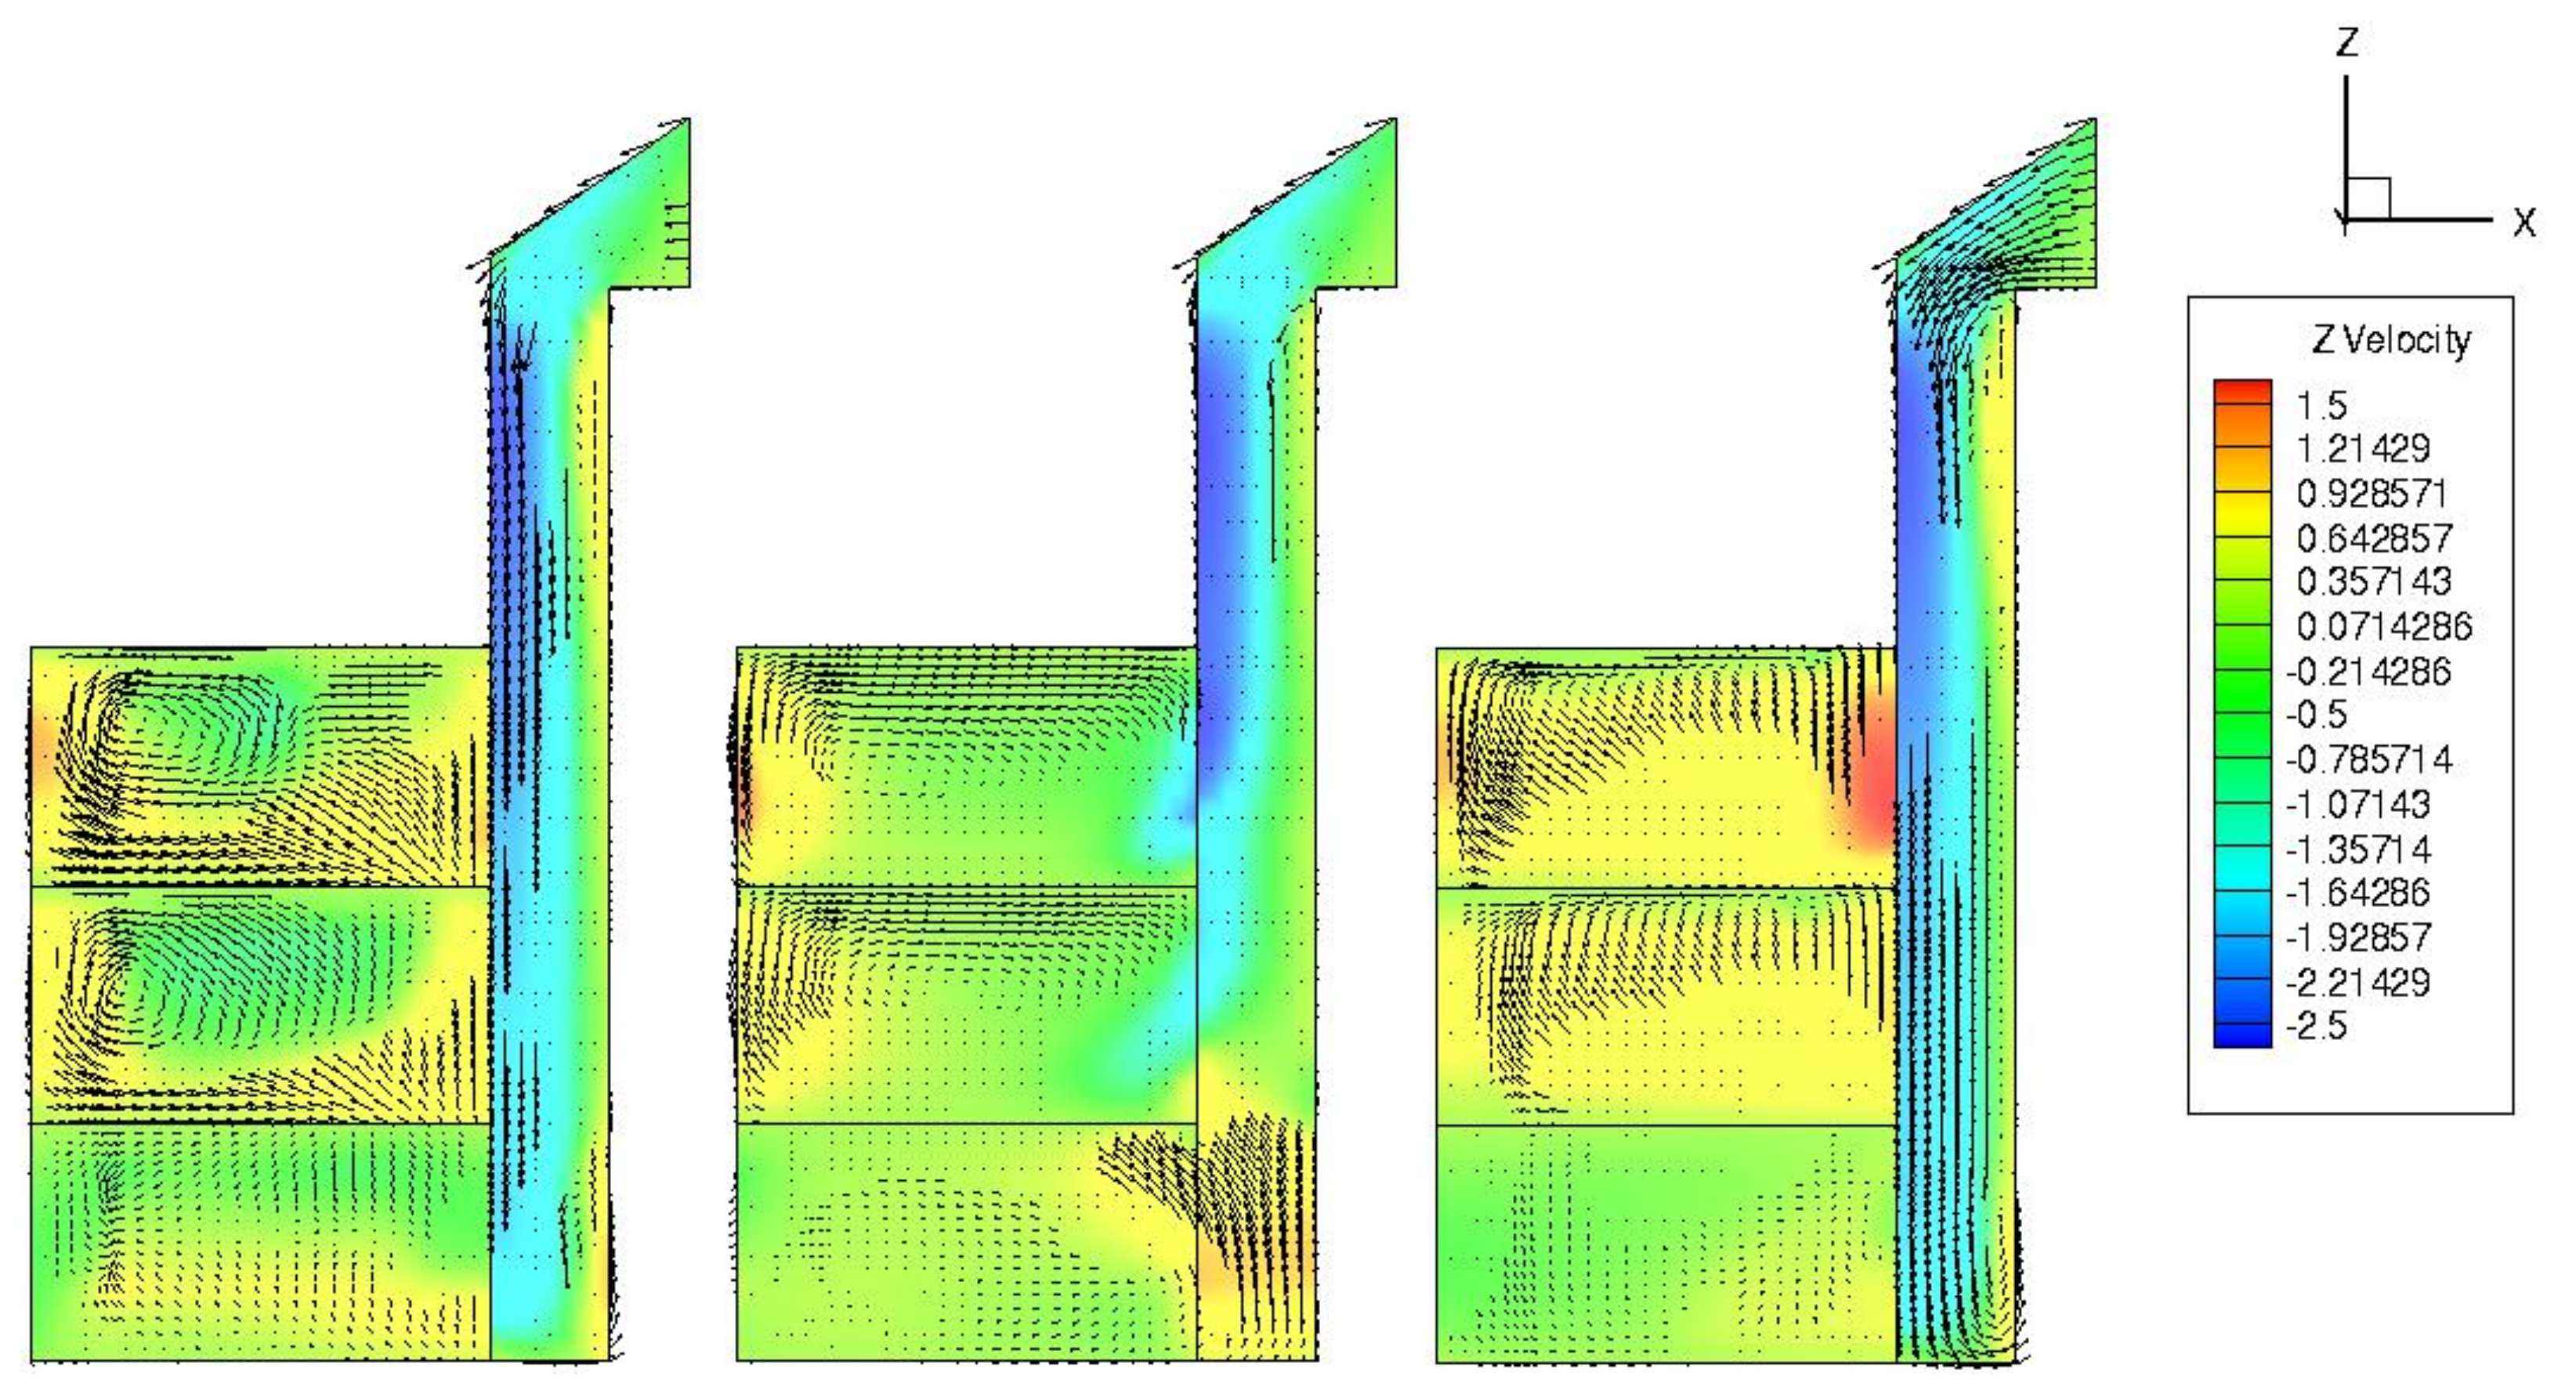
The direction of velocity in Case#1 is visualized in
Figure 13 using both vectors field and contours at different cross-sectional planes y = 0.0, 2.43 and 4.86 cm, after 60 s. The vector size refers to the magnitude of the velocity.
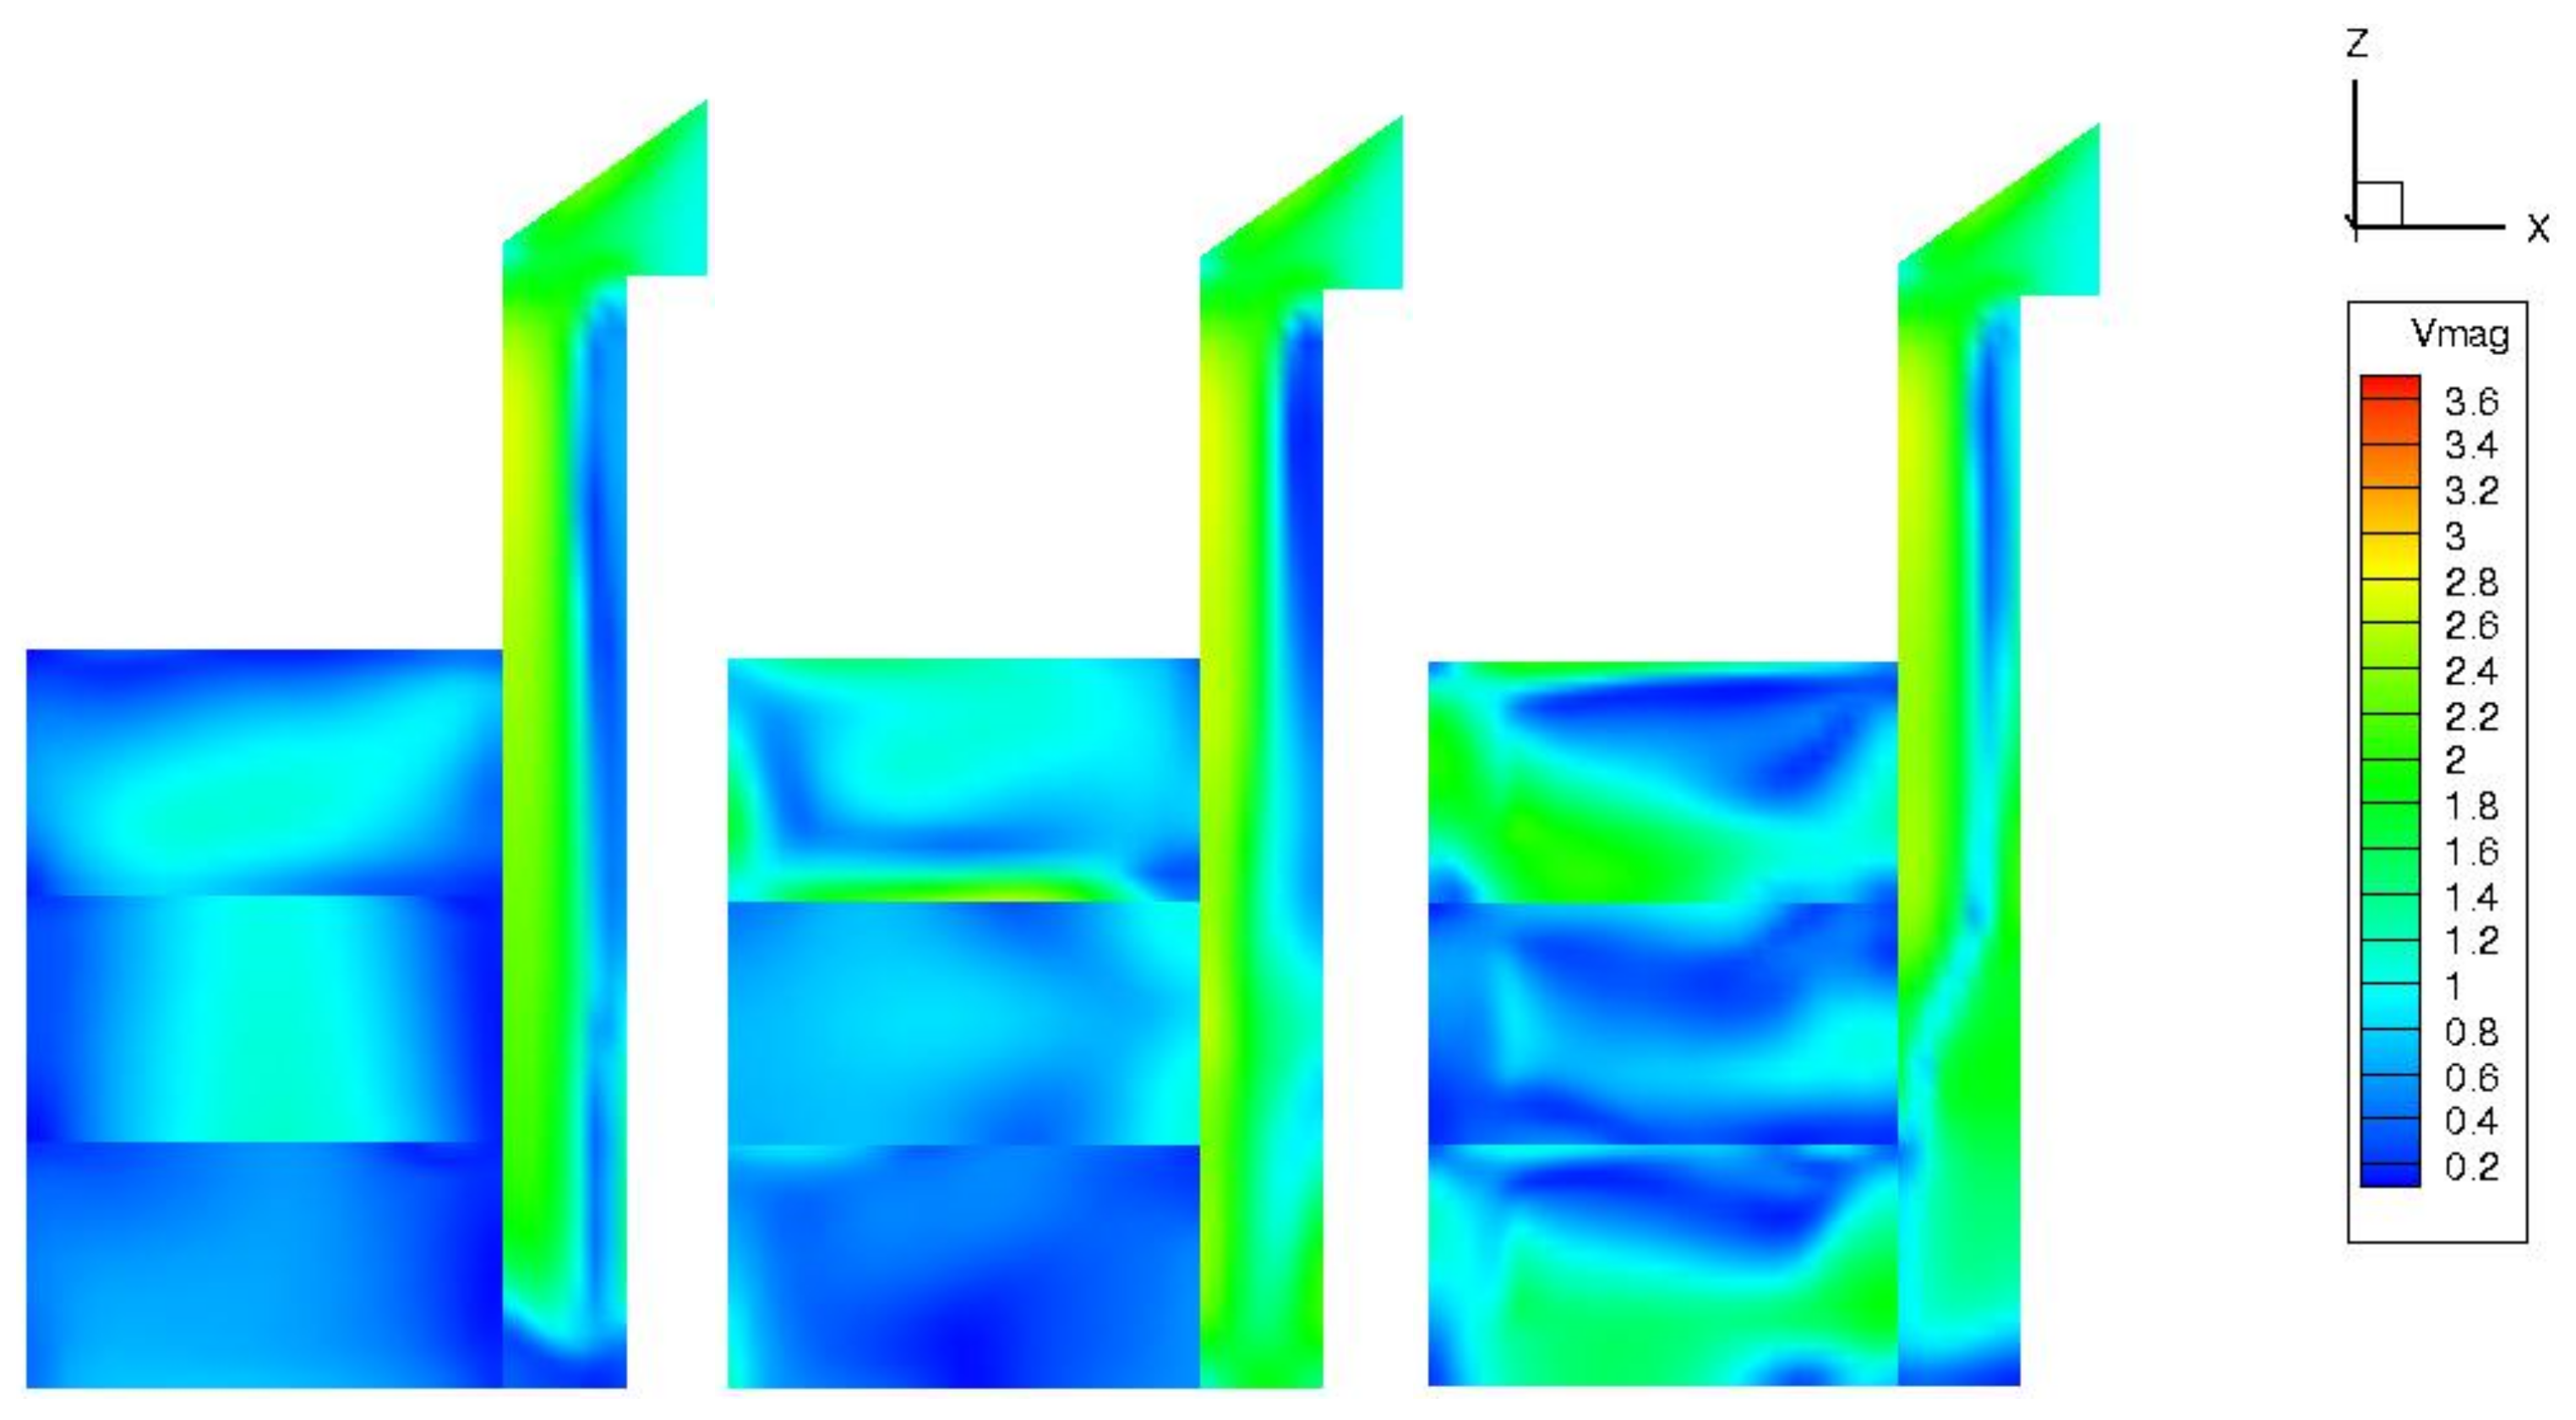
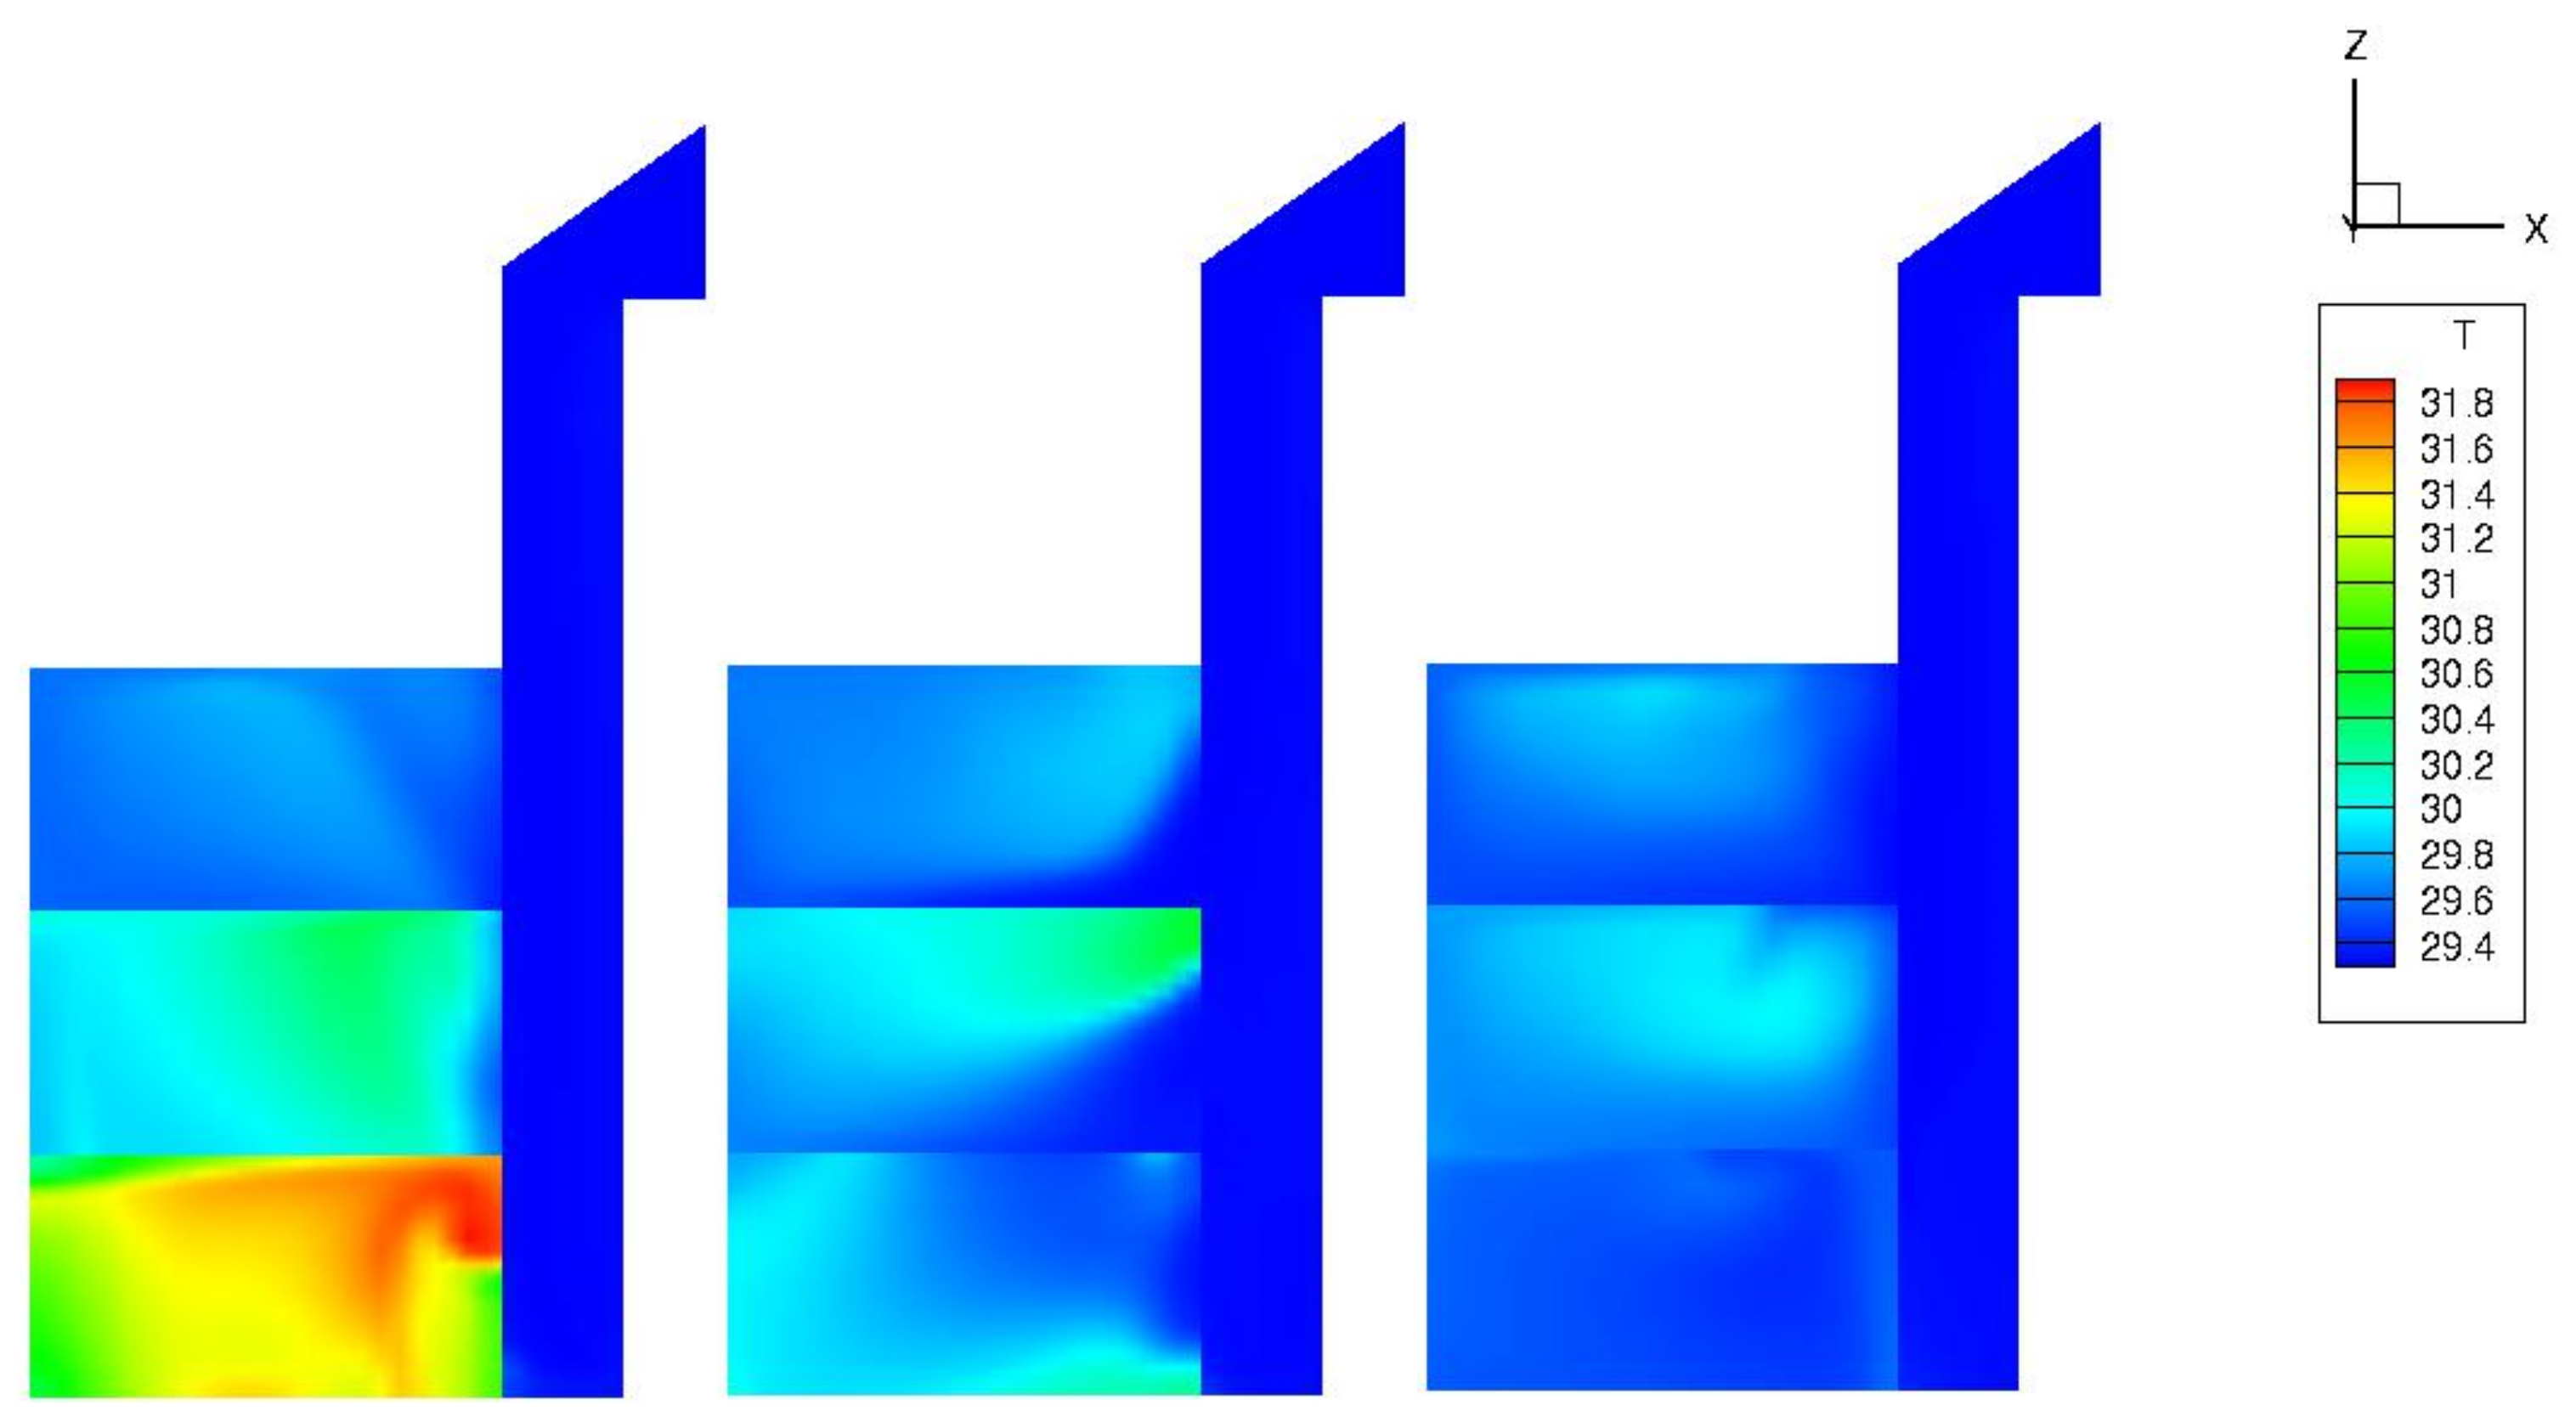
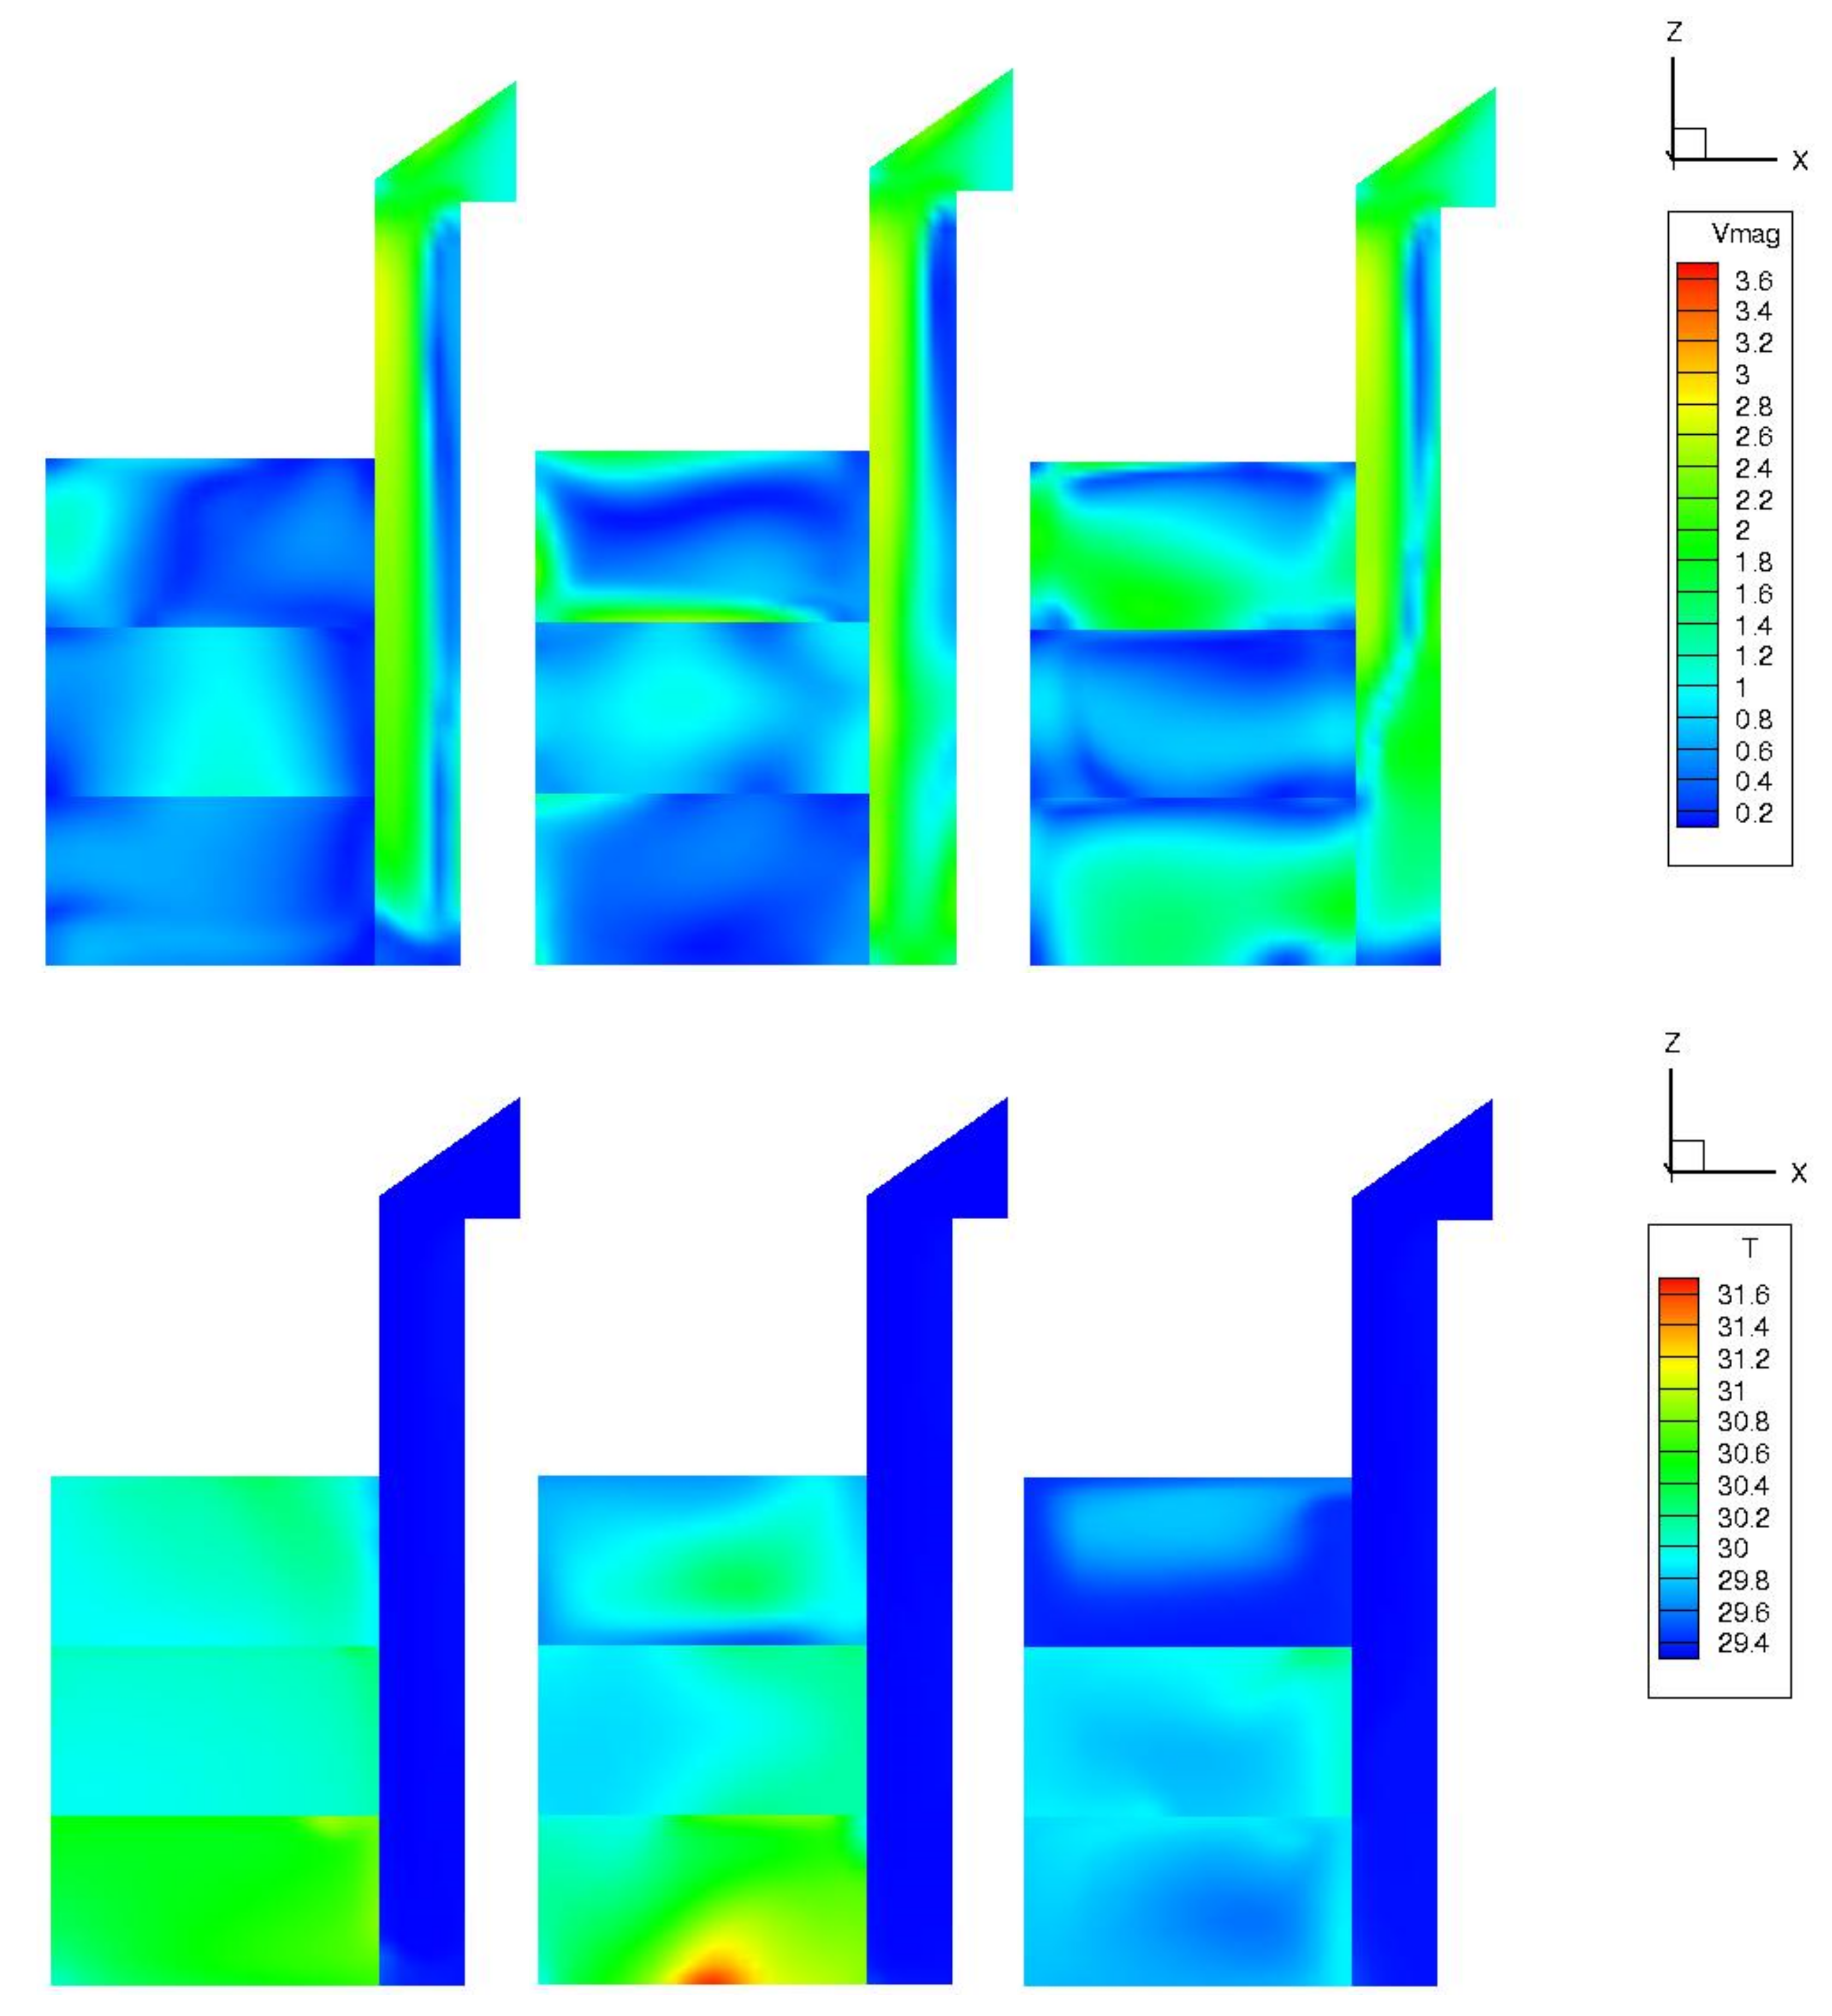
The air velocity magnitude and temperature distribution inside the model were simulated to understand the results better. The magnitude velocity and temperature distribution inside the model are depicted in
Figure 14 and
Figure 15, along the models’ right, center, and left sides in three vertical portions. The internal temperature and the air movement inside the three floors were simulated to understand the results further, as shown in
Figure 14. This figure illustrates the air temperature inside the three zones for Case 1 after 60 s, at three vertical sectors y = 4.86 m (left side), 2.43 m (center), and 0.0 m (right side). Similarly,
Figure 15 presents the temperature distribution and velocity field inside the model of Case 2 at different cross-sectional planes y = 0.0, 2.43, and 4.86 cm after 60 s. It is interesting that portions with high velocity have less temperature and vice versa.
It is also apparent that—in general—the airflow has a significant effect in lowering the air temperature inside the three zones. When comparing velocity, magnitude and temperature, it is evident that Case#1 is also better than Case#2 in accelerating the air velocity and reducing the air temperature.
5. Conclusions
The CFD simulation was developed for the 3D windcatcher. The mathematical highly nonlinear model that governs the cooling phenomena consists of the Reynolds-averaged Navier–Stokes equations (RANS), the realizable k-ϵ turbulent equations, and the energy (heat) equation. All necessary computational aspects were carefully considered to ensure the results’ accuracy. Two different inflow and outflow scenarios recommended in our previous paper were deeply discussed. The results present possible 2D/3D visualization, graphs, and numerical data in simultaneous temperature and airflow distribution tables. It was found that the second floor cooled down faster than the other two floors. In the sense of on average temperature reduction, Case 1 is doing much better than Case 2. It is also obvious that—in general—the airflow has a significant effect in lowering the air temperature inside the three zones. When comparing the air velocity magnitude and temperature distribution inside the model, it was interesting to notice that portions with high velocity have lower temperature and vice versa. When comparing velocity, magnitude and temperature, it was evident that Case#1 is also better than Case#2 in accelerating the air velocity and reducing the air temperature. This confirms the concept of increasing the outward opening (back and side openings) to achieve more air velocity from the inward opening and to reduce the air temperature.
Several recommendations from the literature review, the field study and the simulation could be drawn from the analytical literature review, such as the following:
The evaporative cooling of the air by wetting the wall areas of the porch column could be used to cool down the air temperature.
The number of openings plays an important role, as the larger the number of openings, the less sensitive the power references to the wind angle become.
The rectangular section is more efficient than the circular section.
The short windcatcher shows better performance on the upper floors, while the lower effect on the ground floor is confirmed in the case of the long one.
The maximum pressure coefficient at the inlet of the windcatcher occurs at zero wind angle and is reduced by increasing the angle, while it can operate as a wind scape (wind chimney) when oriented more than 55 against the prevailing wind direction. This means that the maximum efficiency is achieved at zero air incidence angle.
It is recommended to use the windcatcher for no more than three floors.
A side opening is recommended to accelerate the air velocity and to reduce the air temperature.
It is recommended to increase the area of the outward opening to 200% of the inward opening.
This research opens the door for future engineering research to investigate the appropriateness of such passive measures in Jeddah and also to further investigate the buildability of the windcatcher and the possible treatments that could be added to overcome any obstacles preventing the application of this amazing passive technique.


