Article

Benthic Macroinvertebrates and Zooplankton Communities as Ecological Indicators in Urban Wetlands of Argentina

by
María Julieta Arias
1,†,
Pablo Andrés Vaschetto
1,2,†,
Mercedes Marchese
3,
Luciana Regaldo
1,2 and
Ana María Gagneten
1,*
1
Laboratorio de Ecotoxicología, Facultad de Humanidades y Ciencias (UNL), Ciudad Universitaria, Santa Fe 3000, Argentina
2
Consejo Nacional de Investigaciones Científicas y Técnicas (CONICET), Buenos Aires 2290, Argentina
3
Instituto Nacional de Limnología (INALI, UNL-CONICET), Santa Fe 3000, Argentina
*
Author to whom correspondence should be addressed.
These authors contributed equally to this work.
Sustainability 2022, 14(7), 4045; https://doi.org/10.3390/su14074045
Submission received: 30 January 2022 / Revised: 14 March 2022 / Accepted: 24 March 2022 / Published: 29 March 2022

Abstract

:
Urban aquatic ecosystems are important sources of fresh water for multiple uses, but often receive a point or diffuse anthropic contamination. Benthic and zooplankton invertebrates are sensitive to water quality, being good indicators of ecosystem health. In this study, the composition and structure of benthic and zooplankton communities and environmental variables were analyzed seasonally in six urban wetlands of Santa Fe City (Argentina). We present the effect of water quality on both communities as bioindicators of ecological conditions, using different community attributes, functional feeding groups, and biotic indices. For the benthic community, the Macroinvertebrate Index for Pampean Rivers (IMRP) and the Benthic Community Index (BCI) were selected. For the zooplankton community, abundance of rotifers/abundance of total zooplankters, microcrustaceans/total zooplankters, cladocerans/total zooplankters, and macrozooplankton/microzooplankton ratios were applied. A functional feeding groups (FFGs) classification, adapted from the literature, is proposed for zooplankters. The urban wetlands showed a gradient from the most to the least disturbed sites. Some benthic and zooplankton species were identified as excellent bioindicators of pollution, and the FFGs and biotic indices revealed the ecological condition of each urban wetland. The present study contributes to the enhancement of management practices in urban landscapes aiming to maintain ecosystem services in sustainable cities.

1. Introduction

According to the United Nations, 66% of the world’s population will live in cities by the year 2050 [1]. Such prospects give rise to significant challenges and problems that tend to jeopardize the environmental, economic, and social sustainability of cities [2]. Simultaneously, the demands of sustainability and objectives set at national and international levels require that actions be taken to reconvert urban systems innovatively and more sustainably. It is well known that the natural environment of a city is a strategic component necessary to promote the success of sustainable and smart city initiatives [3].
A key aspect of current environmental protection and integration strategies involves the evaluation of ecosystem services provided and their relation with ecological integrity, and by extension, biodiversity [4,5]. Developing biodiversity-friendly cities is thus inextricably linked to sustainable urban development and human well-being [6]. Therefore, urban systems can be critical for native biodiversity conservation [7], but studying them as ecosystems cannot be accomplished in isolation from the problems that they face [8]. In this context, understanding pollution’s effects on aquatic biodiversity can contribute to its conservation. Currently, there is a relative consensus concerning the conservation of urban biodiversity and its achievement through the planning and management of urban green spaces [9,10].
In particular, urban wetlands are key environments in sustainable cities, but they often receive a point or diffuse contamination resulting from many types of human activities. These include the discharge of agrochemicals, industrial and sewage effluents, and urban and industrial waste products, potentially turning them into a sink of diverse contaminants. Urban wetlands provide ecosystem services that contribute to the maintenance and sustainability of urban ecological health and the overall quality of life in urban regions [11,12]. The services they provide depend mostly on their ecological integrity, so it is crucial to maintain them [13].
To address this challenge, scientists, policymakers, governments, and stakeholders aim to understand the impact of human activities on wetland ecosystems, to ensure the sustainable supply of these services [14,15]. Among research priorities, the development of indicators that allow for the integrative assessment of biodiversity conservation and sustainability objectives stands out [16]. However, in a Special Issue on “Biodiversity Conservation and Sustainable Urban Development”, Kowarik et al. (2020) [6] recently covered contributions from a wide geographical range, including Africa, Asia, Australia, Europe, and North America. However, no urban biodiversity conservation strategies from South America were taken into account. In this scenario, the present contribution could help to fill this gap.
Freshwater biodiversity can be protected by improving the ecological quality of wetlands in urbanized landscapes [17,18]. Therefore, the development of effective and reliable tools for water quality assessment is of the utmost importance, and the assessment of the biodiversity of urban aquatic systems could help identify the best indicators of environmental health [19,20]. The monitoring of freshwater communities to link community attributes to ecosystem interactions and functions was proposed as a basis for determining their relation to the Sustainable Developing Goals (SDGs) [21]. In this regard, both benthic and zooplankton invertebrates are considered as good indicators of multiple environmental conditions, which coupled with simple and low-cost monitoring techniques makes them effective bioindicators [22,23].
Benthic invertebrates are considered as indicators of environmental health worldwide. Their relevance as bioindicators stems from their possessing traits such as life cycle length, sedentary habits, and differential responses to pollution. Their exposure to toxic substances can be either through food or by body contact with contaminated sediment or water. They integrate environmental conditions over a long time and may show impacts not detected by traditional physical and chemical water quality assessments, thus being relevant indicators of the state of the aquatic ecosystems [21,24,25,26,27,28].
On the other hand, zooplankton invertebrates are widely used as bioindicators for monitoring and assessing aquatic ecosystem integrity under several stress factors [29,30,31]. They are intimately linked to environmental conditions and different biotic factors [19,32,33]. Unlike large animals, they can respond quickly and with high sensitivity to environmental changes, given their small size, high reproductive rates, and wide dispersion [31,34]. Freshwater zooplankton contributes as well to carbon and nutrient cycling, and also the control of phytoplankton blooms, while acting as an intermediate link in trophic webs [35,36].
Both benthic and planktonic invertebrates have been analyzed together to determine differential tolerance to xenobiotics, such as organic compounds [37,38,39], heavy metals [40], or trophic status [41]. Comparing both communities, considering their differences in habitat and trophic niches, can provide an integrated view of each ecological condition, which could allow for finding the most sensitive species of both communities and how they jointly respond to disturbances. In addition, this approach has the potential to compare the ecological conditions of different environments.
Perturbations in aquatic ecosystems can lead to a reduction in diversity. Accordingly, numerous diversity indices have been developed to assess aquatic ecosystem health. Among the advantages of diversity indices, they are easy to use and calculate, applicable to different kinds of water bodies and taxonomic groups, have no geographical limitations, and are therefore relevant for comparative purposes. Numerous water quality indices based on biota have been developed in recent decades [42,43,44]. Many of these indices provide an estimation of not only the ecological status of an aquatic ecosystem, but also of its condition and health, linking physicochemical and biological conditions [21].
Some decades ago, the focus on functional traits attracted greater interest than taxonomic ones. Many authors claim that the functional approach highlights the existing relationships between community structure and the functioning of ecosystems facing multiple stress factors [45,46,47]. In addition, it is widely known that environmental filters select taxa with traits that allow them to coexist under similar environmental conditions or types of disturbances [48]. Therefore, in this study, we compare both communities, analyzing FFGs’ responses to a gradient of disturbed urban wetlands.
This study aimed to assess the effects of water quality on benthic and zooplankton communities as bioindicators of ecological quality in six urban wetlands of Santa Fe city (Argentina). The study comprises a comparison of different community attributes, functional feeding groups, and biotic indices. Based on previous knowledge, we expected that: (1) It is possible to differently discriminate the water quality of urban wetlands, using either benthic or zooplankton indicator species, and establish a gradient of disturbance. (2) A degree of disturbance can also be estimated using indicator species of both communities together. (3) The simultaneous study of both communities can provide more information on the water quality effects than if considered separately.

2. Materials and Methods
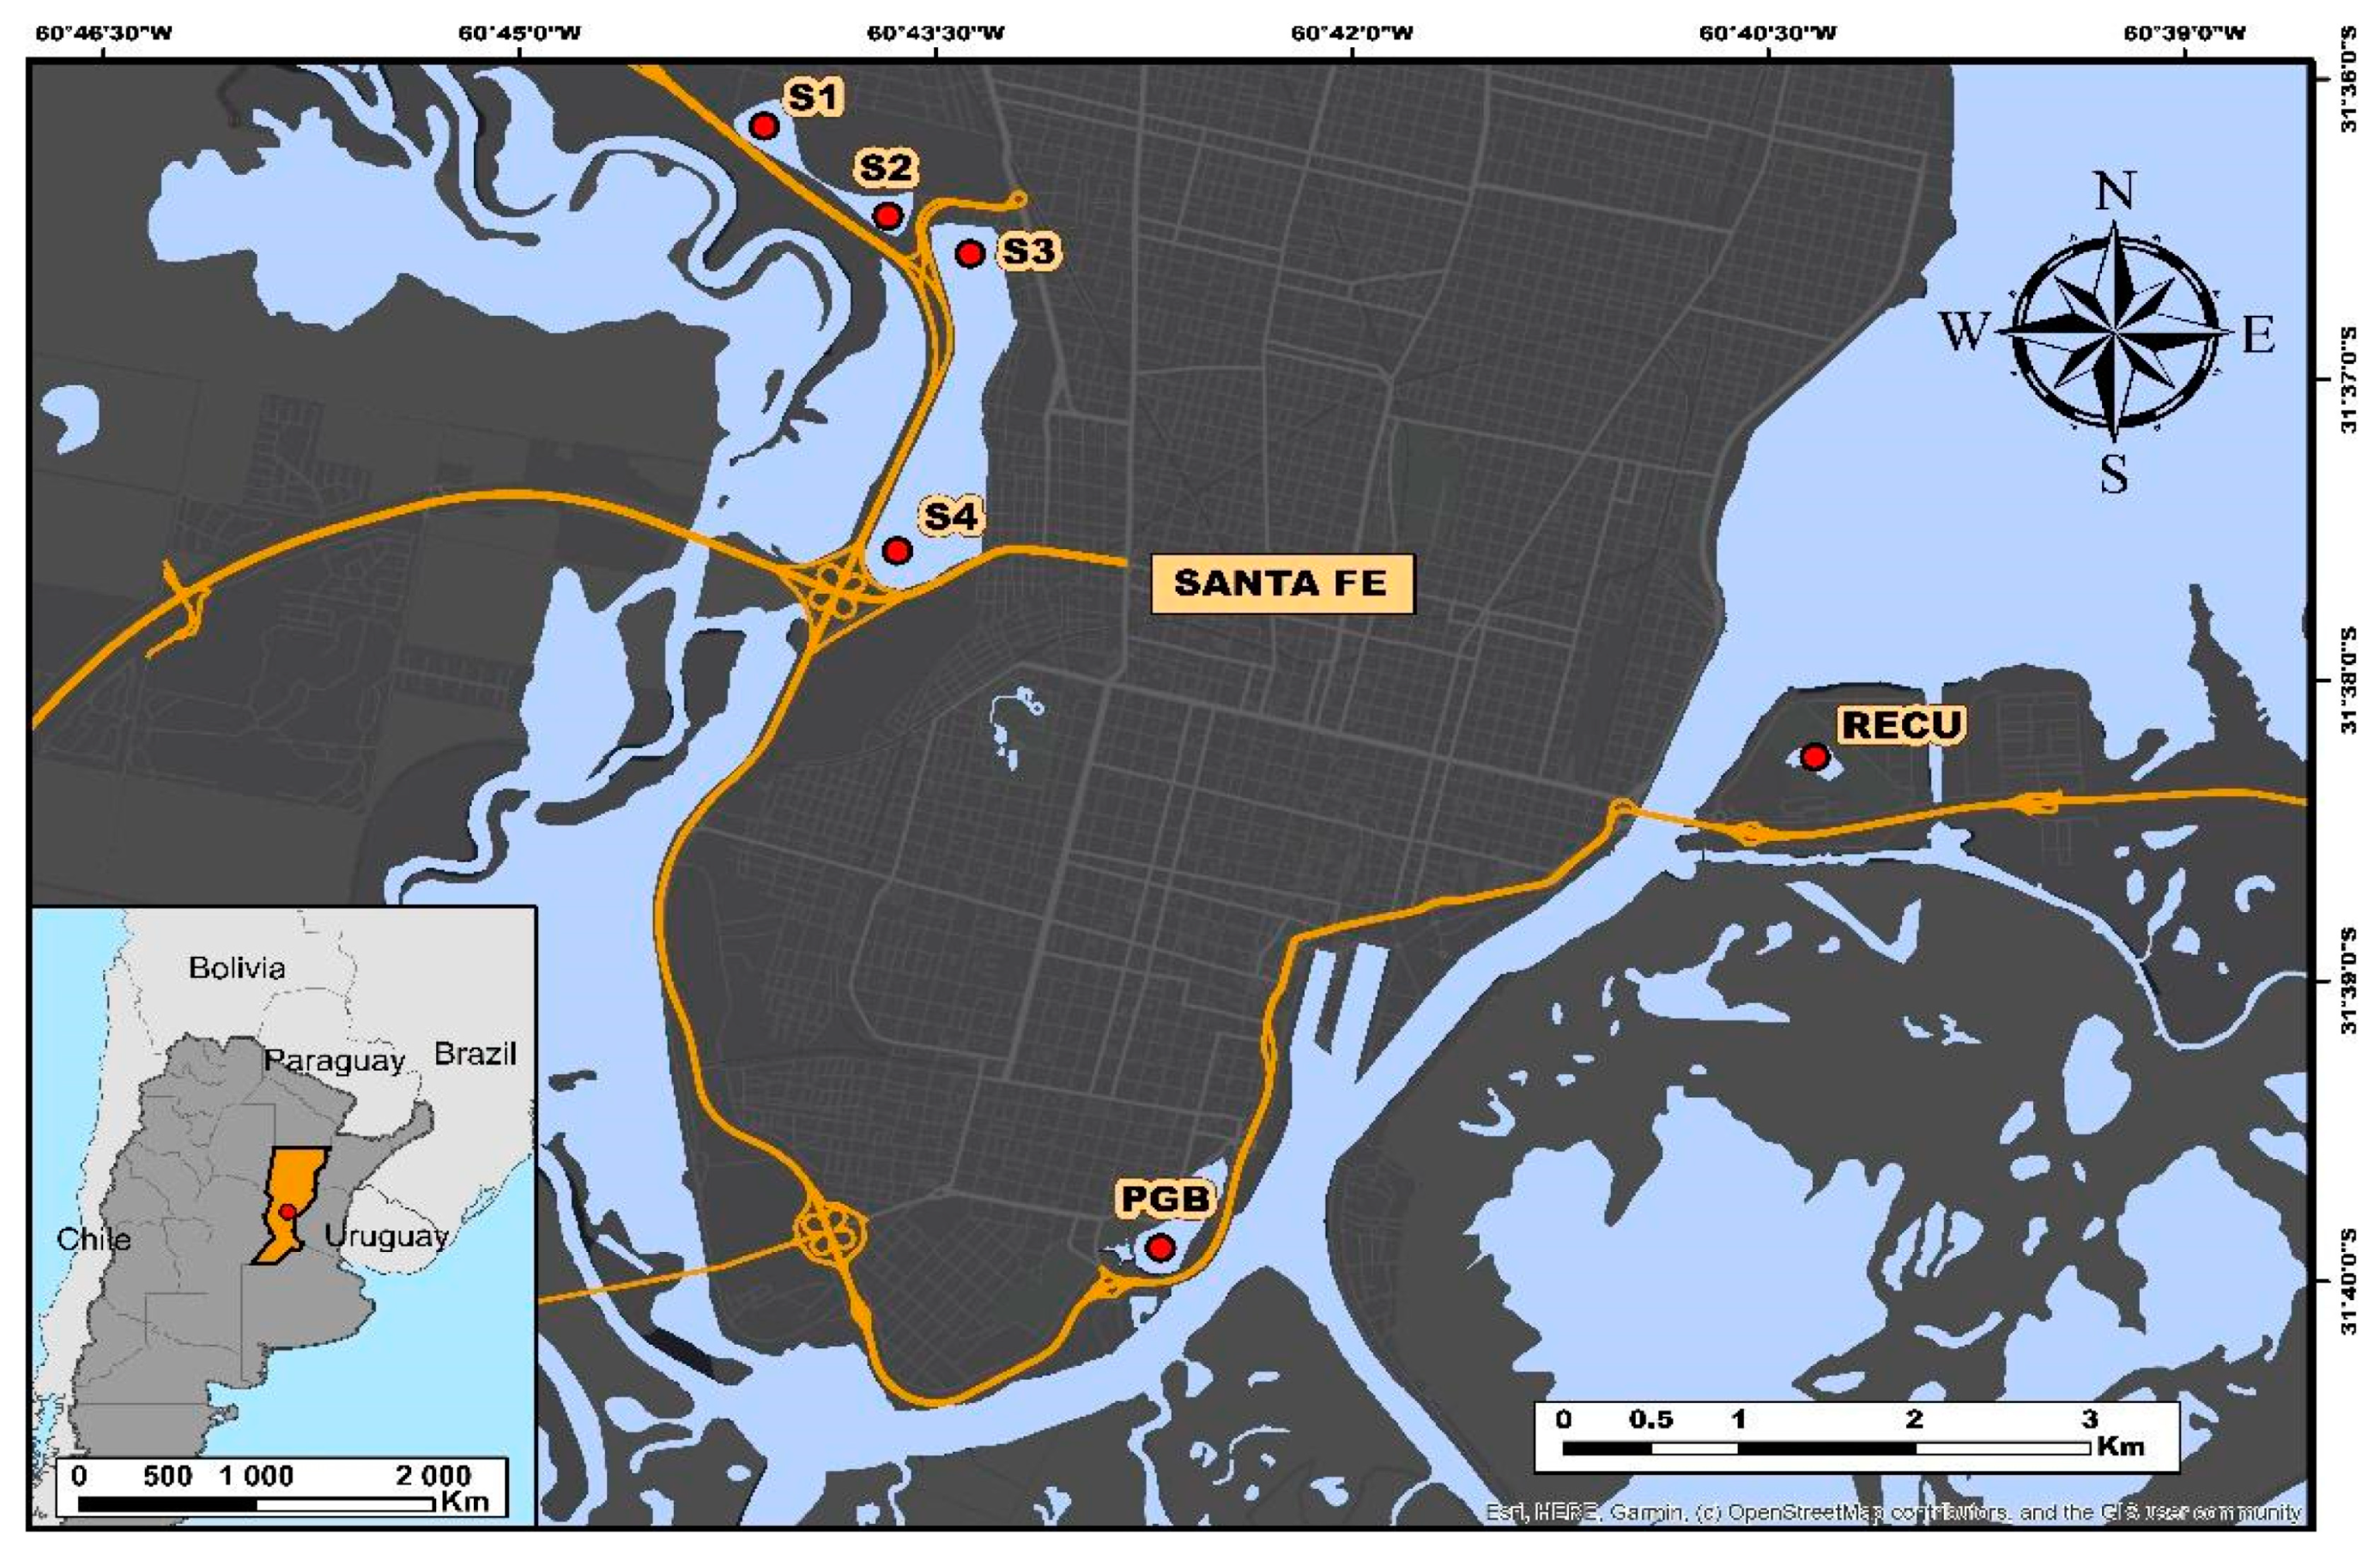
2.1. Study Area

The study area includes permanent aquatic systems, with greater depth during spring and summer periods (with higher rainfall and temperature records). Six urban ponds with different sizes and levels of anthropogenic disturbance were selected (Figure 1). (1) The “Reserva Natural Urbana Oeste” (RNUO), of approximately 142 ha, is an anthropized and ecologically dynamic landscape, lodged in between the city of Santa Fe (in the west of the city) and the Salado river floodplain (“Espinal” ecoregion). It belongs to the management category V of Protected landscape (International Union for Conservation of Nature-IUCN-). The area has two surface water reservoirs built to decrease the flooding risk and to contain the pluvial runoff from Santa Fe City. In these two reservoirs, four sampling sites were selected: RNUO S1, RNUO S2, RNUO S3, and RNUO S4, henceforth S1, S2, S3, and S4. (2) The “Parque General Belgrano” (PGB) is a smaller eutrophic urban wetland (47 ha) with eventual cyanobacteria blooms. It is located in the middle of a park in the south of the city and many recreational activities are carried out there since it is not a protected area like the other wetlands. (3) The “Reserva Ecológica Ciudad Universitaria” (RECU), 12 ha, close to the University Campus and the Setubal lagoon (“Delta e Islas del Paraná” ecoregion), is a permanent wetland surrounded by many temporary shallow ponds associated with the floodplain of the Paraná River. This protected area is on the outskirts of the city, and it is very important for educational and research activities.

2.2. Field Sampling

Benthos and zooplankton samples were taken seasonally during 2016–2017 from each sampling site of RNUO: S1 (31°36′9.03″ S, 60°44′8.91″ W); S2 (31°36′23.30″ S, 60°43′36.21″ W); S3 (31°36′41.89″ S, 60°43′26.68″ W); S4 (31°37′35.38″ S, 60°43′41.26″ W). In PGB (31°38′20.82″ S, 60°40′14.18″ W) and RECU (31°38′20.77″ S, 60°40′13.94″ W), sampling took place in summer and winter 2017–2018. Samples in all locations were taken at approximately 2 m from the shore. For the study of the benthic community, three samples (replicates) were taken at each sampling site using a mud-snapper grab Rigosha (Rigosha Co., Osaca, Japan, 100 cm2), filtered through a 200 µm sieve, and preserved in 5% formaldehyde. A total of 69 samples of benthos (23 triplicated samples) were taken. Samples were dyed in the laboratory and the invertebrates were hand-picked from the samples under a stereoscopic microscope (4x, Wincom Company Ltd., Shanghai, China,), and then preserved in 70% alcohol. All taxa in the analyzed samples were identified up to the lowest possible level with an optic microscope (Nikon, Tokyo, Japan).
For the qualitative analysis of the zooplankton community, one sample was taken with a plankton net (pore size 45 µm), and for the quantitative analysis, three samples (replicates) were taken at each sampling site using a Schindler-Patalas trap (20 L) with a 45 µm sieve. A total of 66 samples of zooplankton (22 triplicated samples) were taken. All samples were dyed in the field and preserved in 10% formaldehyde for later identification of all taxa under a stereoscopic and optical microscope using a 1 mL Sedgewick-Rafter chamber (Cole-Parmer TM, Vernon Hills, IL, USA), also up to the lowest possible level.

2.3. Environmental Variables

Dissolved oxygen (DO, mg L−1), pH, conductivity (Ω, µS cm−1), temperature (°C) (measured with Hanna multiparameter (Hanna instruments, Buenos Aires, Argentina) and YSI professional plus 6050000 model multiparameter probe (YSI, Yeros Springs, OH, USA)), transparency (cm, measured with a Secchi disc), and depth (cm, measured with a measuring tape) were recorded in situ at each sampling site (abbreviations of physicochemical parameters in Abbreviations). Additionally, sediment samples were taken for granulometry analysis, according to Wentworth’s scale (1932) [49], and the content of organic matter was analyzed by ignition at 500 °C for 3 h.

2.4. Data Analysis

Density (ind. m−2 for benthos and ind·L−1 for zooplankton), species richness (S), species diversity (H, Shannon-Wiener index), and evenness (J, Pielou’s index) were calculated at each sampling site and for each community. Bray-Curtis dissimilarity was applied to examine differences in the composition and density of invertebrate species among the different urban ponds. Significant differences in each environmental variable were explored through the Kruskal-Wallis test (p < 0.05). For both communities, possible significant differences between the sampling sites, total density, and species richness were also explored using the Kruskal-Wallis test (p < 0.05). To identify the taxa and environmental variables that explain the differences among urban wetlands, a canonical correspondence analysis (CCA) was applied to both communities together. In this analysis, the taxa present in more than one sampling site or representing at least 1.0% of the total density of each sampling site were included, and data on the abundance of species were log (x + 1) transformed to reduce the influence of the most abundant taxa. InfoStat (v2017.1.2) and PAST (v4.03) statistical programs were used for the analyses.
The Macroinvertebrate Index for Pampean Rivers (IMRP, Rodrigues Capítulo et al., 2001) [42] and the Benthic Community Index (BCI, Kuhlmann et al., 2012) [44] were applied to analyze the anthropogenic impacts on benthic invertebrates. The different taxa identified were assigned to the corresponding functional feeding groups (FFGs) according to Merrit et al. (2017) [50].
Some of the indices proposed by Gallardo et al. (2011) [51] were considered to analyze the zooplankton community: rotifer abundance/total zooplankton abundance [52]; microcrustacean abundance/total zooplankton abundance, and macrozooplankton (>100 µm) abundance/microzooplankton (<100 µm) abundance.
For the zooplankter FFGs, we adapted the classification proposed by Barnett et al. (2007) [53], and DeMott and Kerfoot (1982) [54]: (a) active raptorial feeders (capture and kill prey actively) such as Cyclopoid and Harpacticoid copepods; (b) passive raptorial feeders (capture prey from a steady position) such as Calanoid copepods; (c) filtering scrapers feeders (scraper buccal apparatus, filtering algae particles from the periphyton) such as Alona sp. and Chydorus sp.; (d) passive filter feeders (filter from a steady position) such as Daphnia sp., Ceriodaphnia sp., Moina sp., Brachionus sp., and (e) active filter feeders (active swimming and poor oral apparatus development), such as Bosmina sp. As far as we know, there are no published FFGs for rotifers, so we extended the previous classification to this group, considering their feeding habits: Asplanchna sp., Polyarthra sp., and Synchaeta sp. were classified as active predators due to their feeding mechanisms and behavior [55,56]. Keratella sp. and Brachionus sp. were considered passive filters because these species use ciliary currents to bring food particles into the mouth [56]. Other rotifers such as Euchlanis sp., Hexarthra sp., Platyas sp., Bdelloidea, Lecane sp., Filinia sp., and Lepadella sp. do not exhibit active grasping to capture single food items like raptorial species, but possess a malleate, malleoramate, or ramate trophi that collect multiple food items [57]. Therefore, we considered the mentioned taxa as passive filters. The abbreviations of the species belonging to the benthic macroinvertebrates and zooplankton communities are in the Abbreviations section.

3. Results

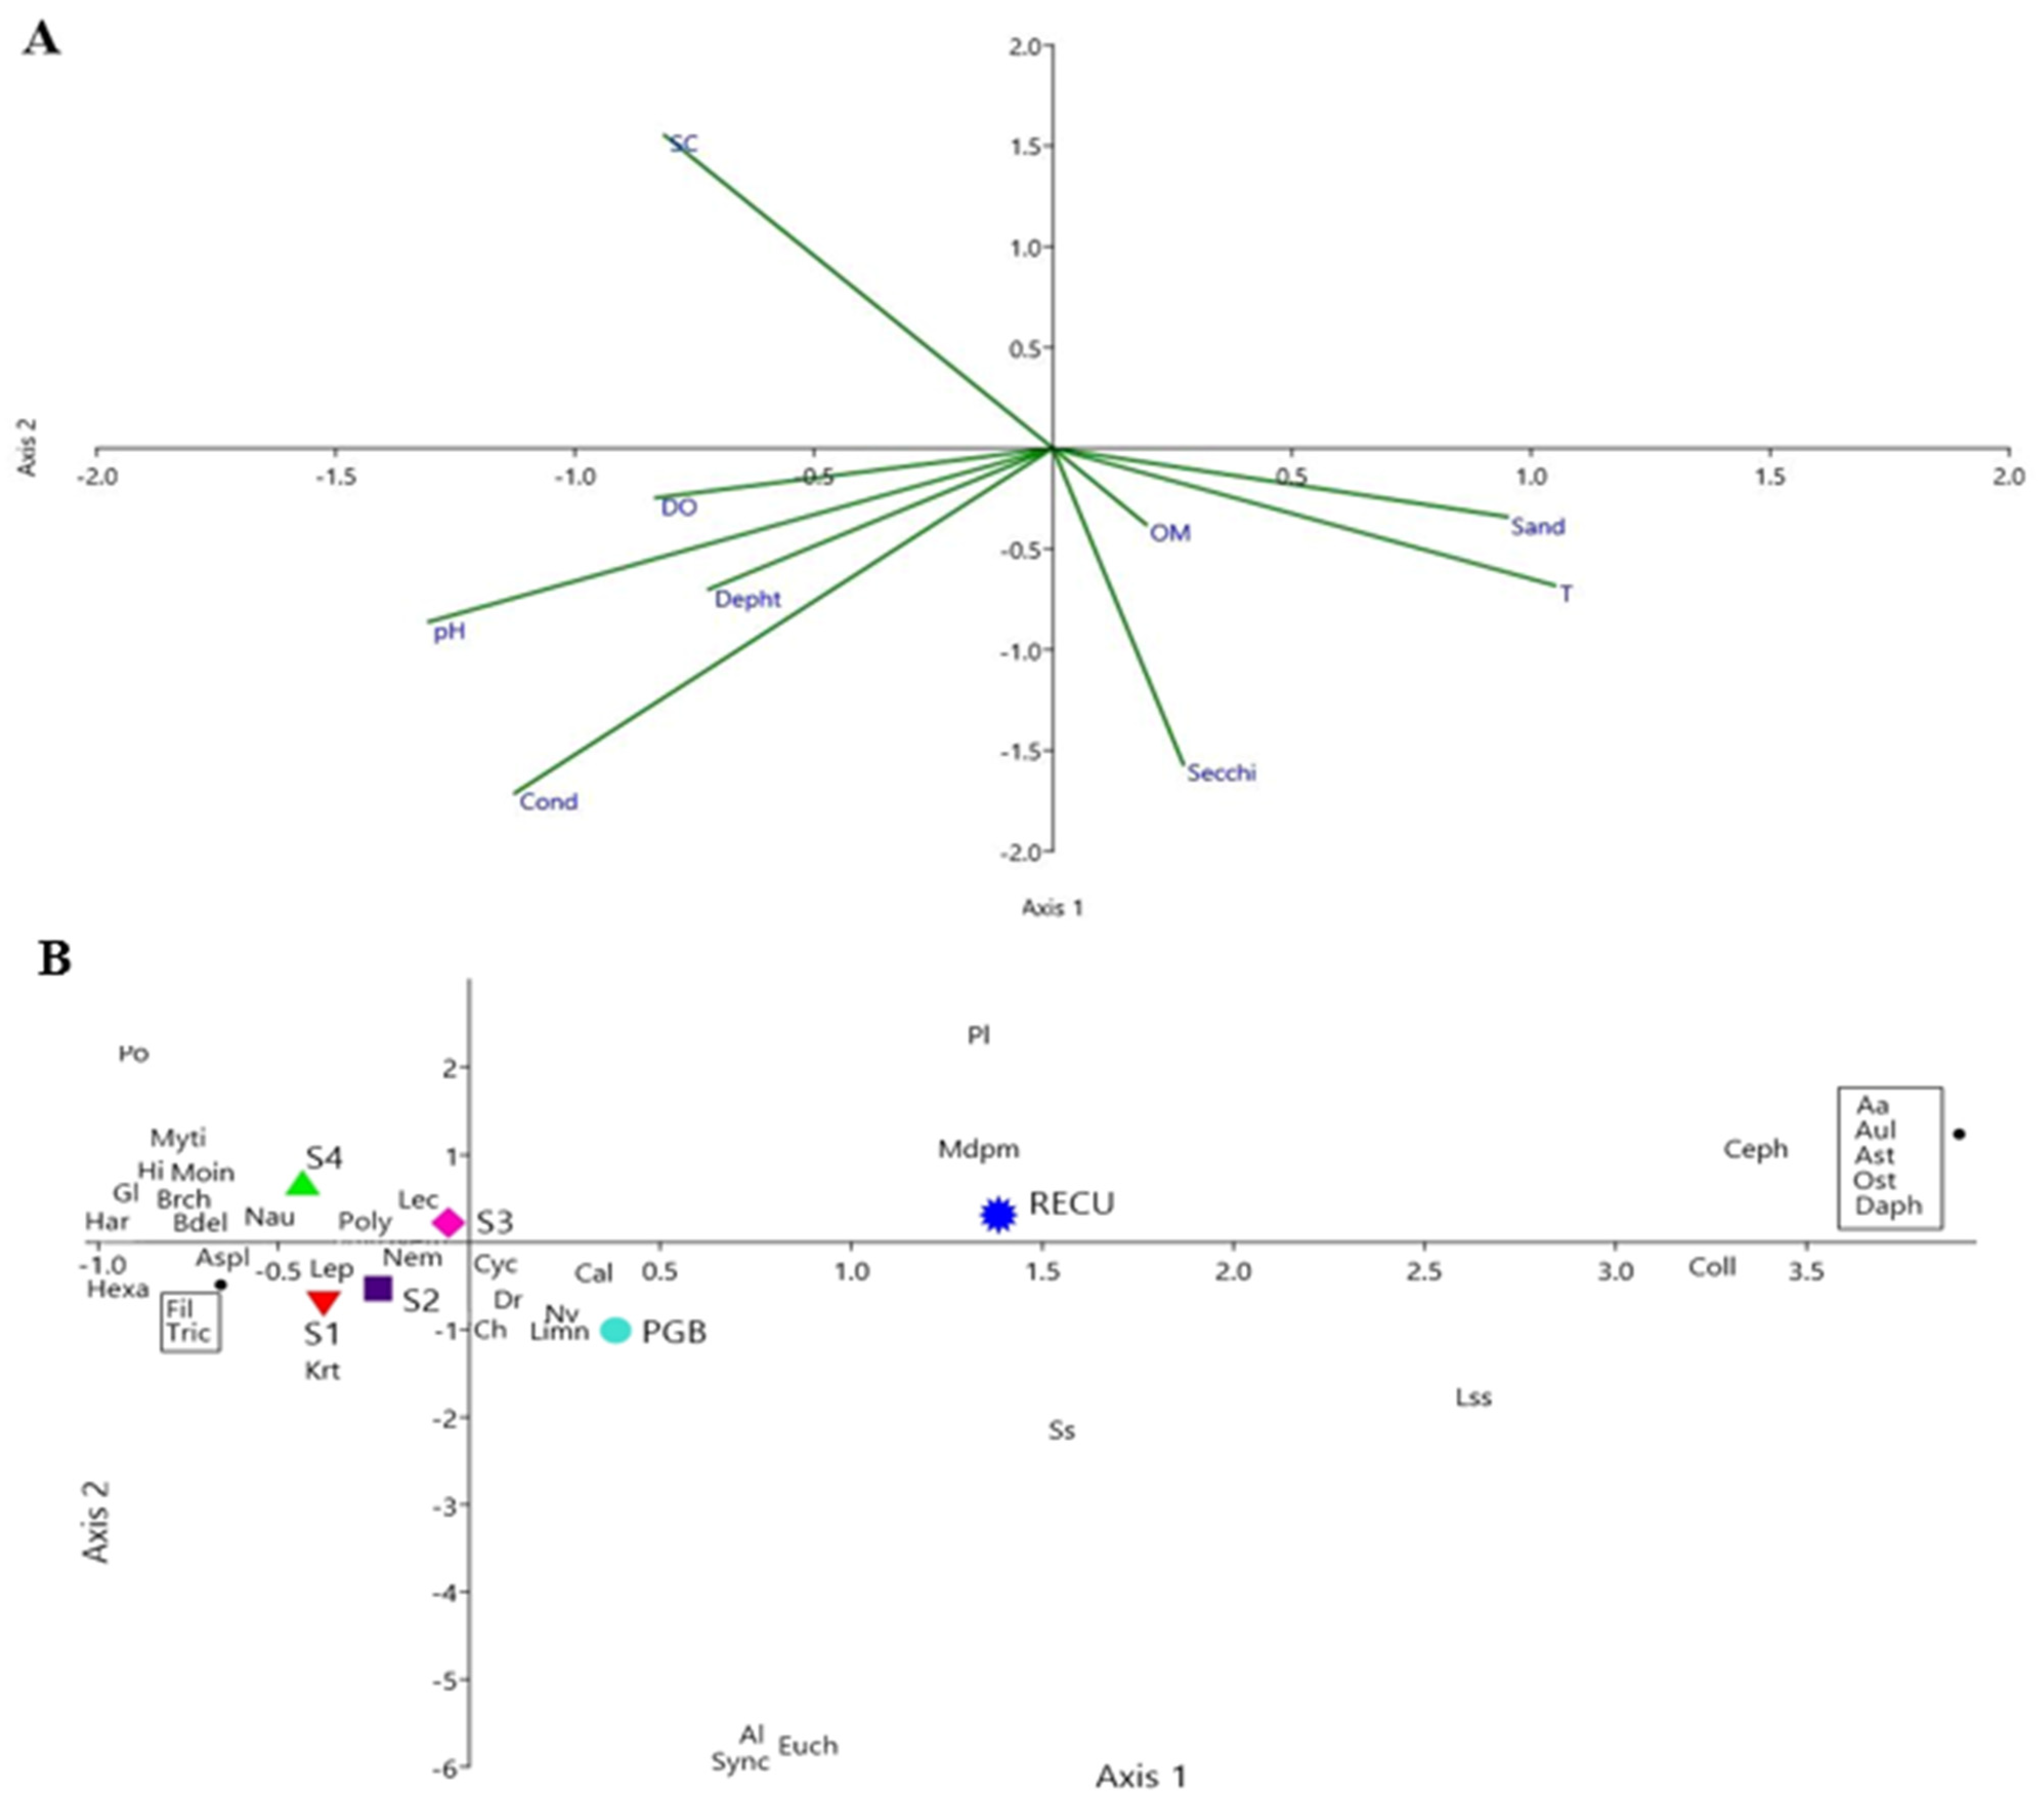
3.1. Environmental Variables

The environmental variables are shown in Table 1. Conductivity, pH, and dissolved oxygen showed significant differences (p < 0.05) between the urban wetlands (Kruskal-Wallis test). Conductivity varied between the lowest in RECU = 806 µS cm1 in summer and the highest in RECU = 3300 µS cm−1 in S2 in spring. Dissolved oxygen varied between 3.93 mg L−1 in S3 in spring and 14.7 mg L−1 in S4 in summer, and only showed significant differences between S1, S2, S3, and S4. As for pH, S1–S2 and S2–S3 were significantly different and varied between 6.93 in S4 in spring and 9.40 in S4 in summer. No significant differences were found for temperature, transparency, and depth.
The granulometry and proportion of organic matter content (coarse particulate organic matter (CPOM), fine particulate organic matter (FPOM), and ultrafine particulate organic matter (UFPOM)) are shown in Table 2. All sampling sites presented sandy bottom sediment (76–98%) except S1, which showed a higher silt-clay content (53%). The proportion of organic matter content (CPOM) was higher in PGB and RECU (64% and 42%, respectively), and FPOM was higher in RECU and S1–S4 (34–52%) than in PGB (17%).

3.2. Benthic Macroinvertebrates and Zooplankton Communities

The density of the benthic macroinvertebrate community varied between 115 ind. m−2 (PGB) and 18397 ind. m−2 (S4). Species richness and diversity were higher in RECU (9–17 taxa and H = 1.48–1.84) and lower in PGB (4–7 taxa, H = 0.61–1.08) (Table 3). Less dissimilarity (Bray-Curtis) was reached between PGB and S1 (0.50). Both S4 and RECU showed the highest dissimilarity from the rest of the sampling sites (0.03–0.13).
The Kruskal-Wallis test (p < 0.05) showed significant differences in the species richness of the benthic community between PGB and RECU, S2 and S3, and also between RECU and S1 (p = 0.035). However, no significant differences were found in the total density between sampling sites (p = 0.094).
For the zooplankton community, density was low in PGB (12.29 ind·L−1) and RECU (23.85 ind·L−1), but more variable in S1 (37.84–2231 ind·L−1) and S3 (9.43–1028.8 ind·L−1). Species richness was higher in RECU (21–27 taxa) and lower in S3 (7–16 taxa). Shannon’s Diversity was higher in RECU (1.72–2.29) and S3 (1.61–2.12). Higher dissimilarity (Bray-Curtis) was registered between RECU and PGB at all sampling sites (0.01–0.17 for both of them), and the lowest dissimilarity was among S1–S4 (0.49–0.62).
The Kruskal-Wallis test (p < 0.05) showed significant differences in the density of zooplanktonic organisms in PGB and RECU between S2 and S4 (p = 0.039). No significant differences were recorded in the species richness between all sampling sites (p = 0.091). According to the canonical correspondence analysis (CCA), 79.91% of the total variation was explained by the first two axes (Figure 2a,b). Axis 1 explained 49.76% of the total variation (eigenvalue: 0.229), with pH (negative) and sand content being the parameters that provided more information. Axis 2 explained 30.15% of the total variation (eigenvalue: 0.139), and transparency (negative) and conductivity (negative) were the variables that provided more information about the differences between wetlands. PGB differed from the other sampling sites mainly due to the presence of the benthic taxa Limnodrilus sp., Chironomus sp. Nais variabilis and Dero sp.
The most representative benthic and zooplanktonic taxa in S1–S3 were Nematoda, Lepadella sp., Polyarthra sp., Calanoida, and Cyclopoida copepods, nauplii, and Brachionus sp. In S4, the taxa registered were Goeldichironomus sp., Hirudinea, Hyalella curvispina, Pomacea canaliculata, Lecane sp., and Moina sp. Zooplankton taxa were more relevant than benthos taxa for the ordination of RECU; for example, Moinodaphnia macleayi and Ostracoda were abundant, mainly in summer. Specimens of the native cladoceran Daphnia middendorfiana were found sporadically. In PGB, the rotifers F. longiseta, Asplanchna sp., Polyarthra sp., and K. quadrata were the most abundant taxa, and small cladocerans were also found in higher densities. Brachionus caudatus dominated in S2 and S3, and Brachionus calyciflorus in S1 and S4 (see Table A1 and Table A2, Appendix A).

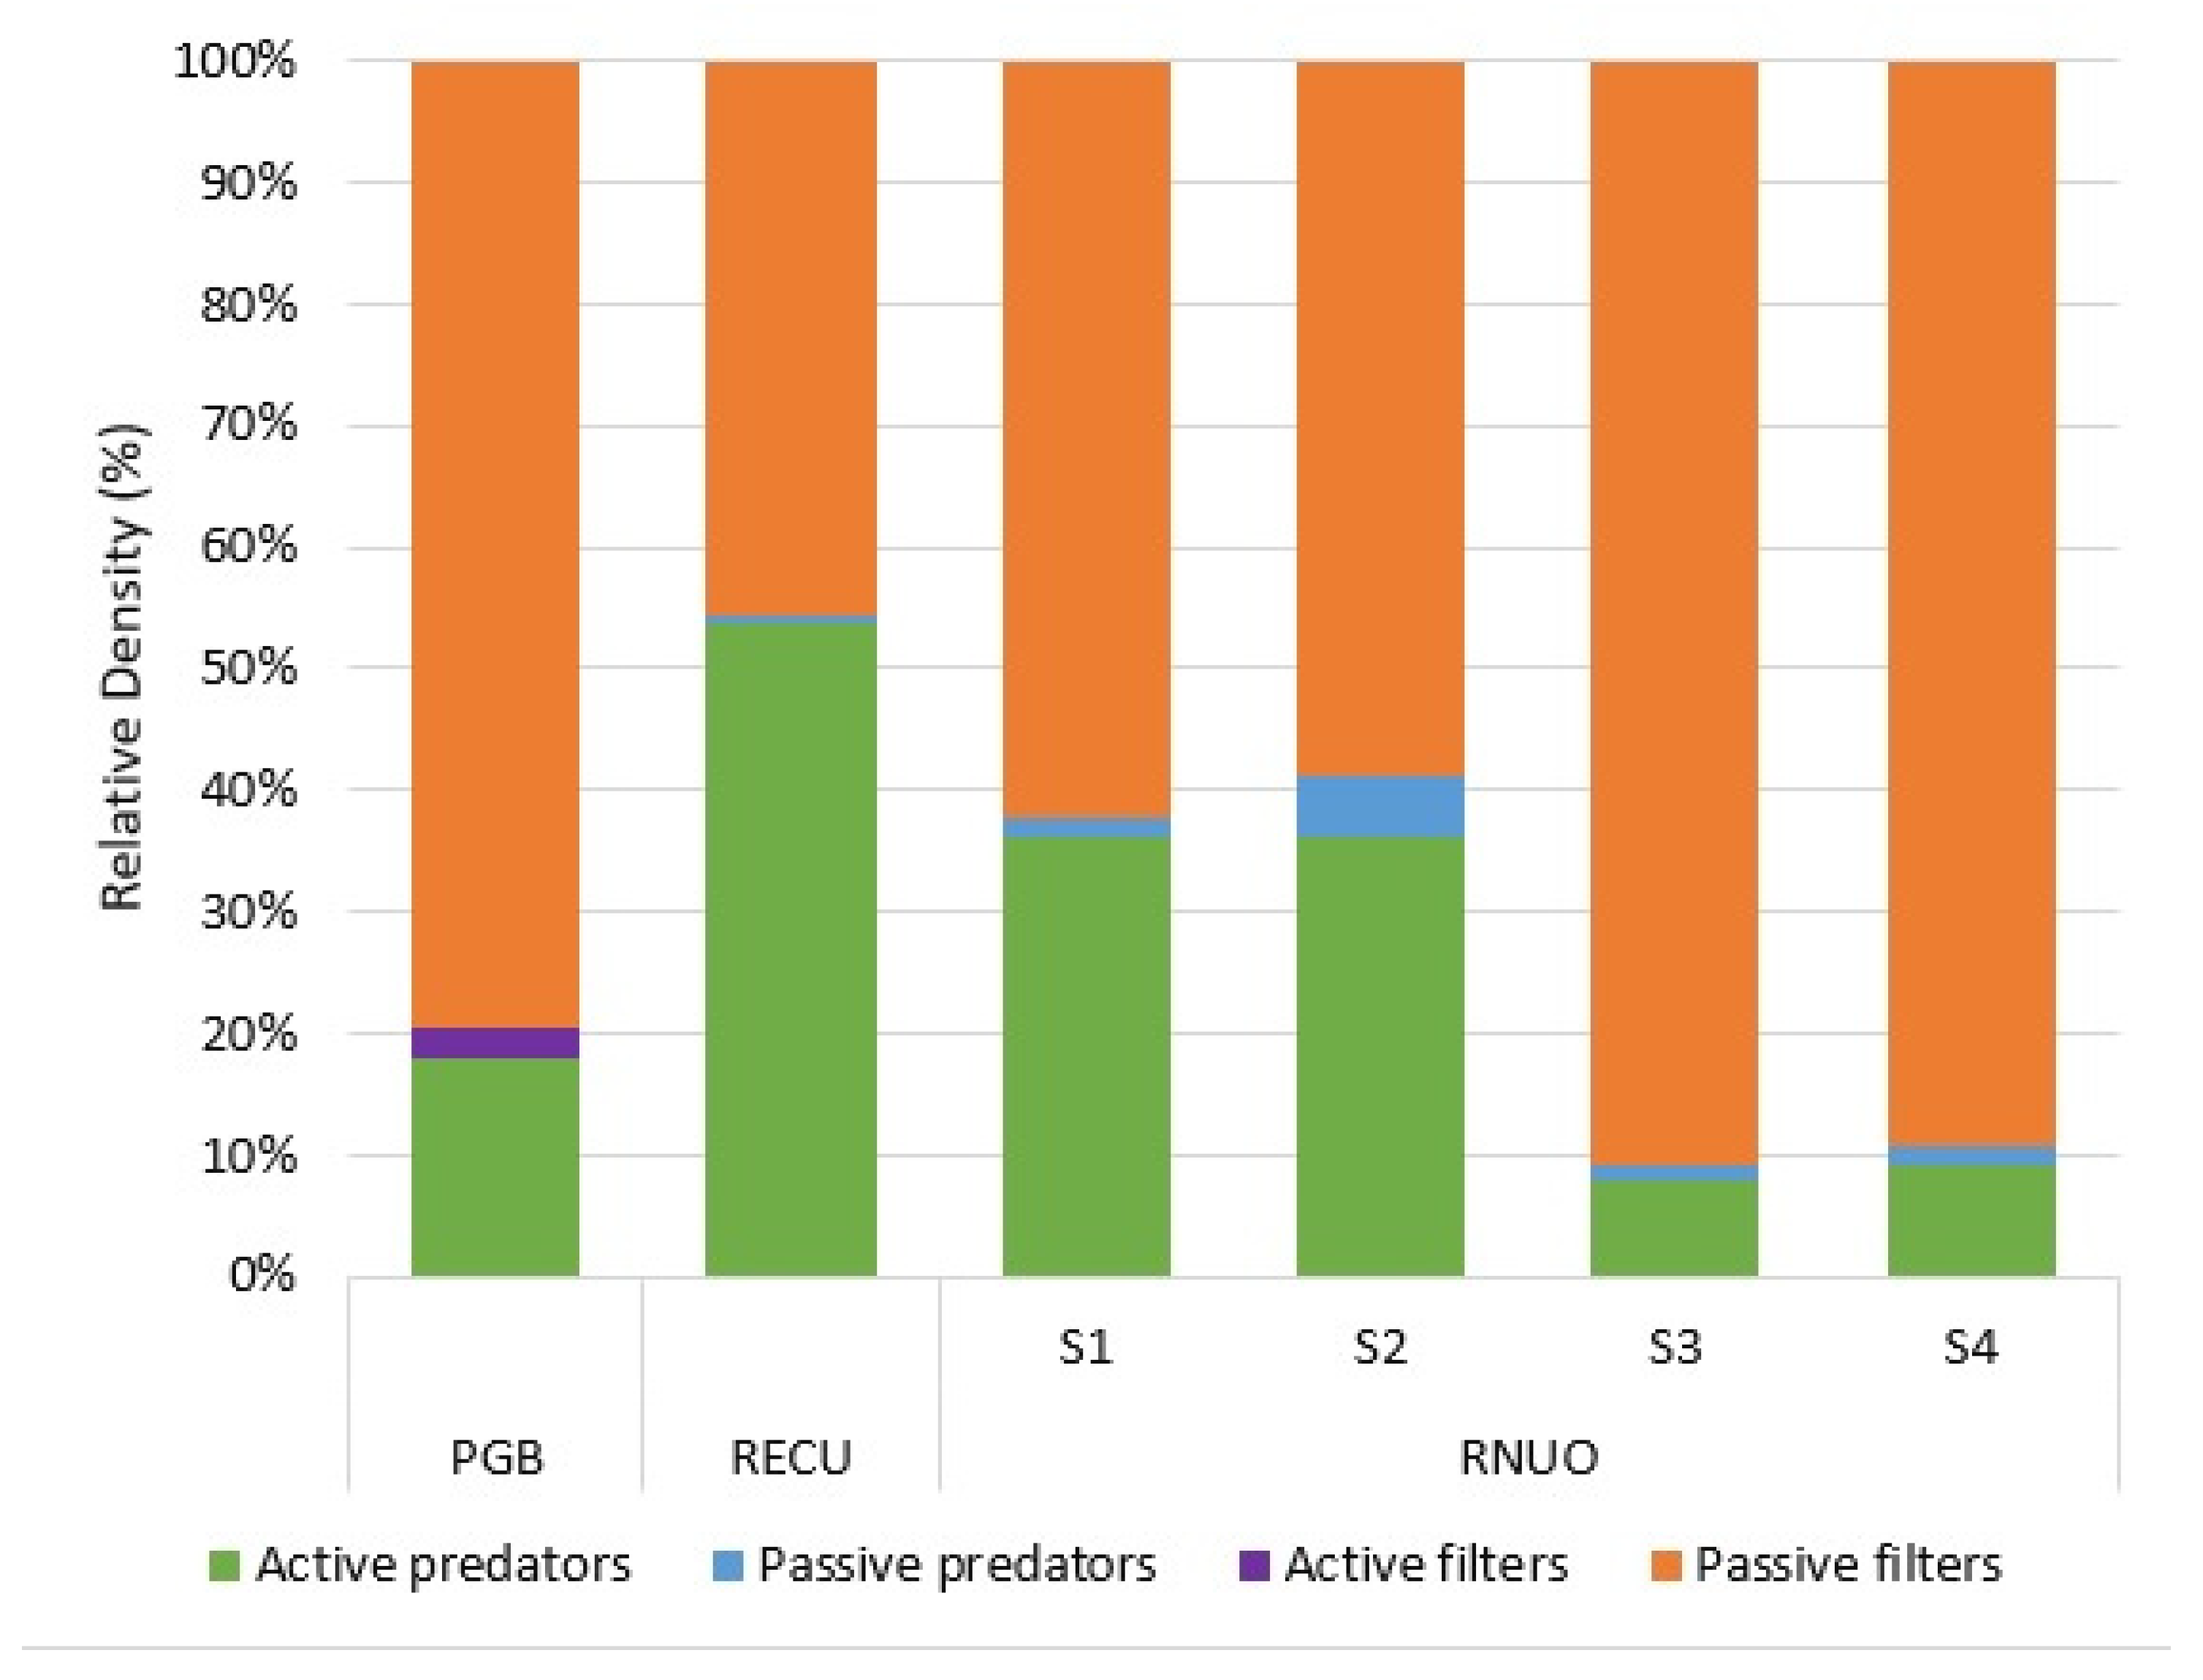
3.3. Functional Feeding Groups
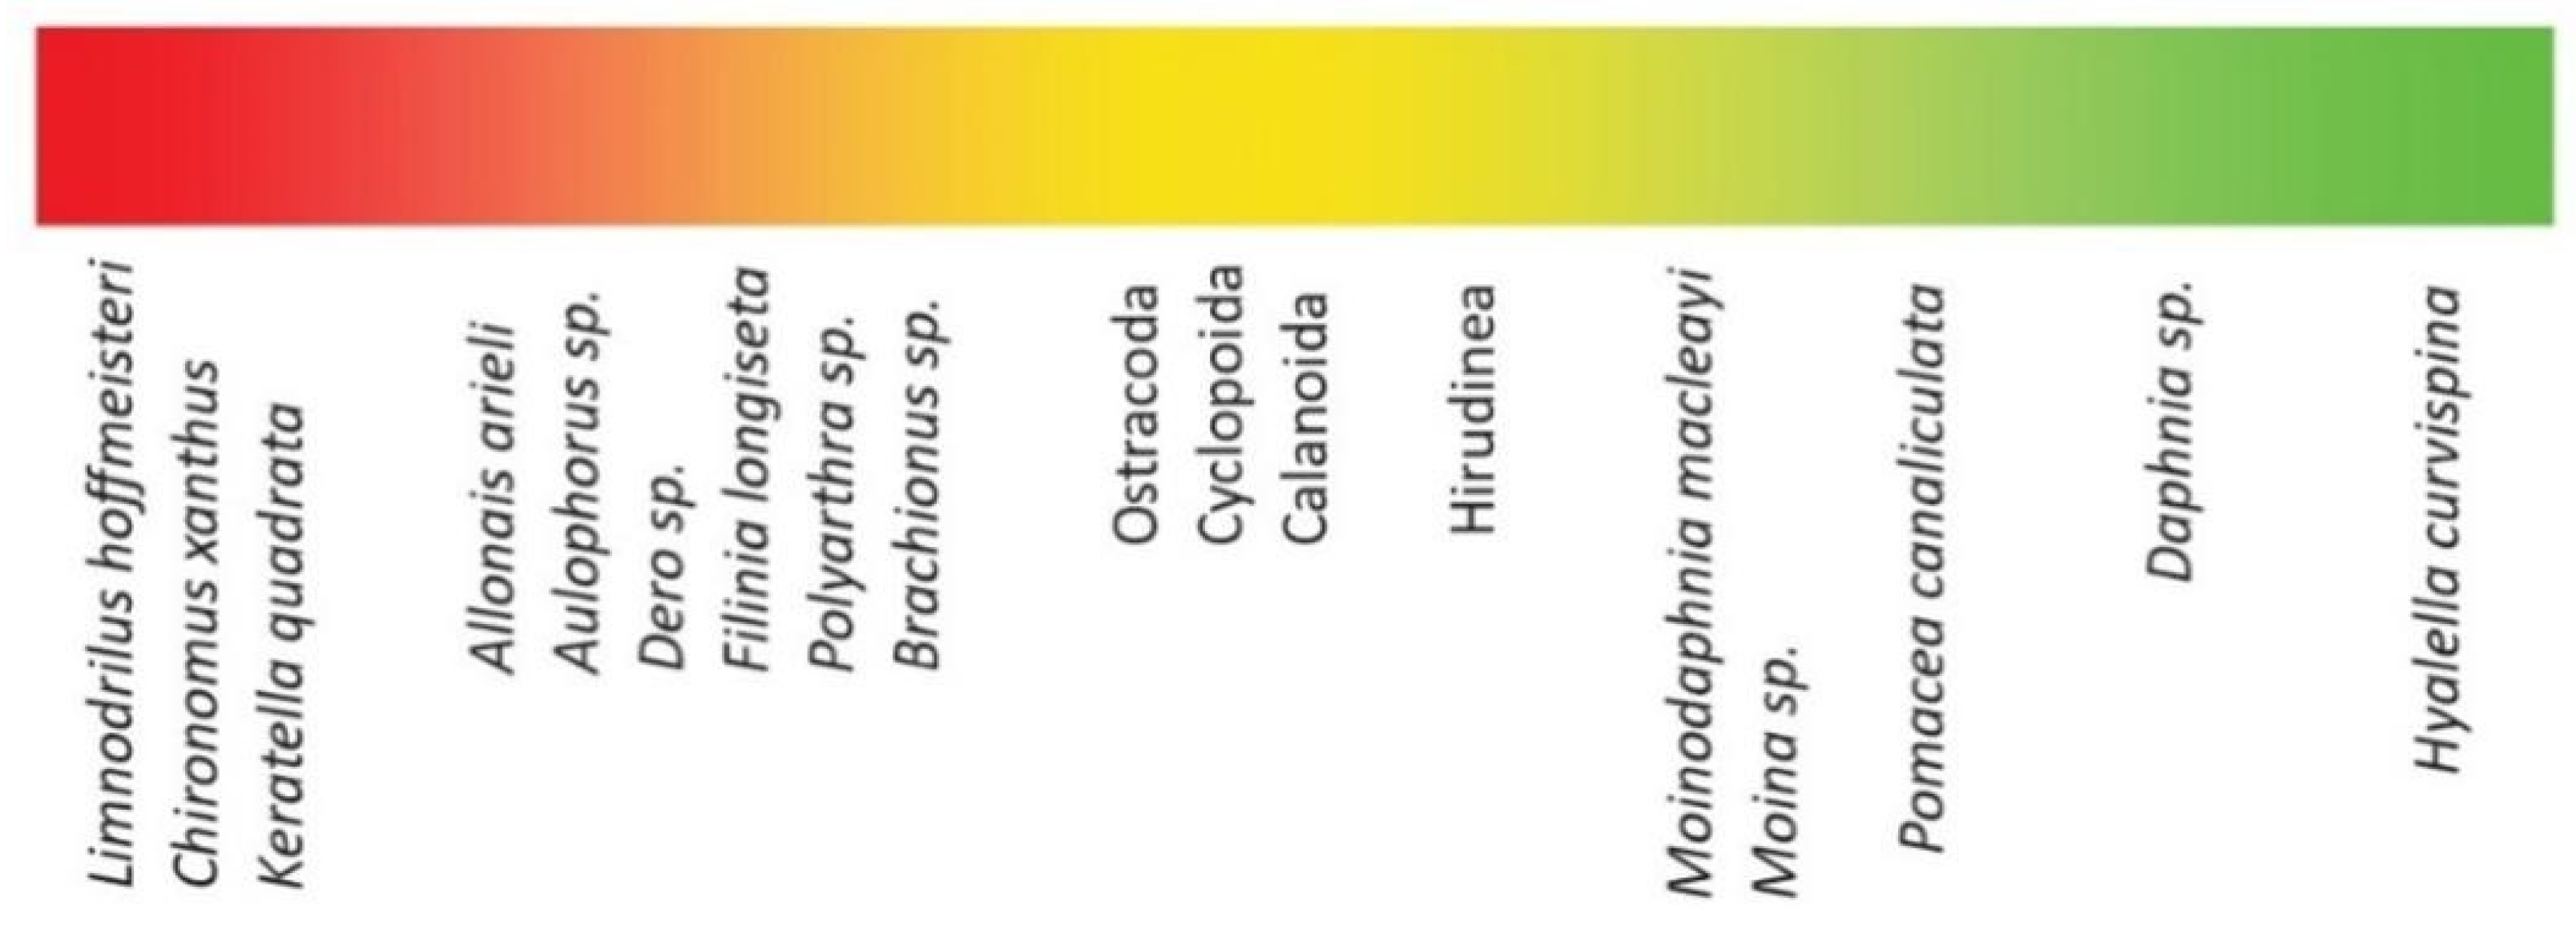
For the benthic community, all FFGs were registered at least in one of the urban ponds (Figure 3). In S4, the five FFGs were present, with the highest density of predators (65%) and the lowest density of gathering collectors (2.6%), a group that was dominant in the rest of the sampling sites (44–98%). Filtering collectors, gathering collectors, and predators were found in S1–S3. However, the percentage of predators in S1 was much lower (only 0.34%) than in the other urban ponds. Gathering collectors were less abundant in RECU, but even more in S4, where this group only reached 1.98%. Scrapers were found only in S3 and S4, and in RECU, though in very low proportions. Filtering collectors were present in all sampling sites, reaching a higher relative density (near 50%) in RECU.
Regarding the zooplankton community, only three FFGs were recorded (Figure 4): active raptorial, passive raptorial, and passive filter feeders (at each sampling site, except at PGB, where active filter feeders instead of passive raptorial were recorded). The fifth group, shredder filter feeders, was not found in any of the sites. Passive filter feeders showed clear dominance in S3, S4, and PGB (90%, 89%, and 79% respectively). Although abundant in RECU (45%), active raptorial were dominant (53%), while passive raptorial showed very low abundance in all the ponds where they were recorded (between 2% and 5%).

3.4. Biotic Indices

The multimetric BCI was unable to discriminate between the sampling sites since all of them reached the regular water quality category, with slightly different scores according to this index (Table 4). Conversely, the IMRP was able to classify the sites as heavily polluted (S1 and PGB), moderately polluted (S2, S3, and RECU), and slightly polluted (S4).
For the zooplankton community (Table 5), a high abundance of rotifers and microzooplankton was considered as an indicator of high disturbance (red), showing the worst condition in PGB, S3, and S4. On the contrary, a high abundance of microcrustaceans, cladocerans, and macrozooplankton, as indicators of low disturbance (green), was determined in RECU and sometimes in S2. We assigned yellow to the intermediate values.

4. Discussion

Urbanization is a major driver of environmental change, and is closely linked to the future of biodiversity. Urban biodiversity provides multiple cultural and ecosystem services [6]. The connection between both has to be prioritized by scientists and funding agencies [16]. To contribute to this goal, we will discuss, point by point, the relationships between physicochemical conditions and the aquatic benthic and zooplankton biodiversity of the studied urban ponds.

4.1. Environmental Variables

Variations in pH between the urban wetlands were significantly different, and these values are typical of the freshwater environments of the Santa Fe province [58,59,60]. The depth was generally low (<100 cm), considering that it was taken from the nearshore edge of the sampling sites. The environmental variables registered in PGB were similar to those communicated by Caino et al. (2017) [61]. Conductivity was generally higher in PGB (2303–2500 µS cm−1) and lower in RECU (810–854 µS cm−1). This could explain the high abundance of rotifers in PGB, since some previous studies have suggested a correlation between environmental variables such as high conductivity and DO (among others) and the presence of rotifers [62,63]. The proportion of organic matter content (CPOM) was higher in PGB and RECU (64% and 42%, respectively) and FPOM in RNUO (45–51%), which could be relevant for some of the dominant benthic species such as Limnodrilus hoffmeisteri and Chironomus sp., given their feeding habits as gathering collectors [64].

4.2. Benthic Macroinvertebrates and Zooplankton Communities

The density of the macroinvertebrate community in S4 was sixtyfold higher than in the most polluted site (PGB). Species richness and diversity were higher in RECU and lower in PGB, while the most similar environments were PGB and S1, the most disturbed sites according to the biotic index. By contrast, S4 and RECU were the least polluted sites and showed very high dissimilarity from the rest of the sampling sites.
For the zooplankton community, density was very low in PGB and low in RECU. In RECU, the species richness was the highest, showing better environmental conditions. In RECU and S3, the diversity was higher than in other sampling sites. As for the benthic community, higher dissimilarity (Bray-Curtis) was recorded between RECU and PGB at all sampling sites. This result can be interpreted as a gradient of environmental conditions, with PGB being the most and RECU the least polluted. On the other hand, the lowest dissimilarity values were recorded among S1–S4, showing that in general, S1–S4 did not differ substantially, and they were moderately disturbed (marked in yellow), while in two other cases they were marked as low disturbed (green) or highly disturbed (red) (Table 4).
The most representative benthic species considered tolerant to disturbances were Limnodrilus hoffmeisteri, and L. claparedeianus in PGB, S1, S2, and S3. Oligochaetes (mainly Tubificinae) are known to have a high tolerance to natural and urban disturbances, even higher than chironomids [65,66]. Chironomus xanthus was abundant in RECU. Conversely, amphipods were abundant in S4 with a very high density of the amphipod H. curvispina, which was not registered in the other wetlands. This finding is relevant because this species is considered sensitive to many contaminants [67,68]. Additionally, it has been suggested that communities living in a disturbed environment are often dominated by species with short life cycles and high reproduction rates, such as some Naidinae (Oligochaeta) species [40]. The high densities of these taxa recorded in PGB, S1, S2, and S3 strongly suggest that these ponds are under anthropogenic pressure.
PGB differed from the other sampling sites mainly due to the presence of the benthic taxa Chironomus sp., N. variabilis, and Dero sp. These species are often colonizers of disturbed habitats [40], so their relevance in PGB could indicate that this wetland has a greater degree of disturbance than the other ones, as was shown by the canonical correspondence analysis.
Regarding the zooplankton community, PGB showed the highest density of rotifers and the lowest density of microcrustaceans and cladocerans. This could be indicative of disturbance, since the dominance of microzooplankton (rotifers and copepod nauplii) over larger individuals (cladocerans and adult copepods) has been considered as indicative of anthropic pollution. The selective elimination of larger size herbivore crustaceans affects other trophic levels, i.e., phytoplankton and fish populations. Thus, changes in the trophic web are generated by the effects of the decrease in the available resources for larger zooplankters and larvae, and juveniles of planktivorous fishes [69]. Similar results were reported by Hanazato (1998) [70], who found that lakes with a dominance of large-sized zooplankters had shorter food chains, and therefore a more effective transfer of energy from primary producers (algae) to top predators (fish) than those dominated by small-sized zooplankters. The relevance of larger cladocerans for the transfer of energy through the water column was also shown by Sterner (2009) [71]. Several studies have highlighted the relationship between pollution and the dominance of rotifers [72,73]. In our study, F. longiseta, Asplanchna sp., and K. quadrata dominated in PGB.
Conversely, the highest proportion of cladocerans and macrozooplankton was reached in RECU and S2, indicative of better ecological conditions. In many studies, the dominance of these groups has been linked to sites with very low disturbances, and was considered an indicator of good water quality [19,52,74,75]. Among cladocerans, individuals of Daphnia sp. were found in RECU; this genus is used worldwide for toxicity assays, given its sensitivity to disturbances or contaminants [76]. Although sporadic, the presence of specimens of a native cladoceran (Daphnia middendorfiana) in RECU is highly relevant, since, as it was explained, it is a sensitive species that separated this site from the other ponds in the ordination analysis, possibly indicating that this site has a lower level of disturbance.

4.3. Functional Feeding Groups

A highly relevant tool to assess ecological integrity on wetlands is functional diversity, due to its relationship with the maintenance of important ecosystem processes [77,78]. Functional trait analyses have been effective for environmental monitoring [79,80]. Since this approach does not depend on the taxonomic identity of organisms, it is widely used to monitor large geographic areas [50,62].
For benthic FFGs, a gradient from lower (PGB) to higher (S4) functional diversity was found: a higher abundance of shredders or scrapers in slightly disturbed ponds, and more abundance of gathering collectors, such as L. hoffmeisteri, in more disturbed ones. Another study showed a shift of feeding habits from non-impacted to impacted urban rivers [81].
For the zooplankton community, the registered FFGs were active raptorial, passive raptorial, and passive filter feeders. Shredder filter feeders were absent in all the studied ponds. The dominance of passive filter feeders (mainly rotifers) in the most polluted site (PGB) could be associated with the availability of phytoplankton. In this sense, the total abundance of microalgae was 16,583 ind. ml−1 in autumn and 42,851 ind. ml−1 in spring, dominated by Cyanophycea and Chlorophycea (38 and 42%, respectively), and was classified as eutrophic by Caino et al. (2017) [61], with a beta-mesosaprobic trophic state and moderate organic contamination. The biotic index also showed environmental impairment in PGB. Conversely, active raptorial dominated in RECU, where better environmental conditions prevailed, as was also shown by the values of the biotic indices (Table 5).

4.4. Biotic Indices

Biotic indices based only on taxonomic traits have not always been effective in detecting disturbed environments [82,83]. This could be due to the absence of certain indicator taxa. On the contrary, multimetric indices are more flexible, so they can be adjusted by adding or removing metrics or even fine-tuning the metric scoring system [84].
Considering the benthic community, the taxonomic biotic index IMRP was much more effective than BCI in establishing a gradient from the most to the least disturbed urban ponds. The gradient was consistent with the results shown in the statistical analysis (Shannon-Wiener index, Bray-Curtis dissimilarity, and Kruskal-Wallis tests) applied to the benthic communities. This ordination was also supported by the FFGs, given its increase in the same order as the IMRP scores: PGB with only two FFGs represented (gathering and filtering collectors); S1–S2–S3 with three (predators, filtering, and gathering collectors); RECU with four (predators, filtering, gathering collectors and shredders) and S4 with all five groups. Gathering collectors´ densities showed the same ordering. Therefore, the IMRP allowed us to classify the sites as heavily polluted (S1 and PGB), moderately polluted (S2, S3, and RECU), and slightly polluted (S4) (Table 4).
The fact that BCI was unsuitable to establish differences among the selected wetlands could be explained by the absence of sensitive indicator taxa (Odonata, Trichoptera, Ephemeroptera, and some Chironomidae-Tanytarsini) in all sampling sites. These findings reveal the importance of applying indices that take into consideration the biodiversity of the systems where they are examined.
Even though slightly polluted, S4 was the only site with an IMRP score higher than the other ones (4.14). This could be explained by the presence of less tolerant taxa, such as mollusks [85], and highly sensitive taxa such as H. curvispina [68], which showed higher scores in this index. In addition, highly tolerant taxa such as oligochaetes and chironomids were scarce, and species of the subfamily Tubificinae, such as L. hoffmeisteri, were absent only in this site. This species, in particular, is commonly used as an organic pollution bioindicator, and is tolerant of extreme environmental conditions [66].
The biotic indices applied to zooplankton showed that RECU and S2 presented higher species richness and density than PGB, being indicative of a lower degree of disturbance than PGB. The gradient from more to less polluted environments established for the zooplankton community was: PGB < S3 = S4 < S1 < S2 < RECU. PGB and S2 showed the lowest density. The highest species richness was registered in RECU, and S2 and S4 showed very high Bray-Curtis dissimilarity from PGB. As for the FFGs, RECU was the only urban pond where passive filters were not dominant. Other authors studied the water quality of four reservoirs in Portugal, and showed that the zooplankton community responded to alterations in trophic status and the water quality, both by taxonomic and functional approaches [31].
As commented by Lopes Costa et al. (2020) [28], gradient assessments were performed only in 16% of the studies reviewed, and none of them included disturbance threshold determinations. As is shown in Table 5, the biotic indicators applied for the zooplankton community let us define three situations: the worst ecological status (PGB, in red), the best ecological status (RECU, in green), and intermediate ecological status (S1–S2–S3–S4 in RNUO, mainly in yellow). Therefore, we believe our findings on ecological indicators contribute to deepening the knowledge on this aspect, yet further research on this topic is required. The classification of zooplankter’s FFGs, adapted from literature [53,54] to include rotifers considering their feeding habits, proved to be suitable to complete and help our understanding of zooplankter’s FFGs.
Finally, we strongly believe that assessing water quality in both communities, and other highly relevant ones—e.g., phytoplankton—could help with regulatory policies. In this scenario, the ecological potential of some zooplankton species was considered a good indicator in Spanish reservoirs, and it was proposed that zooplankton should be included as a valuable tool of Biological Quality Elements (BQE) for the European Water Framework Directive (WFD) [86].
Studies simultaneously comparing the responses to environmental stress of zoobenthos and zooplankton communities are very scarce [87,88,89]. In this context, great changes in benthic and zooplankton communities were reported by Azevedo et al. (2015) [41], and by Scharler et al. (2020) [90], who studied both communities in subtropical reservoirs and in an estuary, respectively. Both works showed that the selected indicators (species richness, the Shannon-Wiener diversity index, and biomass) responded differently when applied to one community or another.
In summary, and considering both communities, a gradient from more tolerant to more sensitive taxa was established in this study (Figure 5).
The gradient was developed considering the data obtained for zoobenthic and zooplankton taxa, and completed with data from the available bibliography [91,92,93,94]. We strongly suggest that a comprehensive impact assessment must rely on the simultaneous use of several indicator communities, species, and metrics, in agreement with Lopes Costa et al. (2020) [28], who consider that some variables or taxa may not be as sensitive as others to specific disturbances. In tropical reservoirs, the same indicators useful for the zooplankton and benthic communities separately might provide no direct responses in ecological quality assessment [41]. This suggests that zooplankton together with benthic macroinvertebrates should be taken into account while considering the ecological quality management, assessments, and restoration of water bodies. This approach will finally contribute to the sustainability of biodiversity in urban wetlands.
In line with Kowarick et al. (2020) [6], we argue that cities also offer promising opportunities for conserving biodiversity, if it is properly conserved and protected. Like a Möbius strip, biodiversity in friendly cities is a continuum, and inextricably linked to sustainable urban development and human wellbeing.
This work showed, through urban ecological research, the anthropogenic pressures on representative urban aquatic biodiversity. Nevertheless, much more research and conservation policy efforts have to be established to achieve the maintenance of urban freshwater ecosystems’ health, considering the nature of cities as socio-ecological systems by incorporating people’s values, attitudes, and behaviors [6].

5. Conclusions

The main findings of this study were as follows: (1) The benthic and zooplankton communities could help us discriminate the ecological conditions of the urban wetlands through biotic indices and FFGs. (2) The proposed FFGs for zooplankton, after including rotifers (active raptorial and passive raptorial), shredder filters, and passive filters, were suitable for this research, and could be for other ecological studies. (3) Species of both communities were proposed as bioindicator taxa. (4) The degree of disturbance of the six urban ponds was different when bioindicators of each community were analyzed separately or jointly.
Additional research and diverse management strategies should be developed and applied to maintain ecological processes in urban ecosystems, with a holistic approach including the society that interacts with these aquatic environments. The knowledge gained should contribute to the design and development of environmental management actions, and to raising awareness that cities are ecosystems, and the water bodies within cities sustain biodiversity acting as bioindicators of environmental impairment. We propose to deepen this study, by integrating the results of this work into a socioecological index combining ecological, economic, and social indicators.

Author Contributions

M.J.A.: conceptualization, methodology, investigation, formal analysis, writing—original draft. P.A.V.: investigation, methodology; formal analysis, review and editing; L.R.: investigation, methodology, editing; M.M.: conceptualization, methodology, project administration, supervision, funding acquisition, writing—review amd editing; A.M.G.: conceptualization, methodology, project administration, supervision, funding acquisition, writing—review and editing. All authors have read and agreed to the published version of the manuscript.

Funding

This research was funded by Universidad Nacional del Litoral, Argentina (Project CAI + D Orientado 2017 “Elaboración de un Índice de Sostenibilidad (Indicadores Ecológicos, Económicos y Sociales) de Sistemas Acuáticos de la Provincia de Santa Fe”.

Institutional Review Board Statement

Not applicable.

Informed Consent Statement

Not applicable.

Data Availability Statement

Not applicable.

Acknowledgments

We would like to thank Lic. Natalí Romero for her contributions to this research, and we also thank Guillermo R. Castro for English revision of the manuscript.

Conflicts of Interest

The authors declare no conflict of interest.

Abbreviations

Physicochemical parameter
TTemperature (°C)
pHpH
CondConductivity (µS·cm−1)
DODissolved Oxygen (mg·L−1)
SecchiTransparency (cm)
DepthDepth (cm)
Sand% Sand
SC% Silt and clay
CPOM% Coarse Particulate Organic Matter
FPOM% Fine Particulate Organic Matter
UFPOM% Ultra Fine Particulate Organic Matter
Species
AscAscomorpha sp.
AsplAsplanchna sp.
BdelBdelloidea sp.
BangBrachionus angularis
BcauBrachionus caudatus
BhavBrachionus havanensis
BcalBrachionus calyciforus
BbudBrachionus budapestinensis
BquaBrachionus quadridentatus
BrubBrachionus rubens
BspBrachionus sp.
CephCephalodella sp.
CollCollurela sp.
EuchEuchlanis sp.
FlonFilinia longiseta
HexaHexarthra sp.
KquaKeratella quadrata
KtroKeratella tropica
KspKeratella sp.
LbulLecane bulla
LechamLecane hamate
LspLecane sp.
LphyLecane phyrra
LpatLepadella patella
LrhoLepadella romboides
MeuManfredium eudactyla
MytiMytilina sp.
PpatPlatyas patulus
PquaPlatyas quadricornis
PtypPlatyonus patulus
PolyPolyarthra sp.
SynSynchaeta sp.
TricTrichocerca sp.
TestTestudinella sp.
AlmonAlona monocantha
AlAlona sp.
DaphmddDaphnia middendorfiana
JclaJuvenile cladocera
MmicMoina micrura
MminMoina minuta
MretMoina reticulata
MspMoina sp.
MdpmMoinodaphnia macleayi
NauNauplio
CalOrden Calanoida
CycOrden Cyclopoida
HarOrden Harpactoidea
ChChironomus sp.
ChsChironomus sancticaroli
GlGoeldichironomus luridus
LssLarsia sp.
LhLimnodrilus hoffmeisteri
LcLimnodrilus claparedeianus
LimnLimnodrilus sp.
DoDero obtusa
DdDero digitata
DsDero sawayai
AulAulophorus furcatus
DbDero botrytis
DrDero sp.
SsSlavinia sawayai
NvNais variabilis
AaAllonais arieli
HiHirudinea
MeMermithidae
NeNematoda
OstOstracoda

Appendix A

Table A1. Taxonomic list of the benthic macroinvertebrates community. Presence/absence in each sampling site.
SpeciesPGBRECUS1S2S3S4
Chironomus sp.xx
Chironomus xanthusxxxxxx
Goeldichironomus luridus xxx
Polypedium sp. x
Ceratopogonidae x
Monopelopia sp. x
Larsia sp.xx
Bothrioneurum sp. x
Limnodrilus hoffmeisterixxxxx
Limnodrilus claparedeianusxxxxx
Dero obtuse xxxxx
Dero digitatax xxxx
Aulophorus furcatus x
Dero sawayaixxxxxx
Dero botrytisxx
Slavina sawayaixx x
Nais variabilisxxxxxx
Nais shubarti x
Allonais arieli x
Hirudinea xxxx
Mermithidaexx
Nematoda xxx
Cyclopoidaxxxxxx
Calanoidaxx x
Daphnia sp. x
Moina reticulata x xxx
Moinodaphnia macleayi x xxx
Chydorus sp. x
Ostracoda x
Hyalella curvispina xx
Pomacea sp. xx
Planorbidae x x
Table A2. Taxonomic list of zooplanktonic community. Presence (x) in each sampling site.
SpeciesPGBRECUS1S2S3S4
Ascomorpha sp.xx
Asplanchna sp.xxxxxx
Bdelloidea sp.xxxxxx
Brachionus angularisxxxxxx
Brachionus caudatusxxxxxx
Brachionus caudatus alstromix
Brachionus havanensisx xxxx
Brachionus calyciflorusx xxxx
Brachionus budapestinensisx xxxx
Brachionus quadridentatusx xxxx
Brachionus Rubensx x
Cephalodella sp. xx
Colurella sp.xx
Euchlanis sp.x
Filinia sp.x
Filinia longisetaxxxxxx
Hexarthra sp.x xxxx
Keratella quadrataxx
Keratella tropicax xxxx
Keratella valgax
Lecane acronychaxx
Lecane bulla xx x
Lecane closterocercaxx
Lecane hamataxxxxx
Lecane hastata x
Lecane papuana x
Lecane phyrra x
Lecane sp.
Lepadella patella
Lepadella romboides xx
Manfredium eudactyla x
Mytilina sp. xx x
Platyas patulus x
Platyas quadricornis x
Platyonus patulus xx
Polyarthra sp.xxxxxx
Synchaeta sp.x
Trichocerca sp.x xxxx
Testudinella sp. xx x
Alona monocantha xx x
Alona sp.x
Daphnia middendorfiana x
Daphnia sp. 1 x
Daphnia sp. 2 x
Guernella raphaelis x
Moina reticulata x xxx
Moina micrura xx x
Moina minuta xxxx
Moina reticulata x
Moinodaphnia macleayi x xxx
Pleuroxus similis x
Pleuroxus sp. x
Juvenile Cladocera x
Naupliixxxxxx
Juvenile Copepodaxx
Cyclopoidaxxxxxx
Calanoidaxx x
Harpacticoida xx x

References

  1. United Nations. World Urbanization Prospects: 2014 Revision, Department of Economic and Social Affairs, Population Division; United Nations: New York, NY, USA, 2014. [Google Scholar]
  2. OECD. OECD Environmental Outlook to 2050: The Consequences of Inaction; OECD: Paris, France, 2012. [Google Scholar]
  3. Ciacci, A.; Ivaldi, E.; González-Relaño, R. A Partially Non-Compensatory Method to Measure the Smart and Sustainable Level of Italian Municipalities. Sustainability 2021, 13, 435. [Google Scholar] [CrossRef]
  4. Cardinale, B.; Duffy, J.; Gonzalez, A.; Hooper, D.U.; Perrings, C.; Venail, P.; Narwani, A.; Mace, G.M.; Tilman, D.; Wardle, D.A.; et al. Biodiversity loss and its impact on humanity. Nature 2021, 486, 59–67. [Google Scholar] [CrossRef]
  5. Harrison, P.A.; Berry, P.M.; Simpson, G.; Haslett, J.R.; Blicharska, M.; Bucur, M.; Dunford, R.; Egoh, B.; Garcia-Llorente, M.; Geamănă, N.; et al. Linkages between biodiversity attributes and ecosystem services: A systematic review. Ecosyst. Serv. 2014, 9, 191–203. [Google Scholar] [CrossRef] [Green Version]
  6. Kowarik, I.; Fischer, L.K.; Kendal, D. Biodiversity Conservation and Sustainable Urban Development. Sustainability 2020, 12, 4964. [Google Scholar] [CrossRef]
  7. Ives, C.D.; Lentini, P.E.; Threlfall, C.G.; Ikin, C.; Shanahan, D.F.; Garrard, D.E.; Bekessy, S.A.; Fuller, R.A.; Mumaw, L.; Rayner, L.; et al. Cities are hotspots for threatened species. Glob. Ecol. Biogeogr. 2016, 25, 117–126. [Google Scholar] [CrossRef]
  8. Nilon, C.H.; Berkowitz, A.R.; Hollweg, K.S. Understanding urban ecosystems: A new frontier for science and education. Urban Ecosyst. 1999, 3, 3–4. [Google Scholar] [CrossRef]
  9. Sandifer, P.A.; Sutton-Grier, A.E.; Ward, B.P. Exploring connections among nature, biodiversity, ecosystem services, and human health and well-being: Opportunities to enhance health and biodiversity conservation. Ecosyst. Serv. 2015, 12, 1–15. [Google Scholar] [CrossRef] [Green Version]
  10. Aronson, M.F.; Lepczyk, C.A.; Evans, K.L.; Goddard, M.A.; Lerman, S.B.; MacIvor, J.S.; Vargo, T. Biodiversity in the city: Key challenges for urban green space management. Front. Ecol. Environ. 2017, 15, 189–196. [Google Scholar] [CrossRef] [Green Version]
  11. Häder, D.P.; Banaszak, A.T.; Villafañe, V.E.; Narvarte, M.A.; González, R.A.; Helbling, E.W. Anthropogenic pollution of aquatic ecosystems: Emerging problems with global implications. Sci. Total Environ. 2020, 713, 136586. [Google Scholar] [CrossRef]
  12. Assefa, W.W.; Eneyew, B.G.; Wondie, A. The impacts of land-use and land-cover change on wetland ecosystem service values in peri-urban and urban area of Bahir Dar City, Upper Blue Nile Basin, Northwestern Ethiopia. Ecol Process 2021, 10, 39. [Google Scholar] [CrossRef]
  13. Millenium Ecosystem Assessment. Ecosystems and Human Well-Being; Island Press: Washington, DC, USA, 2005; Volume 5. [Google Scholar]
  14. Dong, T.; Xu, W.; Zheng, H.; Xiao, Y.; Kong, L.; Ouyang, Z. A Framework for Regional Ecological Risk Warning Based on Ecosystem Service Approach: A Case Study in Ganzi, China. Sustainability 2018, 10, 2699. [Google Scholar] [CrossRef] [Green Version]
  15. Zhai, T.; Wang, J.; Fang, Y.; Liu, J.; Huang, L.; Chen, K.; Zhao, C. Identification and Prediction of Wetland Ecological Risk in Key Cities of the Yangtze River Economic Belt: From the Perspective of Land Development. Sustainability 2021, 13, 411. [Google Scholar] [CrossRef]
  16. Niesenbaum, R.A. The Integration of Conservation, Biodiversity, and Sustainability. Sustainability 2019, 11, 4676. [Google Scholar] [CrossRef] [Green Version]
  17. Campbell-Arvai, V. Engaging urban nature: Improving our understanding of public perceptions of the role of biodiversity in cities. Urban Ecosyst. 2019, 22, 409–423. [Google Scholar] [CrossRef]
  18. Chien, W.C.; Li, M.H.; Li, H.J. Appropriate management practices help enhance odonate species richness of small ponds in peri-urban landscapes. Urban Ecosyst. 2019, 22, 757–768. [Google Scholar] [CrossRef]
  19. Souza Costa, B.N.; Campelo Pinheiro, S.C.; Lund Amado, L.; de Oliveira Lima, M. Microzooplankton as a bioindicator of environmental degradation in the Amazon. Ecol. Indic. 2016, 61, 526–545. [Google Scholar] [CrossRef]
  20. Marchese, M.; Gagneten, A.M.; Montalto, L.; Gallardo, L.I.; Damborsky, M.P.; Poi, A.S.G. Aplicación de Indicadores Biológicos en el Nordeste Argentino. In Indicadores Biológicos, Calidad Biológica de Agua, Aplicaciones y Perspectivas de Uso; Dominguez, A., Giorgi, A., Eds.; Eudeba: Buenos Aires, Argentina, 2018. [Google Scholar]
  21. Forio, M.A.E.; Goethals, P.L.M. An Integrated Approach of Multi-Community Monitoring and Assessment of Aquatic Ecosystems to Support Sustainable Development. Sustainability 2020, 12, 5603. [Google Scholar] [CrossRef]
  22. Ruaro, R.; Gubiani, E.A. A scientometric assessment of 30 years of the Index of Biotic Integrity in aquatic ecosystems: Applications and main flaws. Ecol. Indic. 2013, 29, 105–110. [Google Scholar] [CrossRef]
  23. Serra, S.R.Q.; Calapez, A.R.; Simões, N.E.; Sá Marques, J.A.A.; Laranjo, M.; João Feio, M. Effects of variations in water quantity and quality in the structure and functions of invertebrates’ community of a Mediterranean urban stream. Urban Ecosyst. 2019, 22, 1173–1186. [Google Scholar] [CrossRef]
  24. Rosenberg, D.M.; Resh, V.H. Freshwater Biomonitoring and Benthic Macroinvertebrates; Chapman y Hall, Inc.: London, UK, 1993; 488p. [Google Scholar]
  25. Li, L.; Zheng, B.; Liu, L. Biomonitoring and bioindicators used for river ecosystems: Definitions, approaches and trends. Procedia Environ. Sci. 2010, 2, 1510–1524. [Google Scholar] [CrossRef] [Green Version]
  26. Liu, W.; Chen, X.; Wang, Q. Local Assessment of Shanghai: Effects of Urbanization on the Diversity of Macrobenthic Invertebrates. In Urbanization, Biodiversity and Ecosystem Services: Challenges and Opportunities; Elmqvist, T., Ed.; Springer Open: Berlin/Heidelberg, Germany, 2013; 771p. [Google Scholar] [CrossRef] [Green Version]
  27. Epele, L.B.; Manzo, L.M.; Grech, M.G.; Macchi, P.; Claverie, A.Ñ.; Lagomarsino, L.; Miserendino, M.L. Disentangling natural and anthropogenic influences on Patagonian pond water quality. Sci. Total Environ. 2018, 613, 866–876. [Google Scholar] [CrossRef]
  28. Lopes Costa, L.; Rosental Zalmon, I.; Fanini, L.; Defeo, O. Macroinvertebrates as indicators of human disturbances on sandy beaches: A global review. Ecol. Indic. 2020, 118, 106764. [Google Scholar] [CrossRef]
  29. Gagneten, A.M.; Plá, R.R.; Regaldo, L.; Paggi, J.C. Assesment of Bioconcentration Factor of Chromium by Instrumental Neutron Activation Analysis in Argyrodiaptomus falcifer Daday, a subtropical freshwater copepod. Water Air Soil Pollut. 2009, 204, 133–138. [Google Scholar] [CrossRef]
  30. Jeppesen, E.; Nõges, P.; Davidson, T.A.; Haberman, J.; Nõges, T.; Blank, K.; Johansson, L.S. Zooplankton as indicators in lakes: A scientific-based plea for including zooplankton in the ecological quality assessment of lakes according to the European Water Framework Directive (WFD). Hydrobiologia 2011, 676, 279. [Google Scholar] [CrossRef]
  31. Almeidal, R.; Formigo, N.E.; Sousa-Pinto, I.; Antunes, S.C. Contribution of zooplankton as a biological element in the assessment of reservoir water quality. Limnetica 2020, 39, 245–261. [Google Scholar] [CrossRef]
  32. Zannatul, F.; Muktadir, A.K.M. A Review: Potentiality of zooplankton as bioindicator. Am. J. Appl. Sci. 2009, 6, 1815–1819. [Google Scholar] [CrossRef]
  33. Liang, D.; Wang, Q.; Wei, N.; Tang, C.; Sun, X.; Yang, Y. Biological indicators of ecological quality in typical urban river-lake ecosystems: The planktonic rotifer community and its response to environmental factors. Ecol. Indic. 2020, 112, 106127. [Google Scholar] [CrossRef]
  34. Resh, V.H. Which group is best? Attributes of different biological assemblages used in freshwater biomonitoring programs. Environ. Monit. Assess. 2008, 138, 131–138. [Google Scholar] [CrossRef]
  35. Sommer, U. (Ed.) Plankton Ecology: Succession in Plankton Commnunities; Springer: Berlin/Heidelberg, Germany, 1989. [Google Scholar] [CrossRef]
  36. Trevisan, G.V.; Forsberg, B.R. Relationships among nitrogen and total phosphorus, algal biomass and zooplankton density in the central Amazonia lakes. Hydrobiologia 2007, 586, 357–365. [Google Scholar] [CrossRef]
  37. Rubright, J.S.; Harrell, J.L.; Holcomb, H.W.; Parker, J.C. Responses of planktonic and benthic communities to fertilizer and feed applications in shrimp mariculture ponds. J. World Maric. Soc. 1981, 12, 281–299. [Google Scholar] [CrossRef]
  38. Gagneten, A.M.; Marchese, M. Effect of Paraquat on freshwater zooplankton and zoobenthic assemblages in enclosure experiments. Int. J. Ecohydrol. Hydrobiol. 2003, 3, 389–398. [Google Scholar]
  39. Nowicki, C.J.; van Hees, E.H.; Kashian, D.R. Comparative effects of sediment versus aqueous polychlorinated biphenyl (PCB) exposure on benthic and planktonic invertebrates. Environ. Toxicol. Chem. 2014, 33, 641–647. [Google Scholar] [CrossRef]
  40. Marchese, M.R.; Rodriguez, A.R.; Pave, P.J.; Carignano, M.R. Benthic invertebrates structure in wetlands of a tributary of the middle Parana River (Argentina) affected by hydrologic and anthropogenic disturbances. J. Environ. Biol. 2008, 29, 343. [Google Scholar]
  41. Azevêdo, D.J.S.; Barbosa, J.E.L.; Gomes, W.I.A.; Porto, D.E.; Marques, J.C.; Molozzi, J. Diversity measures in macroinvertebrate and zooplankton communities related to the trophic status of subtropical reservoirs: Contradictory or complementary responses? Ecol. Indic. 2015, 50, 135–149. [Google Scholar] [CrossRef]
  42. Rodríguez Capítulo, A.R.; Tangorra, M.; Ocón, C. Use of benthic macroinvertebrates to assess the biological status of Pampean streams in Argentina. Aquat. Ecol. 2001, 35, 109–119. [Google Scholar] [CrossRef]
  43. Abbasi, T.; Abbasi, S.A. Water Quality Indices; Elsevier: Amsterdam, The Netherlands, 2012. [Google Scholar]
  44. Kuhlmann, M.L.; Johnscher-Fornasaro, G.; Ogura, L.L.; Imbimbo, H.R.V. Protocolo para o Biomonitoramento com as Comunidades Bentônicas de Rios e Reservatórios do Estado de São Paulo; CETESB: São Paulo, Brazil, 2012. [Google Scholar]
  45. Navarro-Ortega, A.; Acuña, V.; Bellin, A.; Burek, P.; Cassiani, G.; Choukr-Allah, R.; Grathwohl, P.; Jones, C.; Rault, P.K.; Kok, K.; et al. Managing the effects of multiple stressors on aquatic ecosystems under water scarcity. The GLOBAQUA project. Sci. Total Environ. 2015, 503–504, 3–9. [Google Scholar] [CrossRef] [Green Version]
  46. Parker, J.; Cao, Y.; Sass, G.G.; Epifanio, J. Large river fish functional diversity responses to improved water quality over a 28 year period. Ecol. Indic. 2018, 88, 322–331. [Google Scholar] [CrossRef]
  47. Kalarus, K.; Halecki, W.; Skalski, T. Both semi-natural and ruderal habitats matter for supporting insect functional diversity in an abandoned quarry in the city of Kraków (S Poland). Urban Ecosyst. 2019, 22, 943–953. [Google Scholar] [CrossRef] [Green Version]
  48. Vieira, N.K.M.; Poff, N.L.; Carlisle, D.M.; Moulton, S.R.; Koski, M.L.; Kondratieff, B.C. A Database of Lotic Invertebrate Traits for North America; U.S. Geological Survey Data Series 187; US Department of the Interior: Reston, VA, USA, 2006. [Google Scholar] [CrossRef]
  49. Wentworth, C. A scale of grade and class terms for clastic sediments. J. Geol. 1922, 30, 377–392. [Google Scholar] [CrossRef]
  50. Merritt, R.W.; Cummins, K.W.; Berg, M.B. Trophic Relationships of Macroinvertebrates. In Methods in Stream Ecology; Academic Press: Cambridge, MA, USA, 2017; Volume 1, pp. 413–433. [Google Scholar]
  51. Gallardo, B.; Gascón, S.; Quintana, X.; Comín, F.A. How to choose a biodiversity indicator-Redundancy and complementarity of biodiversity metrics in a freshwater ecosystem. Ecol. Indic. 2011, 11, 1177–1184. [Google Scholar] [CrossRef]
  52. Gagneten, A.M.; Paggi, J.C. Effects of heavy metal contamination (Cr, Cu, Pb, Cd) and eutrophication on zooplankton in the lower basin of the Salado River (Argentina). Water Air Soil Pollut. 2009, 198, 317–334. [Google Scholar] [CrossRef]
  53. Barnett, A.J.; Finlay, K.; Beisner, B.E. Functional diversity of crustacean zooplankton communities: Towards a trait-based classification. Freshw. Biol. 2007, 52, 796–813. [Google Scholar] [CrossRef]
  54. DeMott, W.R.; Kerfoot, W.C. Competition among cladocerans: Nature of the interaction between Bosmina and Daphnia. Ecology 1982, 63, 1949–1966. [Google Scholar] [CrossRef]
  55. Bogdan, K.G.; Gilbert, J.J. Body size and food size in freshwater zooplankton. Proc. Natl. Acad. Sci. USA 1984, 81, 6427–6431. [Google Scholar] [CrossRef] [Green Version]
  56. Stemberger, R.S.; Gilbert, J.J. Body size, food concentration, and population growth in planktonic rotifers. Ecology 1985, 66, 1151–1159. [Google Scholar] [CrossRef]
  57. Obertegger, U.; Smith, H.A.; Flaim, G.; Wallace, R.L. Using the guild ratio to characterize pelagic rotifer communities. Hydrobiologia 2011, 662, 157–162. [Google Scholar] [CrossRef]
  58. Regaldo, L.; Gutierrez, M.; Reno, U.; Fernández, V.; Gervasio, S.; Repetti, M.; Gagneten, A.M. Water and sediment quality assessment in the Colastiné-Corralito stream system (Santa Fe, Argentina): Impact of industry and agriculture on aquatic ecosystems. Environ. Sci. Pollut. Res. 2018, 25, 6951–6968. [Google Scholar] [CrossRef]
  59. Vaschetto, P.; Regaldo, L.; Polla, W.; Andrade, V.; Gervasio, S.; Gagneten, A.M. Plankton community responses to anthropogenic pollution in an Argentinian urban reserve. Water Air Soil Pollut. 2021, 232, 427. [Google Scholar] [CrossRef]
  60. Andrade, V.S.; Gutierrez, M.F.; Regaldo, L.; Paira, A.R.; Repetti, M.R.; Gagneten, A.M. Influence of rainfall and seasonal crop practices on nutrient and pesticide runoff from soybean dominated agricultural areas in Pampean streams, Argentina. Sci. Total Environ. 2021, 788, 147676. [Google Scholar] [CrossRef]
  61. Caino, A. Alternativas de Gestión De una Laguna Urbana Eutrofizada de Santa Fe (Argentina) Utilizando el Fitoplancton Como Indicador de Calidad Trófica. In Tesina de Licenciatura en Biodiversidad; Facultad de Humanidades y Ciencias, Universidad Nacional del Litoral: Santa Fe, Argentina, 2016. [Google Scholar]
  62. Sulehria, A.Q.K.; Qamar, M.F.; Haider, S.; Ejaz, M.; Hussain, A. Water quality and Rotifer diversity in the fish pond at District Mianwali Pakistan. Biologia 2009, 55, 79–85. [Google Scholar]
  63. Sarkar, R.; Ghosh, A.R.; Mondal, N.K. Comparative study on physicochemical status and diversity of macrophytes and zooplanktons of two urban ponds of Chandannagar, WB, India. Appl. Water Sci. 2020, 10, 63. [Google Scholar] [CrossRef] [Green Version]
  64. Cummins, K.W.; Merritt, R.W.; Andrade, P.C. The use of invertebrate functional groups to characterize ecosystem attributes in selected streams and rivers in south Brazil. Stud. Neotrop. Fauna Environ. 2005, 40, 69–89. [Google Scholar] [CrossRef]
  65. Rodríguez, P.; Arrate, J.; Martinez-Madrid, M.; Reynoldson, T.B.; Schumacher, V.; Viguri, J. Toxicity of Santander Bay Sediments to the Euryhaline Freshwater Oligochaete Limnodrilus hoffmeisteri. In Aquatic Oligochaete Biology IX; Springer: Dordrecht, The Netherlands, 2006; pp. 157–169. [Google Scholar]
  66. Martins, R.T.; Stephan, N.N.C.; Alves, R.G. Tubificidae (Annelida: Oligochaeta) as an indicator of water quality in an urban stream in southeast Brazil. Acta Limnol. Bras. 2008, 20, 221–226. [Google Scholar]
  67. Mugni, H.; Ronco, A.; Bonetto, C. Insecticide toxicity to Hyalella curvispina in runoff and stream water within a soybean farm (Buenos Aires, Argentina). Ecotoxicol. Environ. Saf. 2011, 74, 350–354. [Google Scholar] [CrossRef] [PubMed]
  68. Anguiano, O.L.; Vacca, M.; Araujo, M.E.R.; Montagna, M.; Venturino, A.; Ferrari, A. Acute toxicity and esterase response to carbaryl exposure in two different populations of amphipods Hyalella curvispina. Aquat. Toxicol. 2017, 188, 72–79. [Google Scholar] [CrossRef] [PubMed]
  69. Gagneten, A.M. Effects of Contamination by Heavy Metals and Eutrophication on Zooplankton, and Their Possible Effects on the Throphic Webs of Freshwater Aquatic Ecosystems. In Eutrophication: Causes, Consequences and Control, 1st ed.; Ansari, A.A., Singh Gill, S., Lanza, G.R., Rast, W., Eds.; Springer: Berlin/Heidelberg, Germany, 2011; 394p, ISBN 97890-481-9624-1. [Google Scholar]
  70. Hanazato, T. Response of a zooplankton community to insecticide application in experimental ponds: A review and the implications of the effects of chemicals on the structure and functioning of freshwater communities. Environ. Pollut. 1998, 101, 361–373. [Google Scholar] [CrossRef]
  71. Sterner, R.W. Role of zooplankton in aquatic ecosystems. In Encyclopedia of Inland Waters; Likens, G.E., Ed.; Academic Press: Oxford, UK, 2009; pp. 678–688. [Google Scholar]
  72. Mukhopadhyay, S.K.; Chattopadhyay, B.; Goswami, A.R. Spatial variations in zooplankton diversity in waters contaminated with composite effluents. J. Limnol. 2007, 66, 97–106. [Google Scholar] [CrossRef] [Green Version]
  73. Sharma, K.K.; Saini, M. Impact of industrial effluents on the diversity and population structure of rotifer fauna in river basantar, jammu (j&k, India). Int. J. Adv. Res. 2016, 4, 1458–1472. [Google Scholar] [CrossRef] [Green Version]
  74. Pejler, B. Zooplanktic indicators of trophy and their food. Hydrobiologia 1983, 101, 111–114. [Google Scholar] [CrossRef]
  75. Von der Ohe, P.C.; Liess, M. Relative sensitivity distribution of aquatic invertebrates to organic and metal compounds. Environ. Toxicol. Chem. Int. J. 2004, 23, 150–156. [Google Scholar] [CrossRef]
  76. Dalla Bona, M.; Di Leva, V.; De Liguoro, M. The sensitivity of Daphnia magna and Daphnia curvirostris to 10 veterinary antibacterials and to some of their binary mixtures. Chemosphere 2014, 115, 67–74. [Google Scholar] [CrossRef] [PubMed]
  77. Petchey, O.L.; Gaston, K.J. Functional diversity (FD), species richness and community composition. Ecol. Lett. 2002, 5, 402–411. [Google Scholar] [CrossRef]
  78. Vogt, R.J.; Beisner, B.E.; Prairie, Y.T. Functional diversity is positively associated with biomass for lake diatoms. Freshw. Biol. 2010, 55, 1636–1646. [Google Scholar] [CrossRef]
  79. Archaimbault, V.; Usseglio-Polatera, P.; Garric, J.; Wasson, J.G.; Babut, M. Assessing pollution of toxic sediment in streams using bio-ecological traits of benthic macroinvertebrates. Freshw. Biol. 2010, 55, 1430–1446. [Google Scholar] [CrossRef]
  80. Statzner, B.; Bêche, L.A. Can biological invertebrate traits resolve effects of multiple stressors on running water ecosystems? Freshw. Biol. 2010, 55, 80–119. [Google Scholar] [CrossRef]
  81. Peng, F.J.; Pan, C.G.; Zhang, N.S.; ter Braak, C.J.; Salvito, D.; Selck, H.; Ying, G.G.; Van den Brink, P.J. Benthic invertebrate and microbial biodiversity in sub-tropical urban rivers: Correlations with environmental variables and emerging chemicals. Sci. Total Environ. 2020, 709, 136281. [Google Scholar] [CrossRef] [PubMed]
  82. Muñoz, I.; Sabater, S.; Barata, C. Evaluating ecological integrity in multistressed rivers: From the currently used biotic indices to newly developed approaches using biofilms and invertebrates. In Emerging and Priority Pollutants in Rivers; Springer: Berlin/Heidelberg, Germany, 2012; pp. 219–241. [Google Scholar]
  83. Lencioni, V.; Bellamoli, F.; Paoli, F. Multi-level effects of emerging contaminants on macroinvertebrates in Alpine streams: From DNA to the ecosystem. Ecol. Indic. 2020, 117, 106660. [Google Scholar] [CrossRef]
  84. Gabriels, W.; Lock, K.; De Pauw, N.; Goethals, P.L. Multimetric Macroinvertebrate Index Flanders (MMIF) for biological assessment of rivers and lakes in Flanders (Belgium). Limnol. Ecol. Manag. Inland Waters 2010, 40, 199–207. [Google Scholar] [CrossRef] [Green Version]
  85. Rocchetta, I.; Pasquevich, M.Y.; Heras, H.; de Molina, M.D.C.R.; Luquet, C.M. Effects of sewage discharges on lipid and fatty acid composition of the Patagonian bivalve Diplodon chilensis. Mar. Pollut. Bull. 2014, 79, 211–219. [Google Scholar] [CrossRef]
  86. Muñoz-Colmenares, M.E.; Soria, J.M.; Vicene, E. Can zooplankton species be used as indicators of trophic status and ecological potential of reservoirs? Aquat. Ecol. 2021, 55, 1143–1156. [Google Scholar] [CrossRef]
  87. Whiting, E.R.; Clifford, H.F. Invertebrates and urban runoff in a small northern stream, Edmonton, Alberta, Canada. Hydrobiologia 1983, 102, 73–80. [Google Scholar] [CrossRef]
  88. Zimmer, K.D.; Hanson, M.A.; Butler, M.G.; Duffy, W.G. Size distribution of aquatic invertebrates in two prairie wetlands, with and without fish, with implications for community production. Freshw. Biol. 2001, 46, 1373–1386. [Google Scholar] [CrossRef]
  89. Gascón, S.; Brucet, S.; Sala, J.; Boix, D.; Quintana, X.D. Comparison of the effects of hydrological disturbance events on benthos and plankton salt marsh communities. Estuar. Coast. Shelf Sci. 2007, 74, 419–428. [Google Scholar] [CrossRef]
  90. Scharler, U.M.; Lechman, K.; Radebe, T.; Jerling, H.L. Effects of prolonged mouth closure in a temporarily open/closed estuary: A summary of the responses of invertebrate communities in the uMdloti Estuary, South Africa. Afr. J. Aquat. Sci. 2020, 45, 121–130. [Google Scholar] [CrossRef]
  91. Chapman, P.M.; Brinkhurst, R.O. Lethal and Sublethal Tolerances of Aquatic Oligochaetes with Reference to Their Use as a Biotic Index of Pollution. In Aquatic Oligochaeta; Springer: Dordrecht, The Netherlands, 1984; pp. 139–144. [Google Scholar]
  92. Andersen, T.; Hessen, D.O. Carbon, nitrogen and phosphorus content of freshwater zooplankton. Limnol. Oceanogr. 1991, 36, 807–814. [Google Scholar] [CrossRef]
  93. Vinebrooke, R.D.; Schindler, D.W.; Findlay, D.L. Trophic dependence of ecosystem resistance and species compensation in experimentally acidified Lake 302S (Canada). Ecosystems 2003, 6, 101–113. [Google Scholar] [CrossRef]
  94. Beghelli, I.F.G.; Cetra, M.; Marchese, M.; López-Dovál, J.C.; Rosa, A.H.; Pompêo, M.L.; Moschini-Carlos, V. Taxonomic and non-taxonomic responses of benthic macroinvertebrates to metal toxicity in tropical reservoirs. The case of Cantareira Complex, São Paulo, Brazil. An. Acad. Bras. Ciências 2020, 92, e20180962. [Google Scholar] [CrossRef] [Green Version]
Figure 1. Location of Santa Fe City (Argentina) in South America; Location of the urban wetlands of Santa Fe City and sampling sites (S1, S2, S3, S4, PGB, and RECU).
Sustainability 14 04045 g001
Figure 2. Biplots resulting from the Canonical Correspondence Analysis, showing the environmental variables (A) and the ordination of the sampling sites, as well as the dominant benthic and zooplanktonic taxa (B). Please refer to the Abbreviation section for further information.
Sustainability 14 04045 g002
Figure 3. Functional feeding groups of the benthic community.
Sustainability 14 04045 g003
Figure 4. Functional feeding groups of the zooplankton community.
Sustainability 14 04045 g004
Figure 5. Gradient from more tolerant to more sensitive taxa including zoobenthos and zooplankton communities.
Sustainability 14 04045 g005
Table 1. Mean values (±standard deviation) of environmental variables of all sampling sites.
PGBRECUS1S2S3S4Kruskal-Wallis Test
T (°C)23.87 ± 5.7023.57 ± 5.0619.43 ± 6.0619.58 ± 6.6120.58 ± 5.5319.63 ± 6.470.821
pH8.09 ± 0.297.20 ± 0.187.91 ± 0.468.60 ± 0.217.64 ± 0.258.51 ± 1.110.044
Ω (µS cm−1)2158 ± 432.54823 ± 26.631449 ± 323.992627 ± 715.601029 ± 21.491102 ± 309.880.003
DO (mg L−1)8.98 ± 2.876.28 ± 0.256.85 ± 0.7710.69 ± 1.494.78 ± 0.9810.66 ± 3.170.008
Secchi (cm)32.05 ± 28.6528.33 ± 2.8929.25 ± 12.2023.00 ± 4.0043.25 ± 10.1128.50 ± 11.360.228
Depth (cm)33.67 ± 27.2132.33 ± 8.7459.75 ± 29.6733.25 ± 10.1147.00 ± 8.7252.38 ± 16.000.162
Table 2. Granulometry and bottom organic matter proportion (%) of all sampling sites. CPOM = coarse particulate organic matter; FPOM = fine particulate organic matter; UFPOM = ultra-fine particulate organic matter.
PGBRECUS1S2S3S4
Sand (%)988647769176
Silt-Clay (%)2145324924
CPOM (%)644231343537
FPOM (%)173435524539
UFPOM (%)192434142024
Table 3. Density, species richness (S), Shannon-Wiener Index (H), and Pielou’s Evenness (J) values of all sampling sites for benthic macroinvertebrates and zooplankton communities.
Benthos Zooplankton
DensitySHJDensitySHJ
Sites(Ind·m−2)(Ind·L−1)
JPGB115–52984–70.61–1.080.31–0.7212.29–22.6218–211.93–2.370.58–0.69
RECU796–71369–171.48–1.840.52–0.847.53–23.8521–271.72–2.290.47–0.66
S1332–84303–80.91–1.600.44–0.8637.84–223112–181.60–1.980.56–0.65
S21098–10,7467–121.29–1.740.52–0.84535.56–309211–231.14–2.140.52–0.63
S33197–13,7657–111.09–1.690.53–0.709.43–1028.87–161.61–2.120.59–0.85
S41365–18,3975–100.55–1.010.26–0.57342.23–14699–180.99–1.950.50–0.67
Table 4. Scores of the biotic indices were selected for the benthos community. Red: heavily polluted; yellow: moderately-regular polluted; green: slightly polluted.
Score
Sampling
Site
ChironomidaeNaidinaeTubificinaeCyclpoidaCalanoidaHirudinaeOstracodaPlanorbidaeAmpullriidaeNematodaCladoceraHyallelidaeIMRPBCI
PGB0.450.350.140.350.35 1.644
RECU0.450.350.140.350.350.550.400.55 3.143.25
S10.450.350.140.350.350.55 0.10 2.293.75
S20.450.350.140.350.350.55 0.100.55 2.843.25
S30.450.350.140.35 0.55 0.55 0.550.903.843.25
S40.450.350.140.350.350.550.400.55 0.10 0.904.143.25
Table 5. Biotic indicators applied for the zooplankton community. Red: heavily polluted; yellow: moderately-regular polluted; green: slightly polluted.
Sampling SiteRotifers/Total
Zooplankton
Microcrustaceans/
Total Zooplankton
Cladocerans/
Total Zooplankton
Macrocrustaceans/
Microcrustaceans
PGB0.940.050.040.03
RECU0.650.340.210.26
S10.850.140.110.04
S20.700.290.190.13
S30.900.090.080.01
S40.800.190.170.03
Publisher’s Note: MDPI stays neutral with regard to jurisdictional claims in published maps and institutional affiliations.

