
Screening of Plant Species Response and Performance for Green Belt Development: Implications for Semi-Urban Ecosystem Restoration

 , and
, and
Abstract
:1. Introduction
2. Materials and Methods
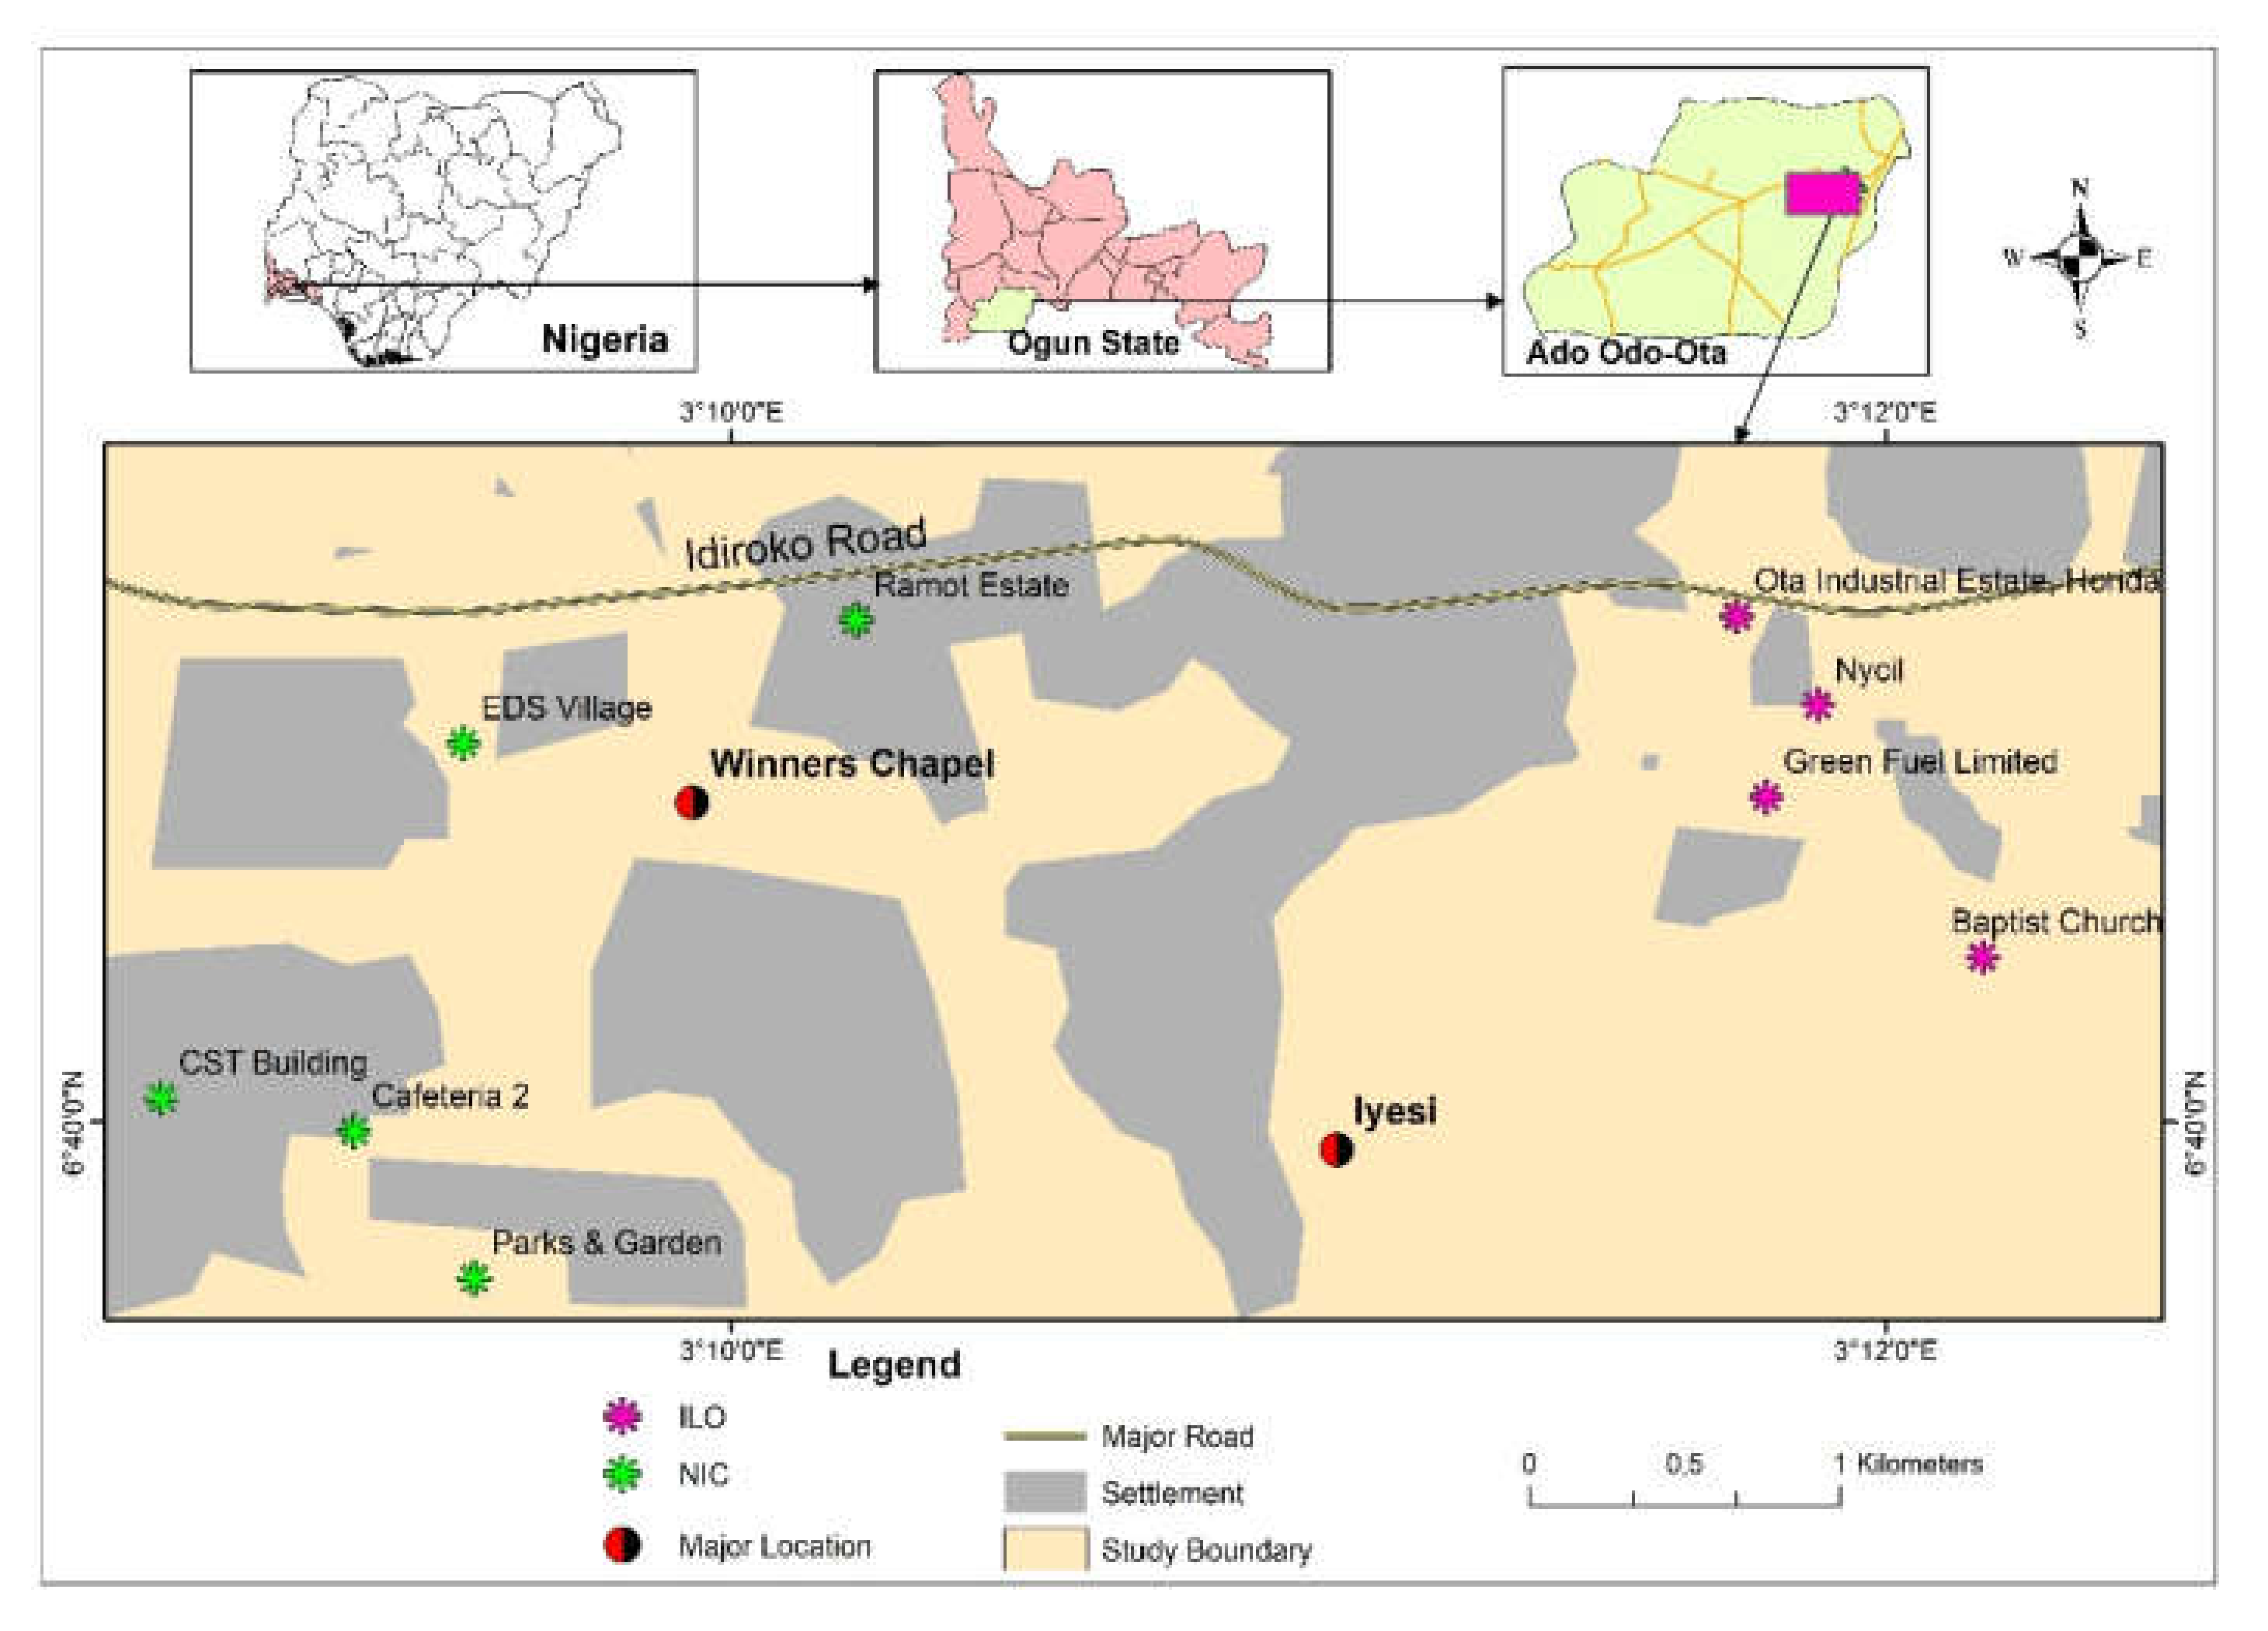
2.1. Study Sites
2.2. Sample Collection
2.3. Estimation of Biochemical Parameters
2.4. Air Pollution Tolerance Index (APTI)
2.5. Anticipated Performance Index (API)
2.6. Statistical Analysis
3. Results and Discussion
3.1. APTI Biochemical Parameters
3.1.1. pH of Leaf Extract (P)
3.1.2. Total Chlorophyll Content (T)
3.1.3. Relative Water Content (R)
3.1.4. Ascorbic Acid Contents (A)
3.2. Air Pollution Tolerance Index (APTI)
3.3. Anticipated Performance Index (API)
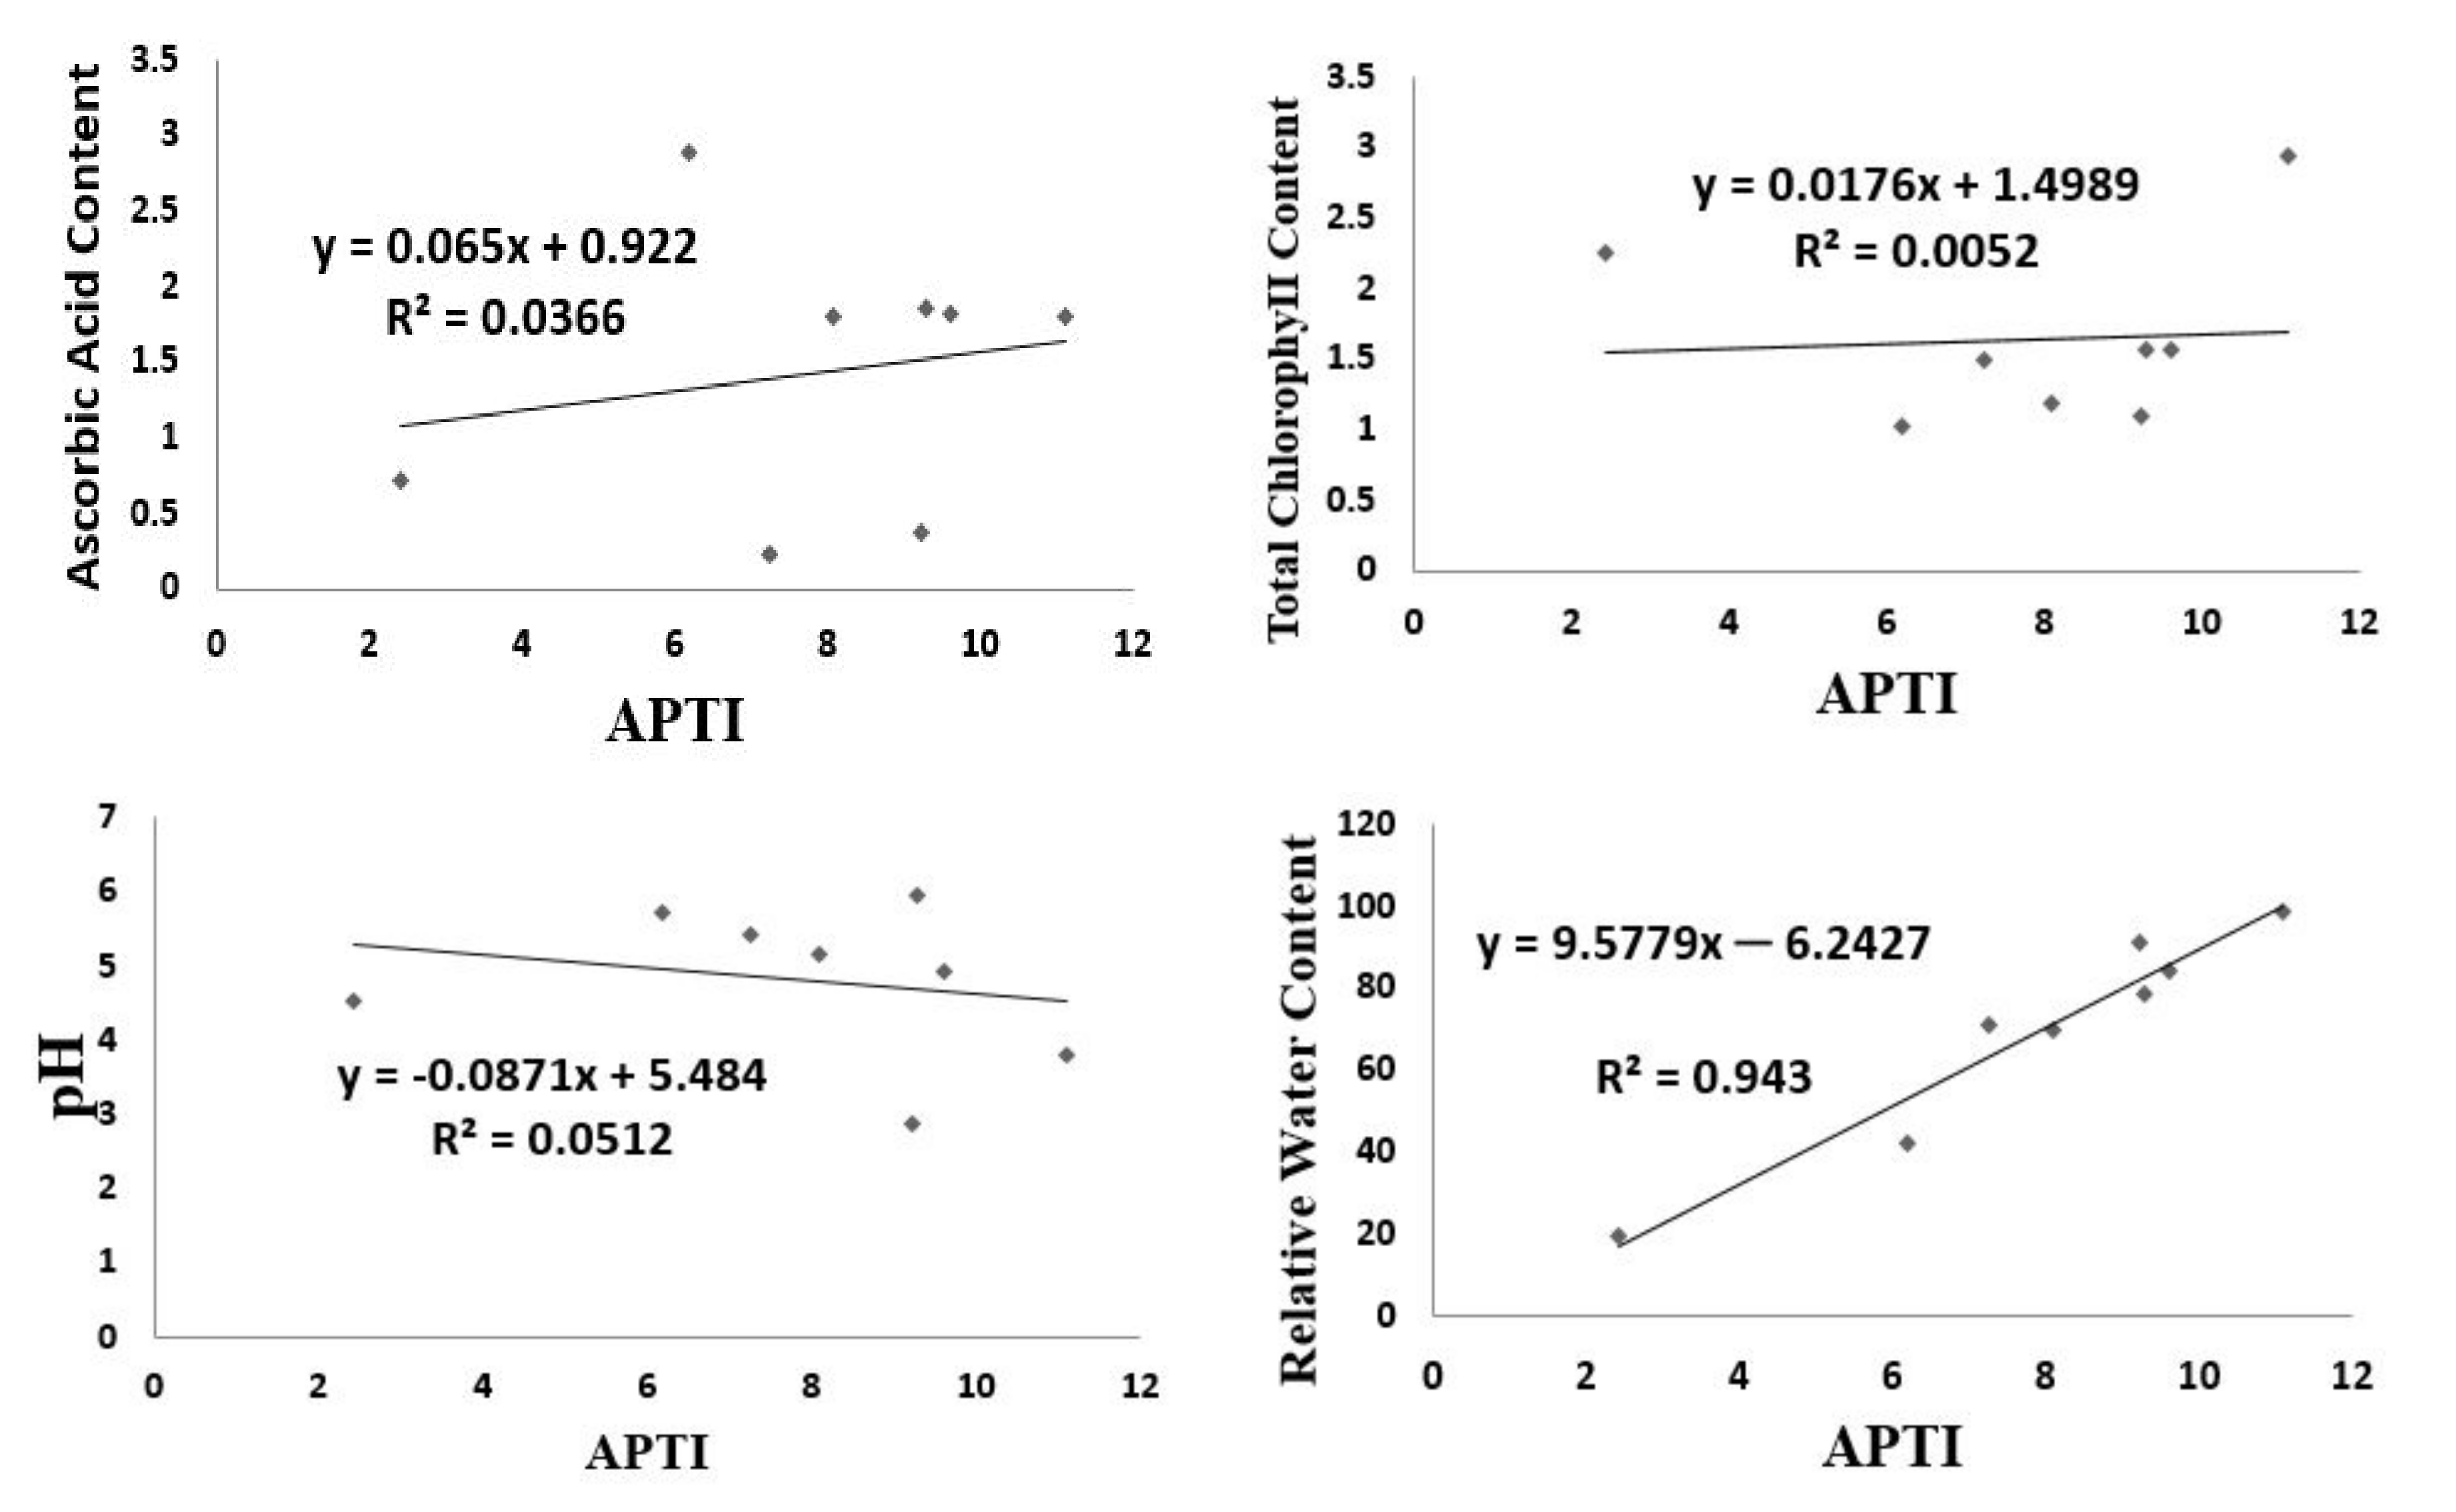
3.4. Statistical Modeling of Bio-Indicators Responses
4. Conclusions
Supplementary Materials
Author Contributions
Funding
Institutional Review Board Statement
Informed Consent Statement
Data Availability Statement
Acknowledgments
Conflicts of Interest
References
- Anake, W.U.; Eimanehi, J.E.; Omonhinmin, C.A. Evaluation of air pollution tolerance index and anticipated performance index of selected plant species. Indones J. Chem. 2019, 19, 239–244. [Google Scholar] [CrossRef]
- Manjunath, B.T.; Reddy, J. Comparative evaluation of air pollution tolerance of plants from polluted and non-polluted regions of Bengaluru. J. App. Biol. Biotechnol. 2019, 7, 63–68. [Google Scholar] [CrossRef] [Green Version]
- Kumar, P.; Druckman, A.; Gallagher, J.; Gatersleben, B.; Allison, S.; Eisenman, T.S.; Hoang, U.; Hama, S.; Tiwari, A.; Sharma, A.; et al. The nexus between air pollution, green infrastructure and human health. Environ. Int. 2019, 133 Pt A, 105181. [Google Scholar] [CrossRef] [PubMed]
- Huang, Y.; Lei, C.; Liu, C.H.; Perez, P.; Forehead, H.; Kong, S.; Zhou, J.L. A review of strategies for mitigating roadside air pollution in urban street canyons. Environ. Pollut. 2021, 280, 116971. [Google Scholar] [CrossRef] [PubMed]
- Ozdemir, H. Mitigation impact of roadside trees on fine particle pollution. Sci. Total Environ. 2019, 659, 1176–1185. [Google Scholar] [CrossRef]
- Bharti, S.K.; Trivedi, A.; Kumar, N. Air pollution tolerance index of plants growing near an industrial site. Urban Clim. 2018, 24, 820–829. [Google Scholar] [CrossRef]
- Manisalidis, I.; Stavropoulou, E.; Stavropoulos, A.; Bezirtzoglou, E. Environmental and Health Impacts of Air Pollution: A Review. Public Health Front. 2020, 8, 14. [Google Scholar] [CrossRef] [Green Version]
- Dass, A.; Srivastava, S.; Chaudhary, G. Air pollution: A review and analysis using fuzzy techniques in Indian scenario. Environ. Technol. Innov. 2021, 22, 101441. [Google Scholar] [CrossRef]
- Perini, K.; Ottelé, M.; Giulini, S.; Magliocco, A.; Roccotiello, E. Quantification of fine dust deposition on different plant species in a vertical greening system. Ecol. Eng. 2017, 100, 268–276. [Google Scholar] [CrossRef]
- Wadlow, C.; Paton-Walsh, H.; Forehead, P.; Perez, M.; Amirghasemi, É.A.; Guérette, O.; Gendek, P.K. Understanding spatial variability of air quality in Sydney: Part 2–A roadside case study. Atmosphere 2019, 10, 217. [Google Scholar] [CrossRef] [Green Version]
- Shrestha, S.; Baral, B.; Dhital, N.B.; Yang, H. Assessing air pollution tolerance of plant species in vegetation traffic barriers in Kathmandu Valley, NepaL. Sustain. Environ. Res. 2021, 31, 3. [Google Scholar] [CrossRef]
- Barwise, Y.; Kumar, P. Designing vegetation barriers for urban air pollution abatement: A practical review for appropriate plant species selection. Clim. Atmos. Sci. 2020, 3, 12. [Google Scholar] [CrossRef] [Green Version]
- Chen, J.; Yu, X.; Bi, H.; Fu, Y. Indoor simulations reveal differences among plant species in capturing particulate matter. PLoS ONE 2017, 12, e0177539. [Google Scholar] [CrossRef] [PubMed]
- Shao, F.; Dong, L.; Sun, F.; Wang, L.; Yu, L.; Bao, Z.; Zeng, X.; Yan, H.; Wang, Y.; Li, G. Study on different particulate matter retention capacities of the leaf surfaces of eight common garden plants in Hangzhou China. Sci. Total Environ. 2018, 652, 939–951. [Google Scholar] [CrossRef]
- Przybysz, A.; Popek, R.; Stankiewicz-Kosyl, M.; Zhu, C.Y.; Małecka-Przybysz, M.; Maulidyawati, T.; Mikowska, K.; Deluga, D.; Griżuk, K.; Sokalski-Wieczorek, J.; et al. Where trees cannot grow—Particulate matter accumulation by urban meadows. Sci. Total Environ. 2021, 785, 147310. [Google Scholar] [CrossRef]
- Han, D.; Shen, H.; Duan, W.; Chen, L. A review on particulate matter removal capacity by urban forests at different scales. Urban For. Urban Green 2020, 48, 126565. [Google Scholar] [CrossRef]
- Kaur, M.; Nagpal, A. Evaluation of air pollutiontolerance index and anticipated performanceindex of plants and their application indevelopment of green space along the urban areas. Environ. Sci. Pollut. Res. Int. 2017, 24, 18881–18895. [Google Scholar] [CrossRef]
- Khanoranga, S.K. Phytomonitoring of air pollution around brick kilns in Balochistan province Pakistan through air pollution index and metal accumulation index. J. Clean. Prod. 2019, 229, 727–738. [Google Scholar] [CrossRef]
- Karmakar, D.; Deb, K.; Padhy, P.K. Ecophysiological responses of tree species due to air pollution for biomonitoring of environmental health in urban area. Urban Clim. 2021, 35, 100741. [Google Scholar] [CrossRef]
- Liu, J.; Cao, Z.; Zou, S.; Liu, H.; Hai, X.; Wang, S.; Duan, J.; Xi, B.; Yan, G.; Zhang, S.; et al. An investigation of the leaf retention capacity, efficiency and mechanism for atmospheric particulate matter of five greening tree species in Beijing China. Sci. Total Environ. 2018, 616–617, 417–426. [Google Scholar] [CrossRef]
- Baldauf, R. Roadside vegetation design characteristics that can improve local, near-road air quality. Transp. Res. Part D 2017, 52, 354–361. [Google Scholar] [CrossRef]
- Diener, A.; Mudu, P. How can vegetation protect us from air pollution? A critical review on green spaces’ mitigation abilities for air-borne particles from a public health perspective—With implications for urban planning. Sci. Total Environ. 2021, 796, 148605. [Google Scholar] [CrossRef]
- Ferrini, F.; Fini, A.; Mori, J.; Gori, A. Role of Vegetation as a Mitigating Factor in the Urban Context. Sustainability 2020, 12, 4247. [Google Scholar] [CrossRef]
- Di Sabatino, S.; Barbano, F.; Brattich, E.; Pulvirenti, B. The Multiple-Scale Nature of Urban Heat Island and Its Footprint on Air Quality in Real Urban Environment. Atmosphere 2020, 11, 1186. [Google Scholar] [CrossRef]
- Jeanjean, A.P.R.; Buccolieri, R.; Eddy, J.; Monks, P.S.; Leigh, R.J. Air quality affected by trees in real street canyons: The case of Marylebone neighbourhood in central London. Urban For. Urban Green 2017, 22, 41–53. [Google Scholar] [CrossRef]
- Abhijith, K.V.; Kumar, P.; Gallagher, J.; McNabola, A.; Baldauf, R.; Pilla, F.; Broderick, B.; Di Sabatino, S.; Pulvirenti, B. Air pollution abatement performances of green infrastructure in open road and built-up street canyon environments—A review. Atmos. Environ. 2017, 162, 71–86. [Google Scholar] [CrossRef]
- Tomson, M.; Kumar, P.; Barwise, Y.; Perez, P.; Forehead, H.; French, K.; Morawska, L.; Watts, J.F. Green infrastructure for air quality improvement in street canyons. Environ. Int. 2021, 146, 106288. [Google Scholar] [CrossRef]
- Nadgorska-Socha, A.; Kandziora-Ciupa, M.; Trzęsicki, M.; Barczyk, G. Air pollution tolerance index and heavy metal bioaccumulation in selected plant species from urban biotopes. Chemosphere 2017, 183, 471–482. [Google Scholar] [CrossRef]
- Sadia, H.E.; Jeba, F.; Uddin, M.Z.; Salam, A. Sensitivity study of plant species due to traffic emitted air pollutants (NO2 and PM2.5) during different seasons in Dhaka, Bangladesh. SN Appl. Sci. 2019, 1, 1377. [Google Scholar] [CrossRef] [Green Version]
- Anake, W.U.; Bayode, F.O.; Omonhinmin, C.A.; Williams, A.B. Ambient air Pollution Control using Air Pollution Tolerance Index and Anticipated Performance Index of Trees. Int. J. Civ. Eng. 2018, 9, 417–425. [Google Scholar]
- Singh, S.K.; Rao, D.N. Evaluation of plants for their tolerance to air pollution. In Proceedings of the Symposium on Air Pollution Control, New Delhi, India, 23–25 November 1983; pp. 218–224. [Google Scholar]
- Correa-Ochoa, M.; Mejia-Sepulveda, J.; Saldarriaga-Molina, J.; Castro-Jiménez, C.; Aguiar-Gil, D. Evaluation of air pollution tolerance index and anticipated performance index of six plant species, in an urban tropical valley: Medellin, Colombia. Environ. Sci. Pollut. Res. Int. 2021, 29, 7952–7971. [Google Scholar] [CrossRef] [PubMed]
- Ghafari, S.; Kaviani, B.; Sedaghathoor, S.; Allahyari, M.S. Assessment of air pollution tolerance index (APTI) for some ornamental woody species in green space of humid temperate region (Rasht, Iran). Environ. Dev. Sustain. 2020, 23, 1579–1600. [Google Scholar] [CrossRef]
- Bandara, W.A.R.T.W.; Dissanayake, C.T.M. Most tolerant roadside tree species for urban settings in humid tropics based on Air Pollution Tolerance Index. Urban Clim 2021, 37, 100848. [Google Scholar] [CrossRef]
- Bui, H.T.; Odsuren, U.; Kwon, K.J.; Kim, S.Y.; Yang, J.C.; Jeong, N.R.; Park, B.J. Assessment of Air Pollution Tolerance and Particulate Matter Accumulation of 11 Woody Plant Species. Atmosphere 2021, 12, 1067. [Google Scholar] [CrossRef]
- Sarkar, S.; Mondal, K.; Sanyal, S.; Chakrabarty, M. Study of biochemical factors in assessing air pollution tolerance index of selected plant species in and around Durgapur industrial belt, India. Environ. Monit. Assess. 2021, 193, 474. [Google Scholar] [CrossRef]
- Irshad, M.A.; Nawaz, R.; Ahmad, S.; Arshad, M.; Rizwan, M.; Ahmad, N. Evaluation of anticipated performance index of tree species for air pollution mitigation in Islamabad, Pakistan. JASEM 2020, 23, 50–59. [Google Scholar] [CrossRef]
- Karmakar, D.; Padhy, P.K. Air pollution tolerance, anticipated performance, and metal accumulation indices of plant species for green-belt development in urban industrial area. Chemosphere 2019, 237, 124522. [Google Scholar] [CrossRef]
- Molnár, V.E.; Simon, E.; Tóthmérész, B.; Ninsawat, S.; Szabó, S. Air pollution induced vegetation stress–The Air Pollution Tolerance Index as a quick tool for city health evaluation. Ecol. Indic. 2020, 113, 106234. [Google Scholar] [CrossRef]
- Pandey, A.K.; Pandey, M.; Mishra, A.; Tiwary, S.M.; Tripathib, B.D. Air pollution tolerance index and anticipated performance index of some plant species for development of urban forest. Urban For. Urban Green 2015, 14, 866–871. [Google Scholar] [CrossRef]
- Roy, A.; Bhattacharya, T.; Kumari, M. Air pollution tolerance, metal accumulation and dust capturing capacity of common tropical trees in commercial and industrial sites. Sci. Total Environ. 2020, 722, 137622. [Google Scholar] [CrossRef]
- Dominici, F.; Sheppard, L.; Clyde, M. Health effects of air pollution: A statistical review. Int. Stat. Rev. 2003, 71, 243–276. [Google Scholar] [CrossRef]
- Ibe, F.C.; Opara, A.I.; Duru, C.E.; Obinna, I.B.; Enedoh, M.C. Statistical analysis of atmospheric pollutant concentrations in parts of Imo State, Southeastern Nigeria. Sci. Afr. 2020, 7, e00237. [Google Scholar] [CrossRef]
- Alotaibi, M.D.; Alharbi, B.H.; Al-Shamsi, M.A.; Alshahrani, T.S.; Al-Namazi, A.A.; Alharbui, S.F.; Alotaibi, F.S.; Qian, Y. Assessing the response of five tree species to air pollution in Riyadh City, Saudi Arabia, for potential green belt application. Environ. Sci. Pollut. Res. Int. 2020, 27, 29156–29170. [Google Scholar] [CrossRef]
- Kwak, M.J.; Lee, J.K.; Park, S.; Lim, Y.J.; Kim, H.; Kim, K.N.; Je, S.M.; Park, C.R.; Woo, S.Y. Evaluation of the importance of some East Asian tree species for refinement of air quality by estimating air pollution tolerance index, anticipated Performance index, and air pollutant uptake. Sustainability 2020, 12, 3067. [Google Scholar] [CrossRef] [Green Version]
- Mukhopadhyay, S.; Dutta, R.; Dhara, A. Assessment of air pollution tolerance index of Murraya paniculata (L.) Jack in Kolkata metro city, West Bengal, India. Urban Clim. 2021, 39, 100977. [Google Scholar] [CrossRef]
- Timilsina, S.; Sudarshana., S.; Chaudhary, S.; Magar, G.T.; Munankarmi, N.N. Evaluation of air pollution tolerance index (APTI) of plants growing alongside inner ring road of Kathmandu, Nepal. Int. J. Environ. 2021, 1–16. [Google Scholar] [CrossRef]
- Khairallah, Y.; Houri, T.; Osta, B.; Romanos, D.; Haddad, G. Biomonitoring airborne pollution: A case study of “Urginea maritima” species in Bentael natural reserve—Lebanon. J. Taibah Univ. Sci. 2018, 12, 723–729. [Google Scholar] [CrossRef] [Green Version]
- UNICEF. A Discussion Paper Children’s Environment and Health in East Asia and the Pacific. United Nations Children’s Fund. Available online: https://www.unicef.org/eap/media/6731/file/Children’sEnvironmentandHealthinEastAsiaandthePacific.pdf (accessed on 16 June 2021).
- Pathak, V.; Tripathi, B.D.; Mishra, V.K. Evaluation of Anticipated Performance Index of some tree species for green belt development to mitigate traffic generated noise. Urban For. Urban Green 2011, 10, 61–66. [Google Scholar] [CrossRef]
- Prajapati, S.K.; Tripathi, B.D. Anticipated performance index of some tree species considered for green belt development in and around an urban area: A case study of Varaasi city, India. J. Environ. Manag. 2008, 88, 1343–1349. [Google Scholar] [CrossRef]
- Arnon, D.I. Copper enzymes in isolated chloroplasts: Polyphenol oxidise in Beta vulgaris. Plant. Physiol. 1949, 2, 1–15. [Google Scholar] [CrossRef] [Green Version]
- Mukherjee, A.; Agrawal, S.B.; Agrawal, M. Responses of tropical tree species to urban air pollutants: ROS/RNS formation and scavenging. Sci. Total Environ. 2020, 710, 136363. [Google Scholar] [CrossRef] [PubMed]
- Ogunkunle, C.O.; Suleiman, L.B.; Oyedeji, S.; Awotoye, O.O.; Fatoba, P.O. Assessing the air pollution tolerance index and anticipated the performance index of some tree species for biomonitoring environmental health. Agrofor. Syst. 2015, 89, 447–454. [Google Scholar] [CrossRef]
- Kashyap, R.; Sharma, R.; Uniyal, S.K. Bioindicator responses and performance of plant species along a vehicular pollution gradient in western Himalaya. Environ. Monit. Assess. 2018, 190, 302. [Google Scholar] [CrossRef] [PubMed]
- Patel, D.; Kumar, J.I.N. An Evaluation of Air Pollution Tolerance Index and Anticipated Performance Index of Some Tree Species Considered for Green Belt Development: A Case Study of Nandesari Industrial Area, Vadodara, Gujarat, India. Open J. Air Pollut. 2018, 7, 81589. [Google Scholar] [CrossRef] [Green Version]
- Jain, S.; Bhattacharya, T.; Chakraborty, S. Comparison of plant tolerance towards air pollution of rural, urban and mine sites of Jharkhand: A biochemical approach to identify air pollutant sink. In Advances in Waste Management; Kalamdhad, A., Singh, J., Dhamodharan, K., Eds.; Springer: Singapore, 2019; pp. 123–142. [Google Scholar]
- Singh, H.; Yadav, M.; Kumar, N.; Kumar, A.; Kumar, M. Assessing adaptation and mitigation potential of roadside trees under the influence of vehicular emissions: A case study of Grevillea robusta and Mangifera indica planted in an urban city of India. PLoS ONE 2020, 15, e0227380. [Google Scholar] [CrossRef] [Green Version]
- Banerjee, S.; Banerjee, A.; Palit, D.; Roy, P. Assessment of vegetation under air pollution stress in urban industrial area for greenbelt development. Int. J. Environ. Sci. Technol. 2018, 16, 5857–5870. [Google Scholar] [CrossRef]
- Sen, A.; Khan, I.; Kundu, D.; Das, K.; Datta, J.K. Ecophysiological evaluation of tree species for biomonitoring of air quality and identification of air pollution tolerant species. Environ. Monit. Assess. 2017, 189, 262. [Google Scholar] [CrossRef]
- Achakzai, K.; Khalid, S.; Adrees, M.; Bibi, A.; Ali, S.; Nawaz, R.; Rizwan, M. Air pollution tolerance index of plants around brick kilns in Rawalpindi, Pakistan. J. Environ. Manag. 2017, 190, 252–258. [Google Scholar] [CrossRef]
- Bahadoran, M.; Mortazavi, S.N.; Hajizadeh, Y. Evaluation of Anticipated Performance Index, biochemical, and physiological parameters of Cupressus arizonica Greene and Juniperus excelsa Bieb for greenbelt development and biomonitoring of air pollution. Int. J. Phytoremed. 2019, 21, 496–502. [Google Scholar] [CrossRef]
- Peng, Y.Y.; Liao, L.L.; Liu, S.; Nie, M.M.; Li, J.; Zhang, L.D.; Ma, J.F.; Chen, Z.C. Magnesium deficiency triggers SGR–mediated chlorophyll degradation for magnesium remobilization. Plant Physiol. 2019, 181, 262–275. [Google Scholar] [CrossRef] [Green Version]
- Sett, R. Responses in plants exposed to dust pollution. Hortic. Int. J. 2017, 1, 53–56. [Google Scholar] [CrossRef] [Green Version]
- Chaudhary, I.J.; Rathore, D. Dust pollution: Its removal and effect on foliage physiology of urban trees. Sustain. Cities Soc. 2019, 51, 101696. [Google Scholar] [CrossRef]
- Singh, S.K.; Rao, D.N.; Agrawal, M.; Pandey, J.; Narayan, D. Air-pollution tolerance index of plants. J. Environ. Manag. 1991, 32, 45–55. [Google Scholar] [CrossRef]
- Pathak, J.; Ahmed, H.; Singh, D.K.; Singh, P.R.; Kumar, D.; Kannaujiya, V.K.; Singh, S.P.; Sinha, R.P. Oxidative stress and antioxidant defense in plants exposed to ultraviolet radiation. In Reactive Oxygen, Nitrogen and Sulfur Species in Plants: Production, Metabolism, Signaling and Defense Mechanisms; Hasanuzzaman, M., Fotopoulos, V., Nahar, K., Fujita, M., Eds.; John Wiley & Sons, Inc.: Hoboken, NJ, USA, 2019; pp. 371–420. [Google Scholar] [CrossRef]
- Punit, S.; Rai, A. Evaluating Air Pollution Tolerance Index (APTI) of Two Plant Species from Industrial Area of Jodhpur. Int. J. Energy Environ. Sci. 2021, 6, 11–15. [Google Scholar] [CrossRef]
- Zhang, P.Q.; Liu, Y.J.; Chen, X.; Yang, Z.; Zhu, M.H.; Li, Y.P. Pollution resistance assessment of existing landscape plants on Beijing streets based on air pollution tolerance index method. Ecotoxicol. Environ. Saf. 2016, 132, 212–223. [Google Scholar] [CrossRef]
- Hatamimanesh, M.; Mortazavi, S.; Solgi, E.; Mohtadi, A. Assessment of Tolerance of Some Tree Species to Air Contamination Using Air Pollution Tolerance and Anticipated Performance Indices in Isfahan City, Iran. J. Adv. Environ. Health Res. 2021, 9, 31–44. [Google Scholar] [CrossRef]
- Torbati, S.; Kangarloei, A.B.; Khataee, A. Bioconcentration of heavy metals by three plant species growing in Golmarz wetland, in northwestern Iran: The plants antioxidant responses to metal pollutions. Environ. Technol. Innov. 2021, 24, 101804. [Google Scholar] [CrossRef]
- Khalid, N.; Masood, A.; Noman, A.; Aqeel, M.; Qasim, M. Study of the responses of two biomonitor plant species (Datura alba & Ricinus communis) to roadside air pollution. Chemosphere 2019, 235, 832–841. [Google Scholar]
- Rai, P.K. Particulate matter tolerance of plants (APTI and API) in a biodiversity hotspot located in a tropical region: Implications for eco-control. Part. Sci. Technol. 2019, 38, 193–202. [Google Scholar] [CrossRef]
- Uka, U.N.; Belford, E.J.D.; Hogarh, J.N. Roadside air pollution in a tropical city: Physiological and biochemical response from trees. Bull. Natl. Res. Cent. 2019, 43, 90. [Google Scholar] [CrossRef] [Green Version]
- Aasawari, A.T.; Umesh, B.K. Assessment of air pollution tolerance index of plants a comparative study. Int. J. Pharm. Pharm. Sci. 2017, 9, 83–89. [Google Scholar]
- Sahu, C.; Basti, S.; Sahu, S.K. Air pollution tolerance index (APTI) and expected performance index (EPI) of trees in sambalpur town of India. SN Appl. Sci. 2020, 2, 1327. [Google Scholar] [CrossRef]
- Acharya, S.; Jena, R.C.; Das, S.J.; Pradhan, C.; Chand, P.K. Assessment of air pollution tolerance index of some selected roadside plants of Bhubaneswar city of Odisha State in India. J. Environ. Biol. 2017, 38, 1397. [Google Scholar] [CrossRef]
- Kour, N.; Adak, P. A Review on the Effects of Environmental Factors on Plants Tolerance to Air Pollution. J. Environ. Treat. Tech. 2021, 9, 839–848. [Google Scholar]
- Simon, E.; Molnár, V.É.; Lajtos, D.; Bibi, D.; Tóthmérész, B.; Szabó, S. Usefulness of Tree Species as Urban Health Indicators. Plants 2021, 10, 2797. [Google Scholar] [CrossRef] [PubMed]
- Amin, S.A.; Meganid, A.S.; Emam, M.H.; Al-Zahrani, A.A. The Tolerance Index for Different Growing Tree Plant Species in Jubail Industrial City, a Polluted Area, KSA. Biomed. J. Sci. Tech. Res. 2021, 36, 28957–28965. [Google Scholar] [CrossRef]
- Leghari, S.K.; Akbar, A.; Qasim, S.; Ullah, S.; Asrar, M.; Rohail, H.; Ahmed, S.; Mehmood, K.; Ali, I. Estimating Anticipated Performance Index and Air Pollution Tolerance Index of Some Trees and Ornamental Plant Species for the Construction of Green Belts. Pol. J. Environ. Stud. 2019, 28, 1759–1769. [Google Scholar] [CrossRef]

| Ota Industrial Estate (ILO) | Non-Industrial Community (NIC) | ||
|---|---|---|---|
| Botanical Name | Common Names | Botanical Name | Common Names |
| Terminalia catappa | Almond | Citrus sinensis | Orange |
| Syzygium malaccense | Malay apple | Mangifera indica | Mango |
| Anacardium occidentale | Cashew | Mussaenda erythrophylla | Tropical Dogwood |
| Theobroma cacao | Cocoa | Ficus auriculata | Roxburgh Fig |
| Site Code | Taxon | A (mg/g) | T (mg/g) | P | R (%) | APTI |
|---|---|---|---|---|---|---|
| ILO | Terminalia catappa | 0.22 | 1.49 | 5.41 | 71.00 | 7.25 |
| Syzygium malaccense | 0.38 | 1.09 | 2.88 | 90.80 | 9.23 | |
| Anacardium occidentale | 1.80 | 2.93 | 3.80 | 98.90 | 11.10 | |
| Theobroma cacao | 1.86 | 1.56 | 5.96 | 78.80 | 9.28 | |
| NIC | Citrus sinensis | 2.89 | 1.03 | 5.72 | 42.30 | 6.18 |
| Mangifera indica | 1.81 | 1.57 | 4.92 | 84.4 | 9.61 | |
| Mussaenda erythrophylla | 1.80 | 1.18 | 5.15 | 69.50 | 8.09 | |
| Ficus auriculata | 0.72 | 2.25 | 4.53 | 19.30 | 2.42 |
| Site Code | Taxon | APTI | Tree Habit | Canopy Structure | Type of Tree | Laminar | Economic Importance | Hardiness | Grade Allotted | |
|---|---|---|---|---|---|---|---|---|---|---|
| Texture | Size | Total Plus (+) | ||||||||
| ILO | Terminalia catappa | - | ++ | ++ | - | - | + | ++ | + | 8 |
| Syzygium malaccense | + | ++ | ++ | + | + | ++ | ++ | + | 12 | |
| Anacardium occidentale | + | + | + | + | + | - | ++ | + | 8 | |
| Theobroma cacao | + | + | + | + | - | ++ | + | + | 8 | |
| NIC | Citrus sinensis | - | + | ++ | + | - | - | - | + | 5 |
| Mangifera indica | + | ++ | ++ | + | ++ | + | ++ | + | 12 | |
| Mussaenda erythrophylla | + | - | - | + | + | + | - | - | 4 | |
| Ficus auriculata | - | + | ++ | + | + | ++ | + | + | 9 | |
| Site Code | Taxon | Grade Allotted | Scoring | API Value | Assessment |
|---|---|---|---|---|---|
| Total Plus (+) | Percentage (%) | ||||
| ILO | Terminalia catappa | 8 | 50 | 2 | Poor |
| Syzygium malaccense | 12 | 75 | 5 | Very good | |
| Anacardium occidentale | 8 | 50 | 2 | Poor | |
| Theobroma cacao | 8 | 50 | 2 | Poor | |
| NIC | Citrus sinensis | 5 | 31.25 | 1 | Very poor |
| Mangifera indica | 12 | 75 | 5 | Very good | |
| Mussaenda erythrophylla | 4 | 25 | 0 | Not recommended | |
| Ficus auriculata | 9 | 56.25 | 3 | Moderate |
| Location | Study Site | Range of APTI Value | No of Sampled Plants | Most Tolerant Species (Season) | Most Sensitive Species (Season) [Chamber Exposure Experiment] | API Performance Plants (Scores) | References |
|---|---|---|---|---|---|---|---|
| Jharkhand, India | Industrial | 11.42 to 21.28 (M); 11.79 to 28.62 (P) | 9 | Mangifera indica (M) Azadirachta indica (P) | Tectona grandis (M) & (P) | Mangifera indica (E) Ficus bengalensis(VG) Azadirachta indica (G) Ficus religiosa (G) | [36] |
| Da˛browa Gornicza city, Poland | Industrial | 8.43–46.61 | 4 | Taraxacum officinale | Plantago lanceolata | - | [5] |
| Jubail city, Saudi Arabia | Industrial | 5.676 to 8.803 | 8 | - | Parkinsonia aculeata | - | [75] |
| Isfahan City, Iran | Industrial | 14.43 to 20.27 | 3 | Morus nigra | Ailanthus altissima | Morus nigra (E); Platanus orientalis(VG) | [65] |
| Cheongju city, South Korea. | Chungbuk National University (CBNU) | 7.11 to 9.52. | 11 | - | Cercis chinensis | Pinus densiflora (G) | [30] |
| Santiniketan, West Bengal, India | Non industrial & Semi Urban | 9.53–23.90 | 18 | Mangifera indica, Peltophorum pterocarpum; Ficus benghalensis; Polyalthia longifolia; Saraca asoca | Ziziphus mauritiana Lam. | Mangifera indica,(B) Polyalthia longifolia; Saraca asoca; Ficus benghalensis (E) | [19] |
| Ilorin, Nigeria | University of Ilorin, | 7.80 to 12.30 | 4 | Terminalia catappa | Vitellaria paradoxa | Vitellaria paradoxa (G) | [49] |
| Seoul, Korea | University of Seoul. | 7.0 to 9.0 (T); 7.5 to 8.7(C) | 6 | - | Ginkgo biloba [T]; Chionanthus retusus [C] | Pinus densiflora (G); Prunus × yedoensis (G). | [40] |
| Ado-Odo Ota, Ogun State, Nigeria. | Industrial & Non industrial, (Canaanland) | 7.25 to 11.10 2.42 to 9.61 | 8 | - - | Terminalia catappa Ficus auriculata | Syzygium malaccense (VG) Mangifera indica (VG) Ficus auriculata (G | Present study |
| Model | Sum of Squares | df | Mean Square | F | Sig. |
|---|---|---|---|---|---|
| Regression | 50.269 | 4 | 12.567 | 2407.230 | 0.0001 |
| Residual | 0.016 | 3 | 0.005 | ||
| Total | 50.285 | 7 |
| Model | Unstandardized Coefficients | Standardized Coefficients | t | Sig. | |
|---|---|---|---|---|---|
| B | Std. Error | Beta | |||
| −0.406 | 0.217 | −1.877 | 0.157 | ||
| pH of leaf extract | 0.062 | 0.034 | 0.024 | 1.851 | 0.161 |
| Total chlorophyll content (mg/g) | 0.053 | 0.044 | 0.013 | 1.208 | 0.314 |
| Relative water content (%) | 0.100 | 0.001 | 0.989 | 89.606 | 0.000 |
| Ascorbic acid content (mg/g) | 0.665 | 0.035 | 0.226 | 19.274 | 0.000 |
| Source | Type III Sum of Squares | df | Mean Square | F | Sig. |
|---|---|---|---|---|---|
| Model | 39,919.110 a | 11 | 3629.010 | 20.537 | 0.000 |
| Taxon | 1194.027 | 7 | 170.575 | 0.965 | 0.481 |
| BioParameter | 26,791.888 | 3 | 8930.629 | 50.541 | 0.000 |
| Error | 3710.749 | 21 | 176.702 | ||
| Total | 43,629.859 | 32 |
Publisher’s Note: MDPI stays neutral with regard to jurisdictional claims in published maps and institutional affiliations. |
© 2022 by the authors. Licensee MDPI, Basel, Switzerland. This article is an open access article distributed under the terms and conditions of the Creative Commons Attribution (CC BY) license (https://creativecommons.org/licenses/by/4.0/).
Share and Cite
Anake, W.U.; Bayode, F.O.; Jonathan, H.O.; Omonhinmin, C.A.; Odetunmibi, O.A.; Anake, T.A. Screening of Plant Species Response and Performance for Green Belt Development: Implications for Semi-Urban Ecosystem Restoration. Sustainability 2022, 14, 3968. https://doi.org/10.3390/su14073968
Anake WU, Bayode FO, Jonathan HO, Omonhinmin CA, Odetunmibi OA, Anake TA. Screening of Plant Species Response and Performance for Green Belt Development: Implications for Semi-Urban Ecosystem Restoration. Sustainability. 2022; 14(7):3968. https://doi.org/10.3390/su14073968
Chicago/Turabian StyleAnake, Winifred U., Faith O. Bayode, Hassana O. Jonathan, Conrad A. Omonhinmin, Oluwole A. Odetunmibi, and Timothy A. Anake. 2022. "Screening of Plant Species Response and Performance for Green Belt Development: Implications for Semi-Urban Ecosystem Restoration" Sustainability 14, no. 7: 3968. https://doi.org/10.3390/su14073968
APA StyleAnake, W. U., Bayode, F. O., Jonathan, H. O., Omonhinmin, C. A., Odetunmibi, O. A., & Anake, T. A. (2022). Screening of Plant Species Response and Performance for Green Belt Development: Implications for Semi-Urban Ecosystem Restoration. Sustainability, 14(7), 3968. https://doi.org/10.3390/su14073968