1. Introduction
The 2030 Agenda for Sustainable Development, adopted in 2015, designed the framework for the peace, prosperity, and well-being of the citizens of the present and of the future. The sustainable development goals represent actions that need to be implemented by all countries through global cooperation and coordination [
1]. The capacity-building process to achieve the 17 goals of sustainable development is the challenge for many countries. The European Union (EU) has been a leader in developing the policies to combat climate change, and especially so after the Paris Agreement (2015) when European climate diplomacy proved its abilities and encouraged European leadership to review the emission reduction targets, renewable targets, and energy efficiency targets [
2]. The Green Deal (GD) strategy, presented by the European Commission in 2019, was the strategic plan of actions of the EU for the “climate emergency” and the answer of Brussels’ administration to the environmental activists (for example, Greta Thunberg—Strike for Climate) and non-governmental organizations (NGOs) in the field, who were asking for immediate actions in the field of climate change. So, the European institutions (including the Council of Europe) took initiatives and generated the institutional context for dialogue and consultations with environmental activists in order to improve the legislation in the field [
3]. Some of the outcomes are the Green Deal strategy and the subsequent legislative documents elaborated by the European Commission in order to respond to the requests of European citizens, expressed through activists and NGOs from the environmental field (WWF Europe, Climate Action Network Europe, Friends of the Earth Europe, BirdLife Europe, and Slow Food) [
4].
The growing concerns about climate change in Europe are reflected in the electoral support for the green parties in European elections from 2019 and at national levels, especially in western Member States (for example, Germany in 2021). Environmental and climate change policies are the core policies of sustainable development that design Europe’s future and its transformative policies and green transition. The transition to a circular economy and low-carbon development will help to increase the quality of life of European citizens.
The Green Deal was launched almost three years ago, in December 2019, aiming to transform the EU into a modern, competitive and efficient economy, in terms of resources’ use, in which: (a) they will achieve zero net greenhouse gas emissions by 2050; (b) economic growth should be dissociated from the use of resources; and (c) no person or place should be left behind. It is the lifeline for a way out of the COVID-19 pandemic, financed with a third of the €1.8 trillion investment from the Next Generation EU Recovery Plan, as well as funds from the EU’s seven-year budget [
5]. This growth strategy was elaborated for the implementation of the United Nation’s 2030 Agenda and other sustainable development goals of the current European Commission. The key issues that it addresses are: the energy transition (clean energy sources), changes in industry (circular economy models), energy efficiency of buildings, organic food systems, regions that will need increased support for the transition (mining, those where agriculture is affected by climate change, etc.), and the fair transition fund [
6]. By applying this strategy, four sustainable benefits will be achieved: health, quality of life, resilience and competitiveness [
6]. The key actions of this strategy correspond to such European policies as: climate ambition (the Climate Policy), clean, affordable and secure energy (the Energy Policy), an industrial strategy for a clean and circular economy (the Industrial Policy), sustainable and smart mobility (the Transport Policy), greening the Common Agricultural Policy/‘Farm to Fork’ Strategy (the Common Agriculture Policy), preserving and protecting biodiversity (the Environmental Policy), ambition towards zero-pollution for a toxic free environment (the Environmental Policy) and mainstreaming sustainability in all EU policies (to address the integrated character between European policies), the EU as a global leader (the Common Foreign and Security Policy), and working together—a European Climate Pact (as the final juridical outcome) [
6]. It is an ambitious project which tries to put the EU in a leading position in the field of climate change [
6].
The EU continues to fight against climate change and make environmental policy a priority, and the GD strategy offers the guidelines for Member States to use for its implementation. There are important courses of action that the GD is following which will guide capacity building: (1) environment and climate—“no net emissions of greenhouse gases by 2050”; (2) economic—“economic growth decoupled from resource use”; and (3) social—“no person and no place left behind” [
7]. For the legislative dimension of capacity building, several important documents were elaborated by the Commission, expressing their will for the implementation of their ambitious goals: the European Climate Pact, the European Climate Law, the New EU Strategy on Adaptation to Climate Change, the European Industrial Strategy, the Circular Economy Action Plan, the Farm to Fork Strategy, the EU Biodiversity Strategy for 2030, EU strategies for energy system integration and hydrogen, and “Fit for 55”. All these documents were following the European policies circumscribed by the GD, such as the Climate Policy, Environmental Policy, Energy Policy, Industrial Policy, Transport Policy, Common Agricultural Policy and the Common Foreign and Security Policy [
8].
The GD requires the elaboration of new transformative policies and national solutions for the implementation by Member States (MS). It addresses all sectors of activity which generate greenhouse gas emissions, such as: the transformation of carbon-intensive industries; increasing the circular economy, digitalization; energy; and biodiversity and biomaterials with their impact on agriculture and climate change policies [
9]. There are two important dimensions to the policies that have to be followed in order to reach the climate neutrality objective, the climate and the economic [
10], and also the supporting technologies that will take into consideration the cooperation, collaboration, and competitiveness of state-actors [
10].
An important dimension of the GD’s implementation is the European Common Foreign and Security Policy (CFSP); since climate change issues are transboundary, due to the global and regional interdependencies, the problems have to be dealt with globally and regionally [
6]. The responses and actions to climate change are debated at an international level, both at the EU and UN. Climate change will also transform the security environment and it could be tackled by international cooperation [
11,
12]. The decisions of the European institutions (the European Council, the Council of European Union and the European Commission) proved the holistic approach of the Green Deal and their political will to implement it. The role of the European Council and the Council of the EU in the Green Deal is to provide political guidance on the EU’s policies (and the commitment to become climate neutral by 2050, which leaders endorsed in the strategic agenda and reaffirmed in December 2019). The European Commission submitted the proposal and initiatives under the Green Deal to the Council of the EU and to the European Parliament. All European policies related to the climate-neutrality objective of the Green Deal will be reviewed and revised in line with the increased climate ambition (for example, the existing legislation on greenhouse gas emissions, renewable energy and energy efficiency) [
13]. All MS expressed their political commitment to the GD’s implementation, including climate policy objectives, but there are some voices of epistemic communities which recently raised several questions for researches on the social impact and sustainable solutions for the GD’s implementation [
12]. These voices are mainly from the central region of the EU and have pertinent questions regarding the capacity building and the GD’s implementation capacity [
12]. The social impact of the GD’s implementation in MS from central Europe will have effects on the well-being of European citizens, so the sustainable policies will have to be designed at a national level and particular regional transformative policies (transversal and sectoral) for each MS, including regional cooperation and collaboration, will need to be taken into consideration [
6].
The sustainability policy aims to create the framework, principles and capacities to exist and to develop without depleting natural resources for the future [
14]. The United Nations defined sustainability as a development which responds to present needs, without compromising the next generations’ capacities to meet their own needs. It assumes that the resources are limited and, therefore, should be used carefully, assuring that they are sufficient for future generations without diminishing the quality of life of present generations [
14]. The sustainability policy implies social responsibility, focusing on environmental protection and the dynamic balance between human and natural systems. There are three important principles of the sustainability policy: (a) environment protection—it refers to the reduction of CO
2 emissions, water usage, packaging and wasteful processes as part of a supply chain; (b) social development—which aims to ensure the responsible, ethical and sustainable treatment of employees, stakeholders and the community in which they are living; and (c) economic development—in the sense of generated profitability and sufficient income to be continued in the future [
14]. Its objectives are the UN’s sustainable development goals: (1) no poverty; (2) zero hunger; (3) good health and well-being; (4) quality education; (5) gender equality; (6) clean water and sanitation; (7) affordable and clean energy; (8) decent work and economic growth; (9) industry, innovation and infrastructure; (10) reduced inequalities; (11) sustainable cities and communities; (12) responsible consumption and production; (13) climate action; (14) life below water; (15) life on land; (16) peace, justice and strong institutions; and (17) partnerships for the goals [
1]. These objectives could be achieved by following six key transformations: (1) improving education and healthcare to achieve higher incomes and better environmental decisions; (2) responsible consumption and production, doing more with fewer resources is important for adopting a circular economy and reducing demand; (3) decarbonization of the energy industry through clean energy resources and renewable processes and by providing clean and accessible energy to everyone; (4) efficient and sustainable food systems that can be achieved by increasing agricultural productivity and reducing meat consumption, which will assure clean food and water for all; (5) smart cities through intelligent infrastructure and internet connectivity; and (6) a digital revolution in science, technology and innovation, necessary for supporting sustainable development [
14]. Regarding the future implementation of the sustainability policy, it is important to reuse resources to match global population growth in a circular economy.
This paper will address the current implementation gap and will improve the literature by focusing attention on the sustainable effects of the GD’s implementation by MS from central Europe. In this way, the empirical analysis will facilitate the capacity building and a better implementation by the national and local administrations, as well as a better understanding of GD strategy. In order to reach this aim, an innovative model of analysis was designed for an integrated perspective on capacity-building and transformative policies. The model was inspired by the circular economy model [
15,
16] and green economy modeling [
17]. It will use qualitative strategy for research, with specific methods (documents’ analysis, comparative analysis, and a case study). The option for the qualitative research is coming from the specificities of policy analysis, supporting the objectivity, validity, and consistency of the research [
6]. The research material will consist of data from the Eurostat database, reports, policy briefs, and EU documents. The period of analysis is 2011–2020.
The novelty of this research consists in the new model of analysis of capacity building for the GD’s implementation. This model is based on the circular economy, taking into account the green economy, sustainability and GD policies, with an interdependent character. There are three interrelated dimensions of the model which impact the capacity building for the GD’s implementation: environmental, economic and logistical (infrastructure), which circumscribe the European policies of the GD strategy. Several indexes, that are characteristics of the European policies of the GD and their capacity-building potential, were chosen from the Eurostat database for MS from central Europe (Poland, Czech Republic, Slovakia, Hungary and Romania) and will be analyzed. From this perspective, it is the first article that analyzes the capacity building for the GD’s implementation for central Europe, on the basis of the model that this study generates. There are not many publications regarding the GD, so the present article will be a valuable contribution for the literature in the field.
The article is structured in six parts, as follows: the introductory chapter which formulates the problem and motivation of the research; the second chapter, the literature review, frames the theoretical background; the third chapter describes the methodology of the research (the type of strategy, methods of research, research questions, and hypothesis); the fourth chapter will focus on the results of the research for all investigated MS from central Europe; discussions on the findings represents the next chapter; and the study ends with the presentation of conclusions.
The research questions are: What are the main factors that favor capacity building for the GD’s implementation in central Europe? How can the ability to implement the GD by central European MS be improved?
2. Literature Review
The UN Climate Change Conference, held on November 2021, Glasgow, marked an important step forward for international cooperation and collaboration for keeping the 1.5 °C reduction objective and the other goals of the Paris Agreement. The conference ended with a Glasgow Climate Pact, agreed to by all countries present [
15]. After two weeks of intense negotiations, a consensus was reached on the actions for accelerating the fight against climate change [
10,
18,
19]. The outcomes of the Conference of the Parties COP26 emphasized the importance of the coordination of environmental and socio-economic factors and of the central elements of the COVID-19 recovery: “tackling the climate change” and “the solidarity with vulnerable groups” [
20] (p. 5):
“It also reaffirmed the continuation of key principles from the Paris Agreement and previous COPs, including multilateralism, and the importance of nature and biodiversity to climate action, as well as human rights, the rights of indigenous peoples, local communities, migrants, children, persons with disabilities and people in vulnerable situations, gender equality, empowerment of women and intergenerational equity.”
The European Green Deal represents the most ambitious strategy of the European Commission, targeting the transformation of the EU into a modern, competitive and efficient economy for becoming the first climate-neutral continent [
5]. The EC’s communication from 2019 [
6,
21] is a roadmap to be followed, which refers to the key policies, actions and measures. It was designed by taking into consideration the synergies between different policies and actions [
6,
22].
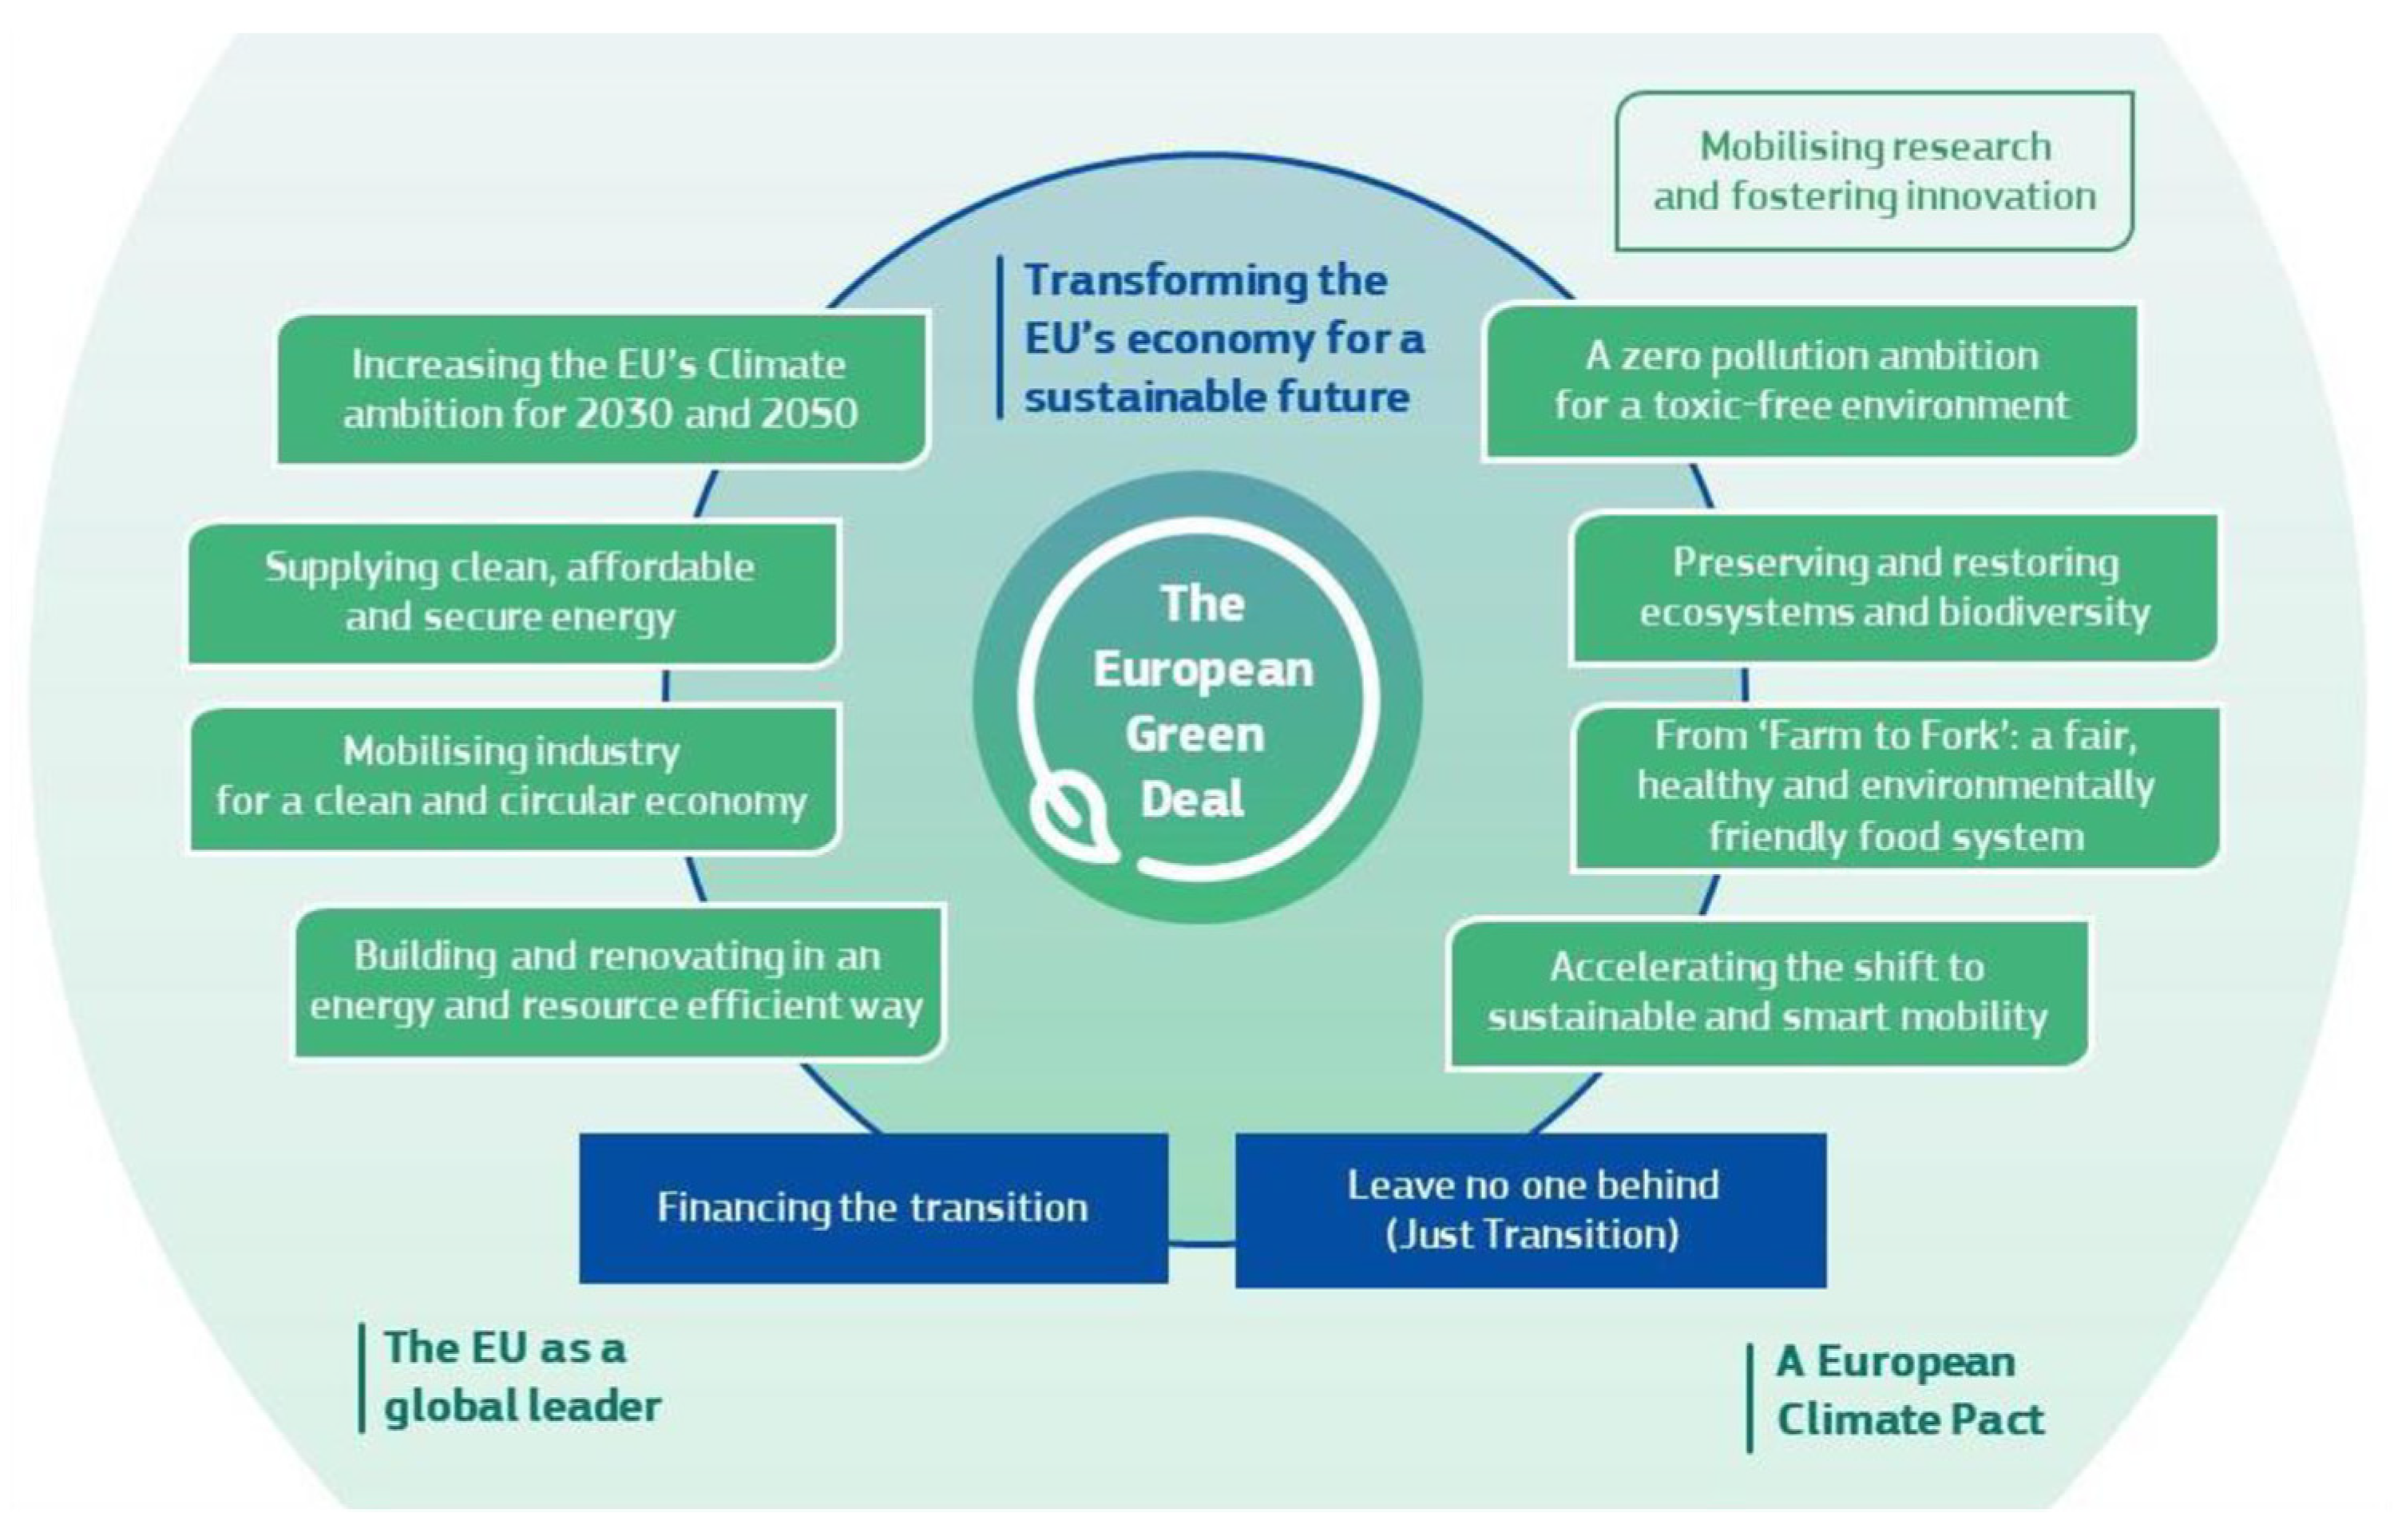
From
Figure 1 it can be seen that sustainability is the transversal element of the GD strategy and that the composing elements are central for the European policies that are represented [
6], as it was presented previously in the introductory chapter. The main benefits of this strategy aim to improve the well-being of European citizens through: fresh air, clean water, healthy soil and biodiversity; renovated and energy efficient buildings; healthy food at affordable prices; the development of public transport; cleaner energy and more innovative and ecological technologies; products with a longer life, which could be repaired, recycled and reused; job preparation for the future and training in suitable skills for transition; and a resilient, competitive industry on the world stage [
5]. The main actions of this strategy are: climate, energy, agriculture, industry, environment and oceans, transport, finance and regional development; research; and innovation [
5]. Two main initiatives derive from this strategy: the European Climate Pact and the New European Bauhaus. The first initiative aims to support communities to share and implement measures to combat climate change, and the second initiative brings a cultural and creative dimension to the GD [
5].
The fight against climate change involves several international policies: sustainable policies, environmental policies, climate policies, social policies, economic and financial policies, inclusion policies, regional development policies, agricultural policies, health policies, mobility policies, and foreign policies. It is an integrated approach, with inclusive, sustainable and individualized strategies that will find suitable solutions and efficient actions for each country with interests for achieving the common goals. This was the foundation for the GD. The GD strategy is circumscribed to the actions of the implementation of COP26′s objectives and the Paris Agreement. It also has the integrative and interdependent approach and favors individualized solutions. There are several actions that the GD should maintain in common with COP26: (1) mitigation—reducing emissions; (2) adaptation—supporting efforts for the ones impacted by climate change; (3) finance—support for countries to deliver on climate change; (4) collaboration—working together [
23].
The goals of the 2030 Agenda for Sustainable Development [
24,
25,
26] have been the central elements of the European decision-making and policy-making processes for a long time, since they provide the framework and directions of action at a global scale. These objectives will be included in the European Semester of economic governance. The EU, especially the Commission, are truly committed to achieve these goals. Sustainable development became a political priority of the Commission [
26] and the climate neutrality objective circumscribed an interdependent and inclusive approach of European policies, especially with the GD strategy. The GD will transform the European society into:
“a modern, resource-efficient and competitive economy where climate and environmental challenges are addressed and turned into opportunities, while making the transition just and inclusive for all.”
The sustainability policy, as it was mentioned previously in the introductory chapter, creates the framework of principles and capacities that exist for development without depleting natural resources in the future [
14]. The implementation of this policy will be required by all companies, institutions will have to meet their environmental responsibilities and the sustainability policy will define the commitments of ethical and environmentally friendly practices [
27]. The World Economic Forum identified several objectives of the sustainability policy: (1) promote sustainable business models and practices; (2) limit the environmental impact; (3) uphold the standards of governance; (4) maintain the health and safety of citizens; (5) foster responsibility and inclusiveness for employers and clients; and (6) positively engage with communities and stakeholders [
28]. The measures for delivering the objectives of the sustainability policy are: implementing the sustainability management system for the daily management of institutions and companies; establishing sustainable priorities that will support innovation, implementing best practice and knowledge sharing; developing multistakeholder engagement to support the opportunities provided by the leadership; and purchasing sustainable goods and services, underlying supplier diversity, fair employment and environmental attributes, and social and ethical criteria [
29].
In the framework of the sustainability policy, the next few years are important for the EU to prove its commitments to the climate objective through concrete actions with a global impact [
8]. The reduction of global emissions is the priority and the prices of energy complicate achieving the GD’s objectives. Nevertheless, the state and non-state actors (Multinational companies (MNC), NGOs and academia) expressed their commitment to tackle climate change [
20], giving the opportunity for specific adaptations at a national and local level. The green transition represents the solution for going forward and the circular economy is at the heart of designing the national and local implementation of the GD in MS. Integration and adaptation are key principles to be followed, as well as COVID-19 recovery plans, sustainable development, and also building climate resilience and correcting the finance gaps [
29,
30] between MS—all are challenges ahead.
The EU Commission delivered the “Fit for 55” package to make the green transition easier. It is composed of new legislative proposals and proposals for modifications of existing legislation which will help the EU to reduce greenhouse gas emissions by at least 55% by 2030, in comparison with the 1990 figures. This will be possible by following key actions such as: the elimination of greenhouse gas emissions through carbon absorbers, such as forests; financing a fair transition; promoting renewable energy; fostering energy efficiency; more alternative fuels and more charging stations for electric vehicles; energy taxation; carbon-based border adjustment for certain imports; and greenhouse gas emissions from all economic sectors, including industry, transport, energy, agriculture and waste [
31,
32,
33].
The EU will need to lead its transition to a carbon-neutral, resource-efficient and circular economy [
34]. However, this action means cooperation and collaboration between international actors [
35]. The Action Plan elaborated by the EC for a cleaner and a more competitive Europe requires the coordination and joint efforts of the MS in order to achieve the GD’s objectives [
36]. A regional cooperation between MS with the same characteristics in terms of economic, cultural, and social factors will support a better implementation, and will avoid duplication and a waste of resources, enhancing the coherence, complementarity and impact [
32] of the adopted national and/or local solutions. The plan aims to keep resources in economic circles as long as it is possible. The key products’ value chain is: electronics and Information Communication and Technology (ICT), batteries and vehicles, packaging, plastics, textiles and food [
35]. It also has an important international dimension for building strong partnerships with other states or regions in order to maximize the benefits of a green transition and a circular economy by using the GD’s diplomacy [
20] and future models of good practices. So, in an interdependent world, a global circular economy and a global green economy are valuable opportunities that will help reduce the environmental impact in a way that has no boundaries [
35,
37,
38].
It is seen as a circle, a “life cycle of products”, and could be interpreted as:
“a model of production and consumption which involves sharing, leasing, reusing, repairing, refurbishing and recycling existing materials and products as long as possible”
A circular economy implies the reduction of waste to a minimum and when a product reaches the end of its life, its materials are kept within the economy where it is possible to create further value [
37]. The world has to switch to a circular economy because the world’s population is growing and, consequently, so is the demand for raw materials. The quantity of raw materials is limited. The finite supply of raw materials means that some of the EU’s MS depend on other countries’ raw materials. However, extracting raw materials impacts the environment, increasing energy consumption and CO
2 emissions. A more intelligent use of raw materials can lower CO
2 emissions and measures such as eco-design, waste prevention and re-use could save EU companies’ money and reduce greenhouse gas emissions [
38].
The pathway to sustainable development is a green economy, with a circular economy being a part of it. It is based on a different economic model, and is focused on environmental and social effects, rather than GDP growth [
35]. A green economy has more facets, such as:
Environmental: the preservation of natural capital, investments in natural resources and the mitigation of climate change;
Economic: growth based on resource efficiency, sustainable consumption and production patterns;
Social: improving human beings, providing decent jobs, reducing inequalities and tackling poverty [
39].
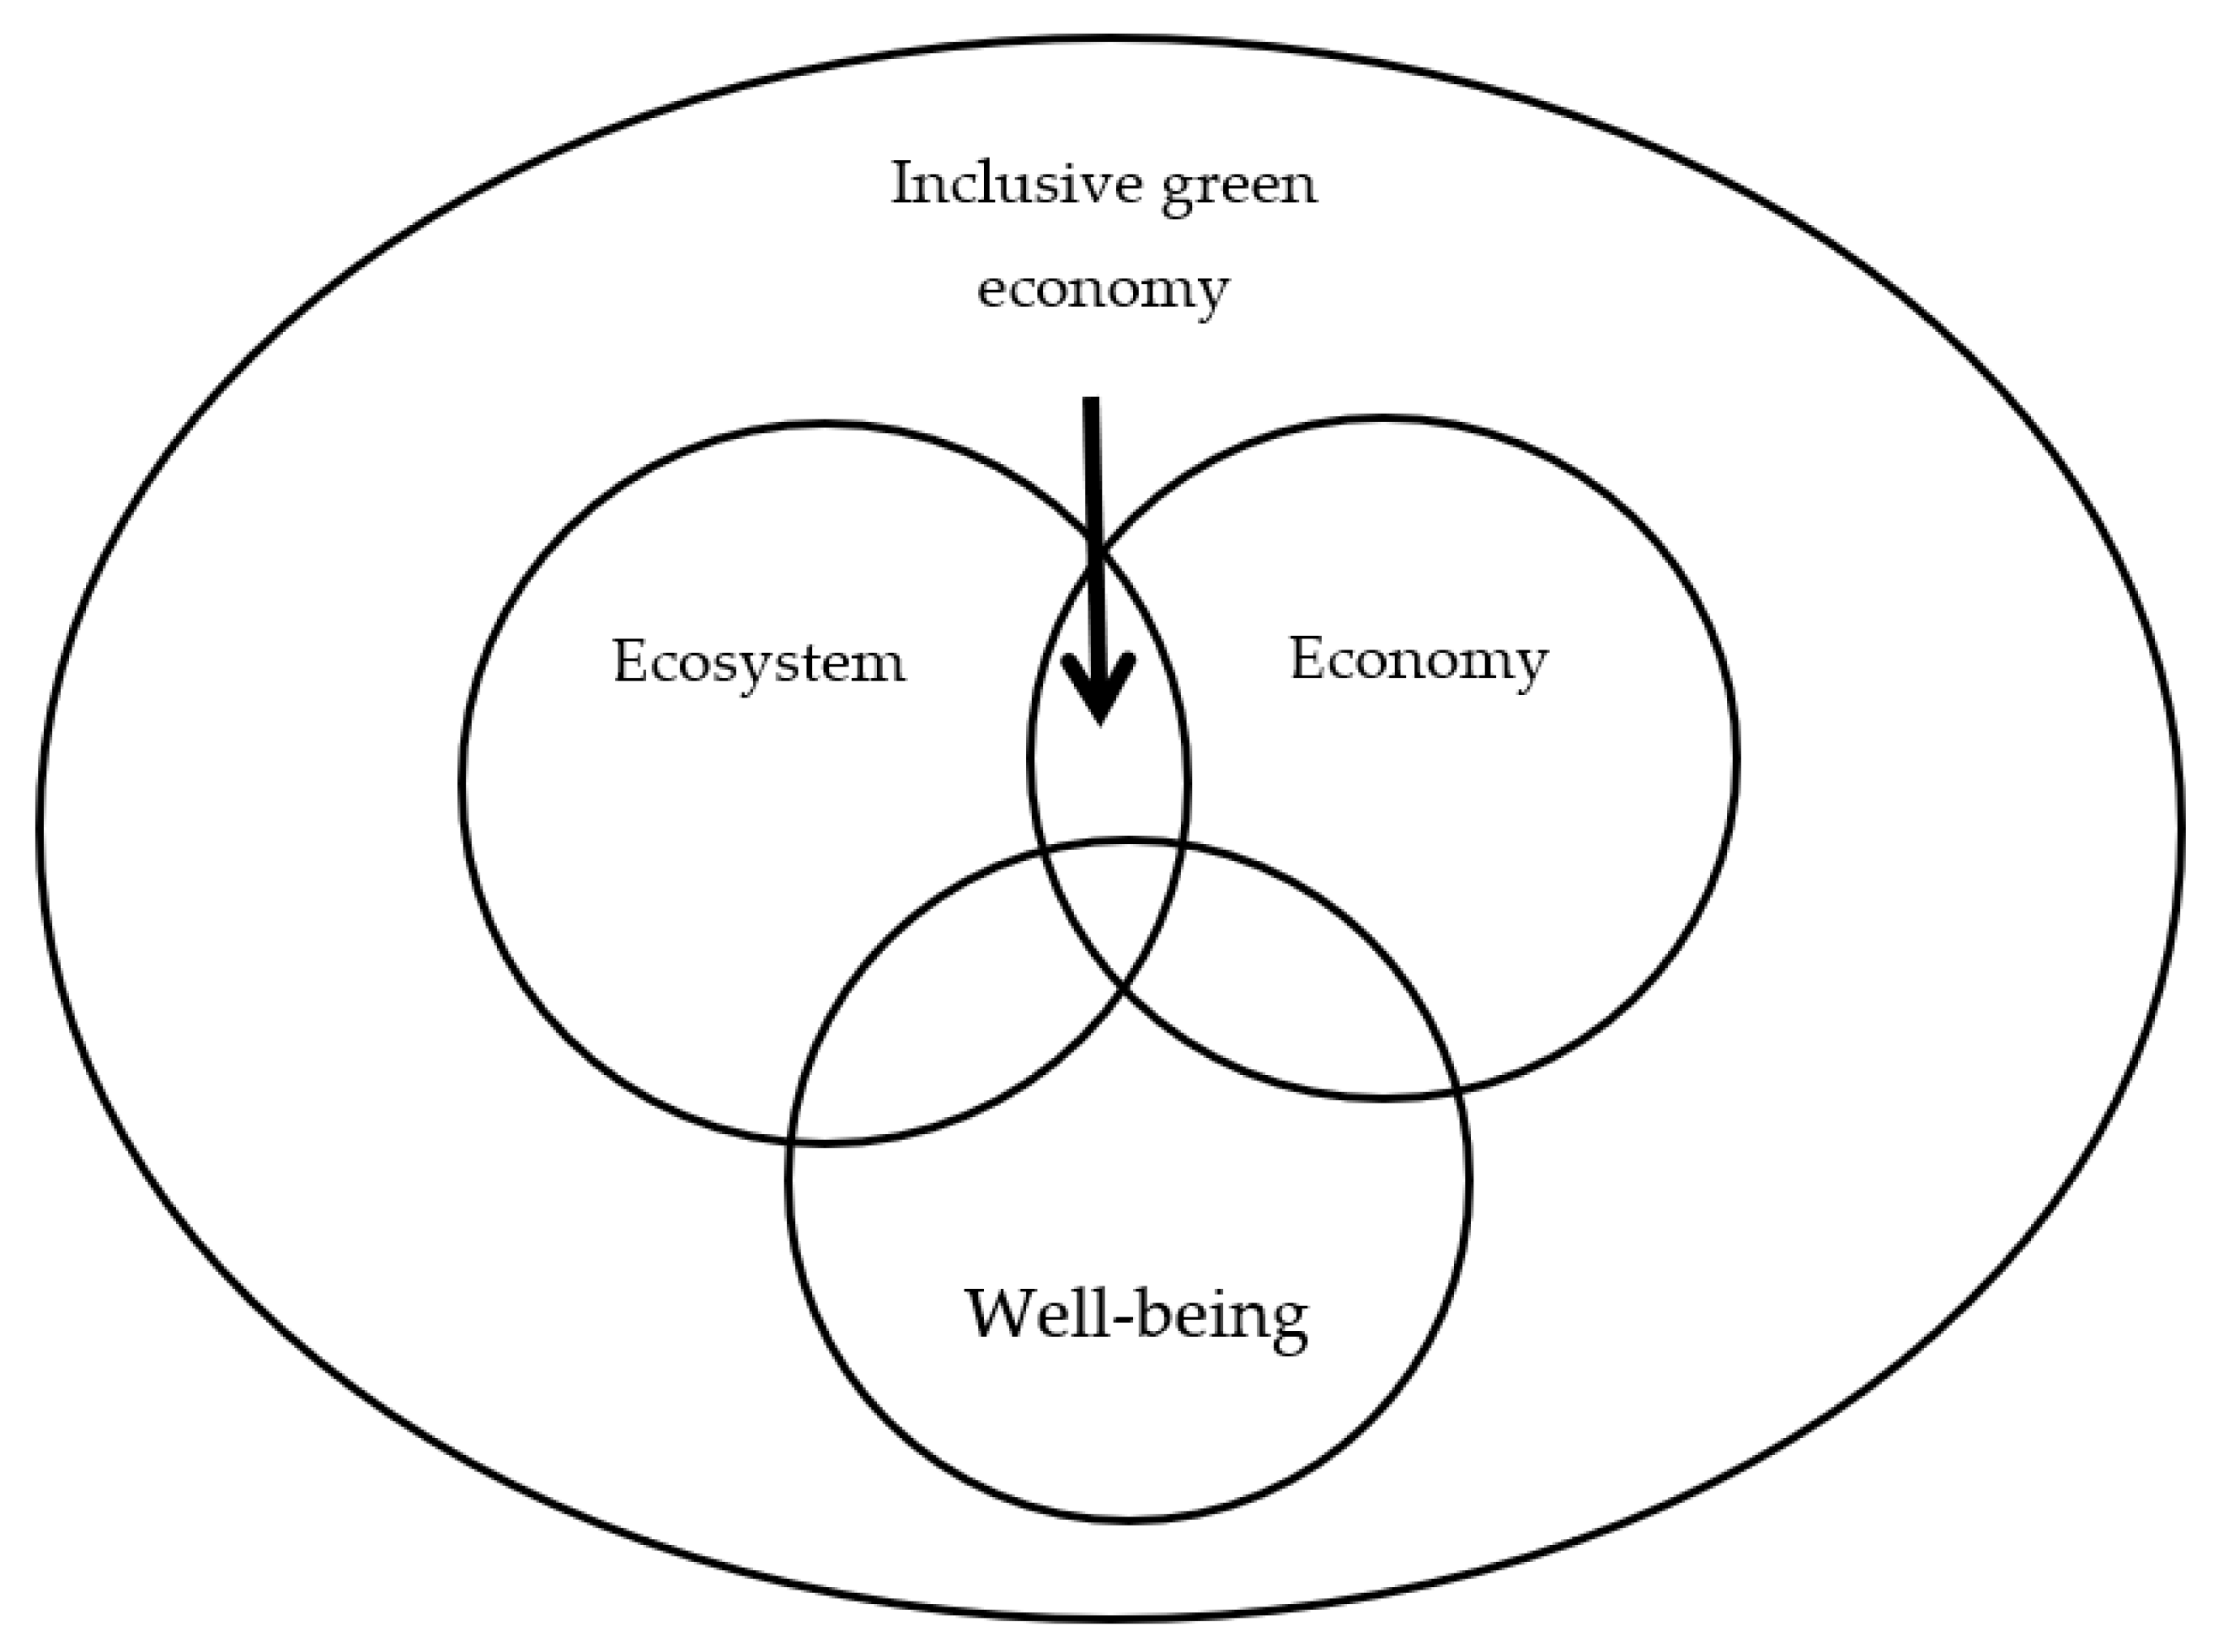
A green economy represents the holistic approach of ecosystem, economy and human well-being, as a unity between natural, produced, social and human capital, aiming to ensure ecosystem resilience, improve resource efficiency and enhance social equity and fair-burden sharing [
37]. According to the European Environment Agency, the green economy could be diagramed as follows, as
Figure 2:
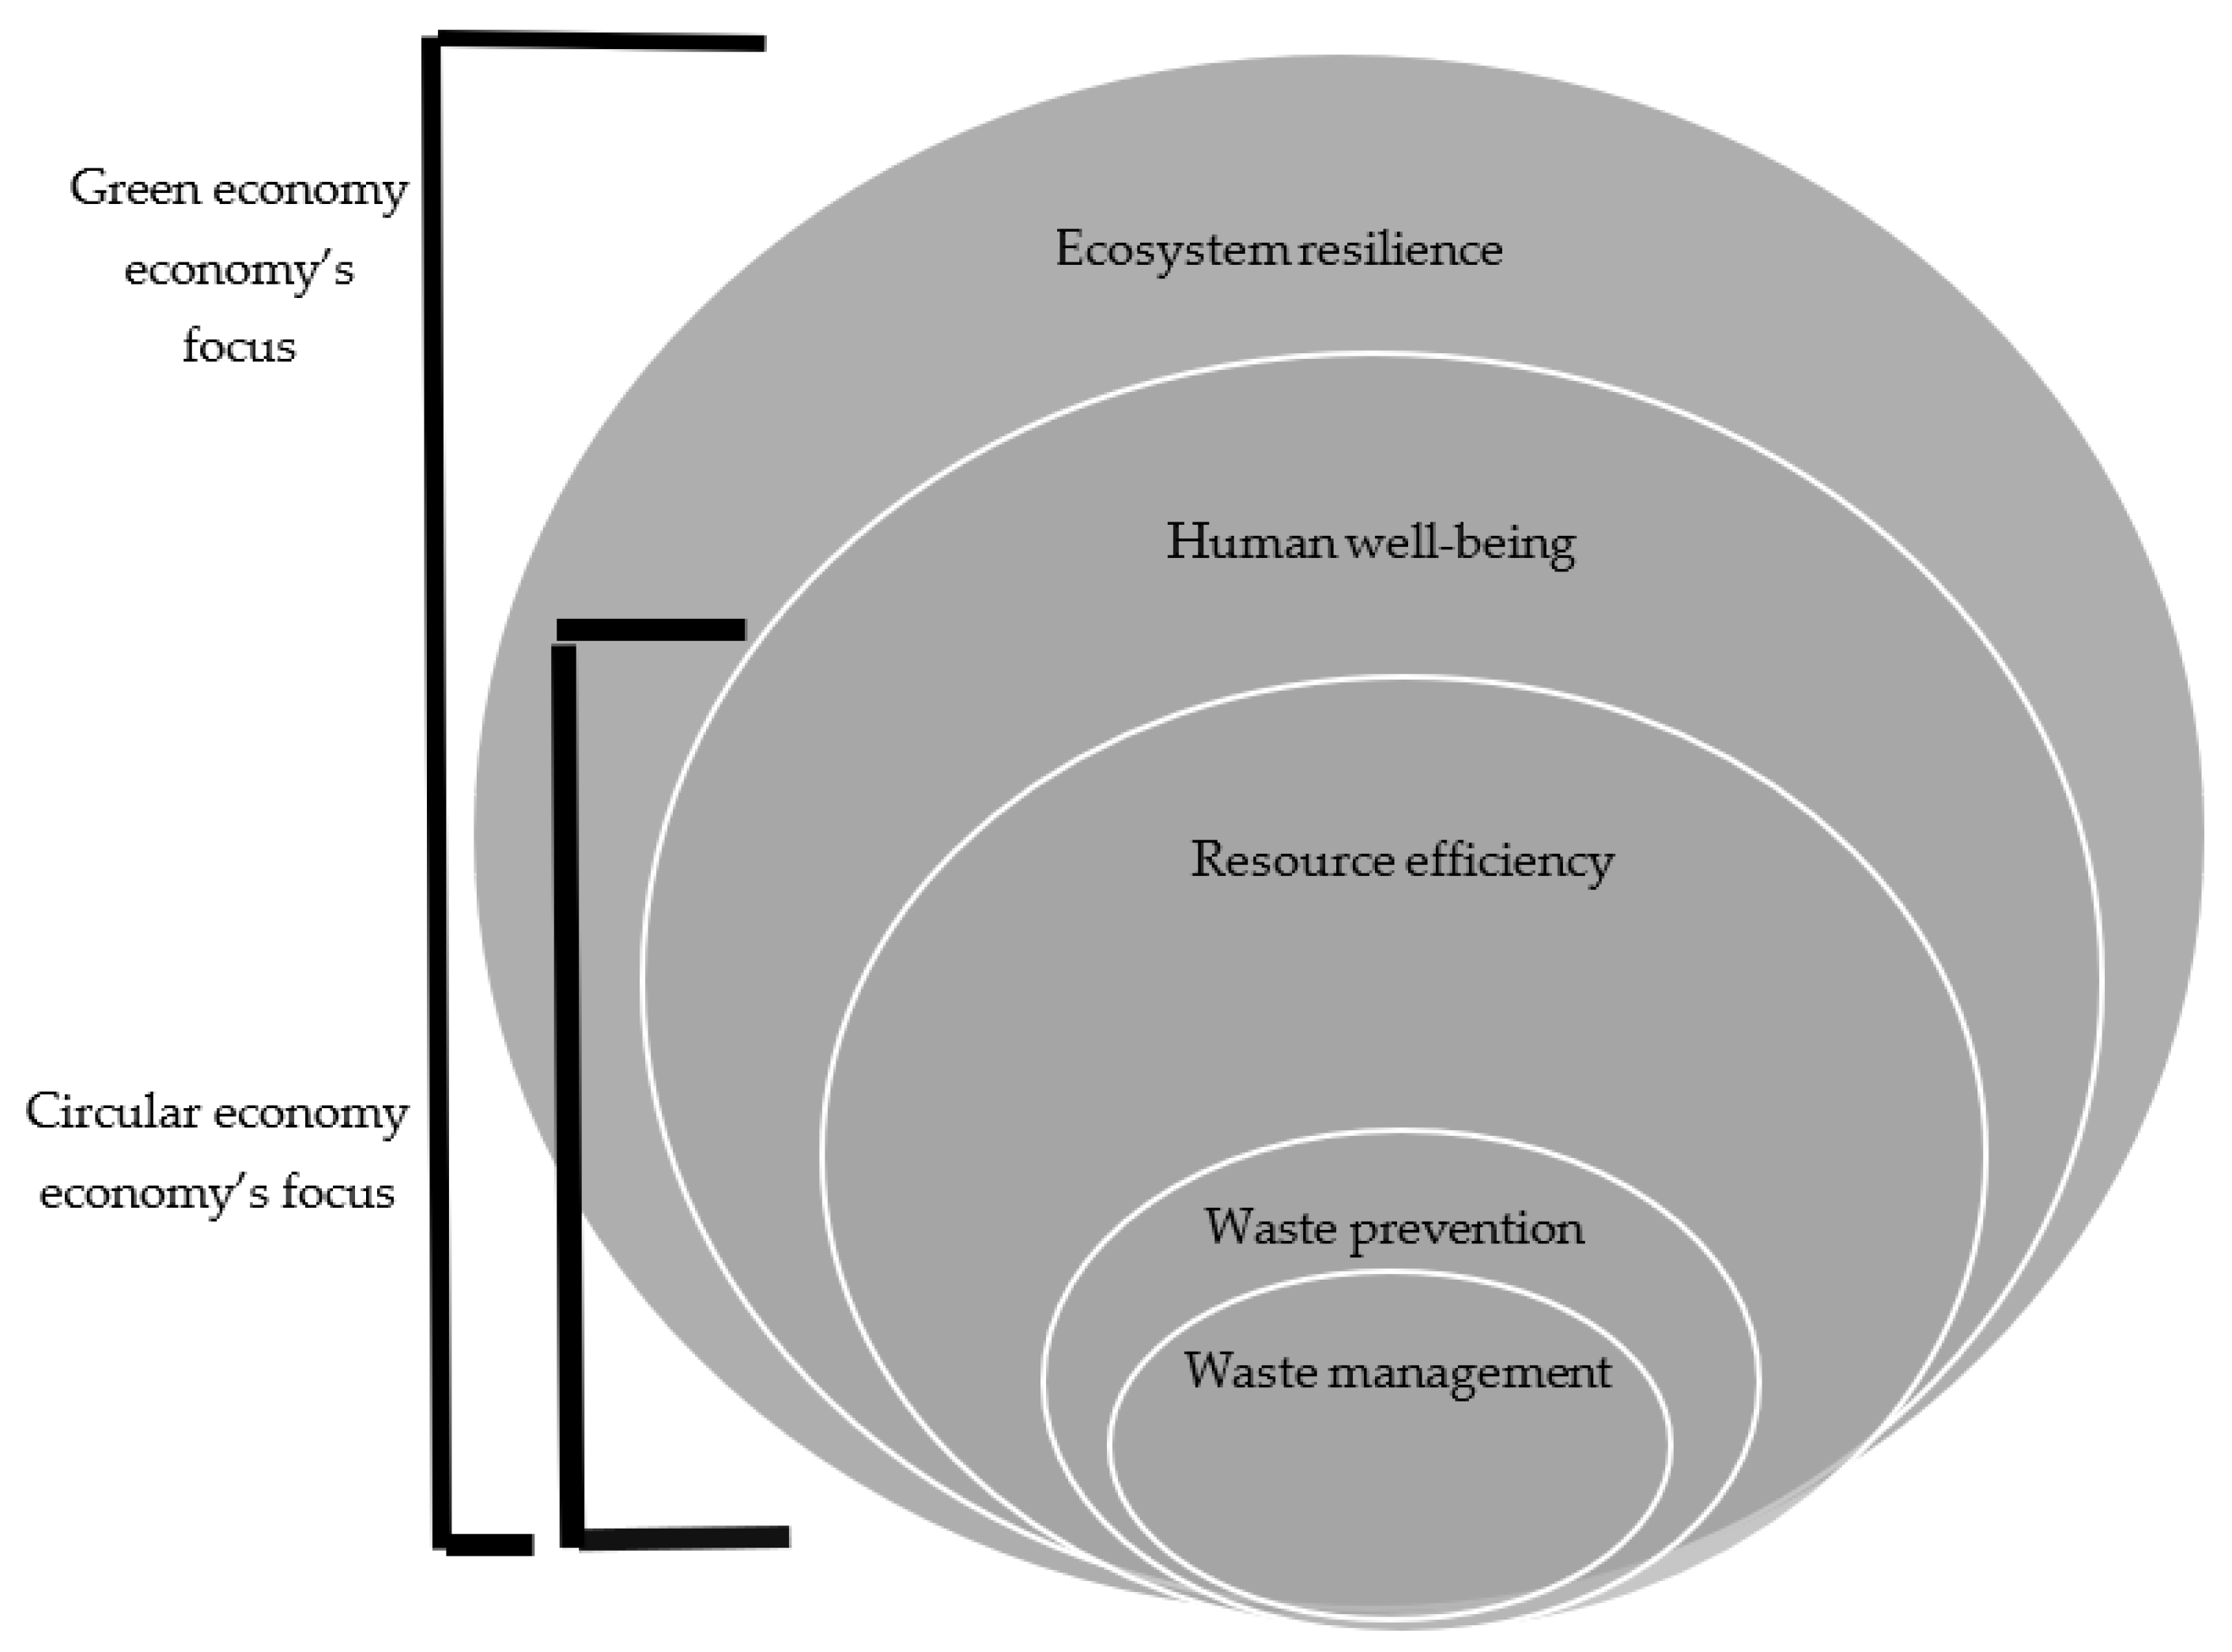
In this context, the environmental and climate policies play the main role in the prospects of the development of our economies with effects on the welfare of our society and the well-being of individuals. The connection between a circular economy (the base of the actual GD) and a green economy (the prospective development of economy and welfare) is evidenced by their focus.
Figure 2 below shows the links between the main elements of Environmental and Climate policies, the core of the GD: waste management, waste prevention and resource efficiency and their aims (human well-being and ecosystem resilience), both of which frame the development of a green economy [
41]. This approach is important not only for environmental research, but also for social science, because it describes the context and guides the area of future research, as
Figure 3 shows.
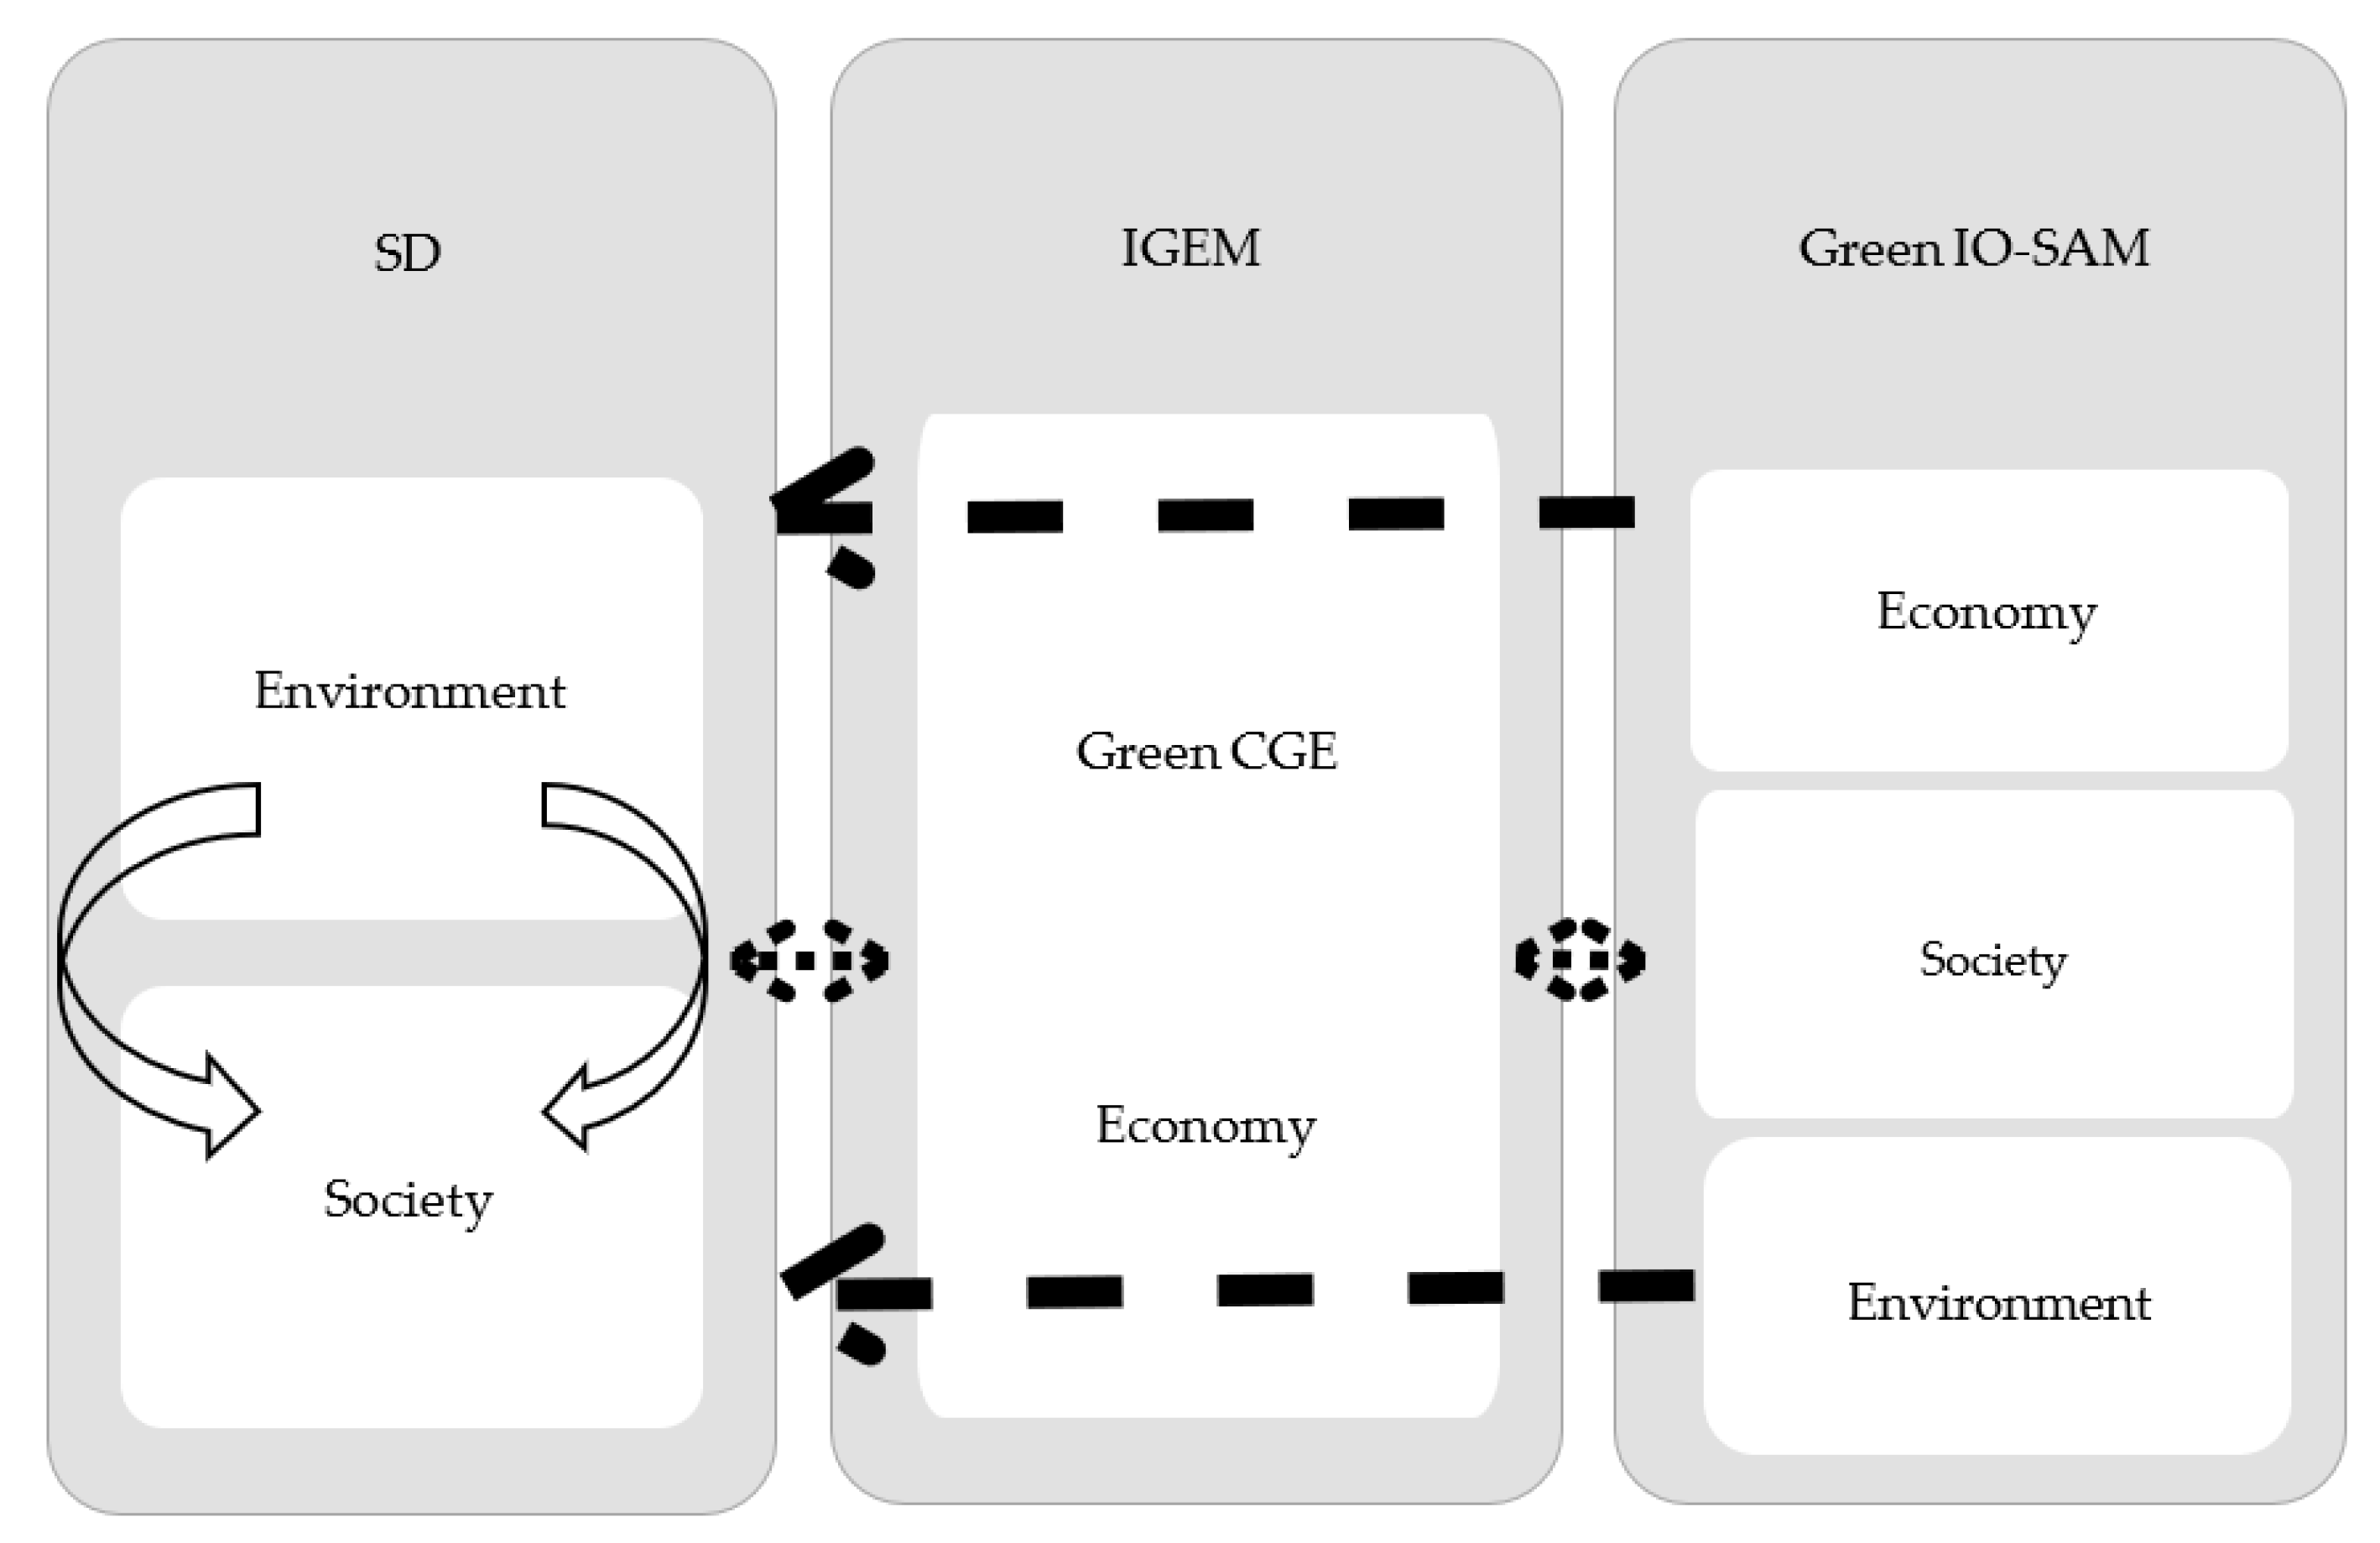
The transition towards a green economy, supported by the delivery of sustainable development goals, is made up of modeling tools and reliable metrics and measurements. By taking into account these instruments, countries could measure their progress against national and international targets of development, to prospect the impact of future policies, and inform the policy makers for a better design of sustainable polices or Green Economy policymaking [
43]. In this context, the capacity building potential of a MS will prospect the implementation capacity for the GD, as
Figure 4 shows.
Green Economy modeling is: (1) establishing the relationships between policy targets and relevant economic, environmental and social dimensions; (2) projecting the impact of policy in advance; (3) analyzing the effects of existing policies; and (4) identifying synergies and cross-sectoral impacts among policy choices [
17]. In the context of sustainable development and the Paris Agreement, the development of the Green Economy’s Policy Assessment, based on the green economy models, will support policy makers in their decisions and will strengthen the institutional capacity at both the national and local level. So, the capacity building for the GD’s implementation has to be built on an integrated green economy model.
Figure 4 shows a dynamic model based on economic interrelations. The model was used for the analysis of the impacts of eliminating energy subsidies or imposing a carbon tax and their trade policy impacts, but also for the impacts on the allocation of labor across sectors [
17]. The CGE (Computable General Equilibrium) model allows simulating non-linearity between the input and output, given the existing non-linearity in the production and utility functions, complementing the SD (Systemic Dynamics) model by modeling the economic impacts of a certain policy and by using this information as an input to the SD model, which will support the future modeling of environmental and social impacts. By adding the green extensions of the IO (Input–Output) model and SAM (Social-Accounting Matrix), it can be used to provide information on green sectors to the CGE model. The IO model could be used for short-term projections on the economy-wide impact of sectoral investments through the intersectoral linkages in the economy [
17]. The SAM model is based on circular flows and emphasizes the interactions between institutional agents within the economy. The IGEM is the Integrated Green Economy Modeling framework. So,
Figure 4 is an aggregate model of three distinct models which will be used for the elaboration of the analytical model of this research.
The GD’s implementation requires an adaptation of the model shown in
Figure 4.
Two years after the adoption of the GD strategy, epistemic communities from the central European region have raised more questions regarding the national financial costs involved, the social impact, and even the possibility of its implementation [
45,
46,
47,
48,
49,
50,
51,
52,
53]. The risk of using the GD narrative too much, without considering the potential of infrastructure and economies for prospective analysis regarding the implementation of the GD, is appearing in this latest period of time [
54,
55,
56,
57,
58,
59,
60,
61,
62].
An important element to be underlined is that the application of the GD in the EU through the implementation of environmental and climate policies will also support obtaining strategic autonomy, having a geopolitical importance. In this way, the international policies will increase their role on the international agenda and on the restructuring of the International System [
60,
61,
62].
3. Research Design
A new analysis model was elaborated, based on the combination of the circular and green economy models presented in the “Literature review” chapter [
35,
36,
37,
38,
39,
40,
41,
42,
43]. This new model will support the analysis of the GD’s implementation capacity and will be a useful predictive instrument for policy makers. In this sense, it opens new ways for other investigations in the field of sustainability, climate change, environmental policies, and social sciences.
The research was organized in six parts, as follows: it begins with the formulation of the problem and motivation of the research from the introductory chapter; the literature review chapter follows to frame the theoretical background; continuing with the research design chapter describing the methodology used; the fourth chapter will focus on the results; a discussion on findings represents the next chapter; and the study will end with the presentation of conclusions.
The work has been organized in accordance with reporting standards in the field of social sciences [
6]. This research is qualitative and explanatory, and quite new in the field of sustainability studies and social sciences. The interdisciplinary approach was also the reason for choosing qualitative research, because it favors the interpretation of data, within the socio-economic and cultural context, for a specific period of time [
62]. The study uses the empirical and explanatory research and official Eurostat data, the statistical officer of the EU. It aims to prospect, through data analysis, the capacity-building potential for the GD’s implementation in MS from the central EU. The analyzed states are: Poland, the Czech Republic, Slovakia, Hungary and Romania.
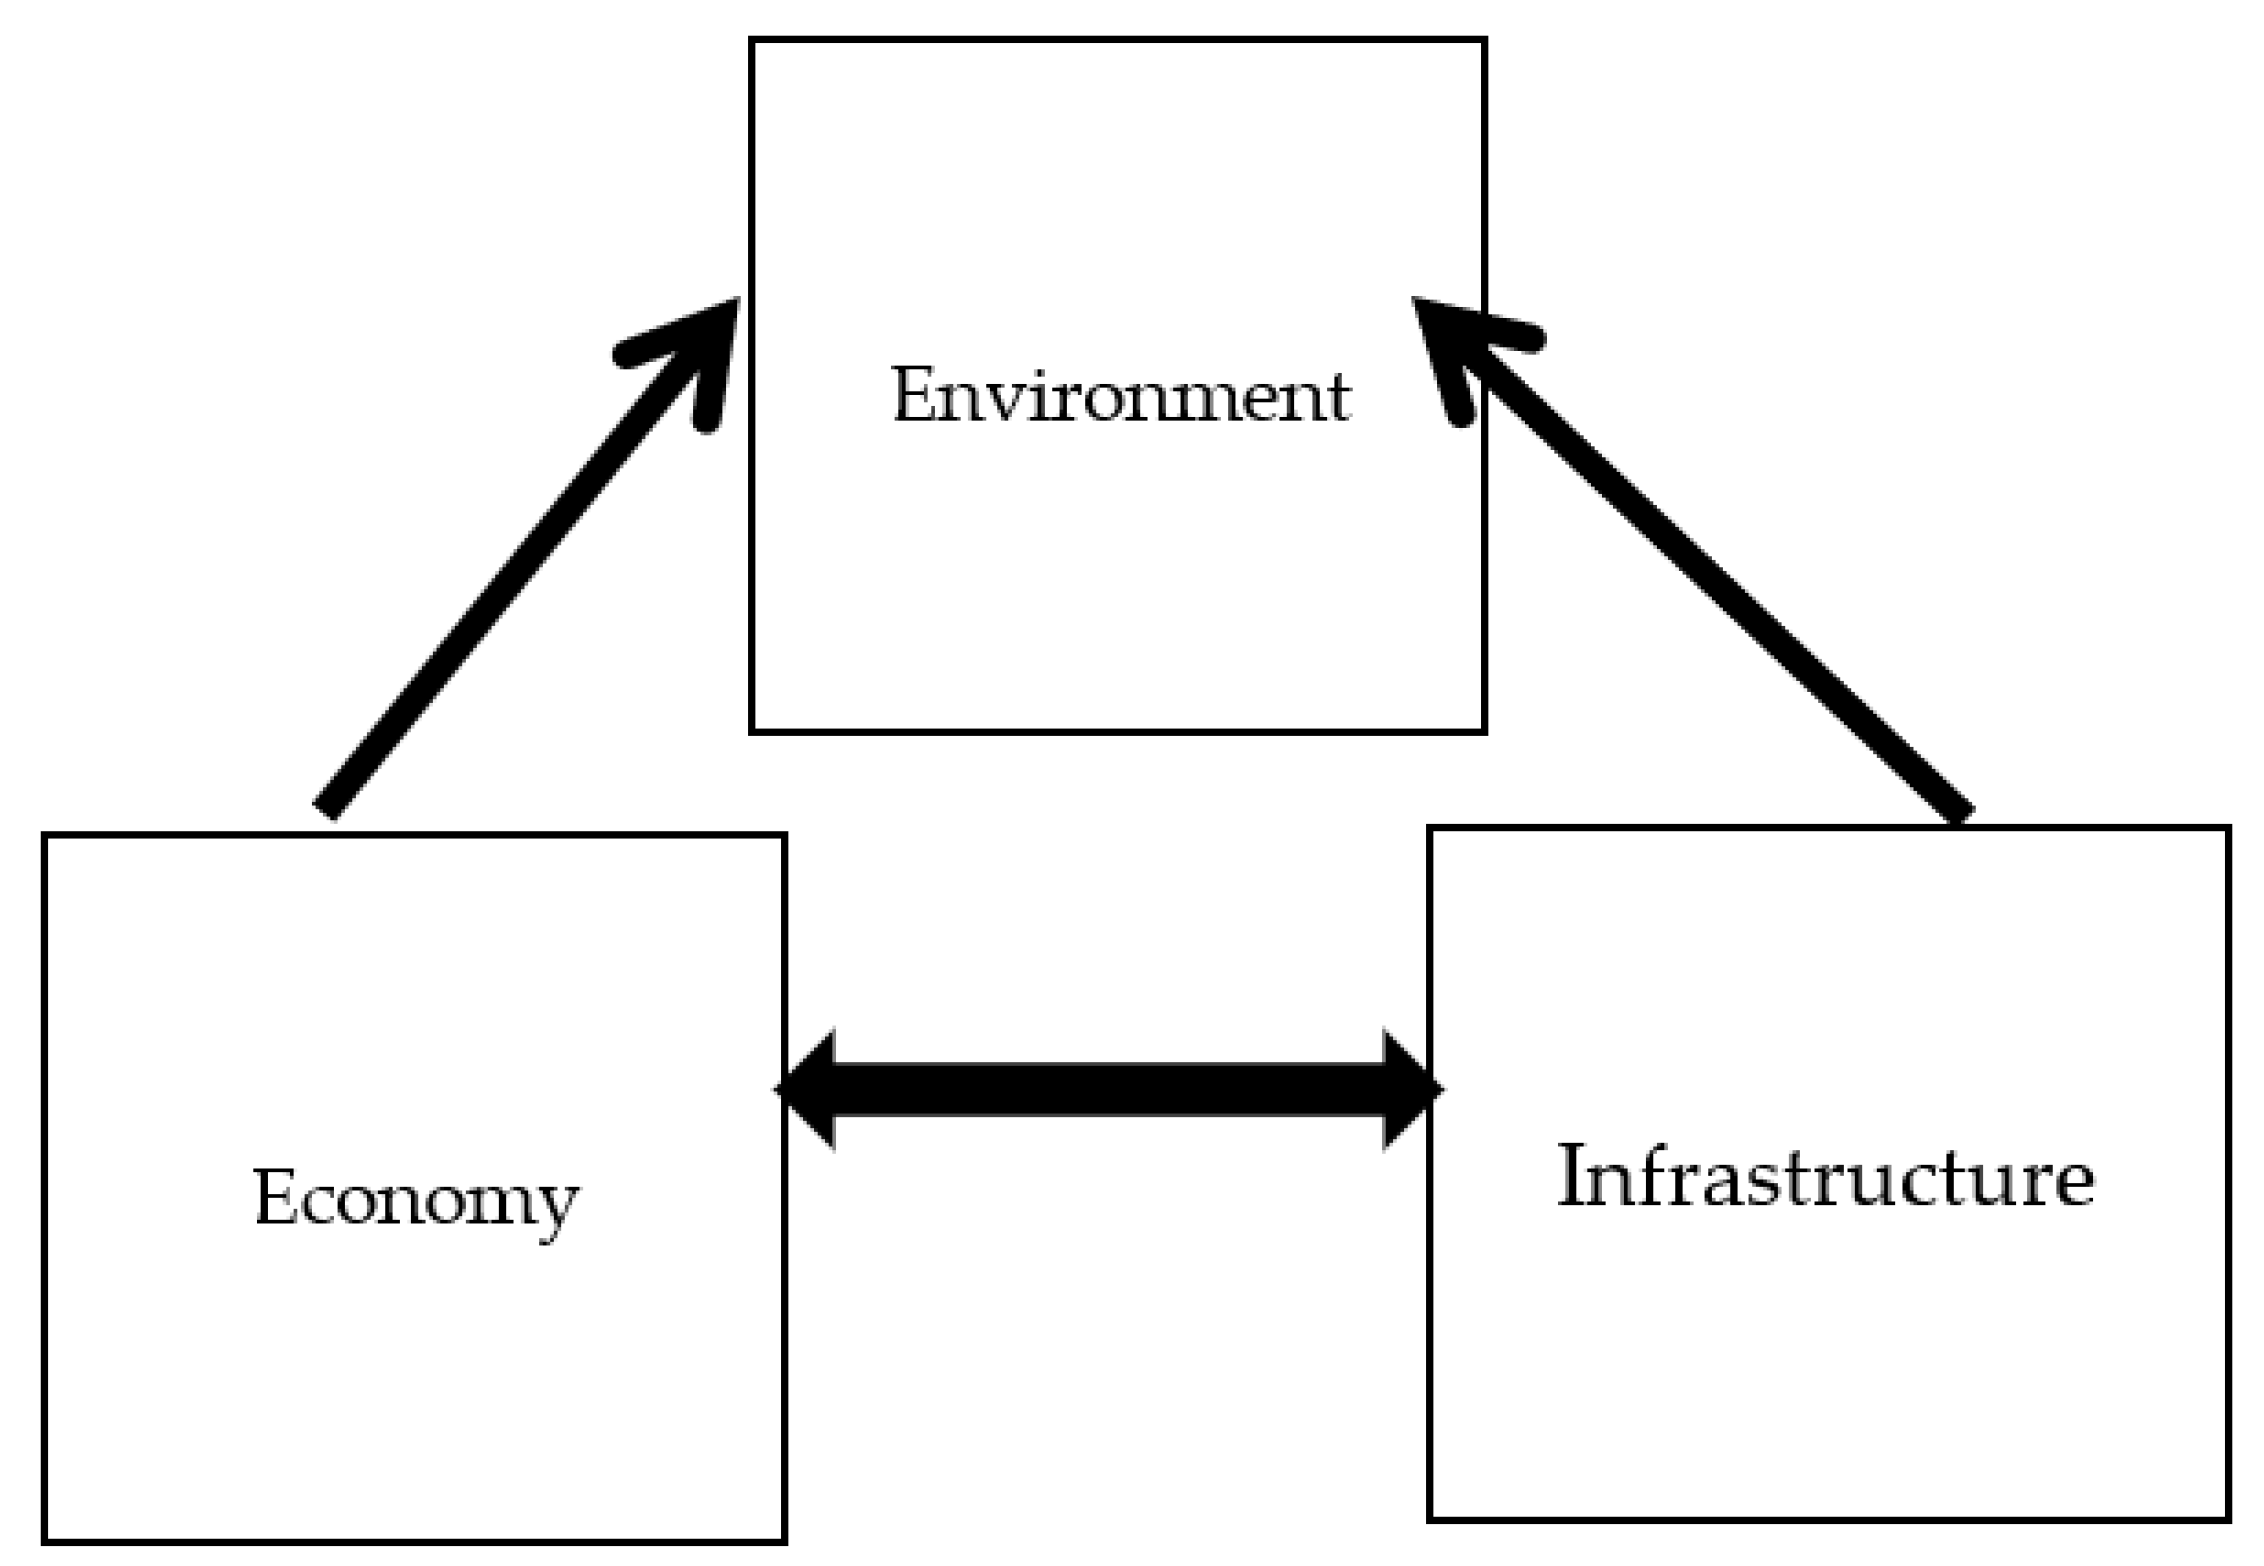
The new model created for the present research considers three factors: the environment, the economy and infrastructure, based on circular and green economy models, as
Figure 5 shows:
The factors from the analytical model concentrate all the actions of the GD strategy. The analytical model follows a comparative analysis between the environment vectors’ behavior reported to the performances of the economy–infrastructure dyad.
From the Eurostat database, 15 indexes were selected, which better describe each element of the analytical model, circumscribed to the European Policies of the GD, presented in the introductory chapter: the Climate Policy, the Energy Policy, the Industrial Policy, the Transport Policy, the Common Agricultural Policy, the Environmental Policy, and the Common Foreign and Security Policy. The indexes were chosen by considering the GD strategy and predictor potential of each:
for the environmental key elements: management of refuse by waste management operations and type of material (in thousands of tons); CO2 emissions (air emissions accounts by air pollutants by emitting economic NACE activity); nitrogen oxides;
for economic key elements: production in industry; material flows for a circular economy; total environmental goods and services sector; environmental taxes of economic activity; environmental tax revenues; investment in equipment and plants for pollution control;
for infrastructure key elements: resources’ productivity/EURO per kilogram; renewable energy sources; energy efficiency; energy import dependency; full conversion to organic farming; energy productivity.
The analysis of the data was realized with the Phyton software program (behavior vector) and with the Excel instrument, Quick Analysis.
For the first element (environmental), three histograms were created for the following subjects: waste management; the evolution of CO2 emissions; and the evolution of nitrogen oxides, in order to illustrate the historical evolution of each states’ investments in technologies that will support the green transition needed for the GD’s implementation. For example, for nitrogen oxides’ trend evolution, the average (AVERG) and standard deviation of values (STDEV) were established in order to generate the framework of the expected deviation of variables to which the trend equation will be reported.
The second key element is economy, designed by the fluctuation of data and their meaning, reported to their historical evolution. Six indexes were selected, and their annual efficiency was calculated and reported to the values of the previous year and the performance of each index. The purpose of performance computation was to emphasize the value of utility by taking into account the efficiency of the model.
The projection of economic indexes within infrastructure indexes (the third key element) supports the convergence for a quick transition [
53]. The infrastructures’ index values are used as reference points for the projection of economical values. For example, from an interdependent perspective, the stagnation of the economic model’s efficiency results from the low productivity of resources, generated by the infrastructure.
The period of study is 2011–2020, a ten-year period.
The methods of research are: observation, a case study, and a comparative method.
The research questions are: What are the main factors that favor capacity building for the GD’s implementation in central Europe? How can the ability to implement the GD by central European MS be improved?
Contribution to the knowledge consists in predictions regarding the GD’s implementation capacity of MS from central Europe, supporting the elaboration of national plans of implementation. The limitations of this research consist in its explanatory nature which inhibits the ability to make definite conclusions and this will impact the influence on decision making [
59,
60,
61,
62].
4. Results
The data were collected to test the hypothesis of the study and were organized as follows: (a) for all MS for the period between 2011–2020, for a regional approach of the implementing capacity and (b) for each analyzed MS with all the analyzed indexes for the period between 2011–2020, in order to prospect, for each investigated MS, its implementing capacity for the GD.
Below follows the presentation of the situation in all five MS for the three key elements for the GD’s implementation (environment, economy and infrastructure) and then, a presentation of the situation of each MS. At this stage, the results will be interpreted from a quantitative perspective and for their implication for the identification of the implementing capacity for different European policies circumscribed to the GD. In the next chapter, “Discussions”, a qualitative interpretation and a synthetic approach for each of the three key elements will be elaborated.
- (a)
For the first key element, environmental, due to the large amount of data, three synthetic tables were organized, one for each index: waste treatment (thousands of tons), CO2 emissions, nitrogen oxides, which are significant for the Climate and Environmental Policies circumscribed to GD.
The data presented on
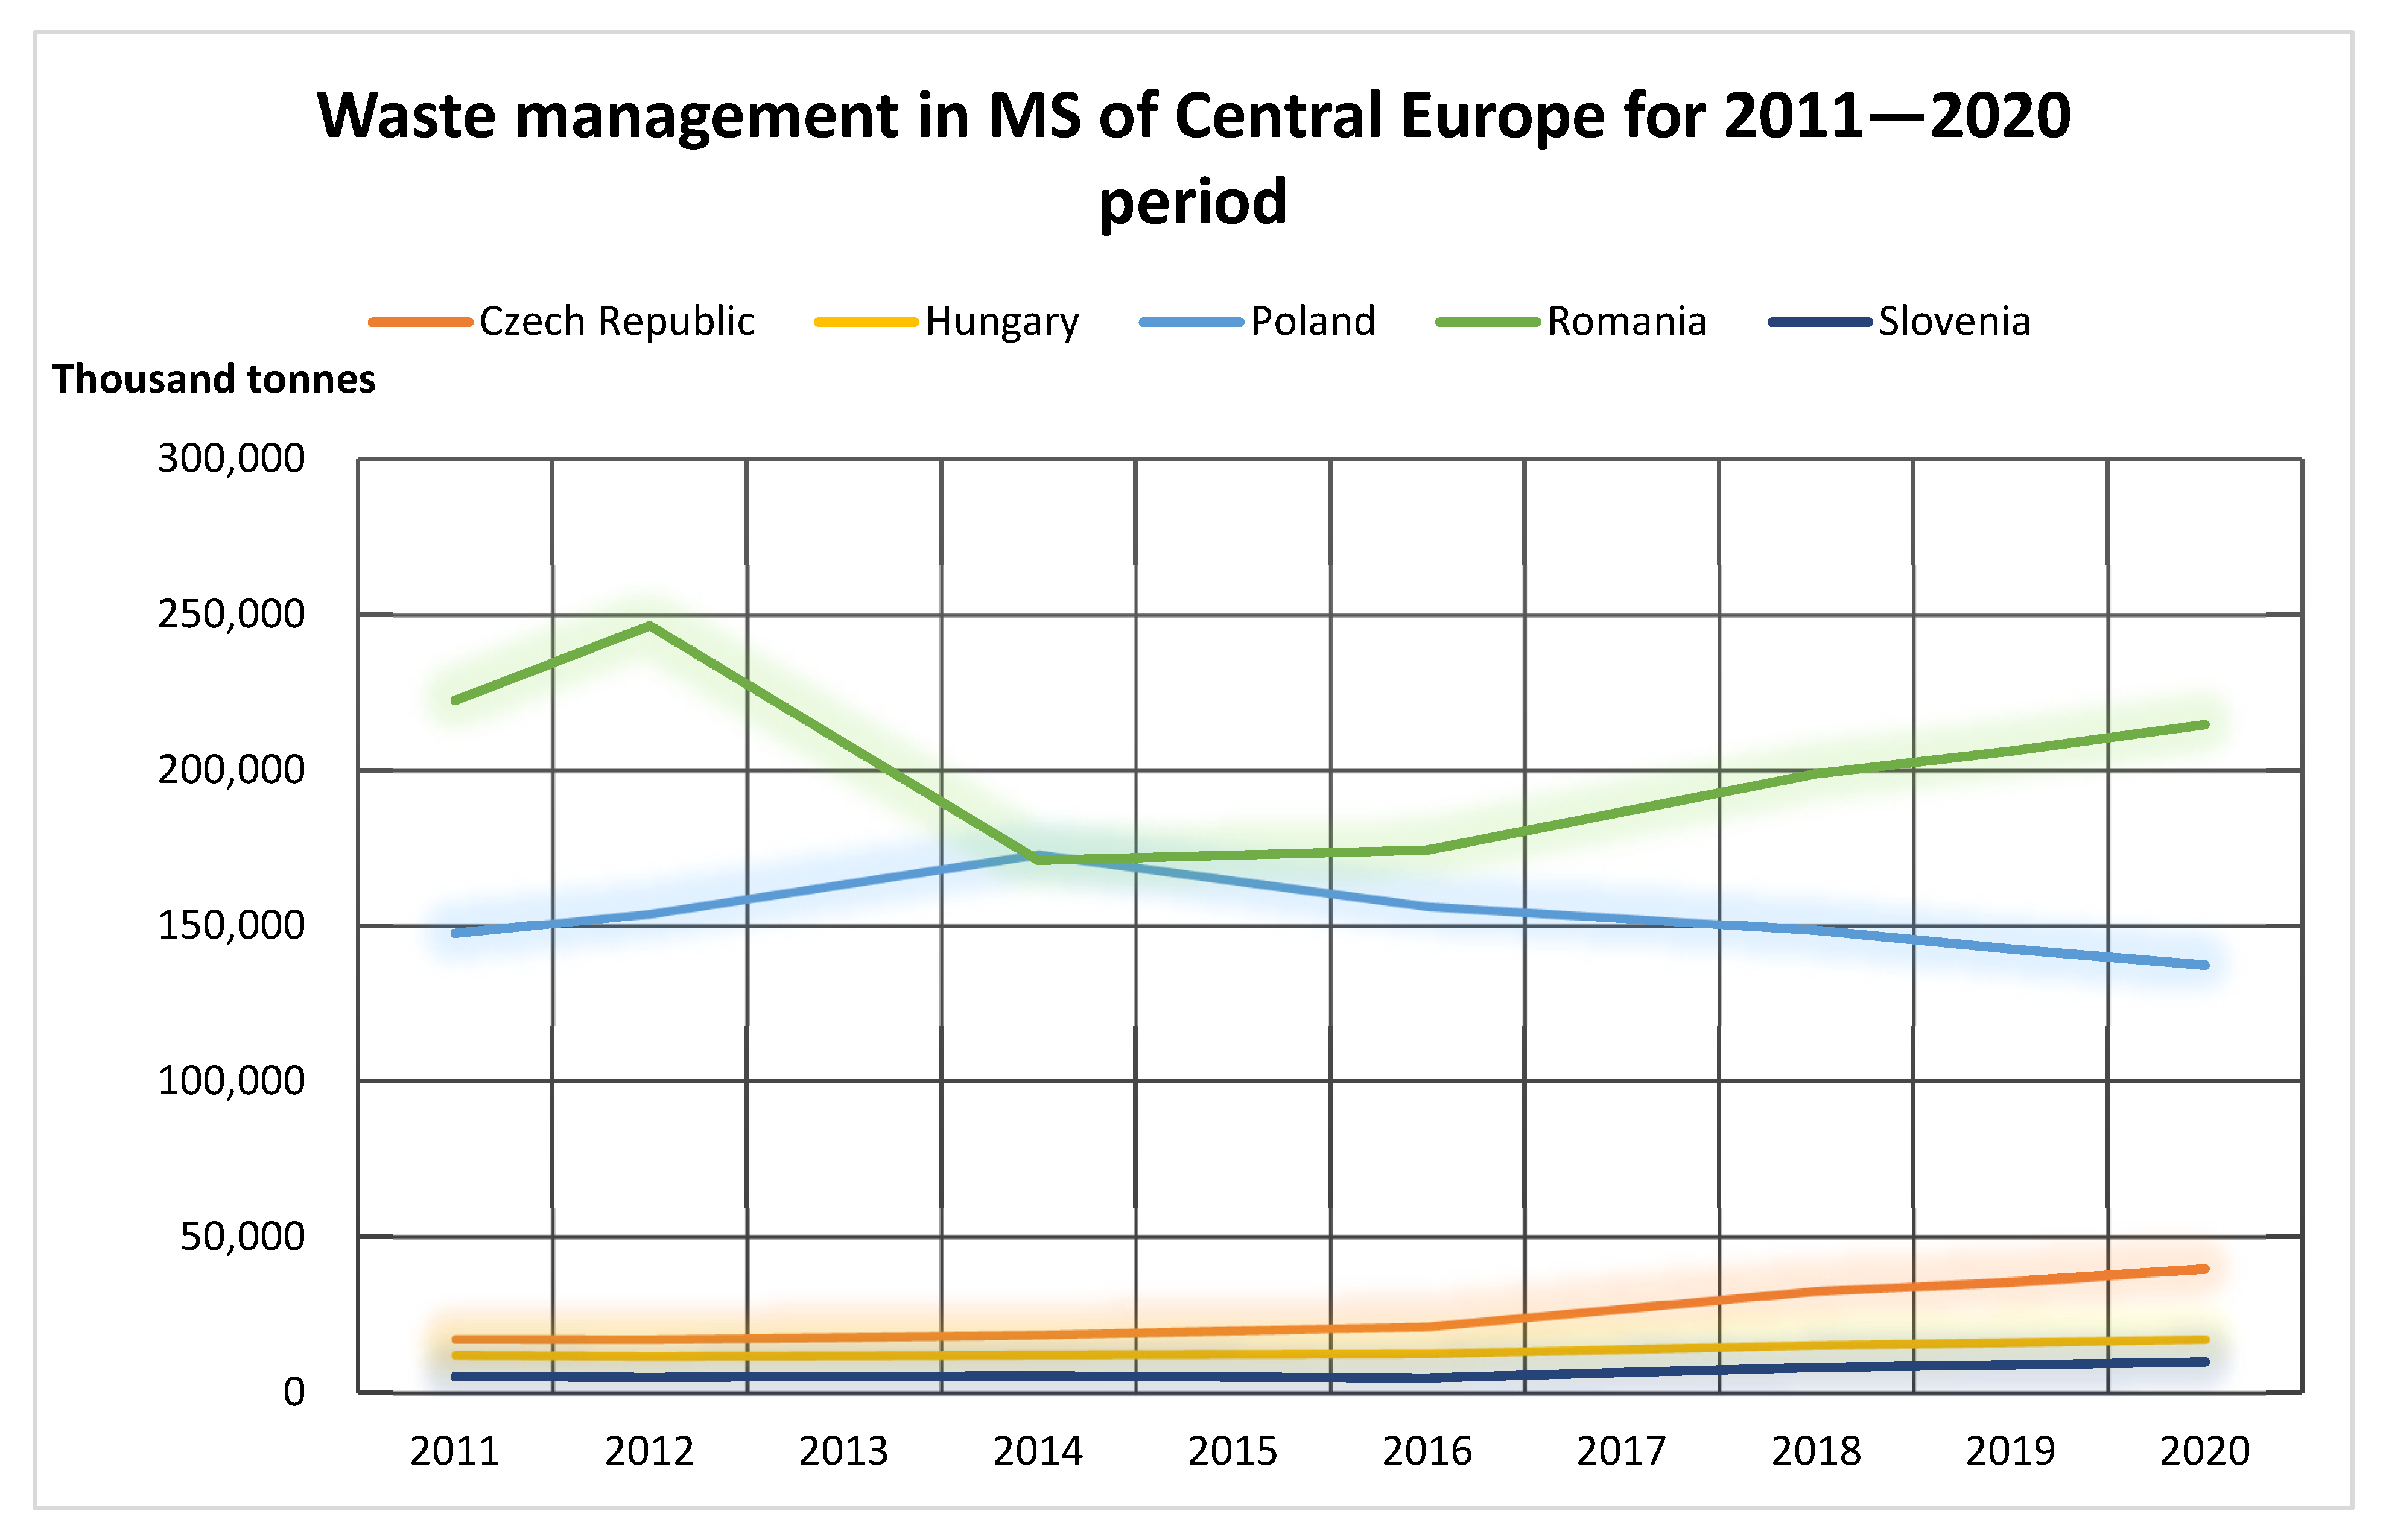
Table 1 show that investments in waste management and infrastructure (recycling) increased in the Czech Republic, Hungary, Slovakia and slightly in Romania, which could be a good predictor for capacity building and for the efficiency of the GD’s implementation. These trends are easily seen in a histogram organized with these data (
Figure 6):
An ascendant evolution can be seen in the waste management for the investigated period for four MS (the Czech Republic, Hungary, Slovakia and slightly so in Romania) and a decreasing tendency for Poland (from 2014). This should be noted because of its predictive potential on investments in technologies, which is significant for the political decisions regarding the GD’s implementation. These trends are the effects of national political decisions, but all MS from central Europe are below the European average, where Germany and France are frontrunners for this sector, with numbers of 333,567 and 277,341, respectively.
Regarding CO
2 greenhouse gas emissions, the situations for investigated MS are the following (
Table 2):
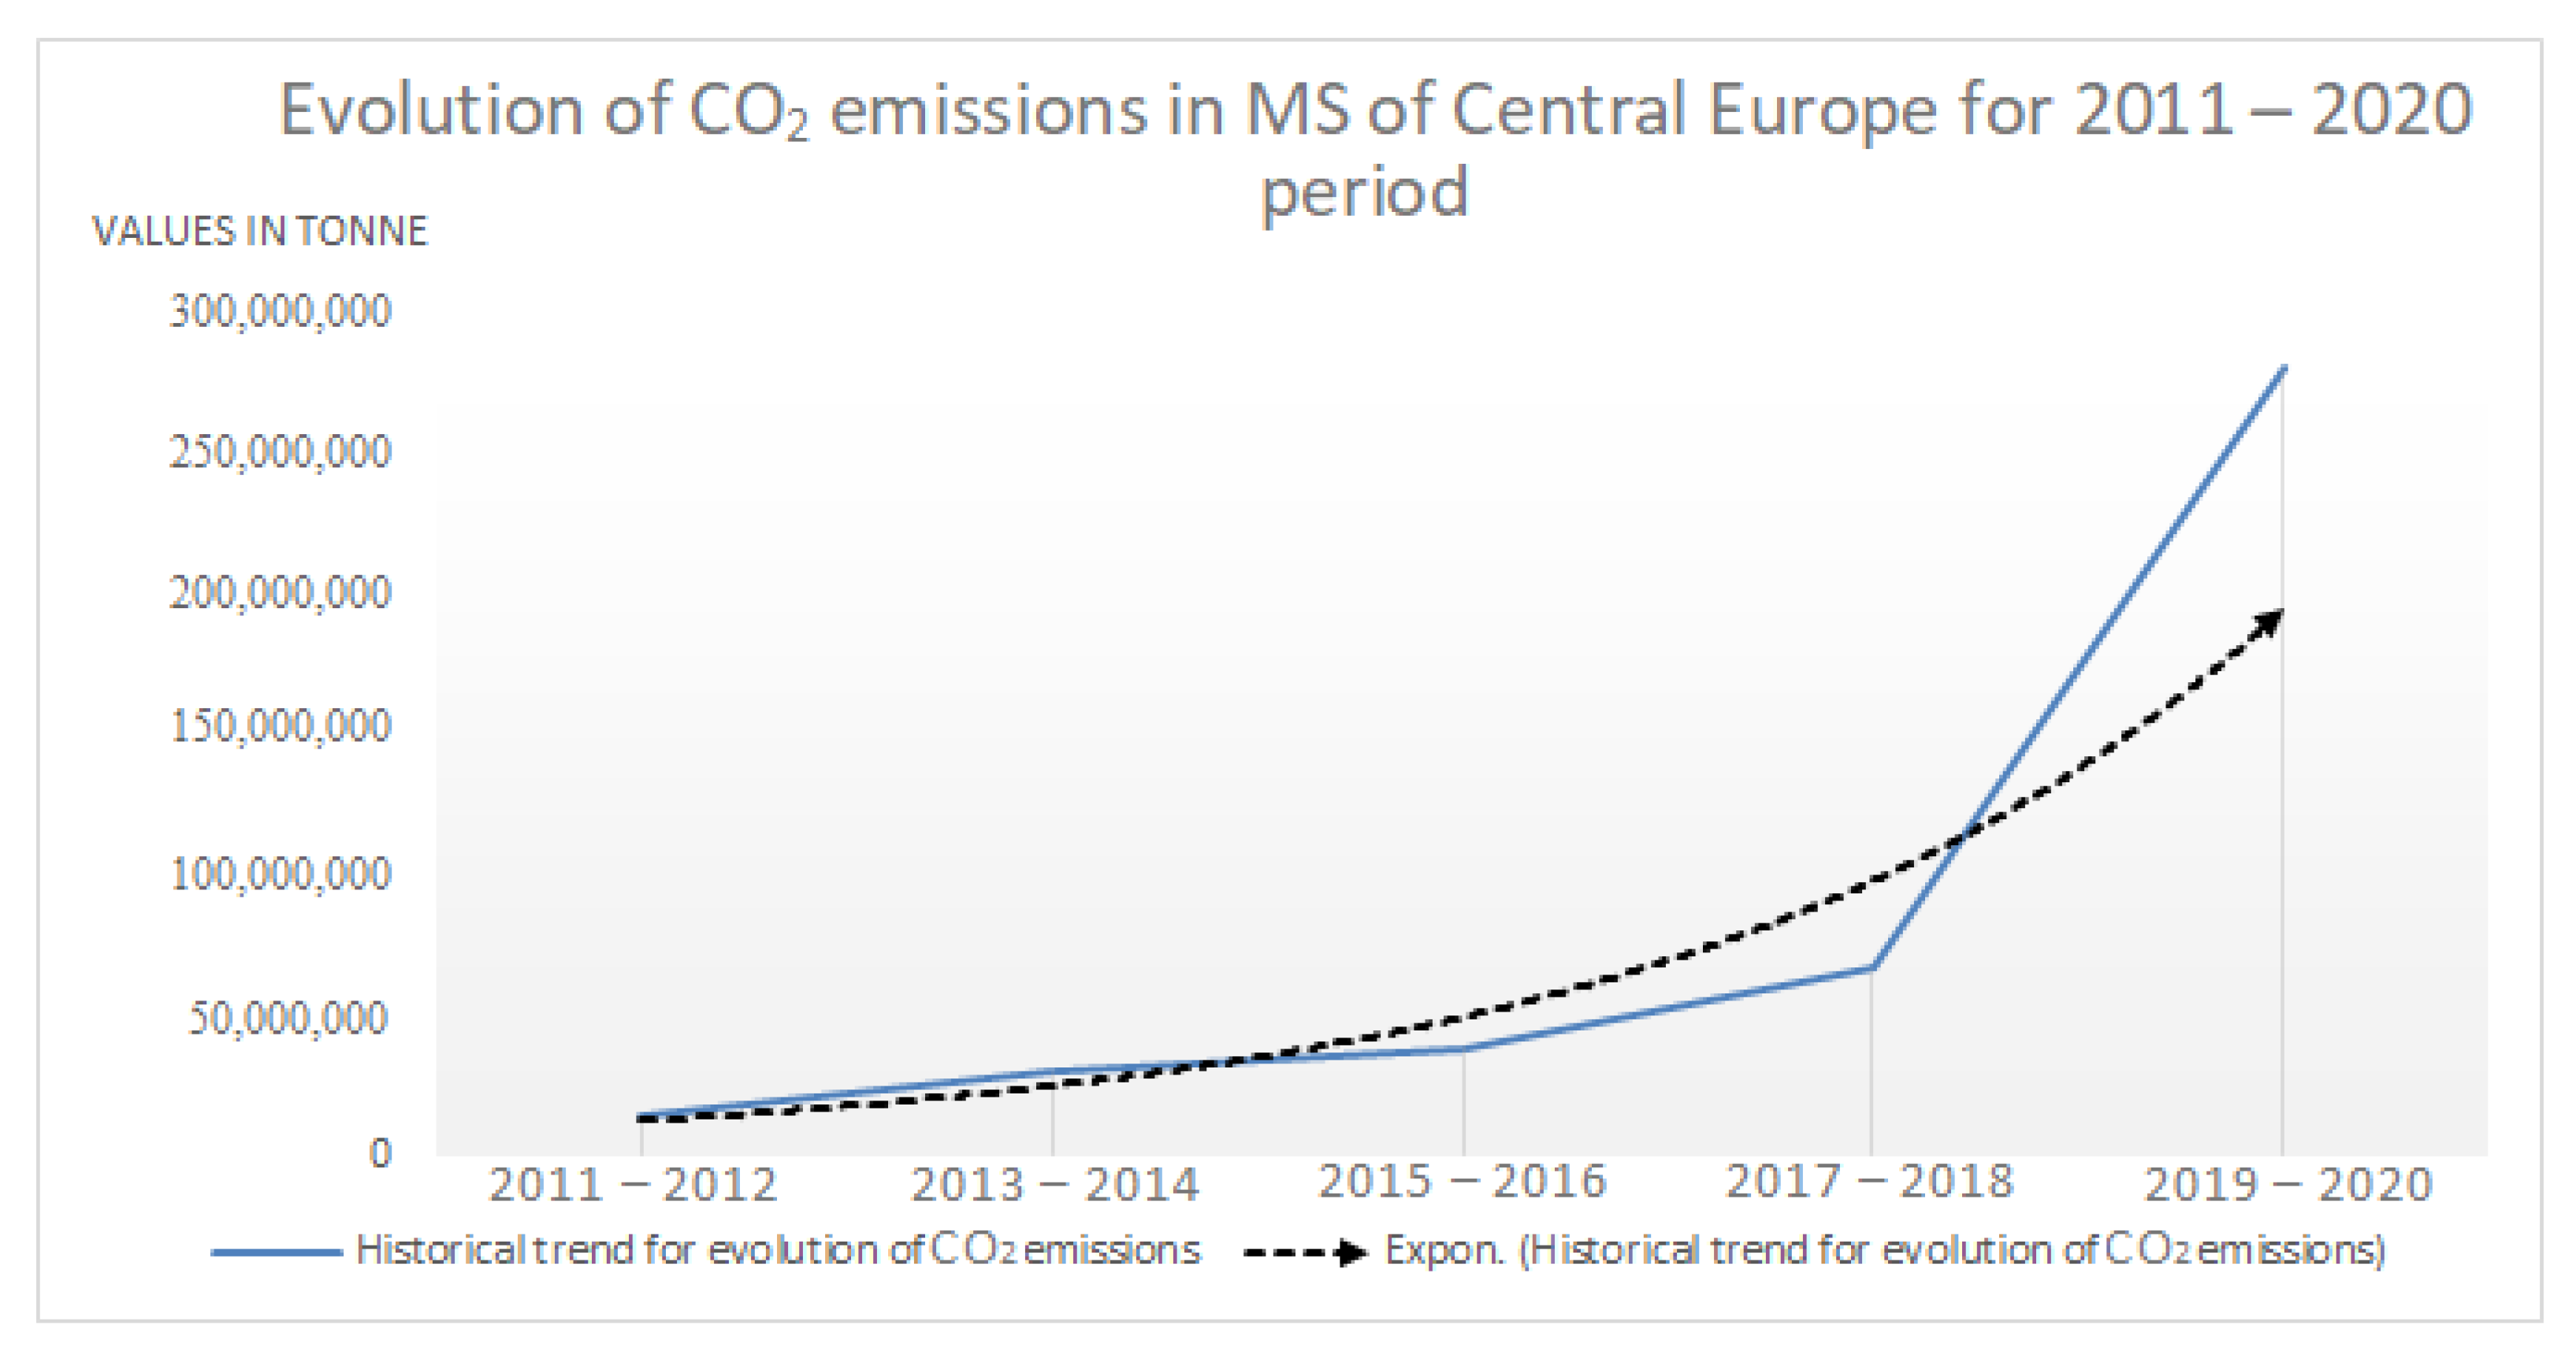
A better interpretation of the situation results from
Table 2 in the below histogram, which illustrates the evolution of the CO
2 emissions.
Figure 7 shows a dramatic ascendant curve in the evolution of CO
2 emissions, indicating an increasing tendency of CO
2 emissions. The situation is critical for capacity building and for the implementation of the GD, signaling the lack of political decisions by the national governments for technological investments for the reduction of CO
2 or for suitable, adaptable solutions in this sense. The lack of investments in specific infrastructure and technology will keep the tendency and curve of evolution at unsatisfactory levels, in contrast with the European present tendencies, which will differentiate the central region for this index.
Another index of the environmental key element is the emissions of nitrogen oxides, an important reference point for the pollution caused by cars. Its evolution gives important references for the investment made in technologies. The situations for the investigated MS are presented below.
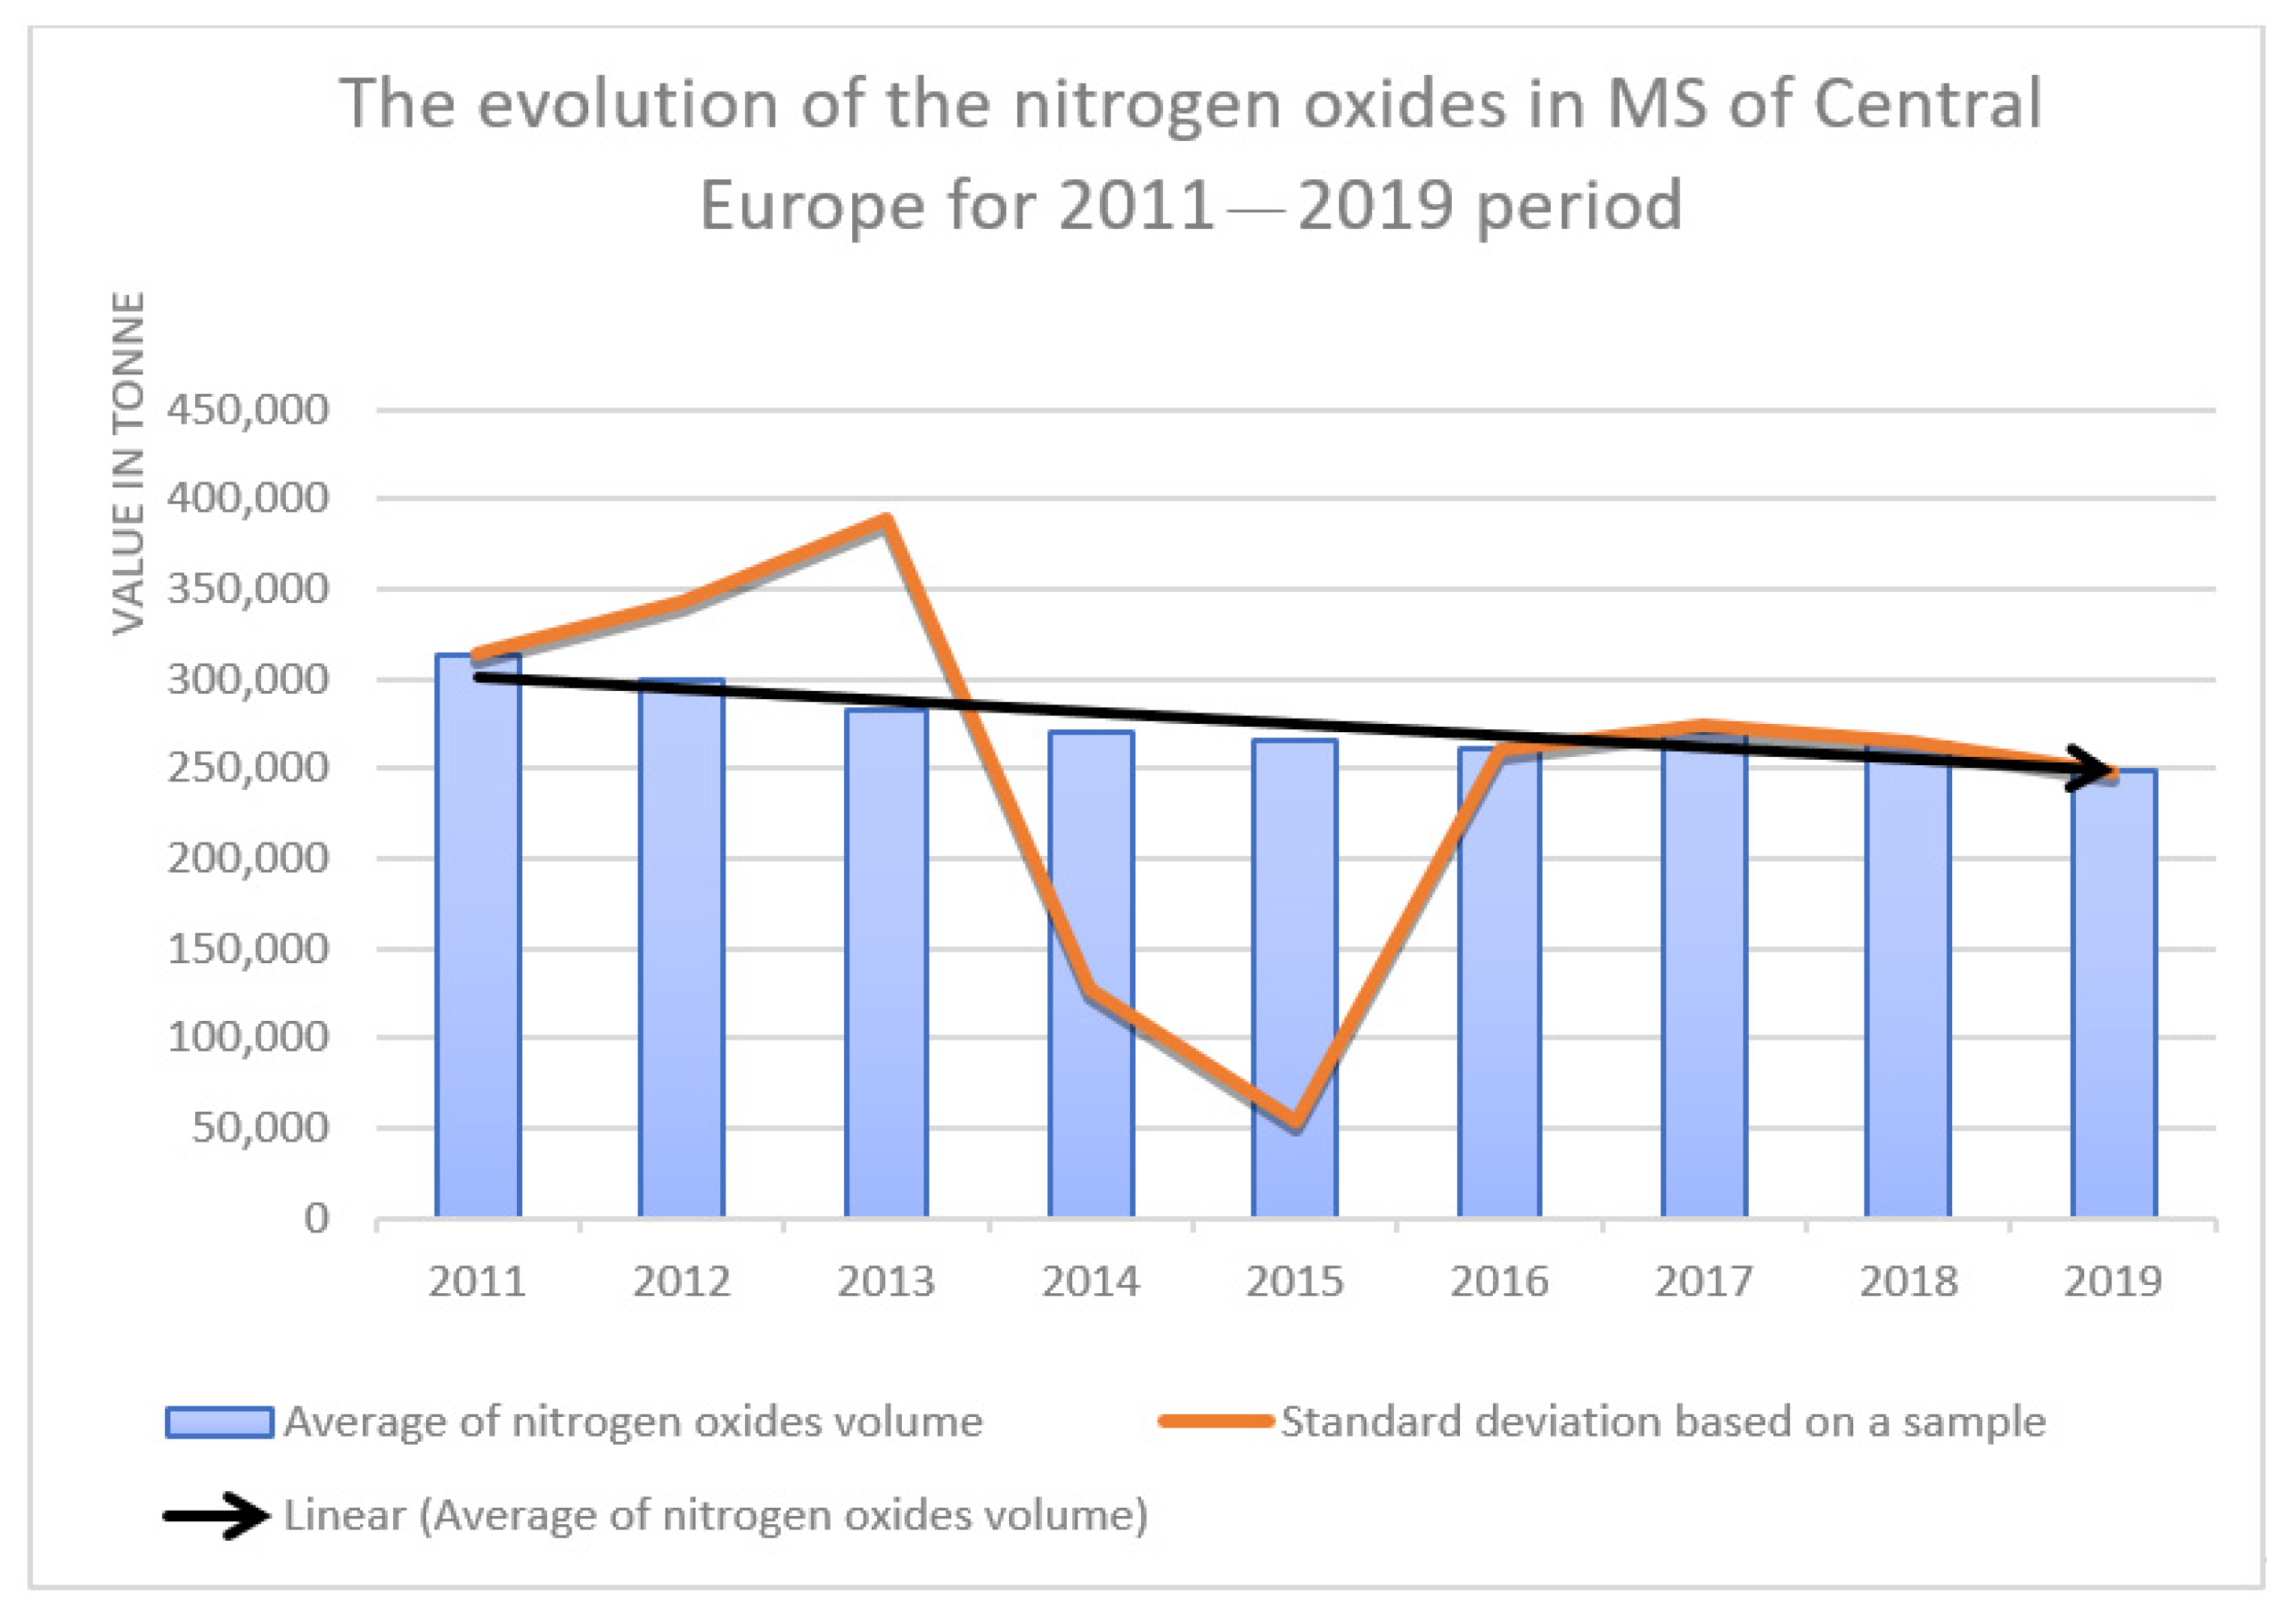
Table 3 shows the reduction of nitrogen oxides for each MS from 2011 to 2019, which might be explained by the legislation and technological compliance with the European norms consecutively to EU accession, but an increase after 2015. The below histogram illustrates it (
Figure 8).
A very dramatic evolution expressed by the histogram from
Figure 8 indicates the depreciation of air quality in all investigated MS. Its evolution reaches a plateau, with a small decreased tendency, but is inefficient, similar to the explanations for the level of CO
2 emissions, namely, insufficient technological investments. This red line from the histogram is the standard deviation, with a fluctuation before and after 2015. The histogram presents the situation for all MS, by taking into account the total volume of nitrogen oxides, and illustrates a critical situation with no potential for capacity building. The pollution with nitrogen from cars has to be reduced with green technologies and proper sustainable policies implemented. At this moment, the prospects are reserved for this region.
The synthetic situation for the environment, by considering the three indexes, will be presented in a separate table for each investigated MS, in alphabetical order.
For the Czech Republic the situation was presented in
Table 4.
The behavior vector indicates a slight increasing tendency of the efficiency for the measures, illustrating the usefulness of the implemented measures by national policies in the field and the potential for capacity building.
For Hungary the situation is as follows (
Table 5):
Table 5 indicates an increase of utility function (behavior vector), but still not enough for a significant evolution on efficiency measures in the environment field or for expressing a potential of capacity building.
For Poland, the situation is presented in
Table 6:
The utility function from
Table 6 indicates a particular situation for Poland, with high fluctuation in values (especially for CO
2 emissions), ending with a decrease for each of the variables that describes the environmental key element. There will be consistent difficulties for implementing the GD strategy and a small potential for capacity building.
For Romania, the situation was presented in
Table 7.
The utility function has a variable evolution, beginning with a decrease for all three indexes and then a small increase for waste management, indicating investments in the environment’s infrastructure, but still not sufficient for a solid prospect regarding the GD’s implementation (in a sense of a visible decreasing line for nitrogen oxides and CO2 emissions and a visible and consistent increasing tendency for the waste management line). Nonetheless, the tendencies for all three variables are in the proper direction, expressing a potential for capacity building and the GD’s implementation.
For Slovakia, the situation for the environmental key element will be presented in
Table 8:
As
Table 8 shows, the utility function has a decreasing tendency for two indexes (nitrogen oxides and CO
2 emissions), which is a positive fact, and a slight increasing tendency for waste management. Overall, there are minimum prospects for the GD’s implementation and efficient preparation, even though the tendencies are on a good direction and there is a good prospect for capacity building.
- (b)
For the second key element, economy, several variables were analyzed from the Eurostat database: production in industry, material flows for a circular economy, the total environmental goods and services sector, environmental taxes by economic activity, environmental tax revenues, and investments in equipment and plants for pollution control. Due to the large amount of data, the tables were organized for each investigated MS from the central European region.
For the Czech Republic, the situation for the economic key element can be seen below (
Table 9).
As
Table 9 shows, the situation for the Czech Republic has the following particularities: the lack of data for three indexes (“Total environmental goods and services sector” for 2011, 2012, 2013, 2019 and 2020, “Environmental taxes by economic activity” for 2020, and “Investments in equipment and plant for pollution control” for 2011, 2013 and 2020). The lack of production and exports of environmental goods and services for the beginning and end of the investigated period does not create a suitable framework for the GD’s implementation, especially regarding the environmental policy. The efficiency percentages have a sinuous evolution, beginning with 8.12%, decreasing in the following two years to 7.34% in 2013, increasing to 11.28% in the year 2014, then constantly increasing until 2018 (to 13.60%), and then decreasing to 9.94% in 2019 and then to 5.21% in 2020, so the pandemic conditions weren’t the primary cause for that. This evolution of efficiency indicated insufficient economic preparation for the GD’s implementation.
For Hungary, the economic key element is presented in the following
Table 10:
Table 10 indicates the following specificities for Hungary: there is no available data for the entire period of investigation for the index “Total environmental goods and services sector”, which indicates the lack of policies and measures at a national level and also the lack of available data for the “Environmental taxes by economic activity” for 2020. For the efficiency percentages there is an obvious increasing tendency from 2011 (9.48%) until 2019 (12.01%), followed by a dramatic decrease to 6.30% for 2020, which might be explained by the appearance and development of the pandemic.
For Poland,
Table 11 presents the following data:
As
Table 11 indicates, there are only a few unavailable data for Poland for two indexes: the “Total environmental goods and services sector” for 2011, 2012, 2013, 2019 and 2020, and “Environmental taxes by economic activity” for 2020. The sinuous evolution of the production of goods and services in the environmental field is interesting because of the lack of data for the beginning and end points of time in the investigative period. Such is also the case for the “Environmental taxes by economic activity” index. The efficiency percentages have a sinuous evolution from the beginning, with a significant increase in 2014 (to 11.06% from 7.15% the previous year) and a decrease in 2019 (to 10.36% from 13.96% the previous year), continuing in 2020 to 5.44%, within the pandemic context. The small percentages indicate insufficient economic preparation for the GD’s implementation.
For Romania, the situation can be seen below.
As
Table 12 shows, the evolution of the investments in equipment and plants for pollution control is very interesting, with an increase of more than 150% from 2012 to 2013 (from 38.3 to 90.0), then dropping by half to 49.9 in the next year (2014). The decrease continues until 2016 to 32.4, then increases to 60.4% in 2017, decreasing thereafter to half of this number, to 29.6%, in 2018, and increasing significantly to 158.2% in 2020. The sinuous evolution is also present for other indexes, the “Environmental taxes by economic activity” and “Environmental tax revenues”, which could indicate some credibility issues regarding the insubstantial measures in the environmental field. Similar to the other investigated MS, for three Indexes the data are missing: the “Total environmental goods and services sector” for 2011, 2012, 2013, 2019 and 2020; “Environmental taxes by economic activity” for 2020; and “Investments in equipment and plants for pollution control” for 2019. This indicates a lack of interest for economic supporting measures for the production of goods and services for the environmental field (the lack of data for 2019 and 2020), but also the context of the pandemic could be another cause. The efficiency percentages have a sinuous evolution, with an increasing tendency from 2011 (5.31%) to 2014 (13.07%), increasing until 2016 (14.11%), decreasing to 12.99% (2017), then increasing to 14.55% in 2018, decreasing to 9.94% in 2019 and then again, more significantly, to 4.87% in 2020. With these economic numbers, a simulation of the GD’s implementation will be very difficult, expressing the lack of a specific economic environment as a pre-requisite for an efficient preparation.
For Slovakia, the situation for the second key element will be presented in
Table 13.
As
Table 13 shows, the only data that are missing for Slovakia are the “Total environmental goods and services sector”, as is the case for Hungary. It could indicate a lack of prioritizing the production of goods and services for the environmental sector. A sinuous evolution for two indexes forms and can be observed in
Table 13: the “Material flows for circular economy” and “Investments in equipment and plants for pollution control”, which could affect the credibility of the implementing capacity. Unlike the previously analyzed MS, Slovakia has data available for 2020 that do not show a dramatic decrease, with increasing numbers for “Material flows for a circular economy” (from 540 in 2019 to 713 in 2020) and “Investments in equipment and plants for pollution control” (from 0.0 in 2019 to 0.1 in 2020) and even shows an increase in efficiency percentages from 2019 to 2020 (from 10.87% to 10.99%). The efficiency percentages increased constantly during the period of investigation, with a decrease from 2018 to 2019 (from 11.26% to 10.87%), followed by an increase to 10.99% in 2020, during pandemic conditions. Overall, the economic framework could be favorable for the GD’s implementation, but the percentages of efficiency are still too small.
- (c)
The third key element for the evaluation of the capacity building for the GD’s implementation capacity is the infrastructure. The Eurostat variables that describe the preparation and investments at the national level are: resources’ productivity/EURO per kilogram, renewable energy sources, energy efficiency, energy import dependency, total fully converted and under conversion to organic farming, and energy productivity. Due to the amount of data, the data were organized in separate tables for each investigated MS, as was the case for the previous key element. For the index “Total fully converted and under conversion to organic farming”, the available data from the Eurostat database are only available from 2012 until 2020, and the data for 2011 is missing for all investigated MS.
For The Czech Republic, the situation for the third key element is as follows (
Table 14):
The above
Table 14 shows that for the Czech Republic, the preparedness for capacity building for European policies is circumscribed to the GD from the infrastructure’s point of view and it mainly has a sinuous evolution. The evolution demonstrates four increasing and decreasing indexes (“Resources’ productivity/EURO per kilogram”, “Renewable energy sources”, “Energy efficiency” and “Energy import dependency”) and a constant increase for two indexes (“Total fully converted and under conversion to organic farming” and “Energy productivity”). The last indexes are specific for the Common Agriculture Policy (CAP) and energy policy, but it will not be enough for the efficient preparation of the implementation of the GD.
For Hungary, the situation for this key element is illustrated in the table below.
Table 15 describes the infrastructure availability from more perspectives: the environment, energy and agriculture. The evolution of the tendencies for the investigated period showed small variations in the evolution for all indexes, and continuing ascendant evolutions for “Energy efficiency”, “Energy productivity” and “Total fully converted and under con-version to organic farming”, so there is a continuing preoccupation for the infrastructure which could be used for the GD’s implementation. One particular aspect is the increasing of the “Total fully converted and under conversion to organic farming” indicator from 2015 to 2016 (from 129,735 to 186,322) and from 2018 to 2019 (from 209,382 to 303,190), the last one with a 50% increase, meaning explicit attention for the CAP.
The next table will present the situation for Poland for the third key element of analysis.
The preparedness of Poland is illustrated in
Table 16 and indicates variations in the evolution of almost all indexes, with the exception of the “Resources’ productivity/EURO per kilogram” variable which has an ascendant evolution. It is difficult to prospect the infrastructure capacity from the evolutions of these indexes, but it reflects the lack of a unitary and continuous vision regarding a coordinated action for reaching the sustainable development goals and, consequently, of the GD.
For Romania, the infrastructure key element is presented in
Table 17 below:
For Romania,
Table 17 illustrates a fluctuating evolution for three indexes (“Resources’ productivity/EURO per kilogram”, “Energy import dependency”, “Total fully converted and under conversion to organic farming”) and a constant ascendant trajectory for the others (“Renewable energy sources”, “Energy efficiency”, “Energy productivity”), which, in terms of the credibility of the implementing capacity, could raise some questions. However, the ascendant tendencies for renewable resources and energy efficiency creates a suitable framework for the GD’s implementation in Romania, taking into consideration its specific characteristics.
For Slovakia, the situation is presented in
Table 18:
For Slovakia, the situation presented in
Table 18 illustrates fluctuating evolutions for three indexes (“Renewable energy sources”, “Energy efficiency”, “Energy import dependency”) and a continuous evolution for the rest (“Resources’ productivity/EURO per kilo-gram”, “Total fully converted and under conversion to organic farming”, “Energy productivity”). The fluctuating evolution of renewable energy and of energy dependency could create difficulties for the implementation of the GD, which aims to energize autonomy. There are three important increasing evolutions: for the “Resources’ productivity/EURO per kilogram” from 2018 to 2019 (from 1.2151 to 1.4011); for the “Renewable energy sources” from 2018 to 2019 (11.896 to 16.894), in which both variables are specific for the energy policy, for the same year, indicating particular measures taken at a national level; and for “Total fully converted and under conversion to organic farming” from 2013 to 2014 (from 157,848 to 180,307) for the CAP, indicating a particular initiative and/or measures taken at a national level, marking the increasing evolution for the whole investigated period.
5. Discussion
The present research tried to identify the capacity building potential for the GD’s implementation of MS from the central European region. Even though, at the political level, all investigated MS stated their engagement, the epistemic community begin to raise questions regarding the potential for its implementation. The GD’s implementation requires sustainable national plans with an integrated and inclusive strategy which circumscribes European policies.
The economic realities, besides the intensive narratives regarding the GD, will offer a proper image of each MS’ capacity building for implementation. A suitable solution to measure the degree of preparedness for each MS is prospection based on specific indicators. These indicators are, actually, predictors for the GD’s capacity for implementation. The analytical model was inspired by the circular and green economy models [
38,
40,
41], the core elements of the GD, with implications of all circumscribed European policies: the Climate Policy, the Environmental Policy, the Transport Policy, the Energy Policy, the Common Agricultural Policy, and the Common Foreign and Security Policy. Certain indicators were selected carefully, based on their predictor potential, specific for each European policy involved in the GD’s implementation [
7,
8], and were grouped into three key elements: environment, economy and infrastructure. Practically, economic factors and infrastructure are the indicators for implementing the European policies at the national level. This selection of indexes was done according to the theoretical foundation exposed in the “Literature review” chapter, were the GD, its component and targets, as well as the sustainability policy and circular and green economy models were presented. In this chapter, the three key element will be analyzed with a mainly qualitative synthetic approach.
The results of this research for the first key element, the environmental element, and its three indexes (waste management, CO
2 emissions and nitrogen oxides emissions), are the first predictors of the GD’s implementation. The behavior vector indicated for the volatility of the fluctuation and for waste management illustrates an increasing tendency for the Czech Republic, Hungary, Romania, and Slovakia, that could be interpreted through investment lenses, and as signals for technological improvements that will support the reduction of CO
2 and nitrogen oxide emissions [
9]. For these two indexes, the data show a decreasing of the values, illustrating investments in new technologies, and therefore, the availability and engagement in the GD’s implementation [
24]. For the waste management indexes, the same explanation and correspondence as with the theoretical statements are valid [
9,
24], as
Figure 7 showed. For example, Romania has a significant increasing tendency for waste management that might be explained through the investments in performant technologies (more sorting stations). For other MS, the values are at a lower level, combined with the behavior vector indicating an increasing tendency for the waste management indicator. Regarding the other values, only Romania and Poland recycled a significant quantity of more than 100,000 tones. The central European states implemented specific norms of environmental policy for the waste management sector [
28,
29,
31,
32,
33,
34].
Figure 8 indicates a dramatic increase of CO
2 emissions in all investigated MS.
Figure 8 has a fluctuating evolution, with both decreasing and increasing levels of nitrogen oxides after 2015, meaning a critical state and negative prediction for capacity building for the GD’s implementation [
9,
24,
27]. Overall, for the first key element, the environment, it could be stated that it cannot predict the capacity of implementation, and the behavior vector analyzed individually for each MS indicated fluctuations regarding nitrogen oxides, and an increasing tendency for CO
2 emissions and waste management (exception Poland), which are not in line with the targets and actions proposed by official EU documents [
5,
6,
7,
13,
20,
21,
32]. There are obvious common evolutions between analyzed MS, without geographical region differences [
63]. An exception, however, is represented by the waste treatment which signaled a slowing in terms of the volume treated. Unfortunately, the general framework of the environment-based indicators of the circular economy remains uncertain and critical. For this situation, the main source can be identified in actual values of the environment index reported to the historical values, which reveal, despite improvements, the weakness of the actual results.
For the second key element that illustrates the capacity of the GD’s implementation—the economy—the research revealed the following: the values of the indexes “environmental taxes by economic activity” and “environmental tax revenues” are identical (with the exception for the years where there are not any available data), which demonstrated the small investments and turnovers into the economy (one of the principles of a circular economy), illustrating the theoretical basis regarding the circular economy [
38,
40,
41]. This fact is demonstrated by the small values of the indicators in the “investment in equipment and plants for pollution control” index. The values for this index are missing for a few years for the Czech Republic (2011, 2013 and 2020). It could indicate the lack of political and institutional will, as well as, the measures and initiatives in the field of environmental policy [
2,
4,
9]. This particularity is common for all investigated MS. Another important characteristic is the lack of available data for the production of environmental goods and services sector for all investigated MS: for Hungary and Slovakia for the whole period of investigation (2011–2020), for the rest of the MS for the first two years (2011–2012) and the last year (2020), and also for some analyzed MS for the first three years (2011–2013)—the Czech Republic, Poland and Romania—or the last two years (2019–2020)—the Czech Republic, Poland and Romania. It is a clear indicator and predictor of a lack of interest of political policy makers for national measures and initiatives to support the production of environmental goods and services for the environmental policy’s implementation, in accordance with the legislative frame presented in EU documents [
20,
21]. The efficiency percentages calculated by the Excel Quick Analysis instrument for each MS indicate low values for all MS, even though Romania has the biggest values of this indicator and predictor (14.55% in 2018), followed by Poland (13.96% in 2018), in comparison with the other analyzed MS, which reached maximum values between 11 and 12%. It could be stated that from the economic point of view, only Romania has the minimum conditions for the GD’s implementation, but it needs strong supportive political and institutional measures and initiatives. The efficiency percentages have certain limits which indicate the possibility of positive predictions, as the World Economic Forum’s reports indicated [
61]. All the investigated MS are developing countries, and the limit for these positive predictions is 17%, which has to be reached, at least, for five years consecutively (according to the macroeconomic theory). None of the analyzed MS reached that limit for the investigated period or, at least, for one year. An efficiency percentage of 17% could predict the GD’s successful implementation, and this is the reason for which a prediction or a simulation of evolution was not necessary, because the data analysis provided the prospective on the evolution of the GD’s implementation [
64].
The third key element, infrastructure, provided the framework of logistics for the GD’s implementation. Overall, the situation presented in
Table 14,
Table 15,
Table 16,
Table 17 and
Table 18 indicates a constant and substantial increasing tendency for each indicator. The energy efficiency indicator illustrates that Poland implemented specific measures, reaching the value of 104.6 in 2018. The Czech Republic and Romania are in next place for energy efficiency with values around 40% and 30%, respectively, followed by the other MS with values around 20%. For renewable energy resources, Hungary is best situated (28,969 in 2015), the other MS obtained values between 10,000–20,000. For energy productivity, all MS have values below the European average (7169 in 2011, increasing constantly to 8505 in 2020), which demonstrated the weak investments in the infrastructure that has to support the preparation for the GD’s implementation [
20,
21].
From the combination of all three key elements and indexes, it could be stated that the prognosis for the GD’s implementation for each investigated MS is negative, depending on concrete measures and initiatives adopted at a national level [
64]. The capacity building potential is also negative. The fluctuation of values of variables for each MS indicated the lack of substantial institutional efforts and continuity for the implementation of European policies which will frame the context for the GD’s implementation. Almost all indexes for all MS (with the exception of Poland for energy efficiency and total fully converted and under conversion to organic farming indexes) have values under the European average scores, which means insufficient capacities for the GD’s implementation at the present moment, emphasizing the impossibility of achieving the targets of the GD [
5,
7]. In addition, none of the analyzed MS reached the mark of 17% efficiency in order to simulate a prospective implementation of the GD [
63,
64,
65]. The economic perspective for Romania, based on the second key element of present analysis, and for Poland, based on logistical evaluation, from the third key element, indicate slightly positive prospects, but only with the substantial support of logistics and economic factors in order to diminish the gap between national characteristics and the European average [
58,
61,
63,
64].
The answer to the first research question indicates the main factors that could predict the capacity building for the GD’s implementation in MS from central Europe, which are: (a) cultural (including mentalities, habits, conduits, education); (b) political, including will and decisions for capacity building that support the GD’s implementation; (c) economic (the indexes that we analyzed, for example: investments in equipment and plants for pollution control, environmental tax revenues, efficiency percentages, renewable energy resources, the total production of environmental goods and services, energy efficiency, etc.); and (d) social (impact and generated effects on the population). Social sustainability is the goal of sustainable policies’ implementation, with a good economic sustainability (with businesses that grow), conditioned by ecological sustainability (the limits that we have to respect with regard to our actions) [
55]. These analyzed indexes create a general framework for the GD’s implementation because it presents an integrated vision of all European policies involved and represents the central elements for the evaluation of the GD’s implementation. The variation of the values for these indexes for all investigated MS is the constant characteristic, which does not favor a good prediction regarding the GD’s implementation capacity. Unfortunately, at this moment, based on the data analysis of 15 indexes for a ten year period, none of the investigated MS have a sufficient capacity for the GD’s implementation, despite the political will of policy makers. Concrete national GD plans should follow and some solutions for reducing the economic and infrastructure gaps between the central European region and the western and Nordic MS will create new opportunities and will generate suitable solutions. Furthermore, a differentiation of the GD into three stages will be more suitable: (1) the first circle—industrialized MS from the west and north of the EU: Germany, France, Holland, Belgium, Luxembourg, Austria, Denmark, Sweden and Finland; (2) the second circle: Spain, Italy, Portugal, Greece, Cyprus, Malta, Ireland, Estonia, Latvia and Lithuania; and (3) the third circle: Poland, the Czech Republic, Slovakia, Hungary, Slovenia, Croatia, Romania and Bulgaria. The economic discrepancies and the social impact of the GD’s implementation influences the capacity building for the MS from the third stage.
For the second research question, the answer illustrates the necessity for the elaboration of a national plan for the GD’s implementation and a regional plan for its implementation (central Europe). A national strategy should be adopted for the GD’s implementation and it could be supported also with recovery and resilience funds. The narrative of the GD in analyzed MS belongs more to NGOs and epistemic communities than to national policy makers. Intergovernmental groups composed of all interested stake-holders and with clearly stated responsibilities for the GD’s implementation could be created for each MS. Sharing models of good practice could improve the future evolution for the analyzed MS. The epistemic communities have a crucial role for creating public awareness and then generating the specific measures for political policy makers. It is compulsory that the economic factors and infrastructure be supported by concrete measures, using the instruments of the environmental policy mentioned before. At this stage, the prognosis for the GD’s implementation in all investigated MS is negative. The regional cooperation could provide suitable solutions from reducing disparities and it could be favored by epistemic regional groups, market structures and political levels.
6. Conclusions
The present research aimed to predict the GD’s implementation capacity for central Europe’s MS: Poland, Hungary, Slovakia, the Czech Republic, and Romania. The investigated period was 2011–2020, a ten-year period, useful for the predictability of the GD’s implementation capacity. The sustainable policy was the reference point for the GD’s implementation capacity.
The research was empirical and explanatory in nature and used fifteen indexes for data analysis, chosen on the basis of their significance for the European policies circumscribed to the GD: the Climate Policy, the Energy Policy, the Industrial Policy, the Transport Policy, the Common Agriculture Policy, the Environmental Policy, and the Common Foreign and Security Policy. The analyzed data were from the Eurostat database.
The present research offers important answers that could be used by future researches in this field to deepen the study for each investigated MS and continue the investigation for the next period. For the MS from central Europe, it is important to start the regional cooperation to find better and more suitable solutions that could work in the various fields of the GD [
61,
62,
63,
64,
65]. In the international context, strategic autonomy is necessary for the MS from the EU, especially for the central and eastern parts, and the alternative energies will concentrate the technological innovation. The area of the present research could be expanded to other MS, for example, south-eastern, southern or Baltic EU states. Furthermore, some other indexes could be selected to deepen the analysis for each European policy circumscribed to the GD. A regional plan for the GD’s implementation and capacity building is an interesting topic for continuing the present research.
The regional cooperation could be the key for the development of capacity building for the GD’s implementation in the central European region and it could be used in the future as an important evaluation criterion for the GD’s efficiency.
Nonetheless, the GD remains one of the best strategies elaborated for a sustainable approach to the development policy, a unique perspective of our common future. However, the economic realities and the social impact of its application have to be taken into consideration. Improvements are necessary and more studies of epistemic communities from central Europe signal the need for a differentiated approach. It is also very important that the epistemic community provide more analyses of this type, to improve our actions toward our better future. The policies circumscribed to the GD support a complex and sustainable implementation [
63,
64,
66,
67,
68]. There are several instruments of sustainable policy that policy makers could use: regulations, financial incentives, information, performance requirements and tradable permits [
63]. These sustainable measures should be integrated into business models and in future development, becoming models of the best practices for communities that are served [
63,
64,
66,
67,
68,
69,
70].


